Multipose Binding in Molecular Docking

 and
and
Abstract
:
1. Introduction
2. Results and Discussion
2.1. Computational Analysis of Complexes Shown to Exhibit Multipose Binding
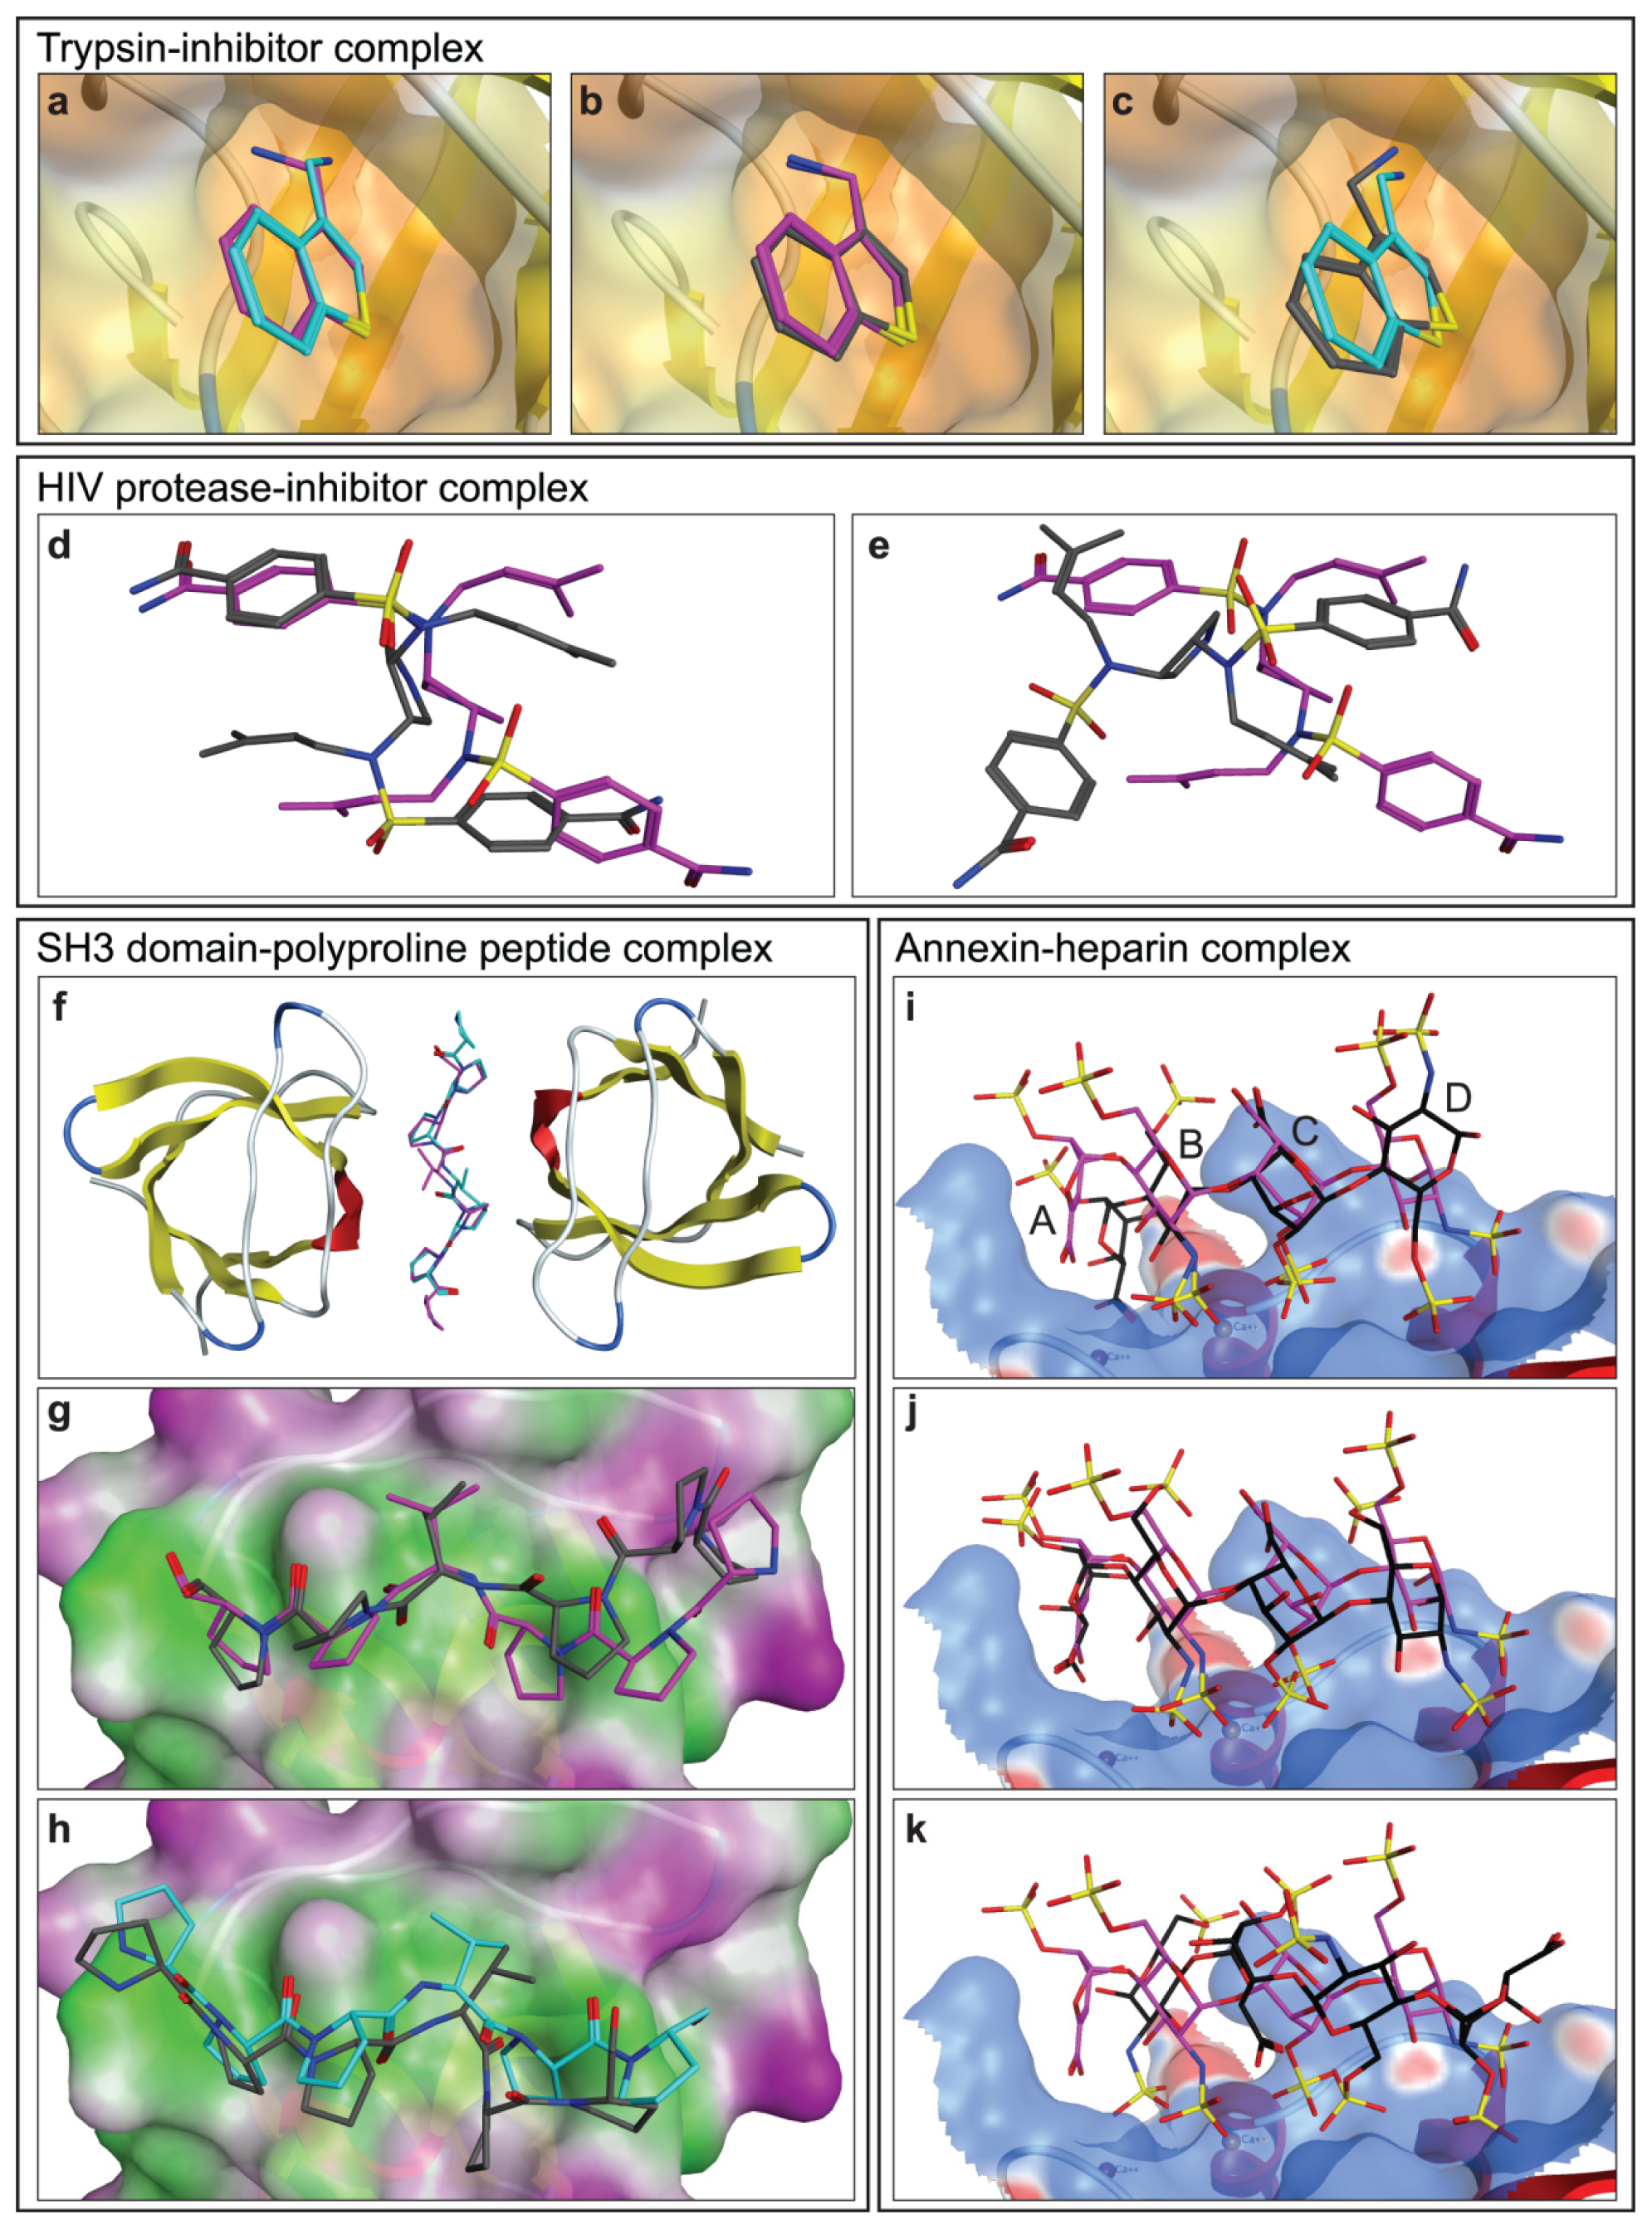
2.1.1. Trypsin-Inhibitor Complex
2.1.2. HIV Protease-Inhibitor Complex
2.1.3. SH3 Domain-Polyproline Peptide Complex
2.1.4. Annexin A2-Heparin Complex
2.2. High-Throughput Docking
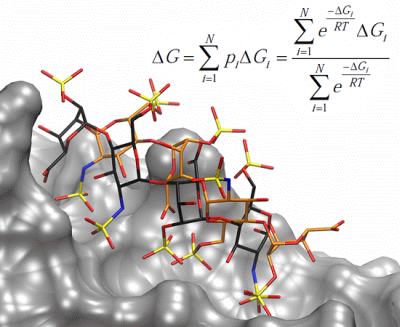
2.3. Implementation of the Multipose Binding Concept in Binding Affinity Prediction
2.3.1. Refined-eHiTS
2.3.2. Core-eHiTS and CASR-eHiTS
2.3.3. Refined-AutoDock and Core-AutoDock
2.4. Relation of the Physicochemical Properties of the Complex to the Observed Effect of Multipose Binding
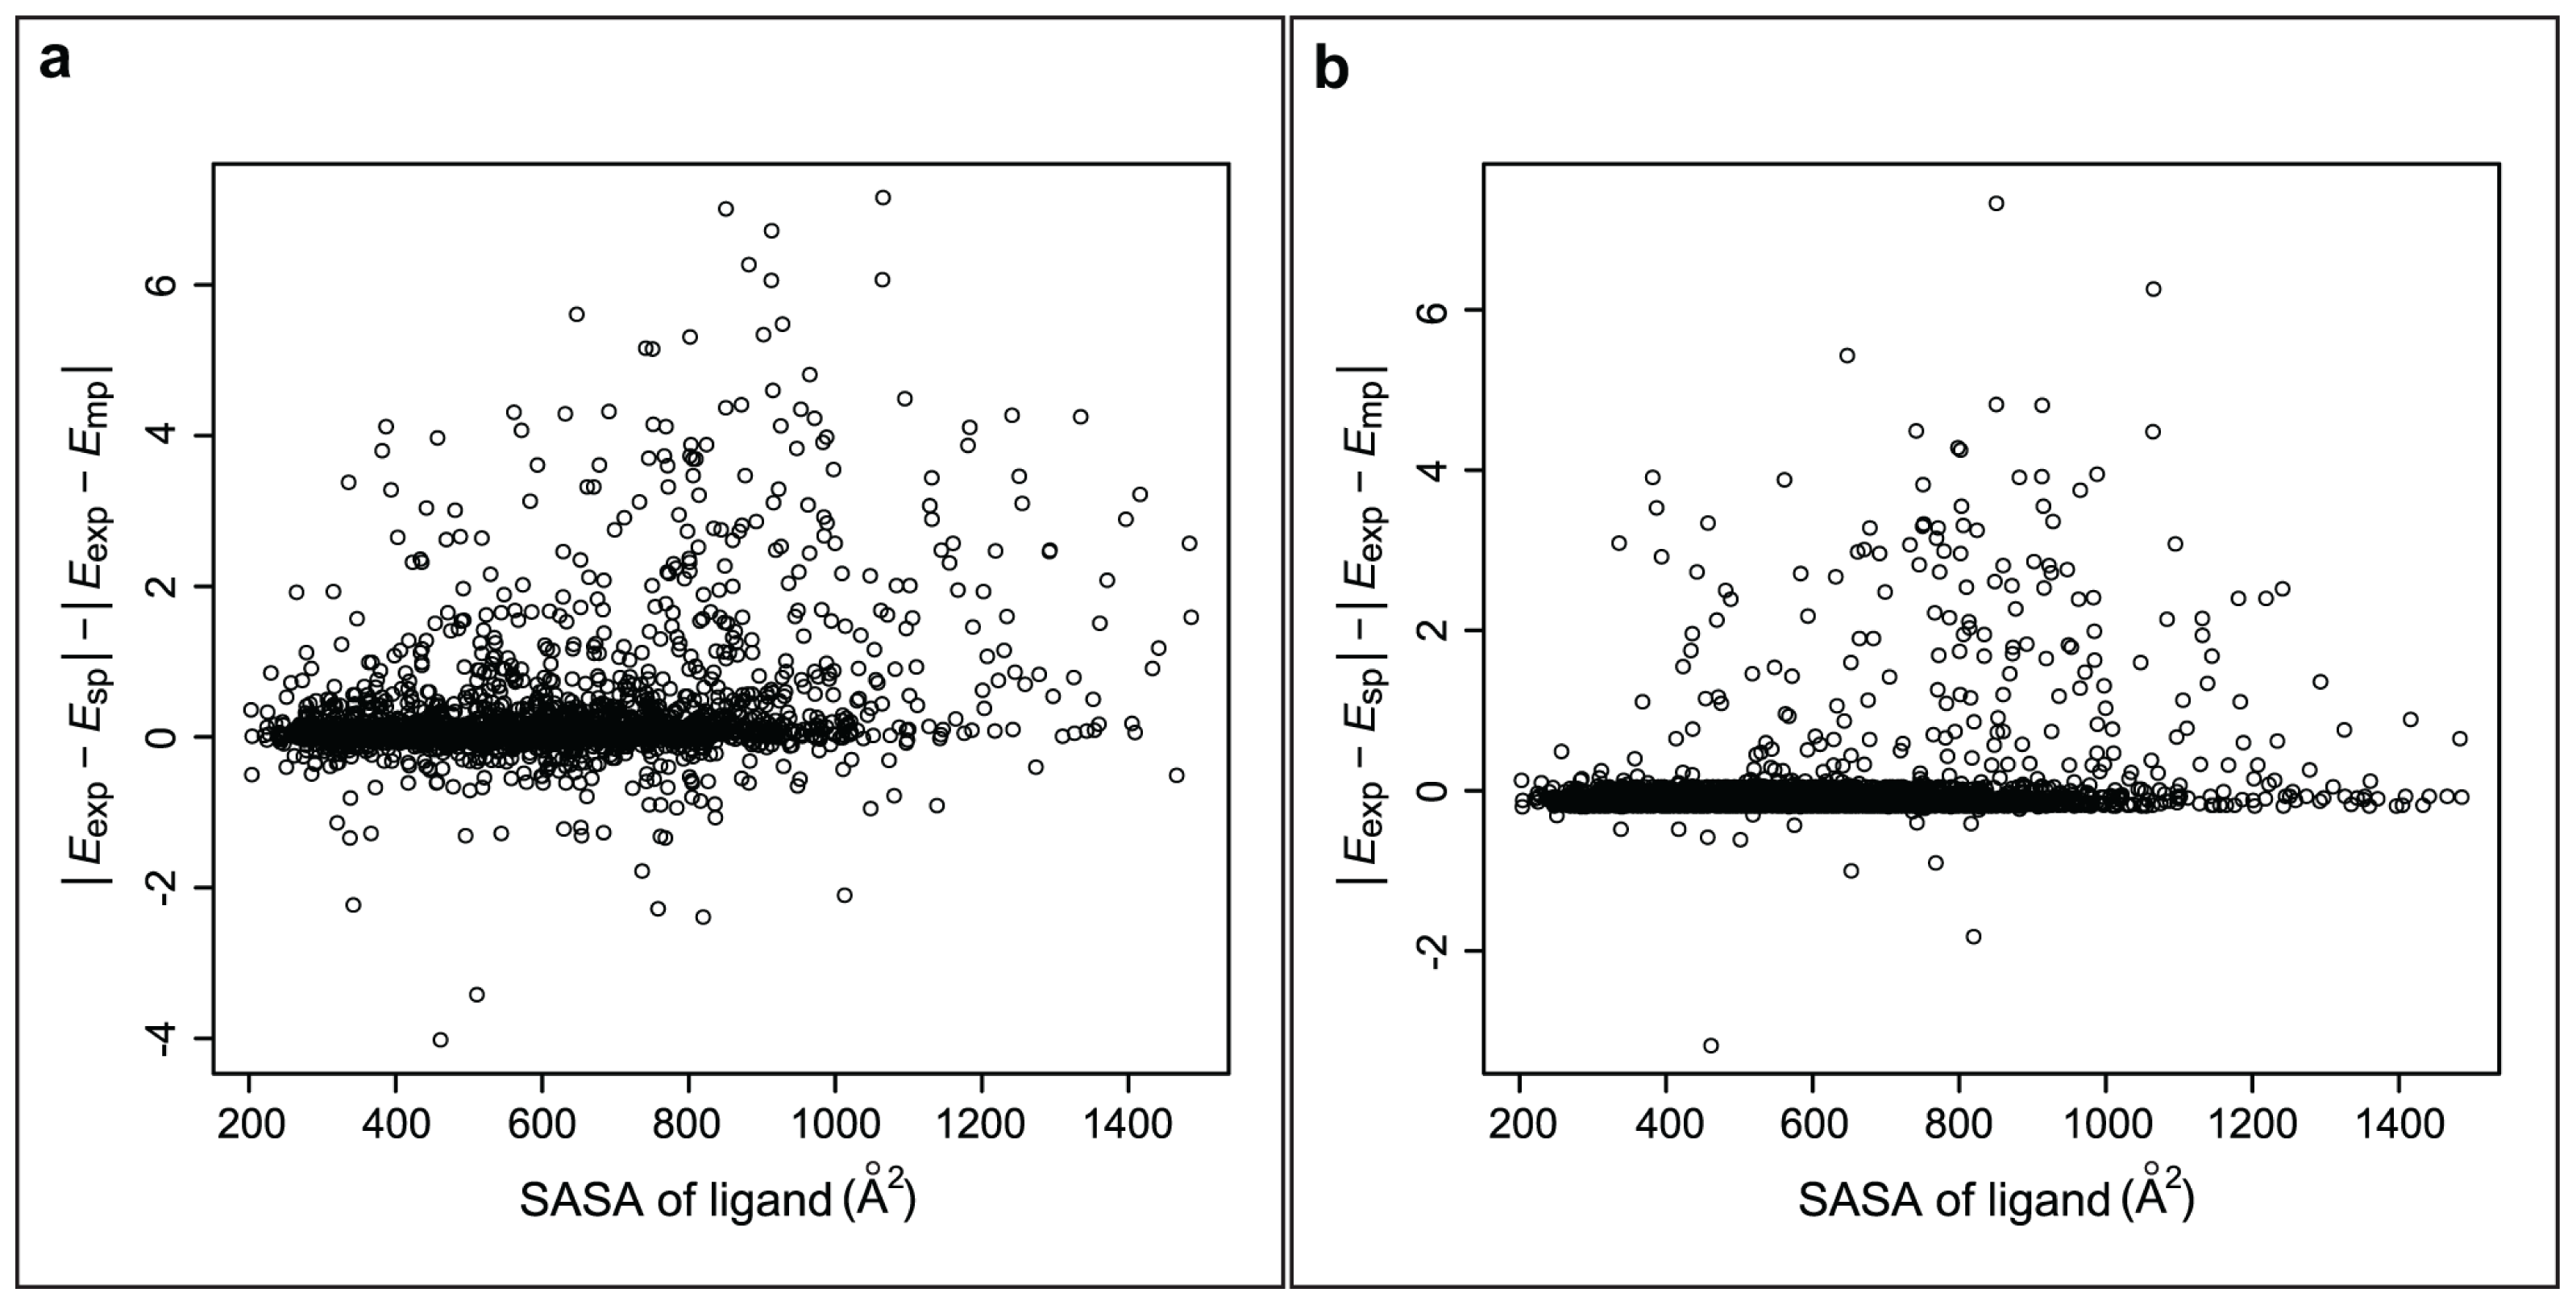
2.4.1. Ligand Size
2.4.2. Ligand Flexibility
2.4.3. Binding Affinity
2.4.4. Polar Properties
2.4.5. Ligand Charge and Number of Five- and Six-Membered Rings in the Ligand
2.4.6. PCA Analysis
3. Methods
3.1. Computational Analysis of Complexes Shown to Exhibit Multipose Binding
3.1.1. Analyzed Structures
3.1.2. AutoDock
3.1.3. MOE Docking
3.1.4. MD Simulations
3.2. High-Throughput Docking
3.2.1. Datasets
3.2.2. Docking
3.3. Implementation of the Multipose Binding Concept in Binding Affinity Prediction
3.3.1. Strategy for Pose Selection in Different Multipose Cases
3.3.2. Statistical Analysis
3.4. Relation of the Physicochemical Properties of the Complex to the Observed Effect of Multipose Binding
3.4.1. Analyzed Properties
3.4.2. Statistical Analysis
4. Conclusions
Supplementary Information
ijms-15-02622-s001.pdfAcknowledgments
Conflicts of Interest
- Author ContributionsK.A. obtained and analyzed the data and wrote the manuscript; S.A.S. analyzed the data and supervised the work; M.P. carried out statistical analysis; and M.T.P. supervised the work.
References
- Klebe, G. Recent developments in structure-based drug design. J. Mol. Med 2000, 78, 269–281. [Google Scholar]
- Moitessier, N.; Englebienne, P.; Lee, D.; Lawandi, J.; Corbeil, C.R. Towards the development of universal, fast and highly accurate docking/scoring methods: A long way to go. Br. J. Pharmacol 2008, 153, S7–S26. [Google Scholar]
- Cheng, T.; Li, Q.; Zhou, Z.; Wang, Y.; Bryant, S.H. Structure-based virtual screening for drug discovery: A problem-centric review. AAPS J 2012, 14, 133–141. [Google Scholar]
- Kitchen, D.B.; Decornez, H.; Furr, J.R.; Bajorath, J. Docking and scoring in virtual screening for drug discovery: Methods and applications. Nat. Rev. Drug Discov 2004, 3, 935–949. [Google Scholar]
- Huang, S.Y.; Grinter, S.Z.; Zou, X. Scoring functions and their evaluation methods for protein-ligand docking: Recent advances and future directions. Phys. Chem. Chem. Phys 2010, 12, 12899–12908. [Google Scholar]
- Brooijmans, N.; Kuntz, I.D. Molecular recognition and docking algorithms. Annu. Rev. Biophys. Biomol. Struct 2003, 32, 335–373. [Google Scholar]
- Ferrara, P.; Gohlke, H.; Price, D.J.; Klebe, G.; Brooks, C.L., III. Assessing scoring functions for protein-ligand interactions. J. Med. Chem 2004, 47, 3032–3047. [Google Scholar]
- Mohan, V.; Gibbs, A.C.; Cummings, M.D.; Jaeger, E.P.; DesJarlais, R.L. Docking: Successes and challenges. Curr. Pharm. Des 2005, 11, 323–333. [Google Scholar]
- Sousa, S.F.; Fernandes, P.A.; Ramos, M.J. Protein-ligand docking: Current status and future challenges. Proteins 2006, 65, 15–26. [Google Scholar]
- Yuriev, E.; Agostino, M.; Ramsland, P.A. Challenges and advances in computational docking: 2009 in review. J. Mol. Recognit 2011, 24, 149–164. [Google Scholar]
- Ghosh, S.; Nie, A.; An, J.; Huang, Z. Structure-based virtual screening of chemical libraries for drug discovery. Curr. Opin. Chem. Biol 2006, 10, 194–202. [Google Scholar]
- Meng, X.Y.; Zhang, H.X.; Mezei, M.; Cui, M. Molecular docking: A powerful approach for structure-based drug discovery. Curr. Comput. Aided Drug Des 2011, 7, 146–157. [Google Scholar]
- Stark, J.L.; Powers, R. Application of NMR and molecular docking in structure-based drug discovery. Top. Curr. Chem 2012, 326, 1–34. [Google Scholar]
- Warren, G.L.; Andrews, C.W.; Capelli, A.M.; Clarke, B.; LaLonde, J.; Lambert, M.H.; Lindvall, M.; Nevins, N.; Semus, S.F.; Senger, S.; et al. A critical assessment of docking programs and scoring functions. J. Med. Chem 2006, 49, 5912–5931. [Google Scholar]
- Kim, R.; Skolnick, J. Assessment of programs for ligand binding affinity prediction. J. Comput. Chem 2008, 29, 1316–1331. [Google Scholar]
- Plewczynski, D.; Lazniewski, M.; Augustyniak, R.; Ginalski, K. Can we trust docking results? Evaluation of seven commonly used programs on PDBbind database. J. Comput. Chem 2011, 32, 742–755. [Google Scholar]
- Smith, R.D.; Dunbar, J.B., Jr.; Ung, P.M.; Esposito, E.X.; Yang, C.Y.; Wang, S.; Carlson, H.A. CSAR benchmark exercise of 2010: Combined evaluation across all submitted scoring functions. J. Chem. Inf. Model 2011, 51, 2115–2131. [Google Scholar]
- Kulp, J.L., III; Blumenthal, S.N.; Wang, Q.; Bryan, R.L.; Guarnieri, F. A fragment-based approach to the SAMPL3 challenge. J. Comput. Aided Mol. Des 2012, 26, 583–594. [Google Scholar]
- Blum, A.; Bottcher, J.; Dorr, S.; Heine, A.; Klebe, G.; Diederich, W.E. Two solutions for the same problem: Multiple binding modes of pyrrolidine-based HIV-1 protease inhibitors. J. Mol. Biol 2011, 410, 745–755. [Google Scholar]
- Gushchina, L.V.; Gabdulkhakov, A.G.; Nikonov, S.V.; Filimonov, V.V. High-resolution crystal structure of spectrin SH3 domain fused with a proline-rich peptide. J. Biomol. Struct. Dyn 2011, 29, 485–495. [Google Scholar]
- Hritz, J.; Oostenbrink, C. Efficient free energy calculations for compounds with multiple stable conformations separated by high energy barriers. J. Phys. Chem 2009, 113, 12711–12720. [Google Scholar]
- Stjernschantz, E.; Oostenbrink, C. Improved ligand-protein binding affinity predictions using multiple binding modes. Biophys. J 2010, 98, 2682–2691. [Google Scholar]
- Pichert, A.; Samsonov, S.A.; Theisgen, S.; Thomas, L.; Baumann, L.; Schiller, J.; Beck-Sickinger, A.G.; Huster, D.; Pisabarro, M.T. Characterization of the interaction of interleukin-8 with hyaluronan, chondroitin sulfate, dermatan sulfate and their sulfated derivatives by spectroscopy and molecular modeling. Glycobiology 2012, 22, 134–145. [Google Scholar]
- Forster, M.; Mulloy, B. Computational approaches to the identification of heparin-binding sites on the surfaces of proteins. Biochem. Soc. Trans 2006, 34, 431–434. [Google Scholar]
- Pisabarro, M.T.; Ortiz, A.R.; Viguera, A.R.; Gago, F.; Serrano, L. Molecular modeling of the interaction of polyproline-based peptides with the Abl-SH3 domain: Rational modification of the interaction. Protein Eng. Des. Sel 1994, 7, 1455–1462. [Google Scholar]
- Lim, W.A.; Richards, F.M.; Fox, R.O. Structural determinants of peptide-binding orientation and of sequence specificity in SH3 domains. Nature 1994, 372, 375–379. [Google Scholar]
- Gmeiner, W.H.; Horita, D.A. Implications of SH3 domain structure and dynamics for protein regulation and drug design. Cell Biochem. Biophys 2001, 35, 127–140. [Google Scholar]
- Mayer, B.J. SH3 domains: Complexity in moderation. J. Cell Sci 2001, 114, 1253–1263. [Google Scholar]
- Saksela, K.; Permi, P. SH3 domain ligand binding: What’s the consensus and where’s the specificity? FEBS Lett 2012, 586, 2609–2614. [Google Scholar]
- Aitio, O.; Hellman, M.; Kesti, T.; Kleino, I.; Samuilova, O.; Paakkonen, K.; Tossavainen, H.; Saksela, K.; Permi, P. Structural basis of PxxDY motif recognition in SH3 binding. J. Mol. Biol 2008, 382, 167–178. [Google Scholar]
- Padron, J.A.; Carrasco, R.; Pellon, R.F. Molecular descriptor based on a molar refractivity partition using Randic-type graph-theoretical invariant. J. Pharm. Pharm. Sci 2002, 5, 258–266. [Google Scholar]
- Olsson, T.S.; Williams, M.A.; Pitt, W.R.; Ladbury, J.E. The thermodynamics of protein-ligand interaction and solvation: Insights for ligand design. J. Mol. Biol 2008, 384, 1002–1017. [Google Scholar]
- Kellogg, G.E.; Abraham, D.J. Hydrophobicity: Is log P (o/w) more than the sum of its parts? Eur. J. Med. Chem 2000, 35, 651–661. [Google Scholar]
- Cozzini, P.; Fornabaio, M.; Marabotti, A.; Abraham, D.J.; Kellogg, G.E.; Mozzarelli, A. Simple, intuitive calculations of free energy of binding for protein-ligand complexes. 1. Models without explicit constrained water. J. Med. Chem 2002, 45, 2469–2483. [Google Scholar]
- Newman, J.; Dolezal, O.; Fazio, V.; Caradoc-Davies, T.; Peat, T.S. The DINGO dataset: A comprehensive set of data for the SAMPL challenge. J. Comput. Aided Mol. Des 2012, 26, 497–503. [Google Scholar]
- Morris, G.M.; Huey, R.; Lindstrom, W.; Sanner, M.F.; Belew, R.K.; Goodsell, D.S.; Olson, A.J. AutoDock4 and AutoDockTools4: Automated docking with selective receptor flexibility. J. Comput. Chem 2009, 30, 2785–2791. [Google Scholar]
- Takaoka, T.; Mori, K.; Okimoto, N.; Neya, S.; Hoshino, T. Prediction of the structure of complexes comprised of proteins and glycosaminoglycans using docking simulation and cluster analysis. J. Chem. Theory Comput 2007, 3, 2347–2356. [Google Scholar]
- Molecular Operating Environment (MOE), version 2011.10; Chemical Computing Group Inc: Montreal, QC, Canada, 2011.
- Case, D.A.; Darden, T.A.; Cheatham, T.A., III; Simmerling, C.L.; Wang, J.; Duke, R.E.; Luo, R.; Walker, R.C.; Zhang, W.; Merz, K.M.; et al. AMBER 11; University of California: San Francisco, CA, USA, 2010. [Google Scholar]
- Cheng, T.; Li, X.; Li, Y.; Liu, Z.; Wang, R. Comparative assessment of scoring functions on a diverse test set. J. Chem. Inf. Model 2009, 49, 1079–1093. [Google Scholar]
- Ashtawy, H.M.; Mahapatra, N.R. A comparative assessment of ranking accuracies of conventional and machine-learning-based scoring functions for protein-ligand binding affinity prediction. IEEE/ACM Trans. Comput. Biol. Bioinforma 2012, 9, 1301–1313. [Google Scholar]
- Ravitz, O.; Zsoldos, Z.; Simon, A. Improving molecular docking through eHiTS’ tunable scoring function. J. Comput. Aided Mol. Des 2011, 25, 1033–1051. [Google Scholar]
- Schneider, N.; Lange, G.; Hindle, S.; Klein, R.; Rarey, M. A consistent description of hydrogen bond and dehydration energies in protein-ligand complexes: Methods behind the HYDE scoring function. J. Comput. Aided Mol. Des 2012, 27, 15–29. [Google Scholar]
- Greenidge, P.A.; Kramer, C.; Mozziconacci, J.C.; Wolf, R.M. MM/GBSA binding energy prediction on the PDBbind data set: Successes, failures, and directions for further improvement. J. Chem. Inf. Model 2012, 53, 201–209. [Google Scholar]
- Kramer, C.; Gedeck, P. Global free energy scoring functions based on distance-dependent atom-type pair descriptors. J. Chem. Inf. Model 2011, 51, 707–720. [Google Scholar]
- Hsieh, J.H.; Yin, S.; Liu, S.; Sedykh, A.; Dokholyan, N.V.; Tropsha, A. Combined application of cheminformatics- and physical force field-based scoring functions improves binding affinity prediction for CSAR data sets. J. Chem. Inf. Model 2011, 51, 2027–2035. [Google Scholar]
- Li, L.; Wang, B.; Meroueh, S.O. Support vector regression scoring of receptor-ligand complexes for rank-ordering and virtual screening of chemical libraries. J. Chem. Inf. Model 2011, 51, 2132–2138. [Google Scholar]
- Kramer, C.; Gedeck, P. Three descriptor model sets a high standard for the CSAR-NRC HiQ benchmark. J. Chem. Inf. Model 2011, 51, 2139–2145. [Google Scholar]
- Dunbar, J.B., Jr.; Smith, R.D.; Yang, C.Y.; Ung, P.M.; Lexa, K.W.; Khazanov, N.A.; Stuckey, J.A.; Wang, S.; Carlson, H.A. CSAR benchmark exercise of 2010: Selection of the protein-ligand complexes. J. Chem. Inf. Model 2011, 51, 2036–2046. [Google Scholar]
- Sulea, T.; Cui, Q.; Purisima, E.O. Solvated interaction energy (SIE) for scoring protein-ligand binding affinities. 2. Benchmark in the CSAR-2010 scoring exercise. J. Chem. Inf. Model 2011, 51, 2066–2081. [Google Scholar]
- Wang, R.; Fang, X.; Lu, Y.; Wang, S. The PDBbind database: Collection of binding affinities for protein-ligand complexes with known three-dimensional structures. J. Med. Chem 2004, 47, 2977–2980. [Google Scholar]
- Wang, R.; Fang, X.; Lu, Y.; Yang, C.Y.; Wang, S. The PDBbind database: Methodologies and updates. J. Med. Chem 2005, 48, 4111–4119. [Google Scholar]
- Zsoldos, Z.; Reid, D.; Simon, A.; Sadjad, B.S.; Johnson, A.P. eHiTS: An innovative approach to the docking and scoring function problems. Curr. Protein Pept. Sci 2006, 7, 421–435. [Google Scholar]
- Zsoldos, Z.; Reid, D.; Simon, A.; Sadjad, S.B.; Johnson, A.P. eHiTS: A new fast, exhaustive flexible ligand docking system. J. Mol. Graph. Model 2007, 26, 198–212. [Google Scholar]
- R Core Team, R: A Language and Environment for Statistical Computing; R Foundation for Statistical Computing: Vienna, Austria, 2012.
- Hubbard, S.J.; Thornton, J.M. NACCESS Computer Program; University College London: London, UK, 1993. [Google Scholar]
- O’Boyle, N.M.; Banck, M.; James, C.A.; Morley, C.; Vandermeersch, T.; Hutchison, G.R. Open babel: An open chemical toolbox. J. Cheminform 2011, 3, 1–14. [Google Scholar]
- The Open Babel Package, version 2.3.1. Available online: http://openbabel.org (accessed on 23 February 2012).
- Thepaut, M.; Guzzi, C.; Sutkeviciute, I.; Sattin, S.; Ribeiro-Viana, R.; Varga, N.; Chabrol, E.; Rojo, J.; Bernardi, A.; Angulo, J.; et al. Structure of a glycomimetic ligand in the carbohydrate recognition domain of C-type lectin DC-SIGN. Structural requirements for selectivity and ligand design. J. Am. Chem. Soc 2013, 135, 2518–2529. [Google Scholar]


| Dataset | eHiTS | AutoDock |
|---|---|---|
| PDBbind Refined (2455 complexes) | 2428 (99%) | 2070 (84%) |
| PDBbind Core (216 complexes) | 214 (99%) | 197 (91%) |
| CSAR-NRC (343 complexes) | 340 (99%) | 225 (65%) |
| Dataset/Program | Best pose | Top score | Ntop = best (a), % |
|---|---|---|---|
| Refined/eHiTS | 0.47 | 0.54 | 5.8 |
| Core/eHiTS | 0.46 | 0.51 | 8.4 |
| CSAR/eHiTS | 0.58 | 0.61 | 5.3 |
| Refined/AutoDock | 0.07 | 0.11 | 15.7 |
| Core/AutoDock | 0.14 | 0.18 | 15.2 |
| CSAR/AutoDock | 0.10 | 0.09 | 18.7 |
| Refined/eHiTS (2428 complexes) | |||||
|---|---|---|---|---|---|
| Number of poses | r (a) | ρ (b) | p-value (c) | ∑(ressp/mp)2 (d) | Count (e) |
| SINGLE-POSE | |||||
| 1 | 0.47 | 0.47 | NA | 16 651 | NA |
| BEST | |||||
| 2 | 0.57 | 0.56 | 2.76 × 10⁻¹⁶ | 11,810 | 2,117 |
| 3 | 0.57 | 0.56 | 1.42 × 10⁻¹⁴ | 12,083 | 2,066 |
| 4 | 0.56 | 0.55 | 2.66 × 10⁻¹³ | 12,287 | 2,023 |
| 5 | 0.56 | 0.55 | 1.46 × 10⁻¹² | 12,417 | 1,989 |
| 6 | 0.56 | 0.55 | 6.55 × 10⁻¹² | 12,535 | 1,966 |
| 7 | 0.56 | 0.55 | 1.93 × 10⁻¹¹ | 12,623 | 1,933 |
| 8 | 0.56 | 0.55 | 4.79 × 10⁻¹¹ | 12,698 | 1,910 |
| 9 | 0.56 | 0.55 | 1.07 × 10⁻¹⁰ | 12,766 | 1,878 |
| 10 | 0.55 | 0.54 | 2.22 × 10⁻¹⁰ | 12,829 | 1,858 |
| all better(f) | 0.53 | 0.52 | 1.06 × 10⁻⁵ | 13,929 | 1,603 |
| RANDOM | |||||
| 2 | 0.53 | 0.52 | 3.31 × 10⁻⁷ | 13,533 | 1,048 |
| 3 | 0.53 | 0.52 | 4.92 × 10⁻⁷ | 13,589 | 1,016 |
| 4 | 0.53 | 0.53 | 3.57 × 10⁻⁷ | 13,543 | 1,046 |
| 5 | 0.53 | 0.52 | 7.53 × 10⁻⁷ | 13,631 | 1,038 |
| 6 | 0.53 | 0.52 | 2.72 × 10⁻⁷ | 13,531 | 1,090 |
| 7 | 0.53 | 0.52 | 5.23 × 10⁻⁷ | 13,597 | 1,052 |
| 8 | 0.53 | 0.52 | 6.30 × 10⁻⁷ | 13,616 | 1,055 |
| 9 | 0.53 | 0.52 | 6.15 × 10⁻⁷ | 13,606 | 1,036 |
| 10 | 0.53 | 0.52 | 5.70 × 10⁻⁷ | 13,604 | 1,034 |
| TOP | |||||
| 2 | 0.54 | 0.53 | 7.33 × 10⁻¹⁵ | 12,055 | 1,784 |
| 3 | 0.54 | 0.53 | 4.17 × 10⁻¹³ | 12,349 | 1,625 |
| 4 | 0.54 | 0.53 | 7.51 × 10⁻¹² | 12,563 | 1,527 |
| 5 | 0.54 | 0.53 | 4.59 × 10⁻¹¹ | 12,711 | 1,441 |
| 6 | 0.54 | 0.53 | 2.25 × 10⁻¹⁰ | 12,845 | 1,376 |
| 7 | 0.54 | 0.53 | 7.80 × 10⁻¹⁰ | 12,955 | 1,312 |
| 8 | 0.54 | 0.53 | 2.13 × 10⁻⁹ | 13,046 | 1,263 |
| 9 | 0.54 | 0.53 | 5.47 × 10⁻⁹ | 13,134 | 1,214 |
| 10 | 0.53 | 0.52 | 1.23 × 10⁻⁸ | 13,212 | 1,158 |
| ALL | |||||
| all | 0.52 | 0.51 | 9.0 × 10⁻⁴ | 14,581 | 720 |
| “UPPER-LIMIT” SINGLE-POSE (g) | |||||
| 1 | 0.63 | 0.62 | NA | 11,115 | NA |
| Property | Refined/eHiTS/TOP-BEST | Refined/AutoDock/TOP-BEST | ||
|---|---|---|---|---|
| ρ | τ | ρ | τ | |
| Number of atoms | 0.21 | 0.14 | 0.36 | 0.25 |
| Molecular weight | 0.22 | 0.15 | 0.34 | 0.23 |
| Solvent accessible surface area | 0.23 | 0.15 | 0.37 | 0.25 |
| Molar refractivity | 0.21 | 0.14 | 0.36 | 0.24 |
| Flexible torsions | 0.22 | 0.15 | 0.33 | 0.23 |
| Binding affinity | 0.48 | 0.33 | 0.44 | 0.30 |
| Polar surface area | 0.14 | 0.09 | 0.12 | 0.08 |
| Log P | 0.15 | 0.10 | 0.24 | 0.16 |
| Number of rings | 0.02 | 0.02 | 0.21 | 0.15 |
| Charge | 0.00 | 0.00 | 0.11 | 0.08 |
© 2014 by the authors; licensee MDPI, Basel, Switzerland This article is an open access article distributed under the terms and conditions of the Creative Commons Attribution license (http://creativecommons.org/licenses/by/3.0/).
Share and Cite
Atkovska, K.; Samsonov, S.A.; Paszkowski-Rogacz, M.; Pisabarro, M.T. Multipose Binding in Molecular Docking. Int. J. Mol. Sci. 2014, 15, 2622-2645. https://doi.org/10.3390/ijms15022622
Atkovska K, Samsonov SA, Paszkowski-Rogacz M, Pisabarro MT. Multipose Binding in Molecular Docking. International Journal of Molecular Sciences. 2014; 15(2):2622-2645. https://doi.org/10.3390/ijms15022622
Chicago/Turabian StyleAtkovska, Kalina, Sergey A. Samsonov, Maciej Paszkowski-Rogacz, and M. Teresa Pisabarro. 2014. "Multipose Binding in Molecular Docking" International Journal of Molecular Sciences 15, no. 2: 2622-2645. https://doi.org/10.3390/ijms15022622