Structure of N-Terminal Sequence Asp-Ala-Glu-Phe-Arg-His-Asp-Ser of Aβ-Peptide with Phospholipase A2 from Venom of Andaman Cobra Sub-Species Naja naja sagittifera at 2.0 Å Resolution


Abstract
:
1. Introduction
2. Results
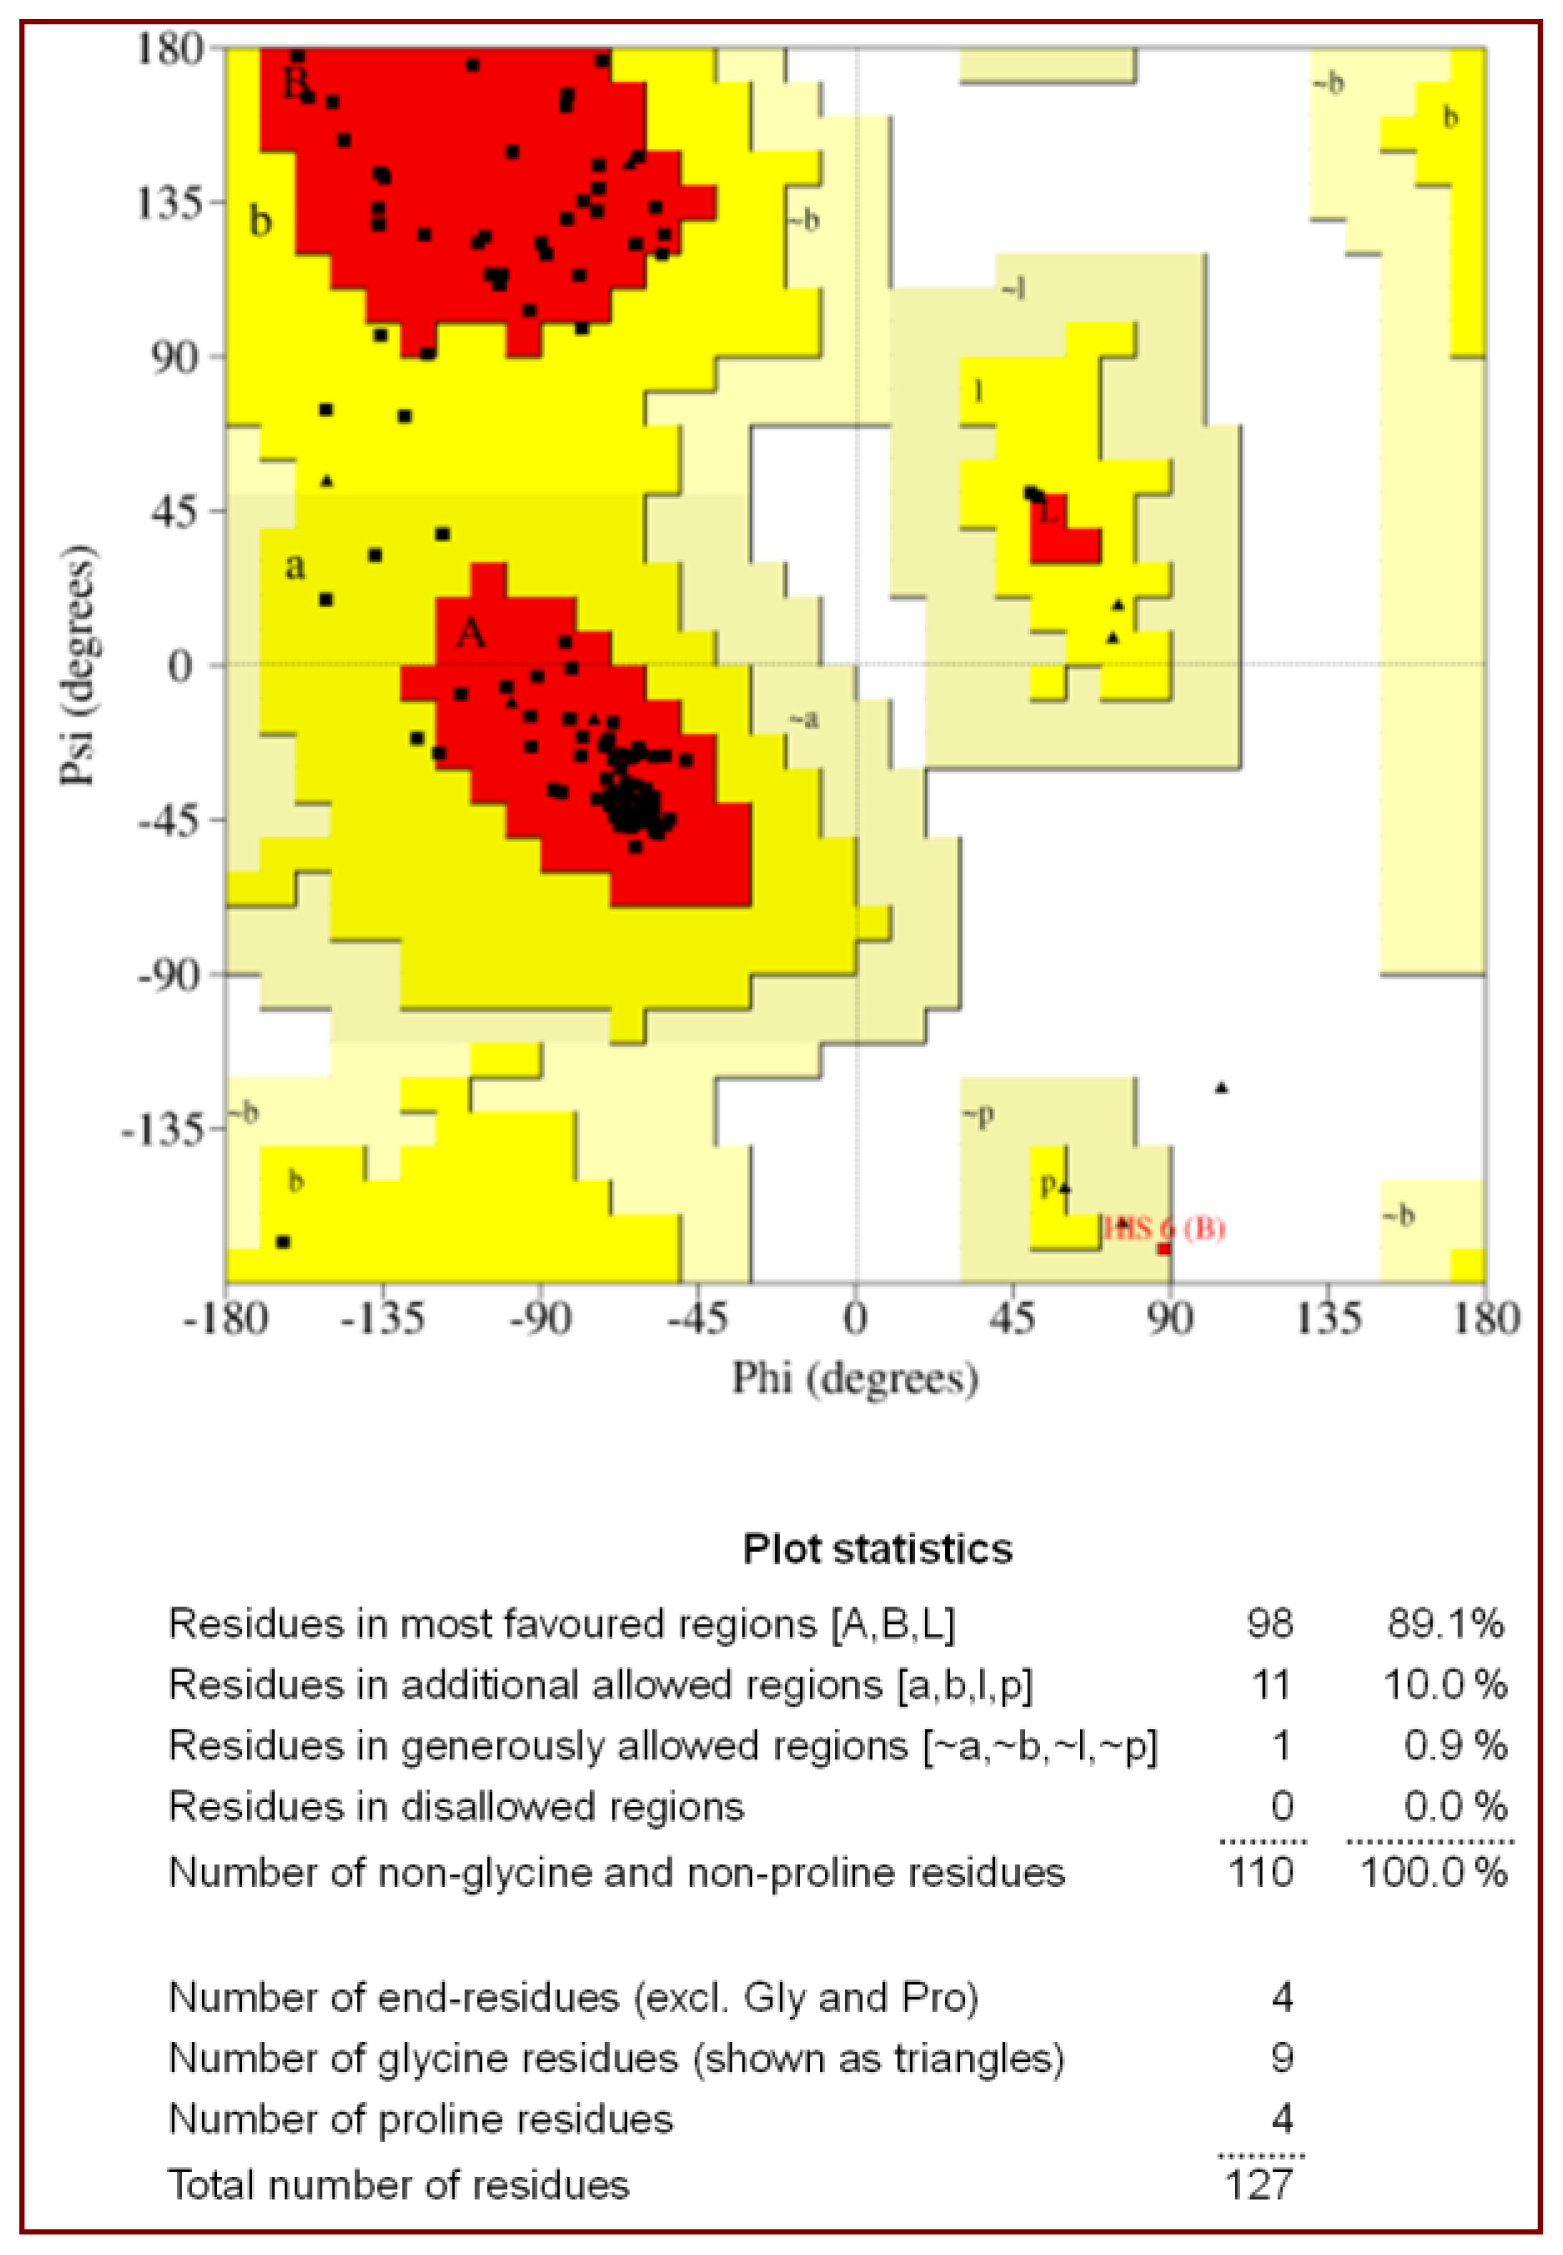
2.1. Quality of the Final Model
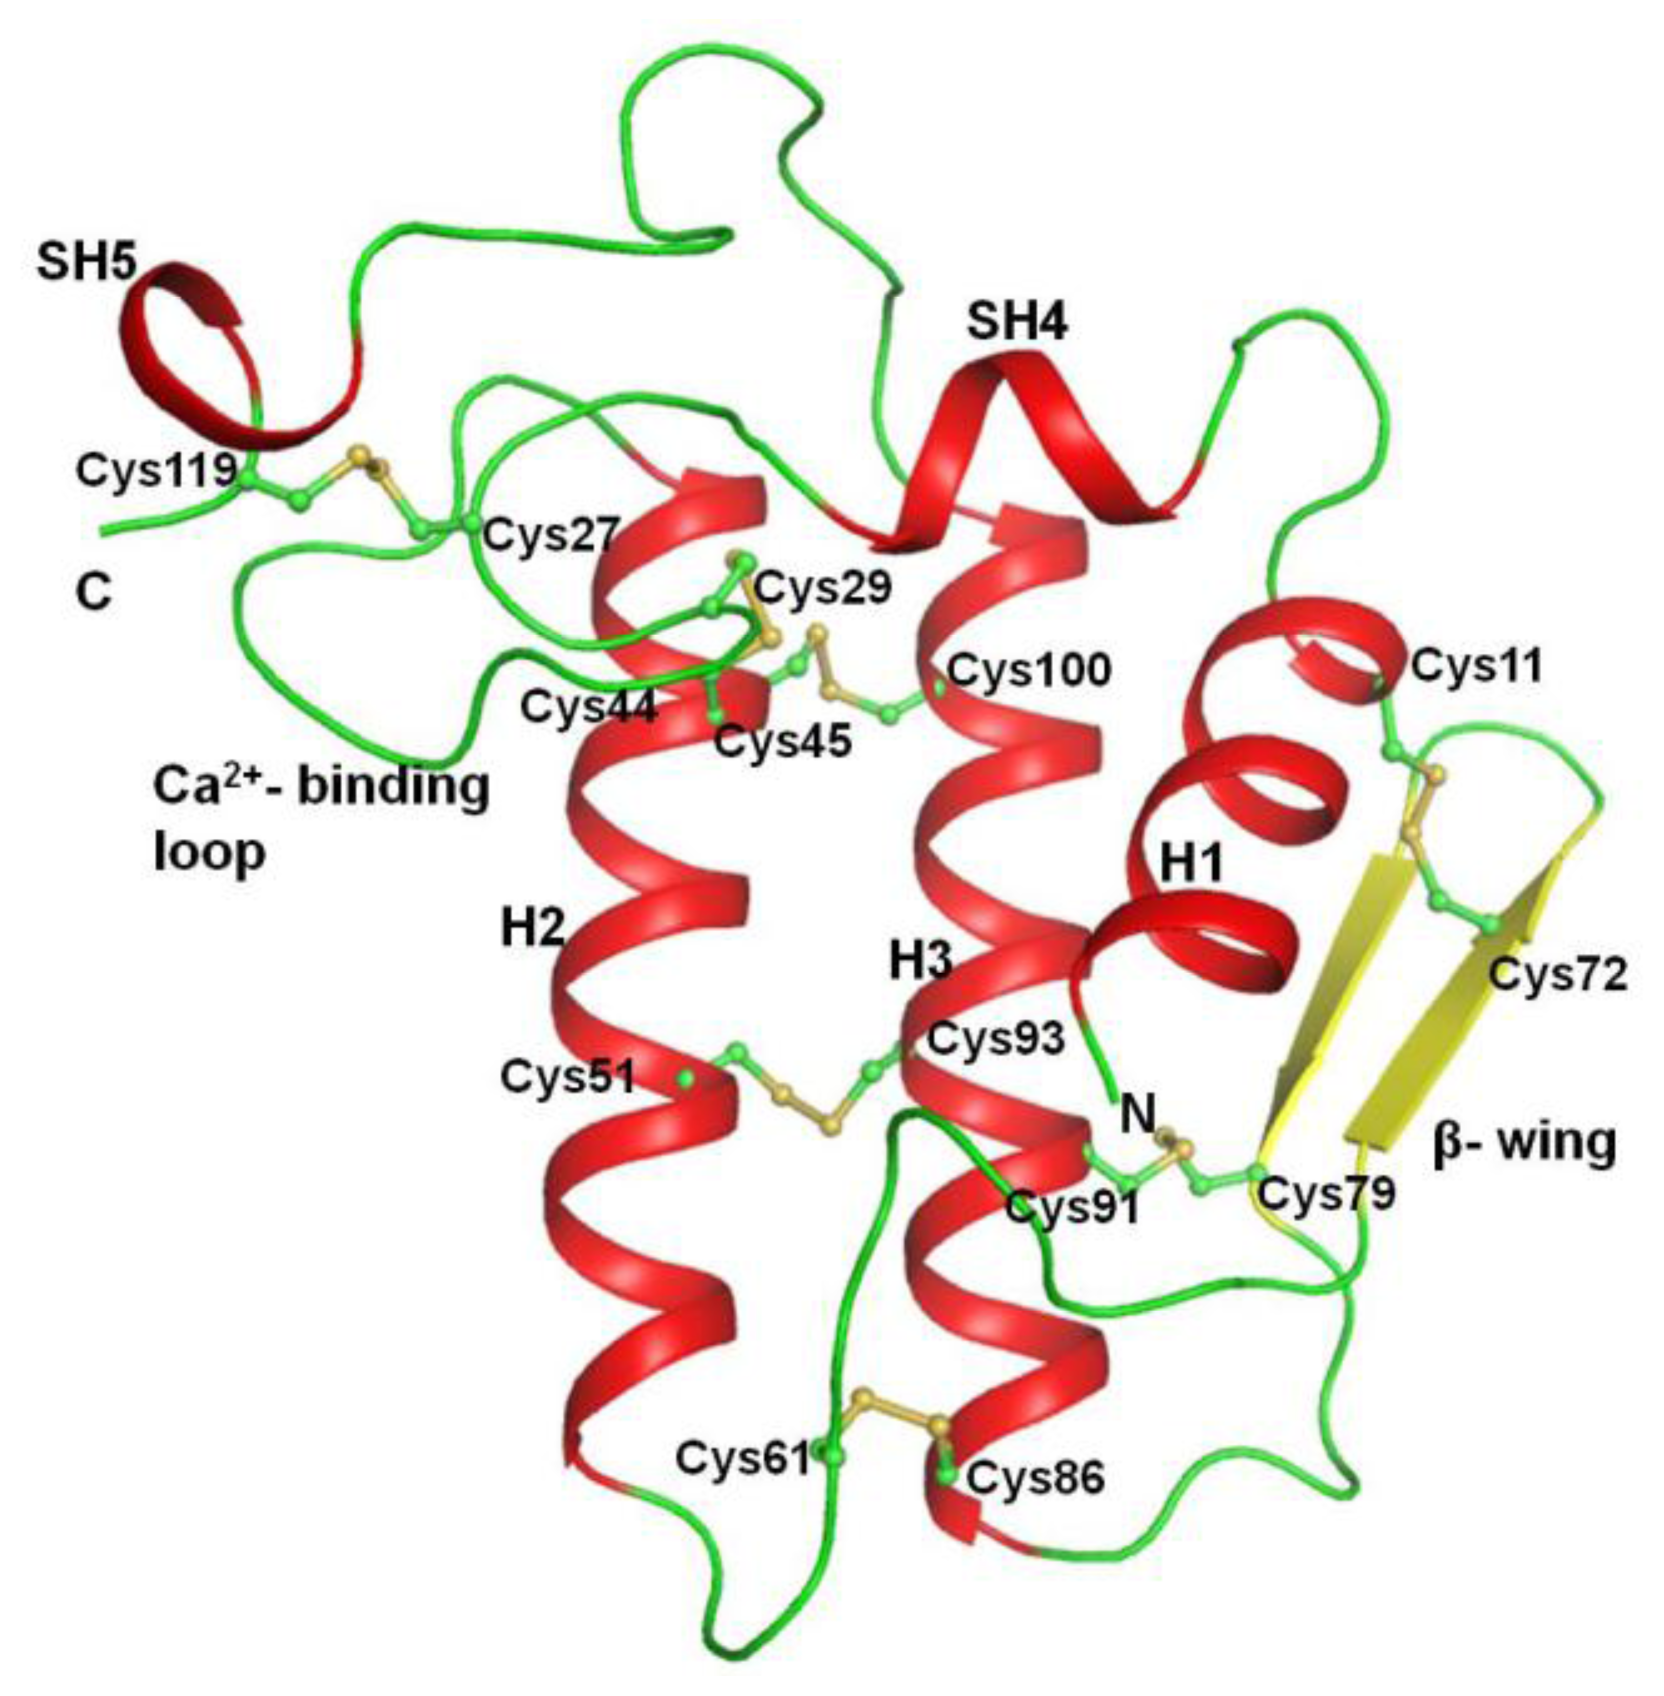
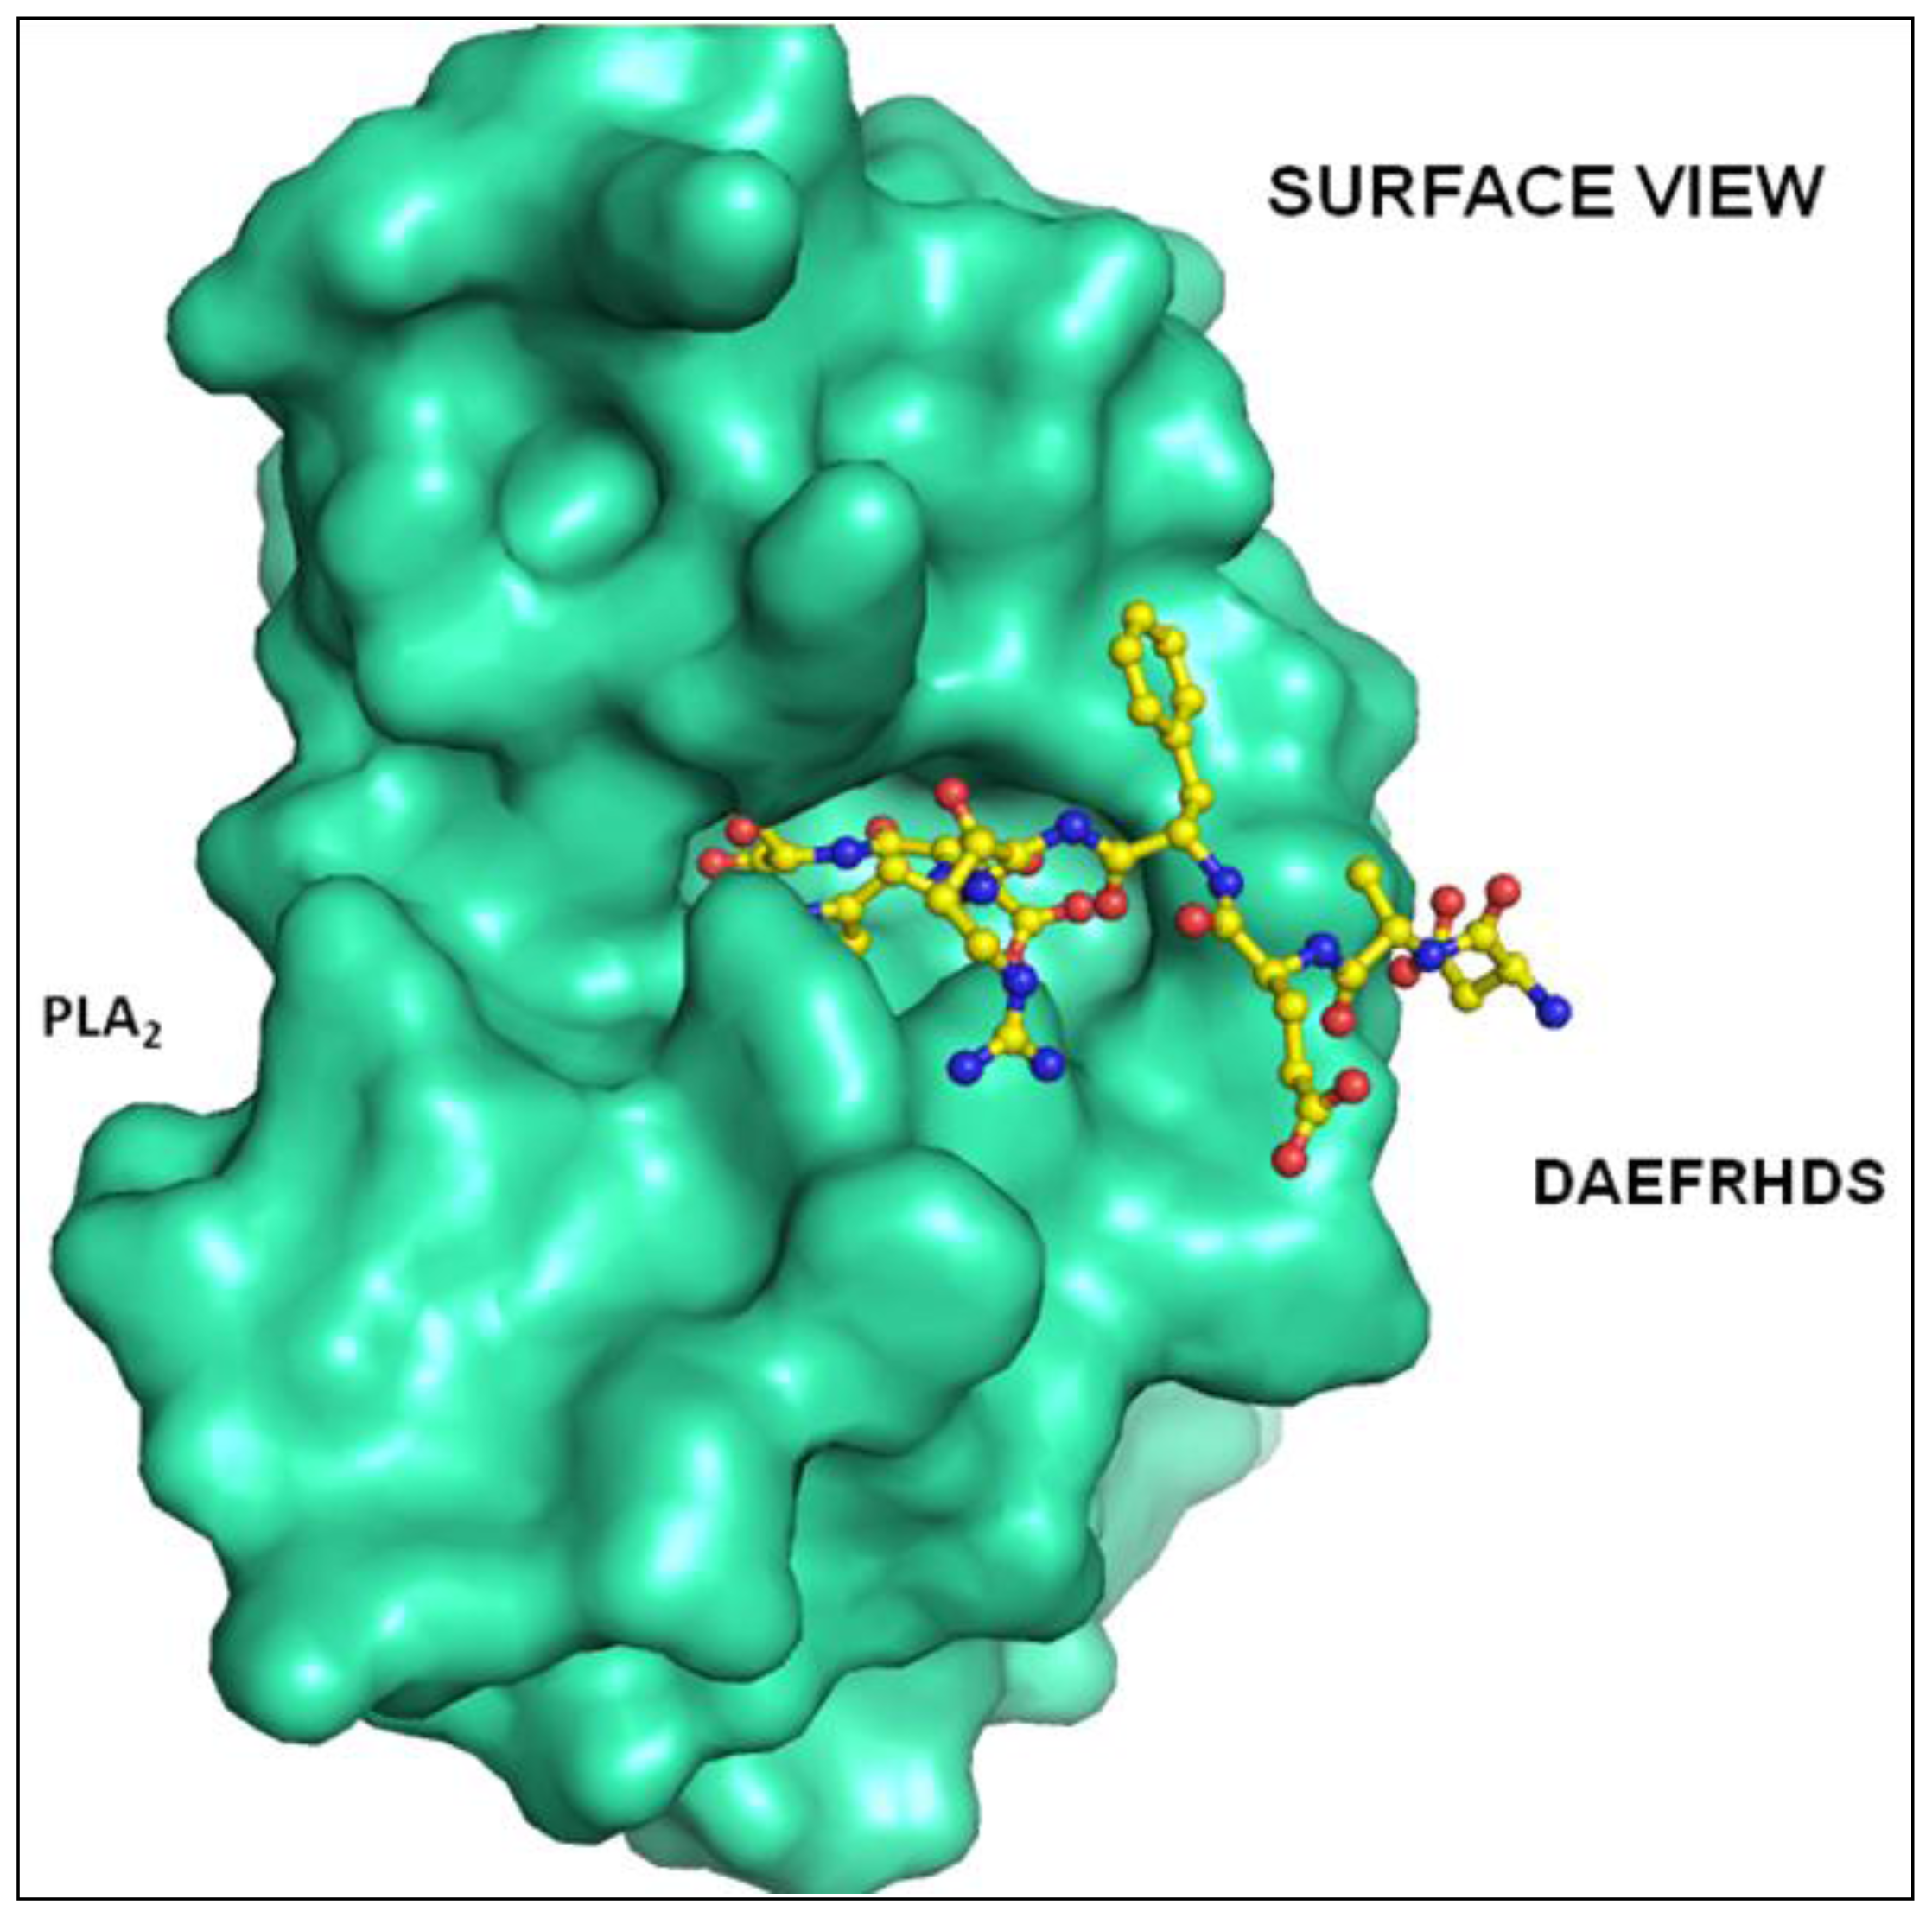
2.2. Overall Structure
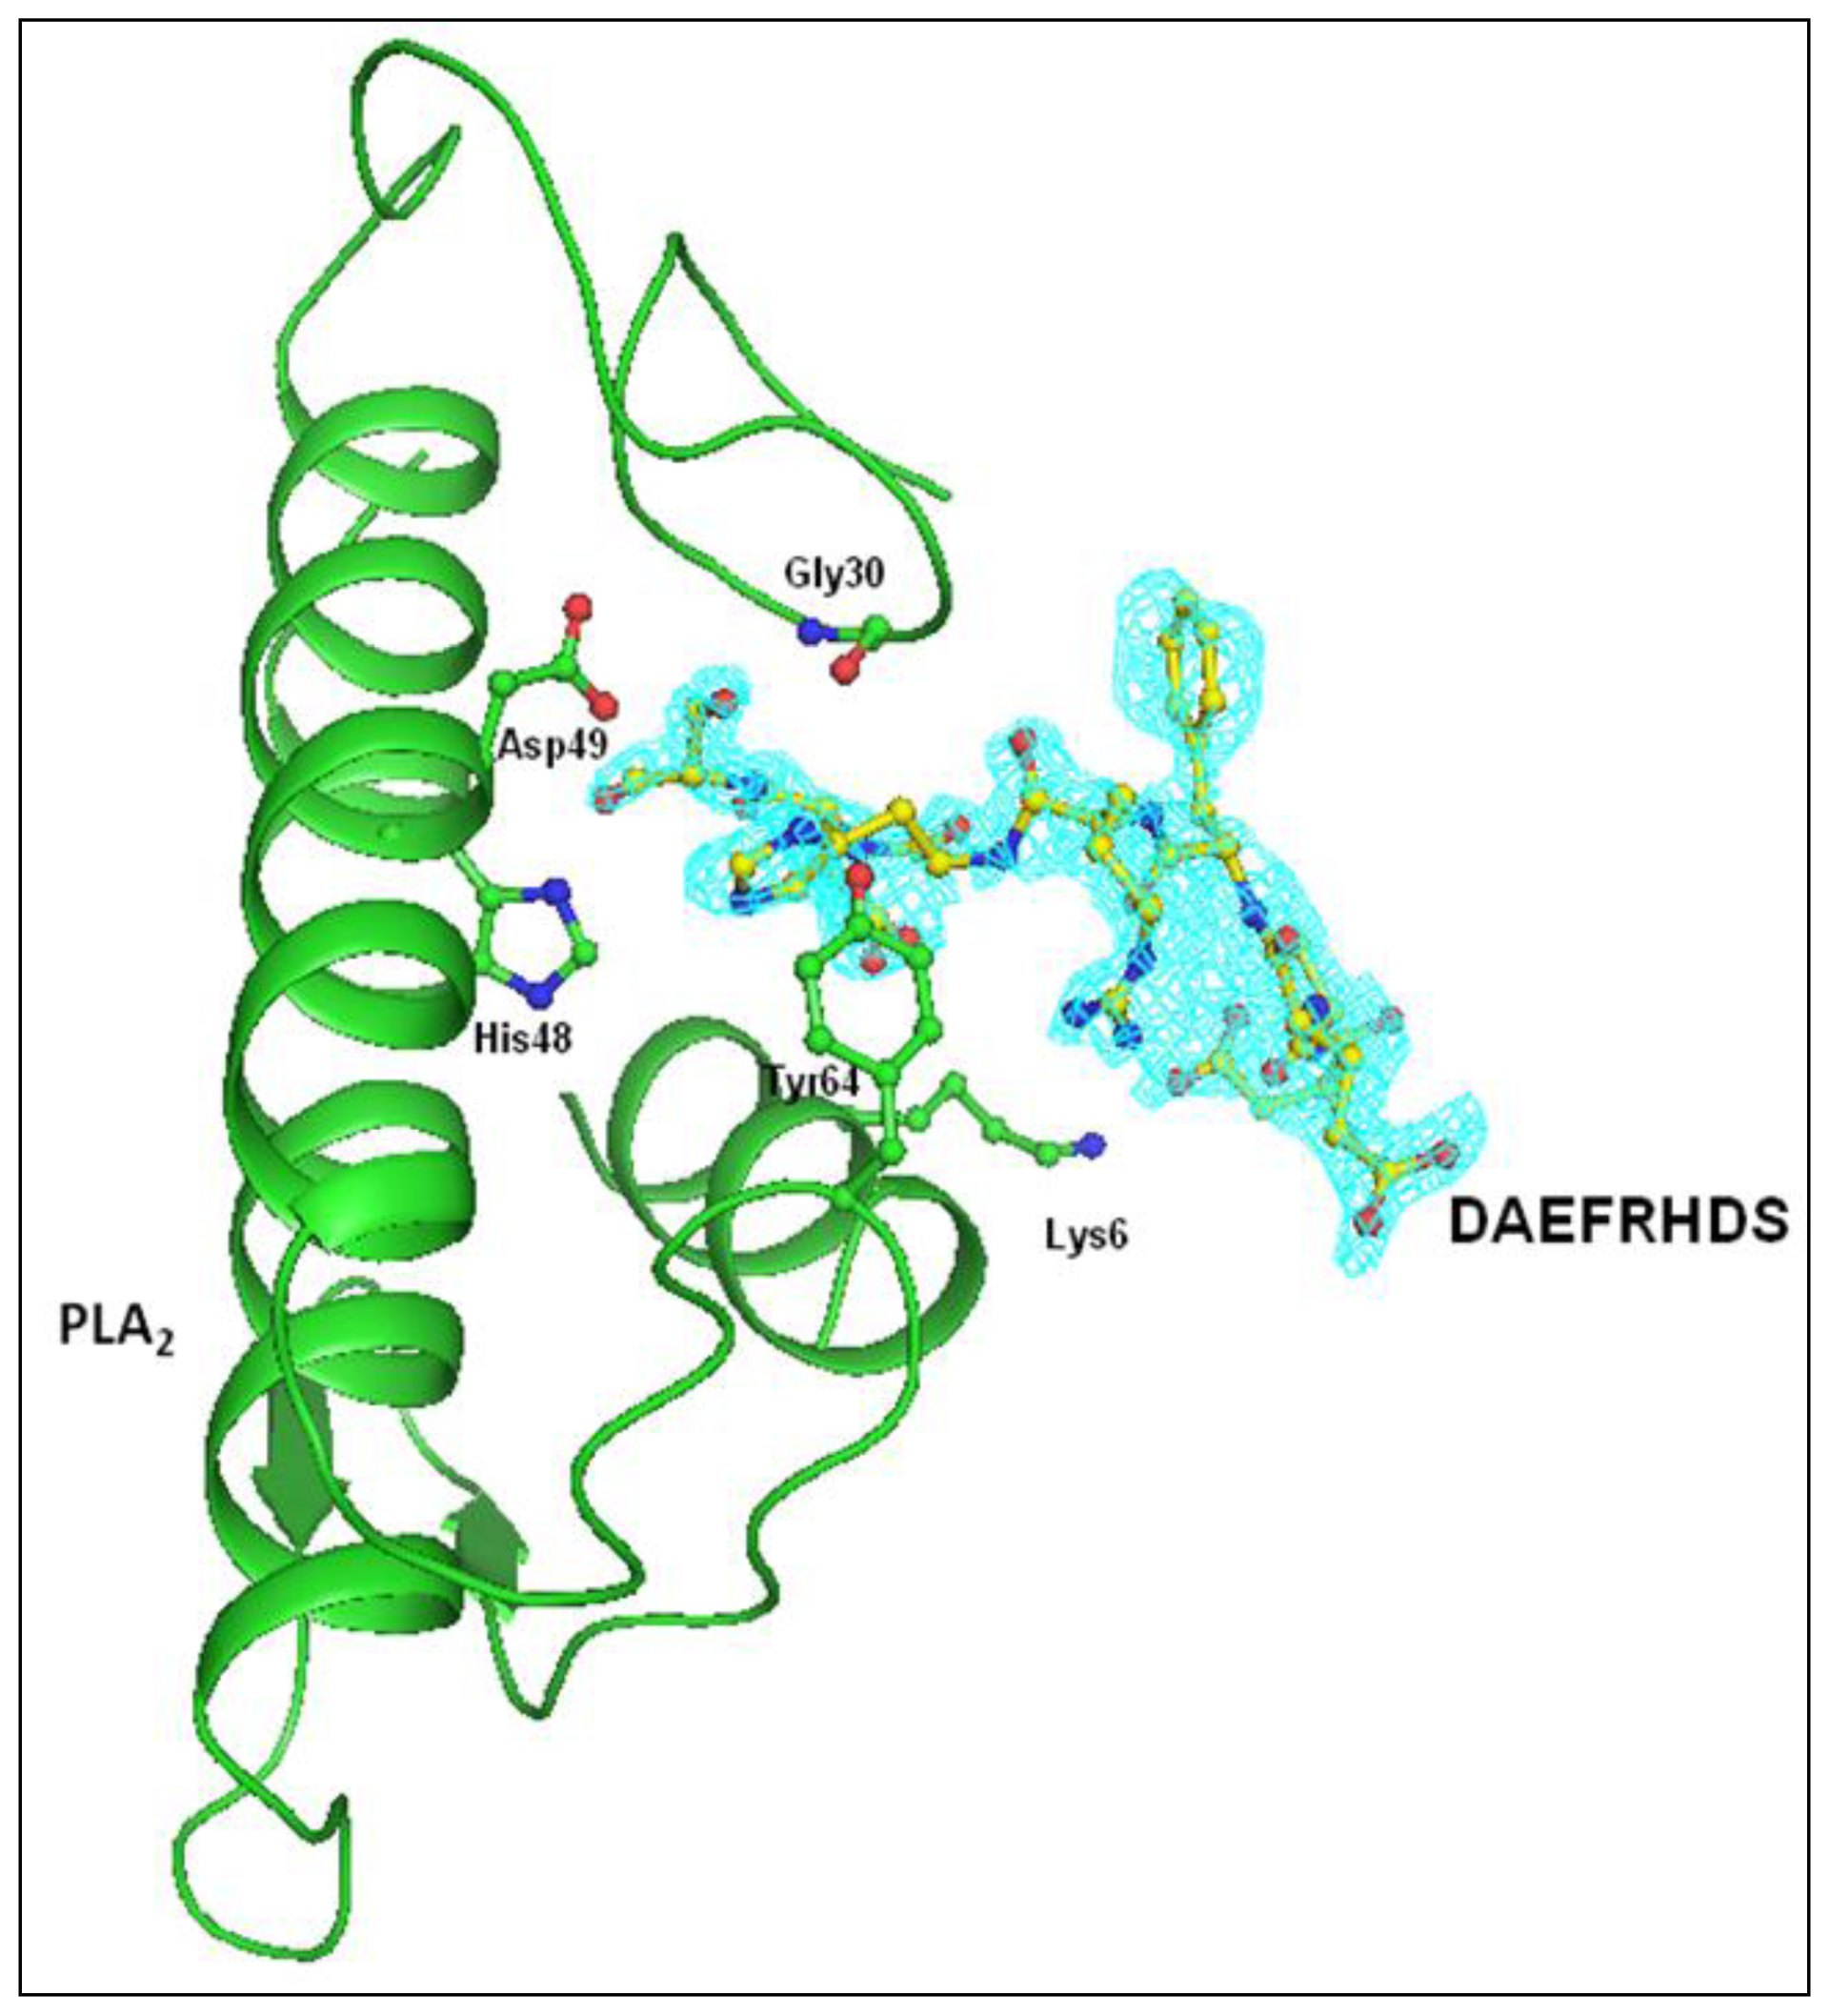
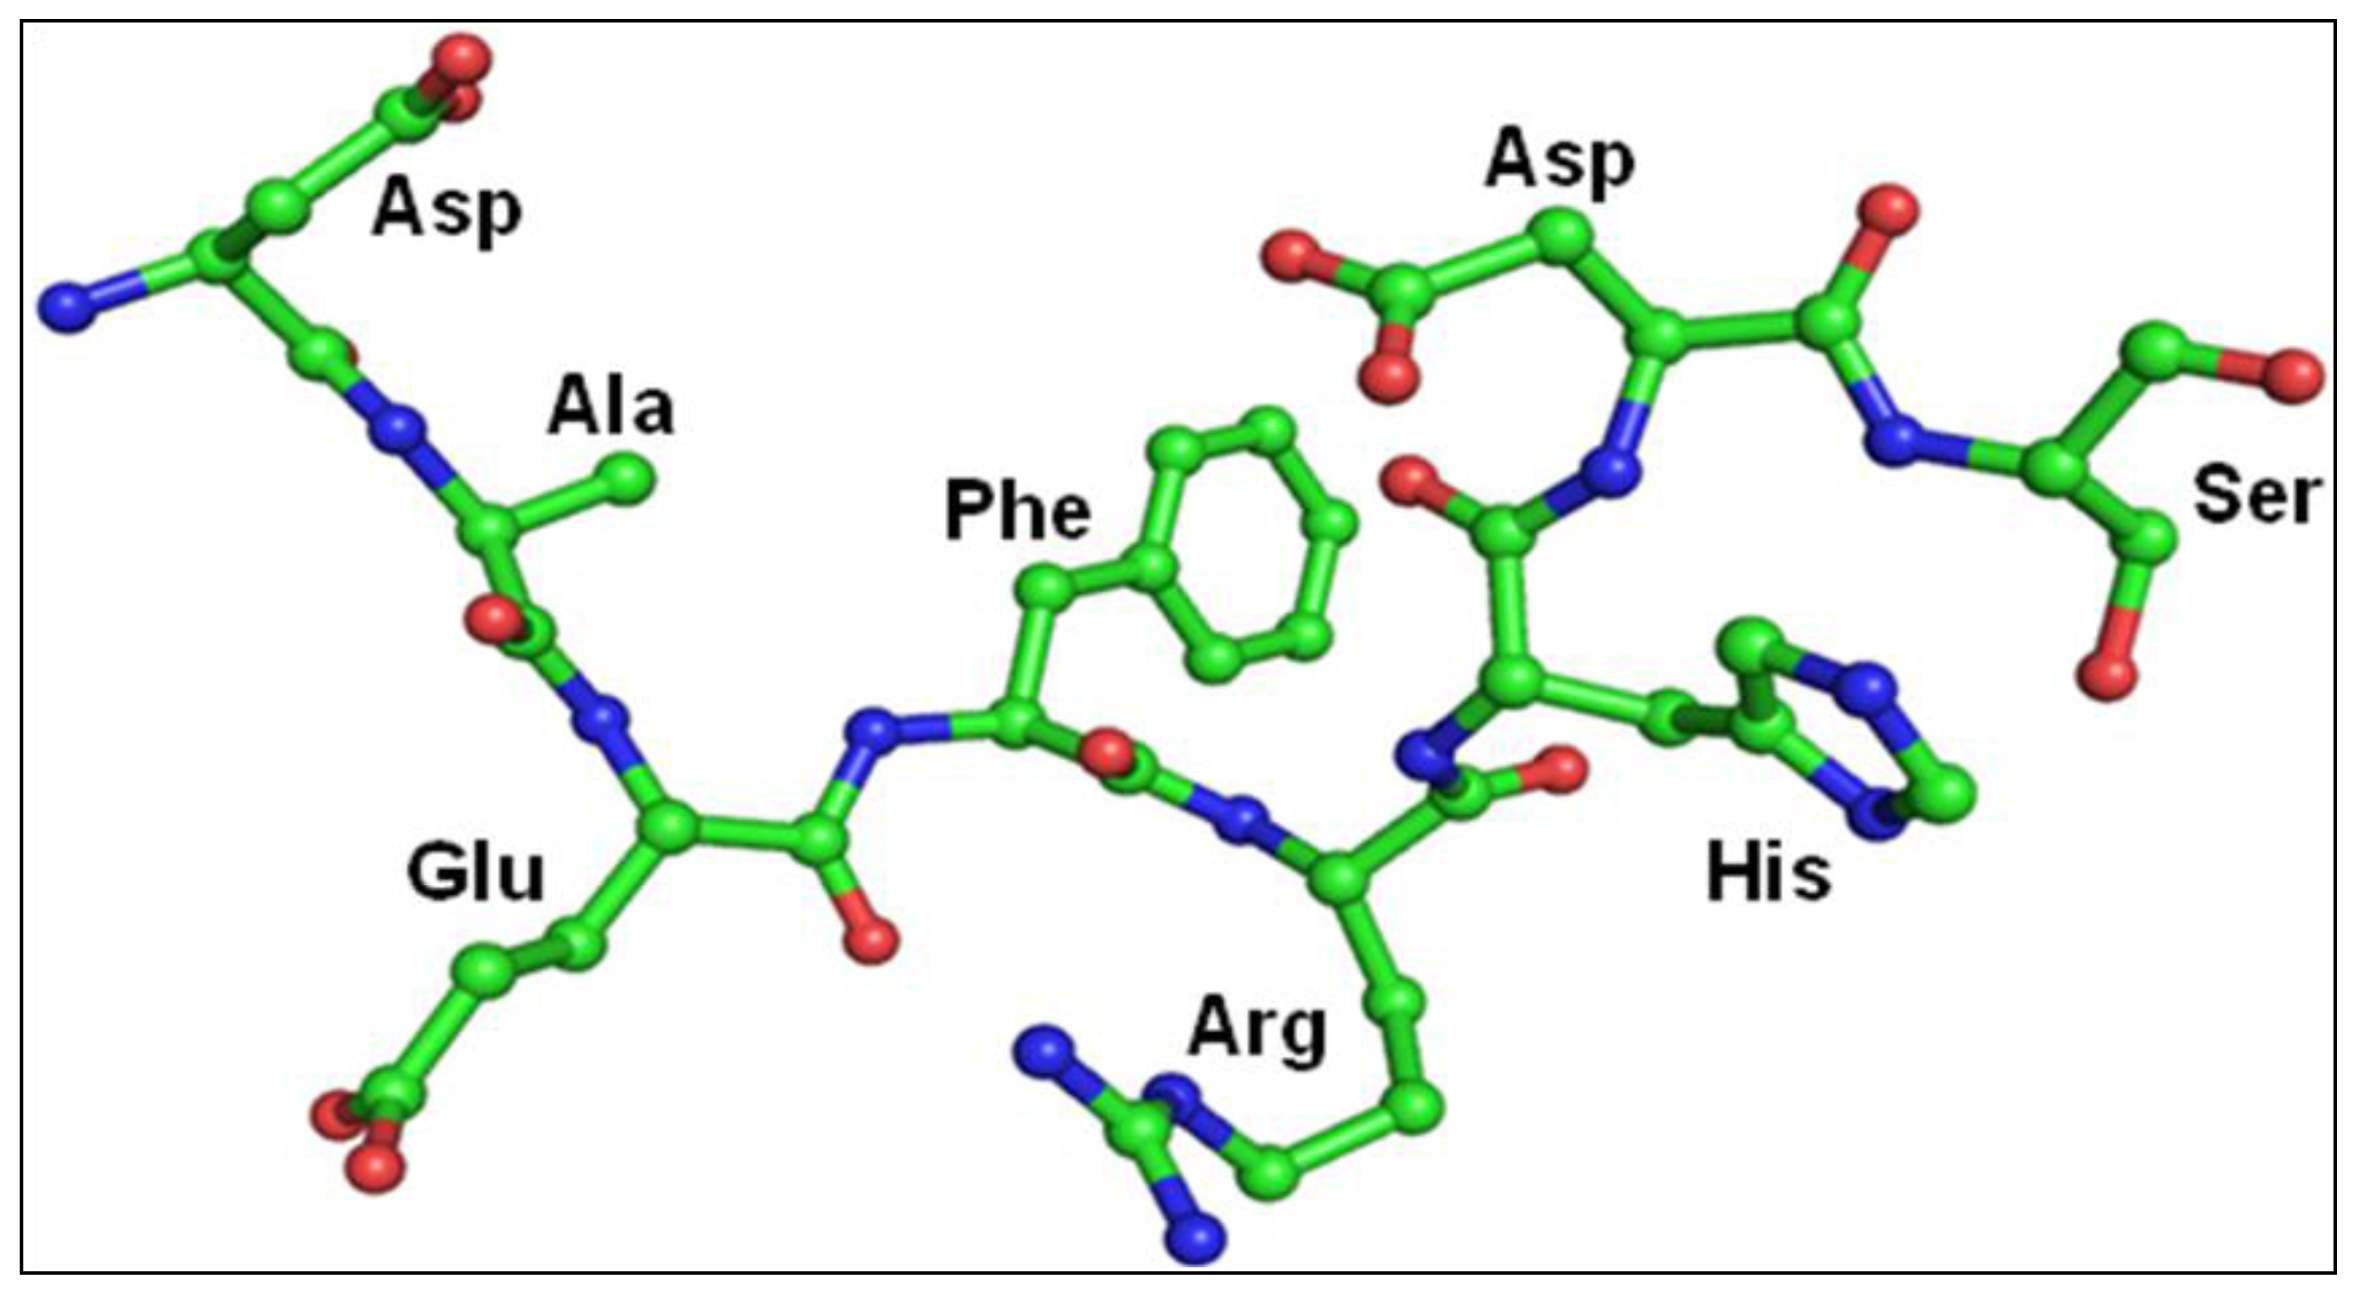
2.3. Structure of Peptide
3. Discussion
4. Experimental Section
4.1. Purification of Monomeric PLA2
4.2. Enzymatic Assay and Inhibition Studies
4.3. Crystallization
4.4. Data Collection and Data Processing
4.5. Structure Determination and Refinement
5. Conclusions
Acknowledgments
Conflicts of Interest
- Author ContributionsZeenat Mirza is the corresponding author and designed research project conception, development of overall research plan, and study oversight. Zeenat Mirza and Vikram Gopalakrishna Pillai were involved in hands-on conduct of the experiments, data collection and analysis. Zeenat Mirza was involved in writing of the manuscript. Wei-Zhu Zhong is the senior author and helped in revising and significantly improving the final content of this paper.
References
- Pouryamout, L.; Dams, J.; Wasem, J.; Dodel, R.; Neumann, A. Economic evaluation of treatment options in patients with Alzheimer’s disease: A systematic review of cost-effectiveness analyses. Drugs 2012, 72, 789–802. [Google Scholar]
- Israel, M.A.; Yuan, S.H.; Bardy, C.; Reyna, S.M.; Mu, Y.; Herrera, C.; Hefferan, M.P.; van Gorp, S.; Nazor, K.L.; Boscolo, F.S.; et al. Probing sporadic and familial Alzheimer’s disease using induced pluripotent stem cells. Nature 2012, 482, 216–220. [Google Scholar]
- Young, J.E.; Goldstein, L.S. Alzheimer’s disease in a dish: Promises and challenges of human stem cell models. Hum. Mol. Genet. 2012, 21, R82–R89. [Google Scholar]
- Silvestrelli, G.; Lanari, A.; Parnetti, L.; Tomassoni, D.; Amenta, F. Treatment of Alzheimer’s disease: From pharmacology to a better understanding of disease pathophysiology. Mech. Ageing Dev. 2006, 127, 148–157. [Google Scholar]
- Craft, J.M.; Watterson, D.M.; van Eldik, L.J. Human amyloid beta-induced neuroinflammation is an early event in neurodegeneration. Glia 2006, 53, 484–490. [Google Scholar]
- Stuchbury, G.; Munch, G. Alzheimer’s associated inflammation potential drug targets and future therapies. J. Neural Transm. 2005, 112, 429–453. [Google Scholar]
- Landau, M.; Sawaya, M.R.; Faull, K.F.; Laganowsky, A.; Jiang, L.; Sievers, S.A.; Liu, J.; Barrio, J.R.; Eisenberg, D. Towards a pharmacophore for amyloid. PLoS Biol. 2011, 9, e1001080. [Google Scholar]
- Querfurth, H.W.; LaFerla, F.M. Alzheimer’s disease. N. Engl. J. Med. 2010, 362, 329–344. [Google Scholar]
- Vassar, R.; Bennett, B.D.; Babu-Khan, S.; Kahn, S.; Mendiaz, E.A.; Denis, P.; Teplow, D.B.; Ross, S.; Amarante, P.; Loeloff, R.; et al. Beta-secretase cleavage of Alzheimer’s amyloid precursor protein by the transmembrane aspartic protease BACE. Science 1999, 286, 735–741. [Google Scholar]
- Jarrett, J.T.; Berger, E.P.; Lansbury, P.T., Jr. The carboxy terminus of the beta amyloid protein is critical for the seeding of amyloid formation: Implications for the pathogenesis of Alzheimer’s disease. Biochemistry 1993, 32, 4693–4697. [Google Scholar]
- Murakami, M.; Kudo, I. Phospholipase A2. J. Biochem. 2002, 131, 285–292. [Google Scholar]
- Moses, G.S.; Jensen, M.D.; Lue, L.F.; Walker, D.G.; Sun, A.Y.; Simonyi, A.; Sun, G.Y. Secretory PLA2-IIA: A new inflammatory factor for Alzheimer’s disease. J. Neuroinflamm. 2006, 3, 28. [Google Scholar]
- Chalbot, S.; Zetterberg, H.; Blennow, K.; Fladby, T.; Andreasen, N.; Grundke-Iqbal, I.; Iqbal, K. Blood-cerebrospinal fluid barrier permeability in Alzheimer’s disease. J. Alzheimers Dis. 2011, 25, 505–515. [Google Scholar]
- Kolko, M.; Christoffersen, N.R.; Barreiro, S.G.; Miller, M.L.; Pizza, A.J.; Bazan, N.G. Characterization and location of secretory phospholipase A2 groups IIE V and X in the rat brain. J. Neurosci. Res. 2006, 83, 874–882. [Google Scholar]
- Singh, R.K.; Singh, N.; Jabeen, T.; Sharma, S.; Dey, S.; Singh, T.P. Crystal structure of the complex of group I PLA2 with a group II-specific peptide Leu-Ala-Ile-Tyr-Ser (LAIYS) at 26 Å resolution. J. Drug Target. 2005, 13, 367–374. [Google Scholar]
- Carter, D.B.; Chou, K.C. A model for structure dependent binding of Congo Red to Alzeheimer beta-amyloid fibrils. Neurobiol. Aging 1998, 19, 37–40. [Google Scholar]
- Chou, K.C. Insights from modelling the tertiary structure of BACE2. J. Proteome Res. 2004, 3, 1069–1072. [Google Scholar]
- Chou, K.C.; Howe, W.J. Prediction of the tertiary structure of the beta-secretase zymogen. Biochem. Biophys. Res. Commun. 2002, 292, 702–708. [Google Scholar]
- Gu, R.X.; Gu, H.; Xie, Z.Y.; Wang, J.F.; Arias, H.R.; Wei, D.Q.; Chou, K.C. Possible drug candidates for Alzheimer’s disease deduced from studying their binding interactions with alpha7 nicotinic acetylcholine receptor. Med. Chem. 2009, 5, 250–262. [Google Scholar]
- Zheng, H.; Wei, D.Q.; Zhang, R.; Wang, C.; Wei, H.; Chou, K.C. Screening for new agonists against Alzheimer’s disease. Med. Chem. 2007, 3, 488–493. [Google Scholar]
- Chou, K.C. Review: Structural bioinformatics and its impact to biomedical science. Curr. Med. Chem. 2004, 11, 2105–2134. [Google Scholar]
- Berardi, M.J.; Shih, W.M.; Harrison, S.C.; Chou, J.J. Mitochondrial uncoupling protein 2 structure determined by NMR molecular fragment searching. Nature 2011, 476, 109–113. [Google Scholar]
- OuYang, B.; Xie, S.; Berardi, M.J.; Zhao, X.M.; Dev, J.; Yu, W.; Sun, B.; Chou, J.J. Unusual architecture of the p7 channel from hepatitis C virus. Nature 2013, 498, 521–525. [Google Scholar]
- Schnell, J.R.; Chou, J.J. Structure and mechanism of the M2 proton channel of influenza A virus. Nature 2008, 451, 591–595. [Google Scholar]
- Laskowski, R.; Macarthur, M.; Moss, D.; Thornton, J. PROCHECK: A program to check the stereochemical quality of protein structures. J. Appl. Crystallogr. 1993, 26, 283–290. [Google Scholar]
- Ramachandran, G.N.; Sasisekharan, V. Conformation of polypeptides and proteins. Adv. Protein Chem. 1968, 23, 283–438. [Google Scholar]
- Singh, N.; Kumar, R.P.; Kumar, S.; Sharma, S.; Mir, R.; Kaur, P.; Srinivasan, A.; Singh, T.P. Simultaneous inhibition of anti-coagulation and inflammation: Crystal structure of phospholipase A2 complexed with indomethacin at 14 Å resolution reveals the presence of the new common ligand-binding site. J. Mol. Recognit. 2009, 22, 437–445. [Google Scholar]
- Berg, O.G.; Yu, B.Z.; Rogers, J.; Jain, M.K. Interfacial catalysis by phospholipase A2: Determination of the interfacial kinetic rate constants. Biochemistry 1991, 30, 7283–7297. [Google Scholar]
- Yu, B.Z.; Berg, O.G.; Jain, M.K. The divalent cation is obligatory for the binding of ligands to the catalytic site of secreted phospholipase A2. Biochemistry 1993, 32, 6485–6492. [Google Scholar]
- Jones, D.T. Predicting novel protein folds by using FRAGFOLD. Proteins 2001, 45, 127–132. [Google Scholar]
- Hegler, J.A.; Latzer, J.; Shehu, A.; Clementi, C.; Wolynes, P.G. Restriction versus guidance in protein structure prediction. Proc. Natl. Acad. Sci. USA 2009, 106, 15302–15307. [Google Scholar]
- Lustbader, J.W.; Cirilli, M.; Lin, C.; Xu, H.W.; Takuma, K.; Wang, N.; Caspersen, C.; Chen, X.; Pollak, S.; Chaney, M.; et al. ABAD directly links Abeta to mitochondrial toxicity in Alzheimer’s disease. Science 2004, 304, 448–452. [Google Scholar]
- Shen, Y.; Joachimiak, A.; Rosner, M.R.; Tang, W.J. Structures of human insulin-degrading enzyme reveal a new substrate recognition mechanism. Nature 2006, 443, 870–874. [Google Scholar]
- Hoyer, W.; Hard, T. Interaction of Alzheimer’s A beta peptide with an engineered binding protein—Thermodynamics and kinetics of coupled folding-binding. J. Mol. Biol. 2008, 378, 398–411. [Google Scholar]
- Luhrs, T.; Ritter, C.; Adrian, M.; Riek-Loher, D.; Bohrmann, B.; Dobeli, H.; Schubert, D.; Riek, R. 3D structure of Alzheimer’s amyloid-beta(1–42) fibrils. Proc. Natl. Acad. Sci. USA 2005, 102, 17342–17347. [Google Scholar]
- Miles, L.A.; Wun, K.S.; Crespi, G.A.; Fodero-Tavoletti, M.T.; Galatis, D.; Bagley, C.J.; Beyreuther, K.; Masters, C.L.; Cappai, R.; McKinstry, W.J.; et al. Amyloid-beta-anti-amyloidbeta complex structure reveals an extended conformation in the immunodominant B-cell epitope. J. Mol. Biol. 2008, 377, 181–192. [Google Scholar]
- Watson, A.A.; Fairlie, D.P.; Craik, D.J. Solution structure of methionine-oxidized amyloid beta-peptide (1–40) Does oxidation affect conformational switching? Biochemistry 1998, 37, 12700–12706. [Google Scholar]
- Coles, M.; Bicknell, W.; Watson, A.A.; Fairlie, D.P.; Craik, D.J. Solution structure of amyloid beta-peptide(1–40) in a water-micelle environment Is the membrane-spanning domain where we think it is? Biochemistry 1998, 37, 11064–11077. [Google Scholar]
- Castelletto, V.; Hamley, I.W.; Harris, P.J.; Olsson, U.; Spencer, N. Influence of the solvent on the self-assembly of a modified amyloid beta peptide fragment I Morphological investigation. J. Phys. Chem. B 2009, 113, 9978–9987. [Google Scholar]
- Davis, C.H.; Berkowitz, M.L. Structure of the amyloid-beta (1–42) monomer absorbed to model phospholipid bilayers: A molecular dynamics study. J. Phys. Chem. B 2009, 113, 14480–14486. [Google Scholar]
- Singh, R.K.; Vikram, P.; Makker, J.; Jabeen, T.; Sharma, S.; Dey, S.; Kaur, P.; Srinivasan, A.; Singh, T.P. Design of specific peptide inhibitors for group I phospholipase A2: Structure of a complex formed between phospholipase A2 from Naja naja sagittifera (group I) and a designed peptide inhibitor Val-Ala-Phe-Arg-Ser (VAFRS) at 19 Å resolution reveals unique features. Biochemistry 2003, 42, 11701–11706. [Google Scholar]
- Reynolds, L.J.; Hughes, L.L.; Yu, L.; Dennis, E.A. 1-Hexadecyl-2-arachidonoylthio-2-deoxy-sn-glycero-3-phosphorylcholine as a substrate for the microtiterplate assay of human cytosolic phospholipase A2. Anal. Biochem. 1994, 217, 25–32. [Google Scholar]
- Otwinowski, Z.; Minor, W. Processing of X-ray diffraction data collected in oscillation mode. Methods Enzymol. 1997, 276, 307–326. [Google Scholar]
- Navaza, J. AmoRe: An automated package for molecular replacement. Acta Crystallogr. A 1994, 50, 157–163. [Google Scholar]
- Murshudov, G.N.; Dodson, E.J. Simplified error estimation a la Cruickshank in macromolecular crystallography. CCP4 Newslett. Protein Crystallogr. 1997, 33, 31–39. [Google Scholar]
- Jones, T.A.; Zou, J.Y.; Cowan, S.W.; Kjeldgaard, M. Improved methods for building protein models in electron density maps and the location of errors in these models. Acta Crystallogr. A 1991, 47, 110–119. [Google Scholar]


| Space group | P41 |
|---|---|
| System | Tetragonal |
| Unit-cell parameters (Ǻ) | |
| a = b | 42.7 |
| c | 65.8 |
| Vm (Ǻ 3/Da) | 2.3 |
| Solvent Content (%) | 46.7 |
| Resolution range (Ǻ) | 20.0–2.0 |
| No. of observed reflections | 33,510 |
| No. of unique reflections | 7735 |
| Overall completeness (%) | 98.7 |
| Completeness in the highest shell (2.06–2.03 Ǻ) (%) | 87.7 |
| Overall Rsym (%) | 7.0 |
| Rsym in the highest shell (2.06–2.03 Ǻ) (%) | 18.8 |
| Overall I/σ(I) | 11.1 |
| I/σ(I) in the highest shell (2.06–2.03 Ǻ) | 2.3 |
| PDB code | 3JQ5 |
|---|---|
| Resolution range (Ǻ) | 20.0–2.0 |
| Number of reflections | 7735 |
| RCryst (for all data) (%) | 18.1 |
| RFree (5% data) (%) | 22.0 |
| Number of protein atoms | 909 |
| Number of peptide atoms | 68 |
| Number of Water Molecules | 99 |
| Number of calcium atoms | 1 |
| R.m.s. deviations | |
| Bond length (Ǻ 2) | 0.009 |
| Bond angles (°) | 1.1 |
| Dihedral angles (°) | 14.4 |
| Overall G factor | 0.05 |
| Mean B factor (Ǻ2) | |
| Main chain atoms | 22.0 |
| Side chains and water molecules | 27.3 |
| Overall | 24.8 |
| Ramachandran plot statistics | |
| Residues in the most allowed region (%) | 89.1 |
| Residues in the additionally allowed region (%) | 10.0 |
| Residues in the generously allowed region (%) | 0.9 |
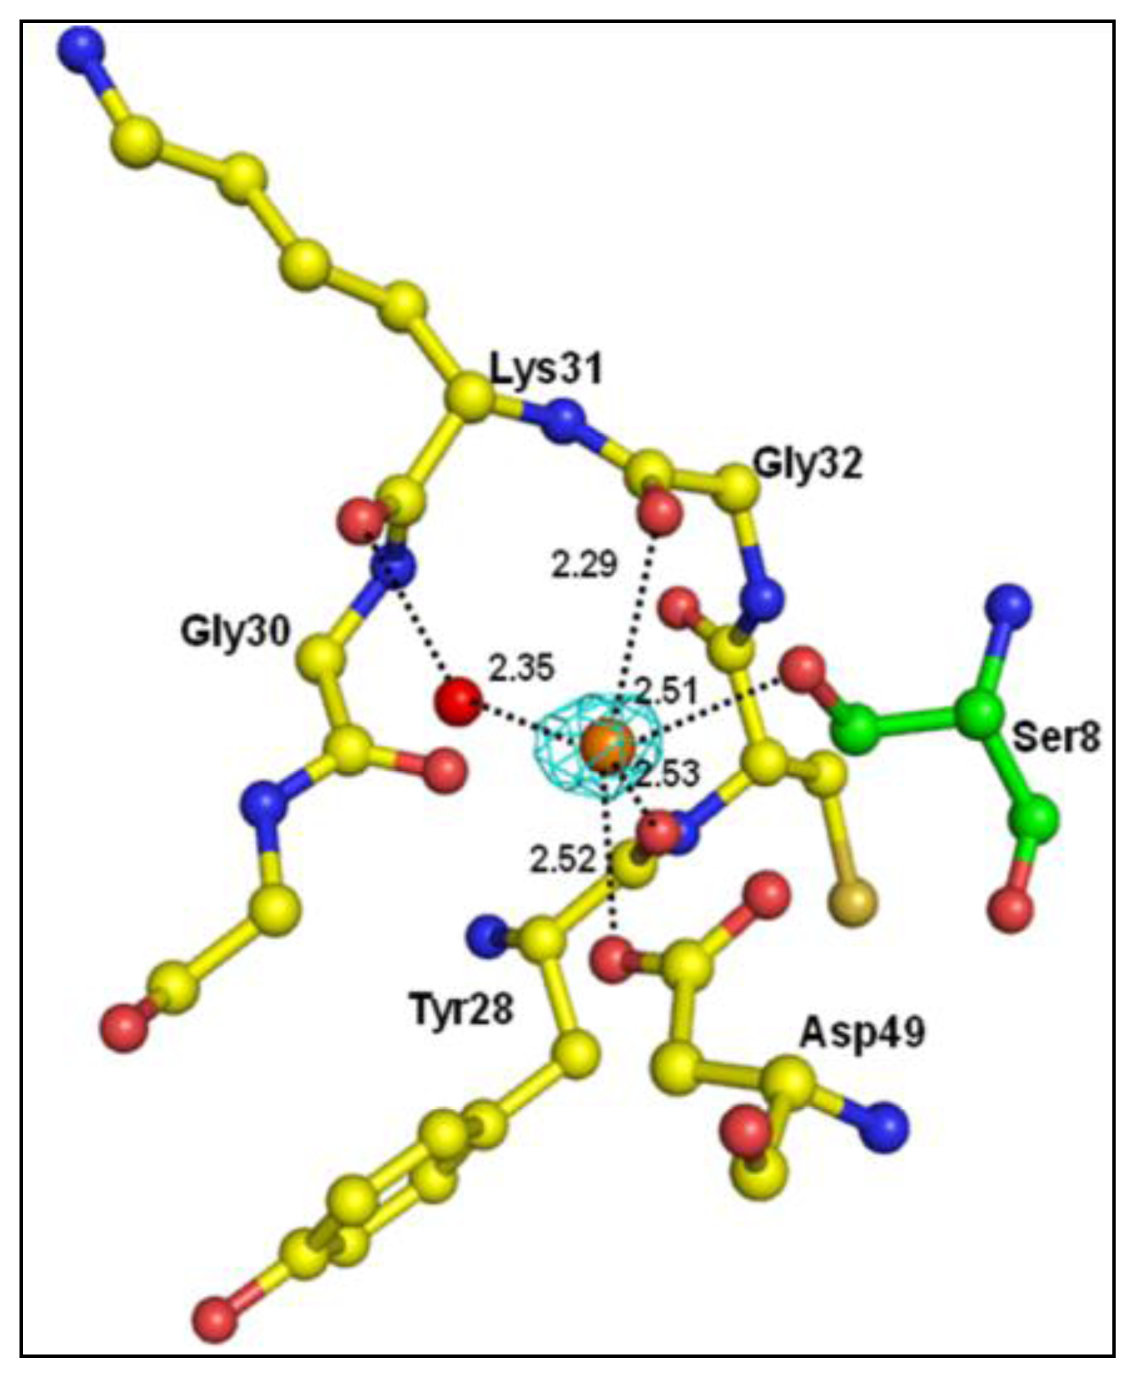
| Atoms of peptide | Protein atoms | Distance (Å) |
|---|---|---|
| Asp1 Oδ2 | Lys6 Nζ | 3.35 |
| Trp19 Nɛ1 | 2.64 | |
| His6 Nδ1 | Gly30 O | 3.43 |
| Tyr64 OH | 2.78 | |
| Ser8 Oγ | Gly30 N | 3.22 |
| Gly30 O | 2.62 | |
| Tyr28 O | 3.35 | |
| Asp49 Oδ1 | 2.95 | |
| Ser8 O | His48 Nδ1 | 2.80 |
| Atoms of peptide | Protein atoms | Distance (Å) |
|---|---|---|
| Asp1 Cγ | Trp19 Cɛ2 | 3.79 |
| Trp19 Cζ2 | 3.48 | |
| Ala2 Cβ | Trp19 CH2 | 3.73 |
| Trp19 Cζ2 | 3.97 | |
| Phe4 Cδ1 | Ala23 Cβ | 3.91 |
| Arg5 Cζ | Leu2 Cδ2 | 3.53 |
| His6 Cα | Leu2 Cδ2 | 3.69 |
| His6 Cβ | Gly30 Cα | 3.63 |
| Gly30 C | 3.68 | |
| His6 Cɛ1 | Tyr64 Cζ | 3.75 |
| Asp7 Cα | Ala23 Cα | 3.75 |
| Asp7 Cβ | Ile9 Cδ1 | 3.78 |
| Phe5 Cɛ2 | 3.97 | |
| Asp7 C | Phe5 Cɛ2 | 3.92 |
| Ser8 Cβ | Tyr28 C | 3.90 |
| Cys29 Cα | 3.51 | |
| Cys29 C | 3.64 | |
| Gly30 Cα | 3.76 | |
| Ser8 C | Phe101 Cζ | 3.92 |
| His48 Cγ | 3.98 | |
| Cys45 Cβ | 3.81 |
© 2014 by the authors; licensee MDPI, Basel, Switzerland This article is an open access article distributed under the terms and conditions of the Creative Commons Attribution license (http://creativecommons.org/licenses/by/3.0/).
Share and Cite
Mirza, Z.; Pillai, V.G.; Zhong, W.-Z. Structure of N-Terminal Sequence Asp-Ala-Glu-Phe-Arg-His-Asp-Ser of Aβ-Peptide with Phospholipase A2 from Venom of Andaman Cobra Sub-Species Naja naja sagittifera at 2.0 Å Resolution. Int. J. Mol. Sci. 2014, 15, 4221-4236. https://doi.org/10.3390/ijms15034221
Mirza Z, Pillai VG, Zhong W-Z. Structure of N-Terminal Sequence Asp-Ala-Glu-Phe-Arg-His-Asp-Ser of Aβ-Peptide with Phospholipase A2 from Venom of Andaman Cobra Sub-Species Naja naja sagittifera at 2.0 Å Resolution. International Journal of Molecular Sciences. 2014; 15(3):4221-4236. https://doi.org/10.3390/ijms15034221
Chicago/Turabian StyleMirza, Zeenat, Vikram Gopalakrishna Pillai, and Wei-Zhu Zhong. 2014. "Structure of N-Terminal Sequence Asp-Ala-Glu-Phe-Arg-His-Asp-Ser of Aβ-Peptide with Phospholipase A2 from Venom of Andaman Cobra Sub-Species Naja naja sagittifera at 2.0 Å Resolution" International Journal of Molecular Sciences 15, no. 3: 4221-4236. https://doi.org/10.3390/ijms15034221