Article

A Chrysanthemum Heat Shock Protein Confers Tolerance to Abiotic Stress

1
College of Horticulture, Nanjing Agricultural University, Nanjing 210095, China
2
Jiangsu Province Engineering Lab for Modern Facility Agriculture Technology & Equipment, Nanjing 210095, China
*
Author to whom correspondence should be addressed.
These authors contributed equally to this work.
Int. J. Mol. Sci. 2014, 15(3), 5063-5078; https://doi.org/10.3390/ijms15035063
Submission received: 15 December 2013 / Revised: 12 March 2014 / Accepted: 13 March 2014 / Published: 21 March 2014
(This article belongs to the Special Issue Plant Cell Compartmentation and Volume Control)

Abstract

:
Heat shock proteins are associated with protection against various abiotic stresses. Here, the isolation of a chrysanthemum cDNA belonging to the HSP70 family is reported. The cDNA, designated CgHSP70, encodes a 647-residue polypeptide, of estimated molecular mass 70.90 kDa and pI 5.12. A sub-cellular localization assay indicated that the cDNA product is deposited in the cytoplasm and nucleus. The performance of Arabidopsis thaliana plants constitutively expressing CgHSP70 demonstrated that the gene enhances tolerance to heat, drought and salinity. When CgHSP70 was stably over-expressed in chrysanthemum, the plants showed an increased peroxidase (POD) activity, higher proline content and inhibited malondialdehyde (MDA) content. After heat stress, drought or salinity the transgenic plants were better able to recover, demonstrating CgHSP70 positive effect.

1. Introduction

Heat shock proteins (HSPs) are produced by both eubacteria and eukaryotes. They are typically induced by heat stress, but some are also triggered by other stresses, such as low temperature, drought, salinity, heavy metals and exogenously applied phytohormones [1]. HSPs are thought to function as chaperones involved in protein folding, assembly, translocation and degradation, and also help to stabilize proteins and membranes [2]. The most well-characterized HSPs belong to the HSP70 family, which all share both a 44 kDa N-terminal ATP-binding [3] and a 25–30 kDa C-terminal substrate-binding region [4,5]. They serve a variety of functions, but are particularly associated with acquired thermotolerance [6]. The transgenic up-regulation of HSP70 has been shown to enhance tolerance to high temperature [7,8], drought [9], and salinity [10]. Transgenic tobacco plants over-expressing NtHSP70 are better equipped to survive heat/drought stress than those in which NtHSP70 is expressed either normally or is suppressed [11]. The heterologous expression in Arabidopsis thaliana of a fungal (Trichoderma harzianum) HSP70 provides some protection against damage caused by a variety of abiotic stresses [12].
Chrysanthemum (Chrysanthemum morifolium) is a leading ornamental species, which is rather susceptible to heat, drought and salinity stress. Here, we describe the isolation of an HSP70 cDNA from the variety “Zhongshanzigui”, and show that that its heterologous expression in A. thaliana has a positive effect on stress tolerance. Furthermore, when constitutively expressed in the cut chrysanthemum variety “Jinba”, levels of tolerance to heat, drought and salinity were all improved.

2. Results and Discussion

2.1. The CgHSP70 Sequence

The full length of the CgHSP70 (AB503697) cDNA was 2205 bp, including a 22 bp polyA tail. The cDNA encodes a 647-residue polypeptide of estimated relative molecular mass (Mr) 70.90 kDa and a isoelectric point (pI) of 5.12. The product includes the expected cytosolic compartmentalization sequence (GPKIEEVD) at its C-terminus [13,14], and its ATP binding domain and peptide-binding domain sequences are both strongly conserved; however its C-terminal sequence is rather divergent (Figure 1a). CgHSP70 showed high consensus to that of other plant HSP70 (Figure 1b). The highest levels of identity at the peptide level between CgHSP70 and other plant HSP70s were 98.9% with a gene from Saussurea medusa, 98.8% with a gene from Ageratina adenophora, 93.3% with a tobacco gene and 91.2% with an A. thaliana gene (Figure 1b). The expression analysis reveals that the CgHSP70 gene is not heat responsive.

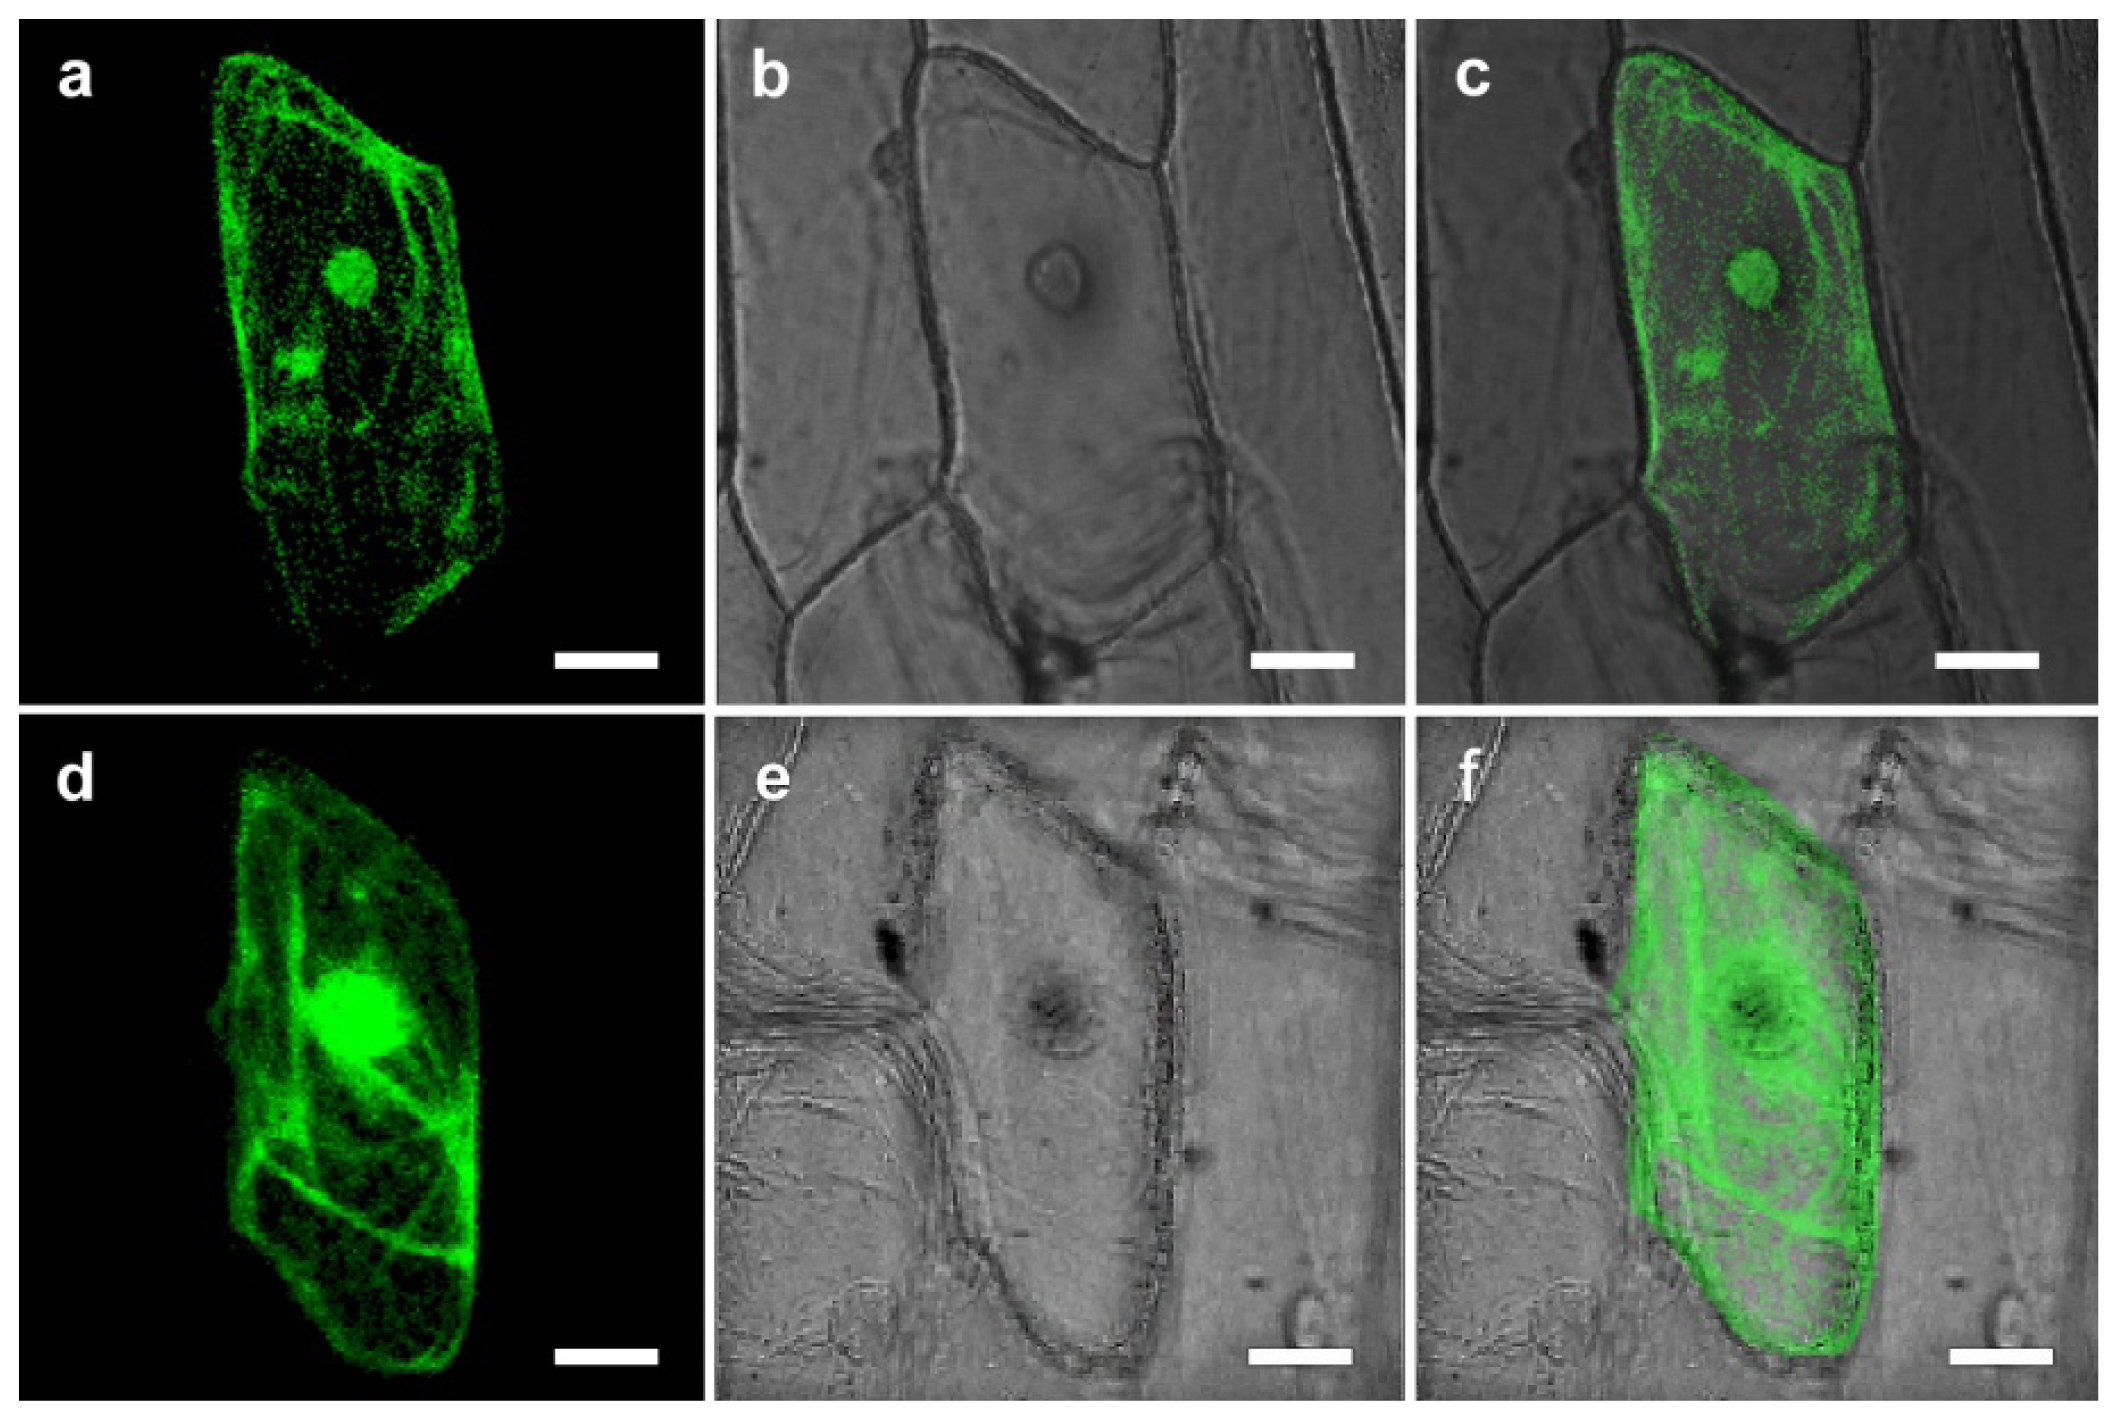
2.2. Sub-Cellular Localization of CgHSP70

Although CgHSP70 was predicted to be a cytosolic protein, it also, according to WoLF PSORT software [15], contains sequences associated with nuclear targeting. Experimentally, 35S::CgHSP70-GFP signals were detected in both the cytoplasm and the nucleus (Figure 2a–c), while the control transgene (35S::GFP) was expressed throughout the whole cell (Figure 2d–f). Members of the HSP70 family localize variously to the cytosol, nucleus, endoplasmic reticulum, mitochondria and chloroplasts [16]. The CgHSP70 sequence is highly similar to those of SmHSP70, AaHSP70, NtHSP70 and AtHSP70, all of which contain well conserved nuclear localization signals (Figure 1) [17]. Experimentally, CgHSP70 localized to the cytoplasm and nucleus (Figure 2). Several reports demonstrated that HSP70 would be translocated into the nucleus upon stress [18,19], moreover, HSP70 should be re-located from cytoplasm to nucleus upon heat stress [20]. Guinez et al. suggested that the nuclear transport of cytosolic proteins (HSP70) could be linked to O-GlcNAc glycosylation, but the mechanism involved remains unclear [21]. In the present study, CgHSP70 localization in the nucleus is very concentrated (Figure 2a–c), which suggested that the HSP is probably actively imported into the nucleus.

2.3. Stress Tolerance of A. thaliana Plants Heterologously Expressing CgHSP70

CgHSP70 transcription was detected in lines 35S:TH2 and 35S:TH3, but not in either wild type (WT) or empty vector (EV) plants (Figure 3). In response to the heat stress, the leaves of WT and EV quickly became wilted, while the TH lines were less affected. The transgenic seedlings were better able to survive the heat stress, since 100% of the WT and EV seedlings died, whereas 90.2% of the 35S:TH2 plants and 89.5% of the 35S:TH3 plants recovered (Figure 4a). The transformants also showed an improved level of drought tolerance (Figure 4b); their respective survival rates (93.7% and 85.2%) are contrasted with the 100% death rate of WT and EV plants. Salinity stress did not completely inhibit the growth of the CgHSP70 transformants, whereas it did cause the WT and EV plants to wilt. None of the WT and EV plants survived, whereas 88.1% and 92.0%, respectively, of the two transgenic lines did (Figure 4c).
The heterologous expression of various plant HSP70 genes has been repeatedly shown to be correlated with an enhanced level of stress tolerance; For example, the antisense expression of Nthsp70-1 in A. thaliana resulted in a reduction in the host’s thermotolerance [6]. Similarly, the introduction of an HSP70 cloned from a halotolerant cyanobacterium improved the thermotolerance of tobacco during both germination and early seedling growth [7]. When the rice mitochondrial HSP70 gene (mtHsp70) was constitutively expressed in rice suspension culture cells, heat stress proved less potent in inducing apoptosis [22]. The heterologous expression of the Porphyra seriata mitochondrial gene PsHSP70b in Chlamydomonas improved survival and cell growth under heat stress conditions [23]. Drought stress tolerance proved also to be enhanced when NtHSP70-1 was over-expressed [24]. The tolerance to stress, whether imposed by high temperature, drought or salinity, of A. thaliana was markedly improved when CgHSP70 was constitutively expressed.

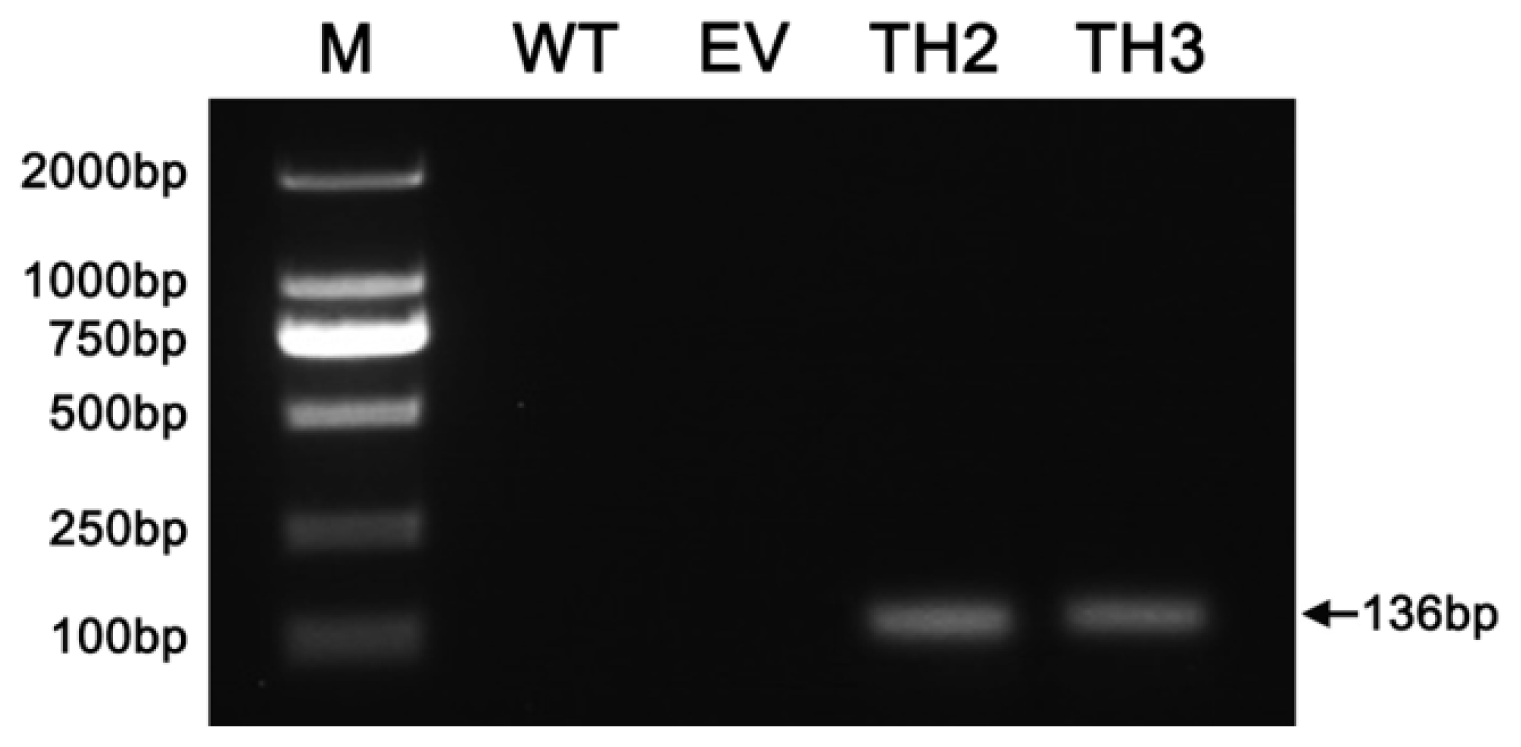
2.4. Transgene Transcription in Chrysanthemum

Based on the presence of the hptII gene as detected by PCR, regenerants tolerating hygromycin were shown to be true transformants (Figure 5a). RT-qPCR analysis showed that CgHSP70 transcript abundance in Th1 and Th4 was significantly higher than in either WT or EV plants (Figure 5b).

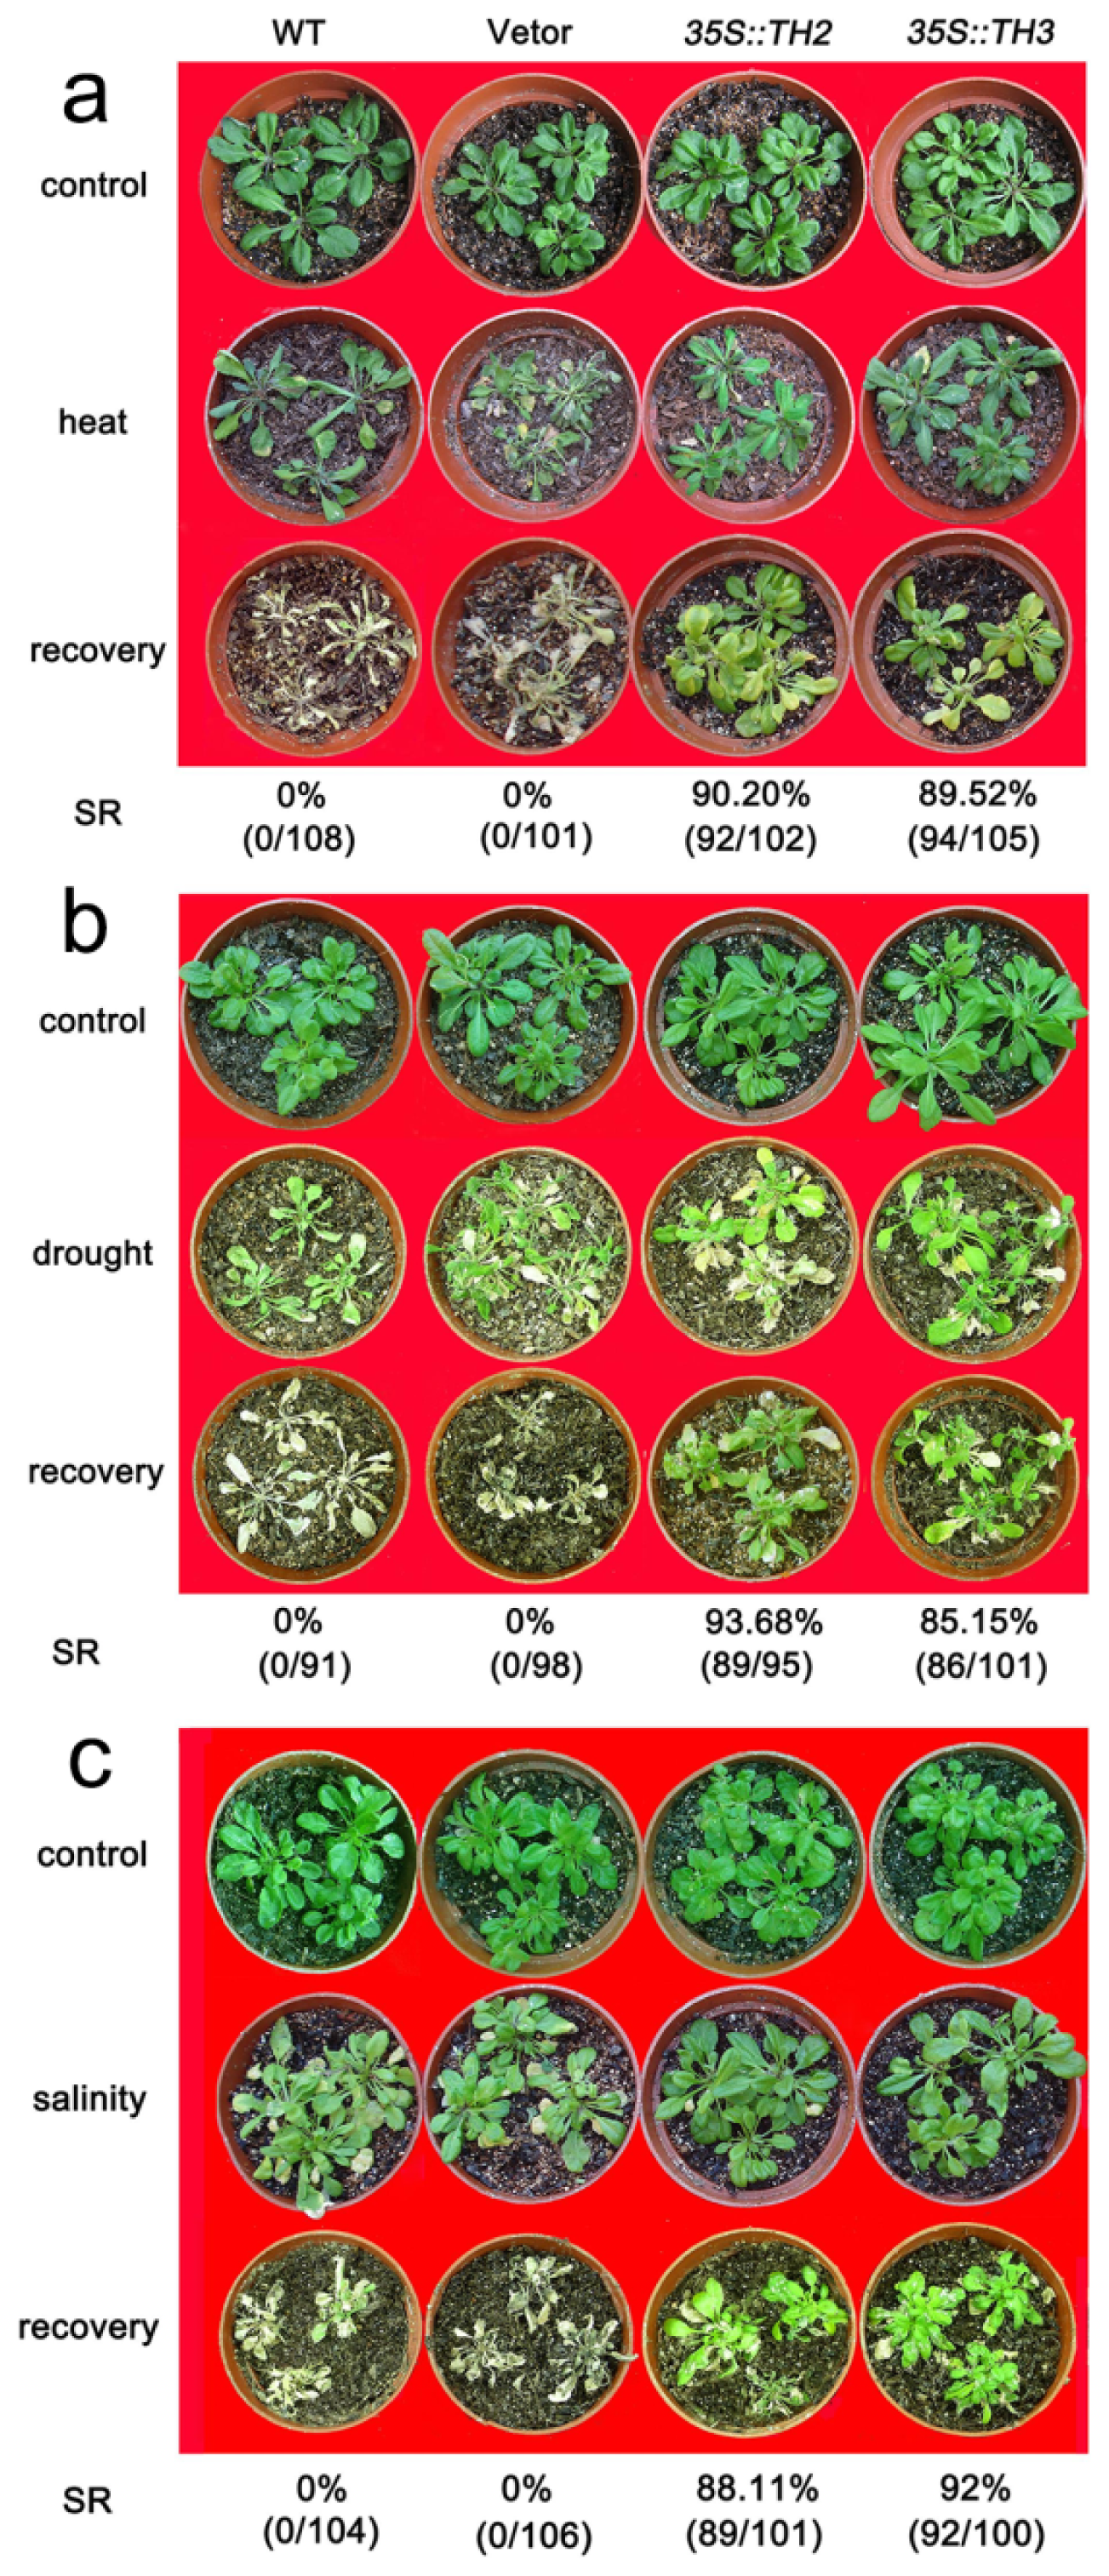
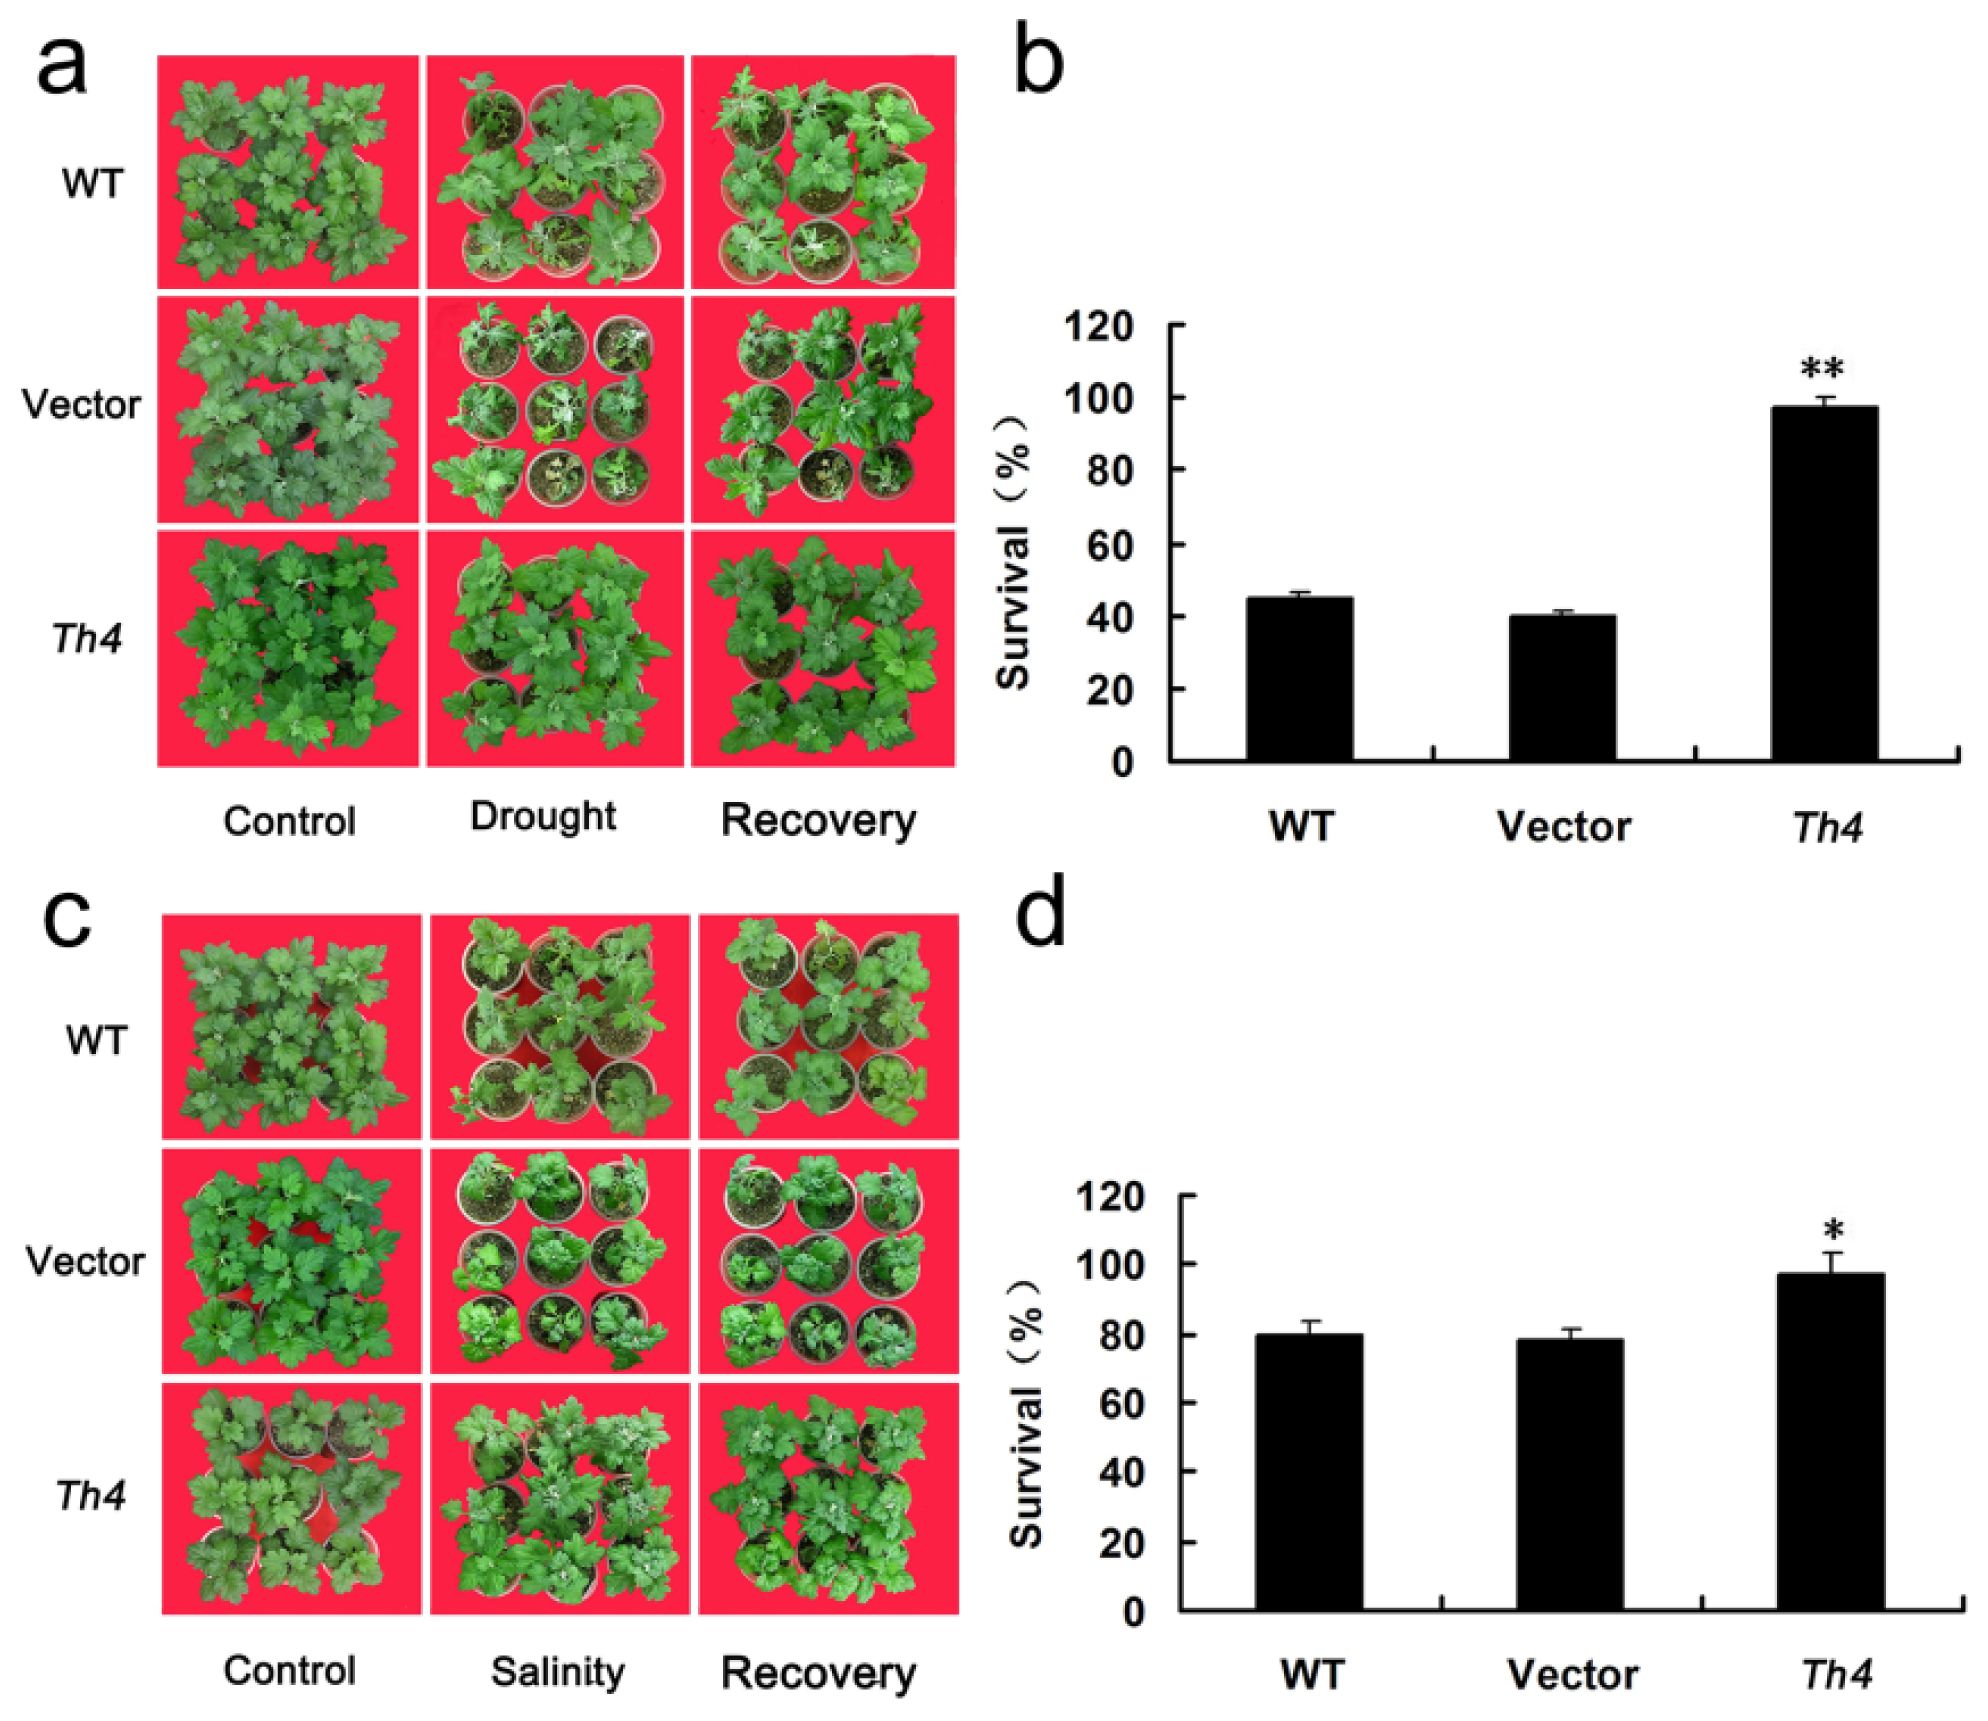
2.5. The Constitutive Expression of CgHSP70 Enhances the Abiotic Stress Tolerance of Chrysanthemum

The semi-lethal temperatures (LT50) of Th1 and Th4 plants were significantly higher than those of either WT or EV plants (Table 1). Since Th1 and Th4 behaved very similarly, subsequent tests focused only on Th4. Heat stress caused the leaves of WT and EV plants to begin wilting within 3 h of the imposition of stress, and by 24 h they appeared to be extensively wilted; in contrast, Th4 plants showed no signs of wilting until 12 h after the imposition of stress, although by 24 h they were also heavily affected (Figure 6a). During the recovery stage, leaf damage occurred earlier and was more serious in the WT and EV plants (Figure 6b). Survival after a ten day recovery period was zero for WT and EV plants, but 98.1% for Th4 (Figure 6c).
In response to drought stress, the damage symptoms (wilting, chlorosis, necrosis and death) was more severe for WT and EV than for Th4 plants (Figure 7a). The survival rate of WT and EV plants post recovery was, respectively, 45% and 40%, whereas it was 100% for Th4 (Figure 7b). As the concentration of salt was raised, WT and EV plants became increasingly wilted (Figure 7c). The rate of WT and EV plants post-treatment survival was, respectively 75% and 80% (Figure 7d). Th4 plants experienced only slight wilting in the lower part of the plant, and their post-treatment survival was 100%.
The transgenic improvement of chrysanthemum’s tolerance to abiotic stress has been the goal of a number of researchers. Thus, for example, Chen et al. showed that the over-expression of CgDREBa (which encodes a DREB transcription factor) has a positive effect on drought and salinity tolerance [25], while a similar experiment using the A. thaliana gene AtDREB1A conferred heat tolerance [26]. The constitutive expression of the transcription factor CdICE1 also succeeded in enhancing the level of tolerance to low temperature, salinity and drought [27]. Here, the over-expression of CgHSP70 markedly increased heat tolerance, which provides support to the suggestion made by Hong et al. [26]. It also had a positive effect on chrysanthemum’s drought tolerance as well as salinity tolerance.

2.6. Physiological Changes in CgHSP70 Over-Expression Chrysanthemum in Response to Abiotic Stresses

As is well known, heat, drought or salinity stresses would cause a marked increase in oxidative damage to plants [2830]. High ROS levels are known to increase lipid peroxidation, allowing MDA concentration to be used as an indicator of oxidative stress peroxidation of membrane lipids [31]. An in principle straightforward means to achieve this is to promote the activity of enzymes involved in oxidative protection, such as peroxidase (POD), superoxide dismutase, ascorbate peroxidase and glutathione reductase, and to enhance the presence of anti-oxidant molecules, such as proline [32]. Here, POD activity increased after heat stress, drought and salinity treatments, but POD activity in Th4 was greater than that in WT and vector transformants at 24 h after treatments (Figure 8a–c). In addition, transgenic CgHSP70 enhanced the presence of anti-oxidant molecules proline (Figure 8d–f), resulting in less membrane lipid peroxidation, displayed as less MDA content (Figure 8g–i). The results implied that reactive oxygen species (ROS)-induced damage to membranes in the CgHSP70 over-expressors was less severe than that in the WT plants. The observations in the present study are consistent with previous reports in kidney cells, which showed that Hsp70 could regulate cellular redox status in response to ischemic stress, which may be important in Hsp70’s cytoprotective effects [33]. Chloroplasts are particularly vulnerable to ROS-induced damage [34], Chlamydomonas reinhardtii HSP70B, encoding a chloroplast-localized chaperone, may participate in vivo both in the molecular protection of the photosystem II reaction centers during photoinhibition and in the process of photosystem II repair [35]. It is suggested that CgHSP70 over-expression may alleviate ROS damage to the chloroplasts. Collectively, overexpression of CgHSP70 might reduce ROS and maintain secondary metabolism (higher proline content) in chrysanthemum transformants under heat, drought and salinity stress, which might partially contribute to less stress damage and higher survival rate, although other mechanisms were clearly also in play. Over-expression of AtDREB1A in chrysanthemum enhances tolerance to heat stress, where higher CO2 assimilation rates, Rubisco activity and sucrose-6-phosphate synthase (SPS) activity may contribute to the heat tolerance enhancement [26], inferring that photosynthetic gas-exchange assays should contribute to the understanding of mechanisms involved in the stress tolerance in CgHSP70 over-expressed chrysanthemum, and will be a focus of our ongoing research.

3. Experimental Section

3.1. Plant Materials

The chrysanthemum varieties “Zhongshanzigui” and “Jinba” were both obtained from the Chrysanthemum Germplasm Resource Conservation Centre (Nanjing Agricultural University, Nanjing, China). Rooted cuttings were potted into a 1:1 (v/v) mixture of soil and vermiculite and grown in a greenhouse held at 23 ± 2 °C, 12 h photoperiod and 70% relative humidity (RH). A. thaliana ecotype Columbia plants were grown in a 1:1:1 (v/v/v) mixture of perlite, vermiculite and soilrite under a 16 h photoperiod (80–100 μm−2·s−1 illumination), with a day/night temperature of 23 °C/18 °C.

3.2. Isolation of CgHSP70

Total RNA was isolated from “Zhongshanzigui” leaves using the RNAiso reagent (TaKaRa, Tokyo, Japan), following the manufacturer’s instructions. The first cDNA strand was synthesized from 1 μg total RNA using SuperScript III reverse transcriptase (Invitrogen, Carlsbad, CA, USA), according to the manufacturer’s instructions. A fragment of the CgHSP70 sequence was obtained by amplification of the cDNA library directed by a primer pair designed from the chrysanthemum EST AB503697 [36]. This was followed by 3′-RACE PCR, for which the primers used were HSP1, HSP2 and Adaptor-R (the sequences of these and the further primers mentioned below are given in Table 2); the resulting amplicon was gel-purified using a Biospin Gel Extraction kit (BioFlux, Hangzhou, China) and cloned into the pMD19-T easy (TaKaRa, Tokyo, Japan) vector for sequencing. Finally, the primer pair Q2-F/-R was designed to capture the putative 5′- and 3′-UTRs, and the resulting full-length cDNA was then cloned into pMD19-T easy for sequencing. The CgHSP70 open reading frame (ORF) was amplified from this template using the primer pair HSP-ORF-F2/R2, which allowed for the inclusion of a SmaI and an XbaI cloning site.

3.3. Intracellular Localization of CgHSP70

The intracellular localization of the CgHSP70 product was identified using a transient assay in onion epidermal cells. The CgHSP70 ORF, lacking its stop codon, was amplified using a Phusion® High-Fidelity PCR kit (New England Biolabs, Ipswich, MA, USA) with the primer pair CgHSP-Dra-F/-Not-R (Table 2), and the resulting amplicon cloned into pMD19-T for validation by sequencing. The same fragment was also inserted into the DraI and NotI cloning sites of the pENTR™ 1A dual selection vector (Invitrogen, Carlsbad, CA, USA) using T4 DNA ligase (TaKaRa, Tokyo, Japan), and from there introduced into pEarleyGate 103 using LR Clonase™ II enzyme mix (Invitrogen, Carlsbad, CA, USA) [37]. The latter construct includes the expression marker gene GFP. Transient expression was induced biolistically and was monitored by detection of green fluorescent protein (GFP), using confocal laser microscopy [38].

3.4. Transformation of A. thaliana

The pCAMBIA1301 cassette, containing the CaMV-35S promoter, the hptII gene and the nos terminator was modified by substituting the SacI restriction site for an XbaI one, using the primer sets 1301-F/-R1 and 1301-F/-R2 (Table 2). The HSP70 ORF was cleaved by restriction with SmaI and XbaI and introduced into SmaI and XbaI digested pCAMBIA1301 to produce pCAMBIA1301-CgHSP70. Both pCAMBIA1301 and pCAMBIA1301-CgHSP70 were transformed into Agrobacterium tumefaciens EHA105 using the freezing transformation method. A. thaliana was transformed with either pCAMBIA1301 or pCAMBIA1301-CgHSP70 using the floral dip method [39], and putative transformants were selected by germination on Murashige and Skoog medium containing 50 μg/mL hygromycin. Positive selections were advanced to the T2 and T3 generations, with RT-PCR analysis, based on the primer pair HSP-F/-R, being applied to select true transformants. The wild type, transformants carrying an empty vector, transformants carrying pCAMBIA1301 and transformants carrying pCAMBIA1301-CgHSP70 are referred to hereafter as, respectively, “WT”, “EV”, “35S:TH2” and “35S:TH3”.

3.5. Stress Tolerance of Transgenic A. thaliana

A set of two-week old WT, EV, 35S:TH2 and 35S:TH3 plants were well watered and then exposed to a 24 h period at 45 °C under continuous illumination (~100 μmol·m−2·s−1). They were left to recover at 25 °C for one week before noting the survival rate and recording any changes to morphology. Drought tolerance was measured on a similar set of WT, EV, 35S:TH2 and 35S:TH3 plants by withholding water for 24 days; survival was recorded seven days after re-watering [38]. To assess salinity tolerance, an identical set of plants was exposed to 300 mM NaCl for five days after being sequentially watered with 100, 200 mM NaCl at five day intervals [40]. Plant survival was recorded after a one-week recovery period.

3.6. Transformation of Chrysanthemum

Leaf disks (0.5 cm diameter) taken young leaves of “Jinba” plants were used as explant. The pCAMBIA1301 and pCAMBIA1301-CgHSP70 cassettes were introduced separately using A. tumefaciens EHA105-mediated leaf disk transformation [41], and selection for transformants was achieved by including 10 μg/mL in the culture medium. Surviving plantlets were potted into a sterile mixture of 1:1 (v/v) soil and vermiculite and grown in a greenhouse. A PCR test based on the genomic DNA of these plants and targeting the hptII gene (primer pair HptII-F/-R, see Table 2) was used to confirm successful transformation. Individuals carrying pCAMBIA1301-CgHSP70 are referred to hereafter as “Th”, and those that carry the pCAMBIA1301 as “EV”. Real time quantitative PCR (RT-qPCR) was used to determine HSP70 transcript abundance following Gu et al. [42]. Total RNA was extracted from the shoot tips of WT, EV and Th plants at the 6–10 leaf stage using the Trizol reagent (Invitrogen, Carlsbad, CA, USA), and treated with DNaseI (TaKaRa, Tokyo, Japan) to remove any contaminating DNA. cDNA was synthesized using Reverse Transcriptase M-MLV (RNase H) (TaKaRa, Tokyo, Japan). The qRT-PCRs were run on a Bio-Rad iQ5 PCR platform (Hercules, CA, USA) using SYBR Green qPCR SuperMix Universal (Invitrogen, Carlsbad, CA, USA). The reference sequence was a fragment of the chrysanthemum GAPDH gene (DK941612) [42], assayed with primer pair GAPDH-F/-R, while CgHSP70 was assayed with the primer pair HSP-F/-R (Table 2). Three replicates of each RT-qPCR were performed, and the data are presented in the form mean ± SE. Relative transcription levels were calculated by the 2−ΔΔCt method [43].

3.7. Evaluation of the Abiotic Stress Tolerance of Transgenic Chrysanthemum

Rooted cuttings of transgenic and non-transgenic chrysanthemum were potted into a 1:1 (v/v) mixture of soil and vermiculite and grown in a greenhouse (23 ± 2 °C, 12 h photoperiod, 70% RH) until they reached the 6–10 leaf stage. Each assay was based on 20 plants per line.

3.7.1. Heat Tolerance

The plants were subjected to a 24 h exposure at 45 °C under continuous illumination (~100 μmol·m−2· s−1) and subsequently were allowed to recover for one week following description of Hong et al. [26]. The plants were photographed before the heat stress, and then after 1, 3, 6, 12 and 24 h. In addition, the semi-lethal high temperature (LT50) parameter, as used to quantify low temperature tolerance [27], was obtained as follows: 0.1 g of chopped leaf (0.5 cm2 pieces) was placed in 20 mL deionized water and heated to either 40, 45, 50, 55 or 60 °C for 20 min (four replicates per temperature). The electrical conductivity (EC) of water was measured to generate a relative conductivity (REC%) value, being the ratio of the EC measured before heating and after heating. The REC% was fitted to the logistic function K/(1 + ae−bx), where x was the temperature and K the saturation capacity of cell damage rate calculated using Rcpsys [44]. The LT50 was given by ln[(1/a)]/b.

3.7.2. Drought Tolerance

The procedure followed that described by Hong et al. [45]. Water was withheld for nine days from plants at the 8–10 leaf stage. The growing environment was adjusted to 30 °C, 30% RH. After the stress period, the plants were kept fully watered for two weeks (23 ± 2 °C, 70% RH), and the survival rate was then counted.

3.7.3. Salinity Tolerance

After withholding water for four days, the plants were subjected to 300 mM NaCl for five days after being sequentially watered with 100, 200 mM NaCl at five days intervals, respectively [40]. The plants were uprooted to rinse their roots, and were then replanted into fresh soil and left to recover for two weeks, after which their survival rate was recorded.

3.7.4. Measurement of Physiological Indices

POD activity, MDA and proline content of transgenic plants under heat, drought and salinity stress were measured. POD activity was estimated from the absorbance change at 470 nm caused by the oxidation of guaiacol according to the method of He et al. [46]. One unit of POD activity was defined to be equivalent to the amount of enzyme required to degrade 0.01 μmol of substrate per min per mg protein. Protein concentration was measured based on the method of Bradford [47], using bovine serum albumin as a standard. Lipid peroxidation was measured in terms of malondialdehyde (MDA) concentration. MDA concentration was determined using the thiobarbituric acid method according to Yin et al. [48]. The level of lipid peroxidation was expressed as nmol·g−1 fresh weight. Proline concentration was determined by the ninhydrin method following Guha et al. [49] with minor modifications. A 0.5 g leaf sample was homogenized in 10 mL 3% (w/v) aqueous sulfosalicylic acid, and the homogenate was centrifuged at 12,000× g for 10 min. The supernatant was boiled in 3 mL acid ninhydrin for 30 min, cooling to room temperature. The absorbance of the supernatant was recorded at 520 nm. Proline concentration was expressed as μg·g−1 fresh weight.

3.8. Statistical Analysis

The data were analysed using SPSS v17.0 software (SPSS Inc., Chicago, IL, USA). The percent data were angular transformed before conducting an analysis of variance, then Tukey’s test was used to identify means differing significantly from one another.

4. Conclusions

The heterologous expression of an HSP70 cDNA from chrysanthemum variety “Zhongshanzigui” in A. thaliana has a positive effect on stress tolerance. Furthermore, when constitutively expressed in the cut chrysanthemum variety “Jinba”, levels of tolerance to heat, drought and salinity were all improved.

Acknowledgments

This work was supported by the National Natural Science Foundation of China (Grant No. 31272202), the Program for Hi-Tech Research, Jiangsu, China (Grant No. BE2012350, BE2011325) and the Program for New Century Excellent Talents in University of the Chinese Ministry of Education (Grant No. NCET-10-0492).

Conflicts of Interest

The authors declare no conflict of interest.

References

  1. Schöffl, F.; Prandl, R.; Reindl, A. Molecular responses to heat stress. In Molecular Responses to Cold, Drought, Heat and Salt Stress in Higher Plants; RG Landes Co.: Austin, TX, USA, 1999; Volume 81. [Google Scholar]
  2. Boston, R.S.; Viitanen, P.V.; Vierling, E. Molecular chaperones and protein folding in plants. In Post-Transcriptional Control of Gene Expression in Plants; Springer: Dordrecht, The Netherlands, 1996; pp. 191–222. [Google Scholar]
  3. Flaherty, K.M.; DeLuca-Flaherty, C.; McKay, D.B. Three-dimensional structure of the ATPase fragment of a 70 K heat-shock cognate protein. Nature 1990, 346, 623–628. [Google Scholar]
  4. Hartl, F.U.; Hayer-Hartl, M. Molecular chaperones in the cytosol: From nascent chain to folded protein. Science 2002, 295, 1852–1858. [Google Scholar]
  5. Zhu, X.; Zhao, X.; Burkholder, W.F.; Gragerov, A.; Ogata, C.M.; Gottesman, M.E.; Hendrickson, W.A. Structural analysis of substrate binding by the molecular chaperone DnaK. Science 1996, 272, 1606–1614. [Google Scholar]
  6. Lee, J.H.; Schöffl, F. An Hsp70 antisense gene affects the expression of HSP70/HSC70 the regulation of HSF and the acquisition of thermotolerance in transgenic Arabidopsis thaliana. Mol. Gen. Genet. 1996, 252, 11–19. [Google Scholar]
  7. Ono, K.; Hibino, T.; Kohinata, T.; Suzuki, S.; Tanaka, Y.; Nakamura, T.; Takabe, T. Overexpression of DnaK from a halotolerant cyanobacterium Aphanothece halophytica enhances the high-temperatue tolerance of tobacco during germination and early growth. Plant Sci. 2001, 160, 455–461. [Google Scholar]
  8. Sung, D.Y.; Guy, C.L. Physiological and molecular assessment of altered expression of Hsc70-1 in Arabidopsis Evidence for pleiotropic consequences. Plant Physiol. 2003, 132, 979–987. [Google Scholar]
  9. Alvim, F.C.; Carolino, S.M.; Cascardo, J.C.; Nunes, C.C.; Martinez, C.A.; Otoni, W.C.; Fontes, E.P. Enhanced accumulation of BiP in transgenic plants confers tolerance to water stress. Plant Physiol. 2001, 126, 1042–1054. [Google Scholar]
  10. Sugino, M.; Hibino, T.; Tanaka, Y.; Nii, N.; Takabe, T. Overexpression of DnaK from a halotolerant cyanobacterium Aphanothece halophytica acquires resistance to salt stress in transgenic tobacco plants. Plant Sci. 1999, 146, 81–88. [Google Scholar]
  11. Cho, E.K.; Choi, Y.J. A nuclear-localized HSP70 confers thermoprotective activity and drought-stress tolerance on plants. Biotechnol. Lett. 2009, 31, 597–606. [Google Scholar]
  12. Montero-Barrientos, M.; Hermosa, R.; Nicolás, C.; Cardoza, R.E.; Gutiérrez, S.; Monte, E. Overexpression of a Trichoderma HSP70 gene increases fungal resistance to heat and other abiotic stresses. Fungal Genet. Biol. 2008, 45, 1506–1513. [Google Scholar]
  13. Boorstein, W.R.; Ziegelhoffer, T.; Craig, E.A. Molecular evolution of the HSP70 multigene family. J. Mol. Evol. 1994, 38, 1–17. [Google Scholar]
  14. Tom, M.; Douek, J.; Yankelevich, I.; Bosch, T.C.; Rinkevich, B. Molecular characterization of the first heat shock protein 70 from a reef coral. Biochem. Biophy. Res. Commun. 1999, 262, 103–108. [Google Scholar]
  15. Horton, P.; Park, K.-J.; Obayashi, T.; Fujita, N.; Harada, H.; Adams-Collier, C.; Nakai, K. WoLF PSORT: Protein localization predictor. Nucleic Acids Res. 2007, 35, W585–W587. [Google Scholar]
  16. Mayer, M.; Bukau, B. Hsp70 chaperones: Cellular functions and molecular mechanism. Cell. Mol. Life Sci. 2005, 62, 670–684. [Google Scholar]
  17. Rensing, S.; Maier, U.-G. Phylogenetic analysis of the stress-70 protein family. J. Mol. Evol. 1994, 39, 80–86. [Google Scholar]
  18. Laszlo, A.; Davidson, T.; Hu, A.; Landry, J.; Bedford, J. Putative determinants of the cellular response to hyperthermia. Int. J. Radiat. Biol. 1993, 63, 569–581. [Google Scholar]
  19. Snoeckx, L.; Contard, F.; Samuel, J.; Marotte, F.; Rappaport, L. Expression and cellular distribution of heat-shock and nuclear oncogene proteins in rat hearts. Am. J. Physiol. Heart C 1991, 261, H1443–H1451. [Google Scholar]
  20. Wang, S.; Xie, W.; Rylander, M.N.; Tucker, P.W.; Aggarwal, S.; Diller, K.R. HSP70 kinetics study by continuous observation of HSP-GFP fusion protein expression on a perfusion heating stage. Biotechnol. Bioeng. 2008, 99, 146–154. [Google Scholar]
  21. Guinez, C.; Morelle, W.; Michalski, J.C.; Lefebvre, T. O-GlcNAc glycosylation: A signal for the nuclear transport of cytosolic proteins? Int. J. Biochem. Cell Biol. 2005, 37, 765–774. [Google Scholar]
  22. Qi, Y.; Wang, H.; Zou, Y.; Liu, C.; Liu, Y.; Wang, Y.; Zhang, W. Over-expression of mitochondrial heat shock protein 70 suppresses programmed cell death in rice. FEBS Lett. 2011, 585, 231–239. [Google Scholar]
  23. Park, H.-S.; Jeong, W.-J.; Kim, E.; Jung, Y.; Lim, J.M.; Hwang, M.S.; Park, E.-J.; Ha, D.-S.; Choi, D.-W. Heat shock protein gene family of the Porphyra seriata and enhancement of heat stress tolerance by PsHSP70 in Chlamydomonas. Mar. Biotechnol. 2012, 14, 332–342. [Google Scholar]
  24. Cho, E.K.; Hong, C.B. Over-expression of tobacco NtHSP70–1 contributes to drought-stress tolerance in plants. Plant Cell Rep. 2006, 25, 349–358. [Google Scholar]
  25. Chen, S.; Cui, X.; Chen, Y.; Gu, C.; Miao, H.; Gao, H.; Chen, F.; Liu, Z.; Guan, Z.; Fang, W. CgDREBa transgenic chrysanthemum confers drought and salinity tolerance. Environ. Exp. Bot. 2011, 74, 255–260. [Google Scholar]
  26. Hong, B.; Ma, C.; Yang, Y.; Wang, T.; Yamaguchi-Shinozaki, K.; Gao, J. Over-expression of AtDREB1A in chrysanthemum enhances tolerance to heat stress. Plant Mol. Biol. 2009, 70, 231–240. [Google Scholar]
  27. Chen, L.; Chen, Y.; Jiang, J.; Chen, S.; Chen, F.; Guan, Z.; Fang, W. The constitutive expression of Chrysanthemum dichrum ICE1 in Chrysanthemum grandiflorum improves the level of low temperature salinity and drought tolerance. Plant Cell Rep. 2012, 31, 1747–1758. [Google Scholar]
  28. Rivero, R.M.; Mestre, T.C.; Mittler, R.; Rubio, F.; Garcia-Sanchez, F.; Martinez, V. The combined effect of salinity and heat reveals a specific physiological biochemical and molecular response in tomato plants. Plant Cell Environ. 2013. [Google Scholar] [CrossRef]
  29. Sun, J.; Gu, J.; Zeng, J.; Han, S.; Song, A.; Chen, F.; Fang, W.; Jiang, J.; Chen, S. Changes in leaf morphology antioxidant activity and photosynthesis capacity in two different drought-tolerant cultivars of chrysanthemum during and after water stress. Sci. Hortic. 2013, 161, 249–258. [Google Scholar]
  30. Turóczy, Z.; Kis, P.; Török, K.; Cserháti, M.; Lendvai, A.; Dudits, D.; Horváth, G.V. Overproduction of a rice aldo–keto reductase increases oxidative and heat stress tolerance by malondialdehyde and methylglyoxal detoxification. Plant Mol. Biol. 2011, 75, 399–412. [Google Scholar]
  31. Farmer, E.E.; Mueller, M.J. ROS-mediated lipid peroxidation and RES-activated signaling. Annu. Rev. Plant Biol. 2013, 64, 429–450. [Google Scholar]
  32. Apel, K.; Hirt, H. Reactive oxygen species: metabolism oxidative stress and signal transduction. Annu. Rev. Plant Biol. 2004, 55, 373–399. [Google Scholar]
  33. Guo, S.; Wharton, W.; Moseley, P.; Shi, H. Heat shock protein 70 regulates cellular redox status by modulating glutathione-related enzyme activities. Cell Stress Chaperon. 2007, 12, 245. [Google Scholar]
  34. Foyer, C.H.; Shigeoka, S. Understanding oxidative stress and antioxidant functions to enhance photosynthesis. Plant Physiol. 2011, 155, 93–100. [Google Scholar]
  35. Schroda, M.; Vallon, O.; Wollman, F.-A.; Beck, C.F. A chloroplast-targeted heat shock protein 70 (HSP70) contributes to the photoprotection and repair of photosystem II during and after photoinhibition. Plant Cell 1999, 11, 1165–1178. [Google Scholar]
  36. Chen, S.; Miao, H.; Chen, F.; Jiang, B.; Lu, J.; Fang, W. Analysis of expressed sequence tags (ESTs) collected from the inflorescence of chrysanthemum. Plant Mol. Biol. Rep. 2009, 27, 503–510. [Google Scholar]
  37. Earley, K.W.; Haag, J.R.; Pontes, O.; Opper, K.; Juehne, T.; Song, K.; Pikaard, C.S. Gateway-compatible vectors for plant functional genomics and proteomics. Plant J. 2006, 45, 616–629. [Google Scholar]
  38. Gao, H.; Song, A.; Zhu, X.; Chen, F.; Jiang, J.; Chen, Y.; Sun, Y.; Shan, H.; Gu, C.; Li, P. The heterologous expression in Arabidopsis of a Chrysanthemum Cys2/His2 zinc finger protein gene confers salinity and drought tolerance. Planta 2012, 235, 979–993. [Google Scholar]
  39. Clough, S.J.; Bent, A.F. Floral dip: A simplified method forAgrobacterium-mediated transformation of Arabidopsis thaliana. Plant J. 1998, 16, 735–743. [Google Scholar]
  40. Jung, C.; Seo, J.S.; Han, S.W.; Koo, Y.J.; Kim, C.H.; Song, S.I.; Nahm, B.H.; Choi, Y.D.; Cheong, J.-J. Overexpression of AtMYB44 enhances stomatal closure to confer abiotic stress tolerance in transgenic Arabidopsis. Plant Physiol. 2008, 146, 623–635. [Google Scholar]
  41. He, J.; Chen, F.; Chen, S.; Fang, W.; Miao, H.; Luo, H. Transformation of Lycoris longituba agglutinin gene to cut chrysanthemum and identification of aphid resistance in the transgenic plants. Acta Bot. Boreali-Occident. Sin. 2009, 29, 2318–2325. [Google Scholar]
  42. Gu, C.; Chen, S.; Liu, Z.; Shan, H.; Luo, H.; Guan, Z.; Chen, F. Reference gene selection for quantitative real-time PCR in chrysanthemum subjected to biotic and abiotic stress. Mol. Biotechnol. 2011, 49, 192–197. [Google Scholar]
  43. Livak, K.J.; Schmittgen, T.D. Analysis of relative gene expression data using real-time quantitative PCR and the 2(−ΔΔC(T)) Method. Methods 2001, 25, 402–408. [Google Scholar]
  44. Gai, J. Statistics for Experiments; Agric Press: Beijing, China, 2000. [Google Scholar]
  45. Hong, B.; Tong, Z.; Ma, N.; Li, J.; Kasuga, M.; Yamaguchi-Shinozaki, K.; Gao, J. Heterologous expression of the AtDREB1A gene in chrysanthemum increases drought and salt stress tolerance. Sci. China C Life Sci. 2006, 49, 436–445. [Google Scholar]
  46. He, J.; Chen, F.; Chen, S.; Lv, G.; Deng, Y.; Fang, W.; Liu, Z.; Guan, Z.; He, C. Chrysanthemum leaf epidermal surface morphology and antioxidant and defense enzyme activity in response to aphid infestation. J. Plant Physiol. 2011, 168, 687–693. [Google Scholar]
  47. Bradford, M.M. A rapid and sensitive method for the quantitation of microgram quantities of protein utilizing the principle of protein-dye binding. Anal. Biochem. 1976, 72, 248–254. [Google Scholar]
  48. Yin, D.; Chen, S.; Chen, F.; Guan, Z.; Fang, W. Morphological and physiological responses of two chrysanthemum cultivars differing in their tolerance to waterlogging. Environ. Exp. Bot. 2009, 67, 87–93. [Google Scholar]
  49. Guha, A.; Sengupta, D.; Rasineni, G.K.; Reddy, A.R. An integrated diagnostic approach to understand drought tolerance in mulberry (Morus indica L). Flora 2010, 205, 144–151. [Google Scholar]
Figure 1. (a) Alignment of the deduced peptide sequences of CgHSP70 and those of related HSPs. Continuous dark line: ATPase domain, continuous grey line: peptide-binding domain, broken line: C-terminal signature motifs for organelle localization; (b) Phylogeny of CgHSP70 and related HSPs. Bootstrap values indicate the separation between adjacent branches and the scale bar represents 0.05 substitutions per site. The polypeptides along with their GenBank accession numbers are: AaHSP60 (ABX76300), AaHSP90 (ABX76302), AaHSP70 (ABX76301), AtHSP22 (NP_192763.1), AtHSP101 (AAF26423), AtHSP70 (NP_195870), HvHSP17 (CAA69172), MtHSP20 (ABD32352), VvHSP17 (ACZ48684), VvHSP101 (AAX08108), ZmHSP26 (NP_001105583), ZmHSP90 (ACO35045), ZmHSP70 (CAA27330), ZmHSP101 (AAD26530), NtHSP26 (BAA29065), NtHSP90 (AAS79798), NtHSP70 (AAP04522), DgHSP90 (ACX37414), DgHSP70 (ACD45076), TaHSP90 (ADF31771), TaHSP101 (AAF01280), OsHSP90 (BAA90487), OsHSP70 (CAA47948), CgHSP70 (AB503697), SmHSP70 (AAV97978), CsHSP70 (CAB72130). CgHSP70 highlighted by a black box.
Ijms 15 05063f1
Figure 2. Sub-cellular localization of CgHSP70 in transiently transformed onion epidermal cells. (ac) Onion epidermal cells transiently expressing 35S::CgHSP70-GFP; (df) Onion epidermal cells transformed with a control construct (35S::GFP); (a,d) Dark field images to capture GFP fluorescence; (b,e) bright field images to capture cell features; (c,f) merged images. Scale bar: 25 μm.
Ijms 15 05063f2
Figure 3. Transcription of CgHSP70 in transgenic plants and non-transgenic A. thaliana.
Ijms 15 05063f3
Figure 4. Stress tolerance of A. thaliana plants expressing CgHSP70. (a) The appearance of plants after exposure to 45 °C for 24 h and their survival rate recorded after a one week recovery period; (b) The appearance of plants after exposure to drought stress for 24 days and their survival rate recorded after a one week recovery period; (c) The appearance of plants after exposure to salinity stress for 15 days, and their survival rate recorded after a one week recovery period.
Ijms 15 05063f4
Figure 5. Chrysanthemum transformed with CgHSP70. (a) PCR assay for the presence of hptII in presumptive transgenic chrysanthemum regenerants. M: molecular size marker; (b) CgHSP70 transcript abundance as measured by RT-qPCR.
Ijms 15 05063f5
Figure 6. The heat tolerance of transgenic chrysanthemum. (a) The appearance of plants (WT, EV and Th4) after exposure to 45 °C for 0–24 h; (b) The appearance of plants (WT, EV and Th4) during the recovery phase; (c) The survival rate of transgenic and non-transgenic plants exposed to one week of high temperature. Error bars calculated from three replicates.
Ijms 15 05063f6
Figure 7. The drought and salinity tolerance of transgenic chrysanthemum. (a) The appearance of WT, EV and Th4 plants subjected to a 24 days period of no watering, and during the recovery period; (b) The survival rate of WT, EV and Th4 after a two-week recovery period. Error bars based on three replicates. Mean performances differing significantly from the WT and EV performance, as derived from a Tukey’s test, indicated by asterisks (** p < 0.01); (c) The appearance of WT, EV and Th4 plants subjected to salinity stress and during the recovery period; (d) The survival rate of WT, EV and Th4 after a two-week recovery period. Error bars are based on three replicates. Mean performances differing significantly from the WT and EV performance, as derived from a Tukey’s test, indicated by asterisks (* p < 0.05).
Ijms 15 05063f7
Figure 8. The ROS scavenging efficiency enhanced in the transgenic chrysanthemum. (ac) leaf POD activity; (df) leaf proline content; (gi) leaf MDA content during the treatment period. a, d and g: heat stress treatment; b, e and f: drought treatment; g, h and i: salinity treatment. Error bars are based on three replicates.
Ijms 15 05063f8
Table 1. semi-lethal temperature (LT50) of transgenic plants and non-transgenic plants.
Plant linesSemi-lethal temperature LT50 (°C)
WT47.7 ± 02 A
Vector47.9 ± 0.6 A
Th150.2 ± 0.2 B
Th450.3 ± 0.3 B
Values with different superscripts indicate significant differences at p < 0.01 by Tukey’s test. Values represent mean ± S.E.
Table 2. The PCR primers used in this study.
PrimerSequences (5′-3′)Annotation
HSP1TCAGTCCAAAGCGACATCAAAFor 3′-RACE
HSP2CAGCCTACTTCAACGACTCACFor 3′-RACE
Adaptor-RAGCAGTGGTATCAACGCAGAGUniversal primers for 3′-RACE
Q2-FCACAAACCCTAATTCTTTTTCATACAFull length cloning
Q2-RAGTAGAACAGATAAATATCGACCACAFull length cloning
HSP-ORF-F2CcccgggATGGCTGGTAAAGGGTGAAOpen reading frame (ORF) cloning
HSP-ORF-R2GCtctagaGTCGACCTCTTCGATCTTGGOpen reading frame (ORF) cloning
CgHSP-Dra-FAGGCtttaaaATGGCTGGTAAAGGTGAIntracellular localisation of CgHSP70
CgHSP-Not-RGTgcggccgcGAGTCGACCTCTIntracellular localisation of CgHSP70
1301-FTCCcccgggGTTATGACGCTGGGAATGTTTTpCAMBIA1301 vector modified
1301-R1GCtctagaAGATAATGCCACAGCACCTCTTpCAMBIA1301 vector modified
1301-R2cGAGCTCtctagaAGATAATGCCACAGCACCTCTTpCAMBIA1301 vector modified
GAPDH-FGCTGTATCCCCATTCGTTqRT-PCR
GAPDH-RAGAAGGCAAGCTCAAGGGqRT-PCR
HSP-FGCTTGCTGAGGCTGATGAGTqRT-PCR
HSP-RACCTGATGGTGCGGGTTCCTCqRT-PCR
HptII-FCTCGATGAG CTGATGCTTTGGGverifying positive transformants
HptII-RGCTTCTGCGGGCGATTTGTGTAVerifying positive transformants

