2.1. Assignment of Vibrational Modes
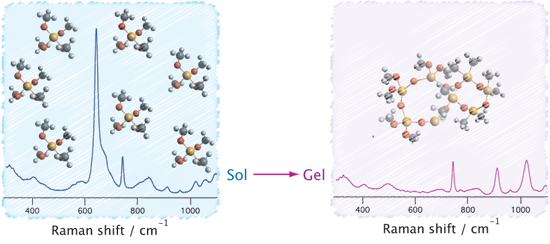
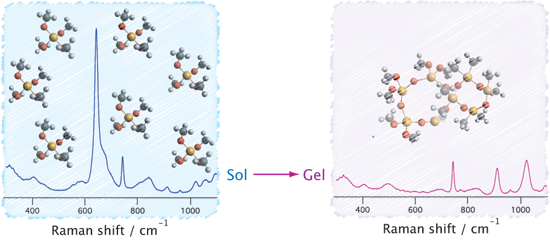
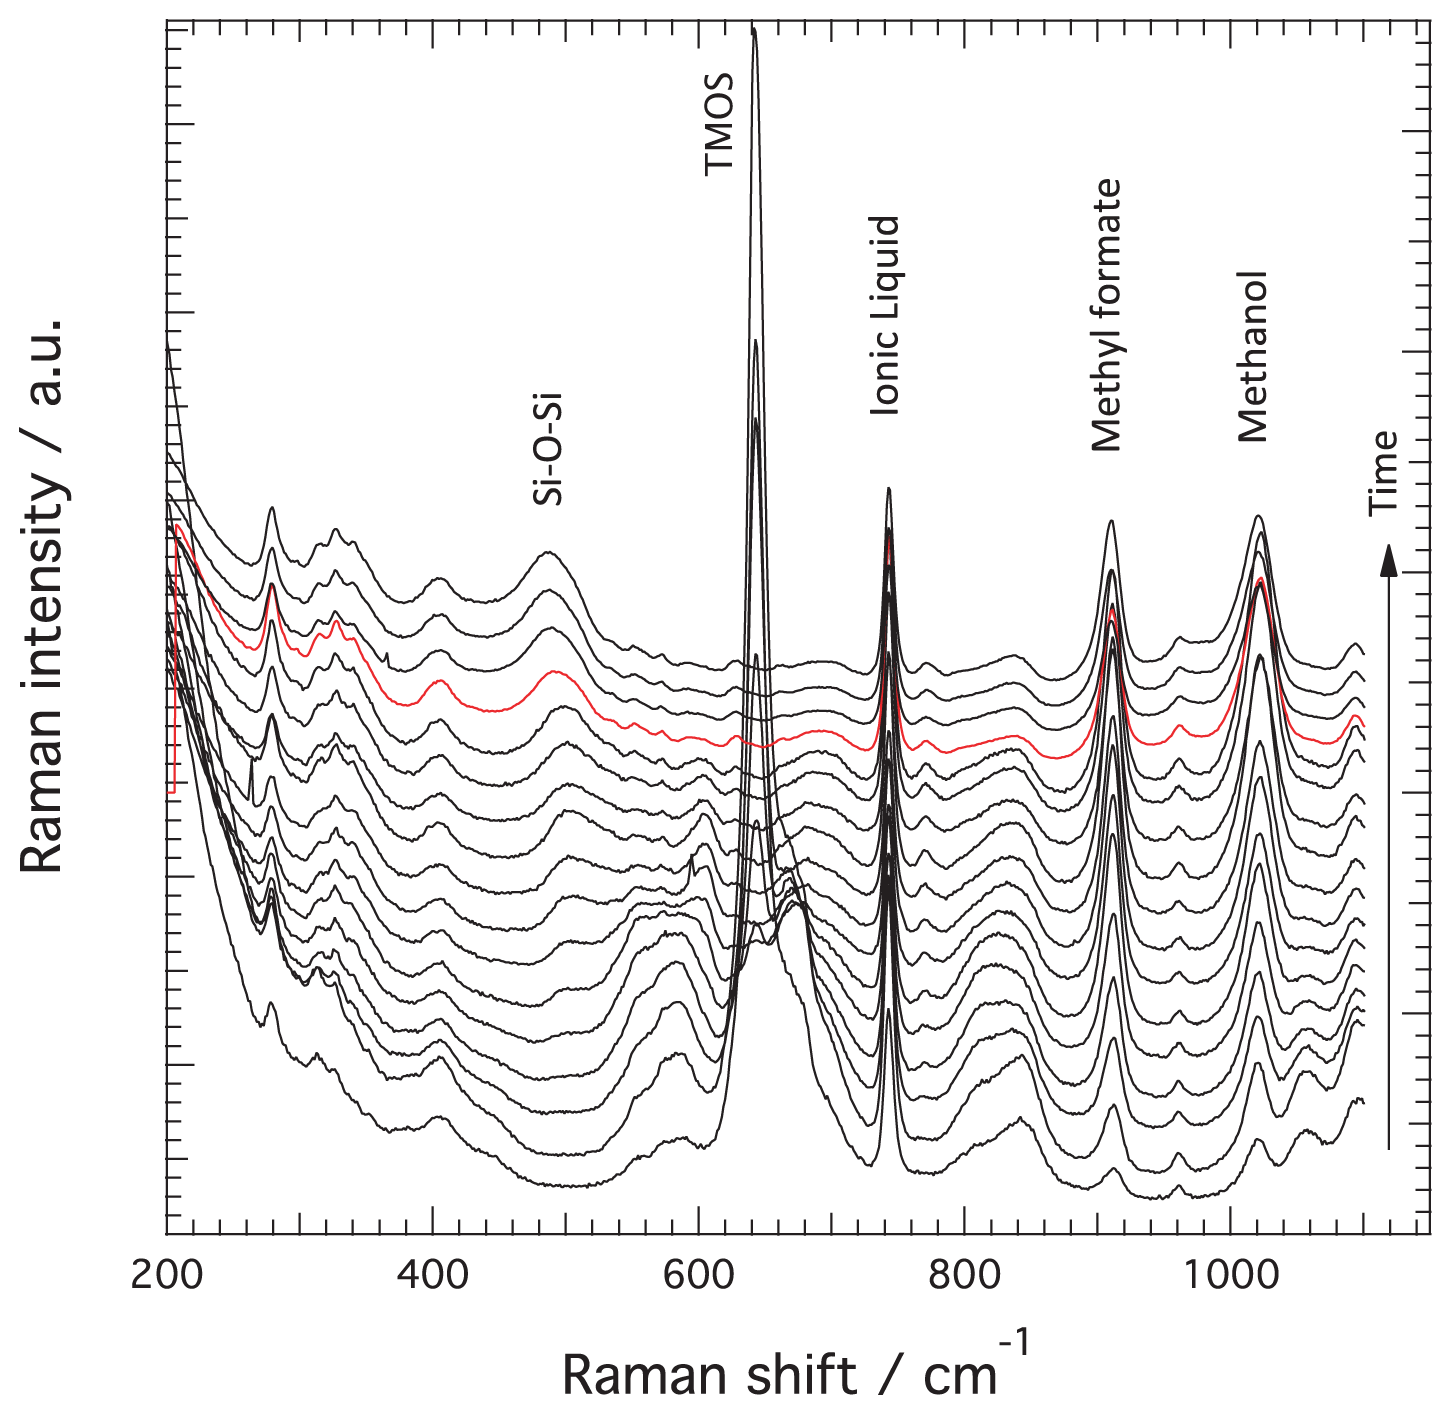
Figure 1 shows the evolution of the Raman spectra recorded at different times, from very early after mixing the reagents to well beyond the gelation point, see the arrow for the direction of time. In this Figure only spectra recorded for the reaction occurring in the presence of the ionic liquid are shown as a representative case. For clarity, spectra are shown with a vertical off-set and the spectrum recorded at the time of gelation, t
gel, is highlighted in red. This selection of Raman spectra shows clear spectral changes with time. The Raman peaks that undergo major intensity changes are those at 910 and 1020 cm
−1 assigned to methyl formate and methanol respectively, at 643 cm
−1 assigned to the symmetric Si–OCH
3 stretching in TMOS, and at ~490 cm
−1 attributed to Si–
O–Si bending modes in
n-membered rings of the silica network. The intensity of the signature at ~740 cm
−1, assigned to the expansion-contraction mode of the TFSI anion in the ionic liquid [
27], does not change with time since the ionic liquid does not participate in the reaction, hence this Raman peak can be used as an internal standard to normalize Raman intensities. This procedure compensates for density fluctuations and dilution effects. The time evolution of these peaks has been extensively discussed in reference [
9], revealing that the reactions that occur in solution can be summarized as:
In reference [
9], however, the more subtle but very significant changes that occur in the regions 510–620, 640–720, and 780–880 cm
−1, had not been inspected. The assignment of these vibrations has been been extensively reviewed in the works of Depla
et al. [
26], Mulder
et al. [
22], and Lippert
et al. [
28], in which the hydrolysis and condensation reactions during the formation of silica from TMOS or TEOS through classical sol-gel syntheses have been thoroughly investigated combining both experimental Raman measurements and theoretical calculations, with the support from
29Si NMR spectroscopy data [
26]. As summarized in
Table 1, the formation of linear Si–O–Si species, e.g., tetramer, trimer, or dimer, will give Raman vibrations in the 500–610 cm
−1 range, partially hydrolyzed TMOS species, e.g., Si(OCH
3)
2(OH)
2 or Si(OCH
3)
1(OH)
3, will appear in the region 640–720 cm
−1, while the vibrations in the range 780–880 cm
−1 are assigned to Si–O symmetric stretching in intermediate species of different coordination states. Note that a signature at ~830 cm
−1 is present also in the spectrum of TMOS, see
Figure 2B in reference [
9]. The feature at ~490 cm
−1 is a signature for the formation of the silica network and of the presence of
n-membered rings that can vary both in size and in Si–
O–Si bond angles [
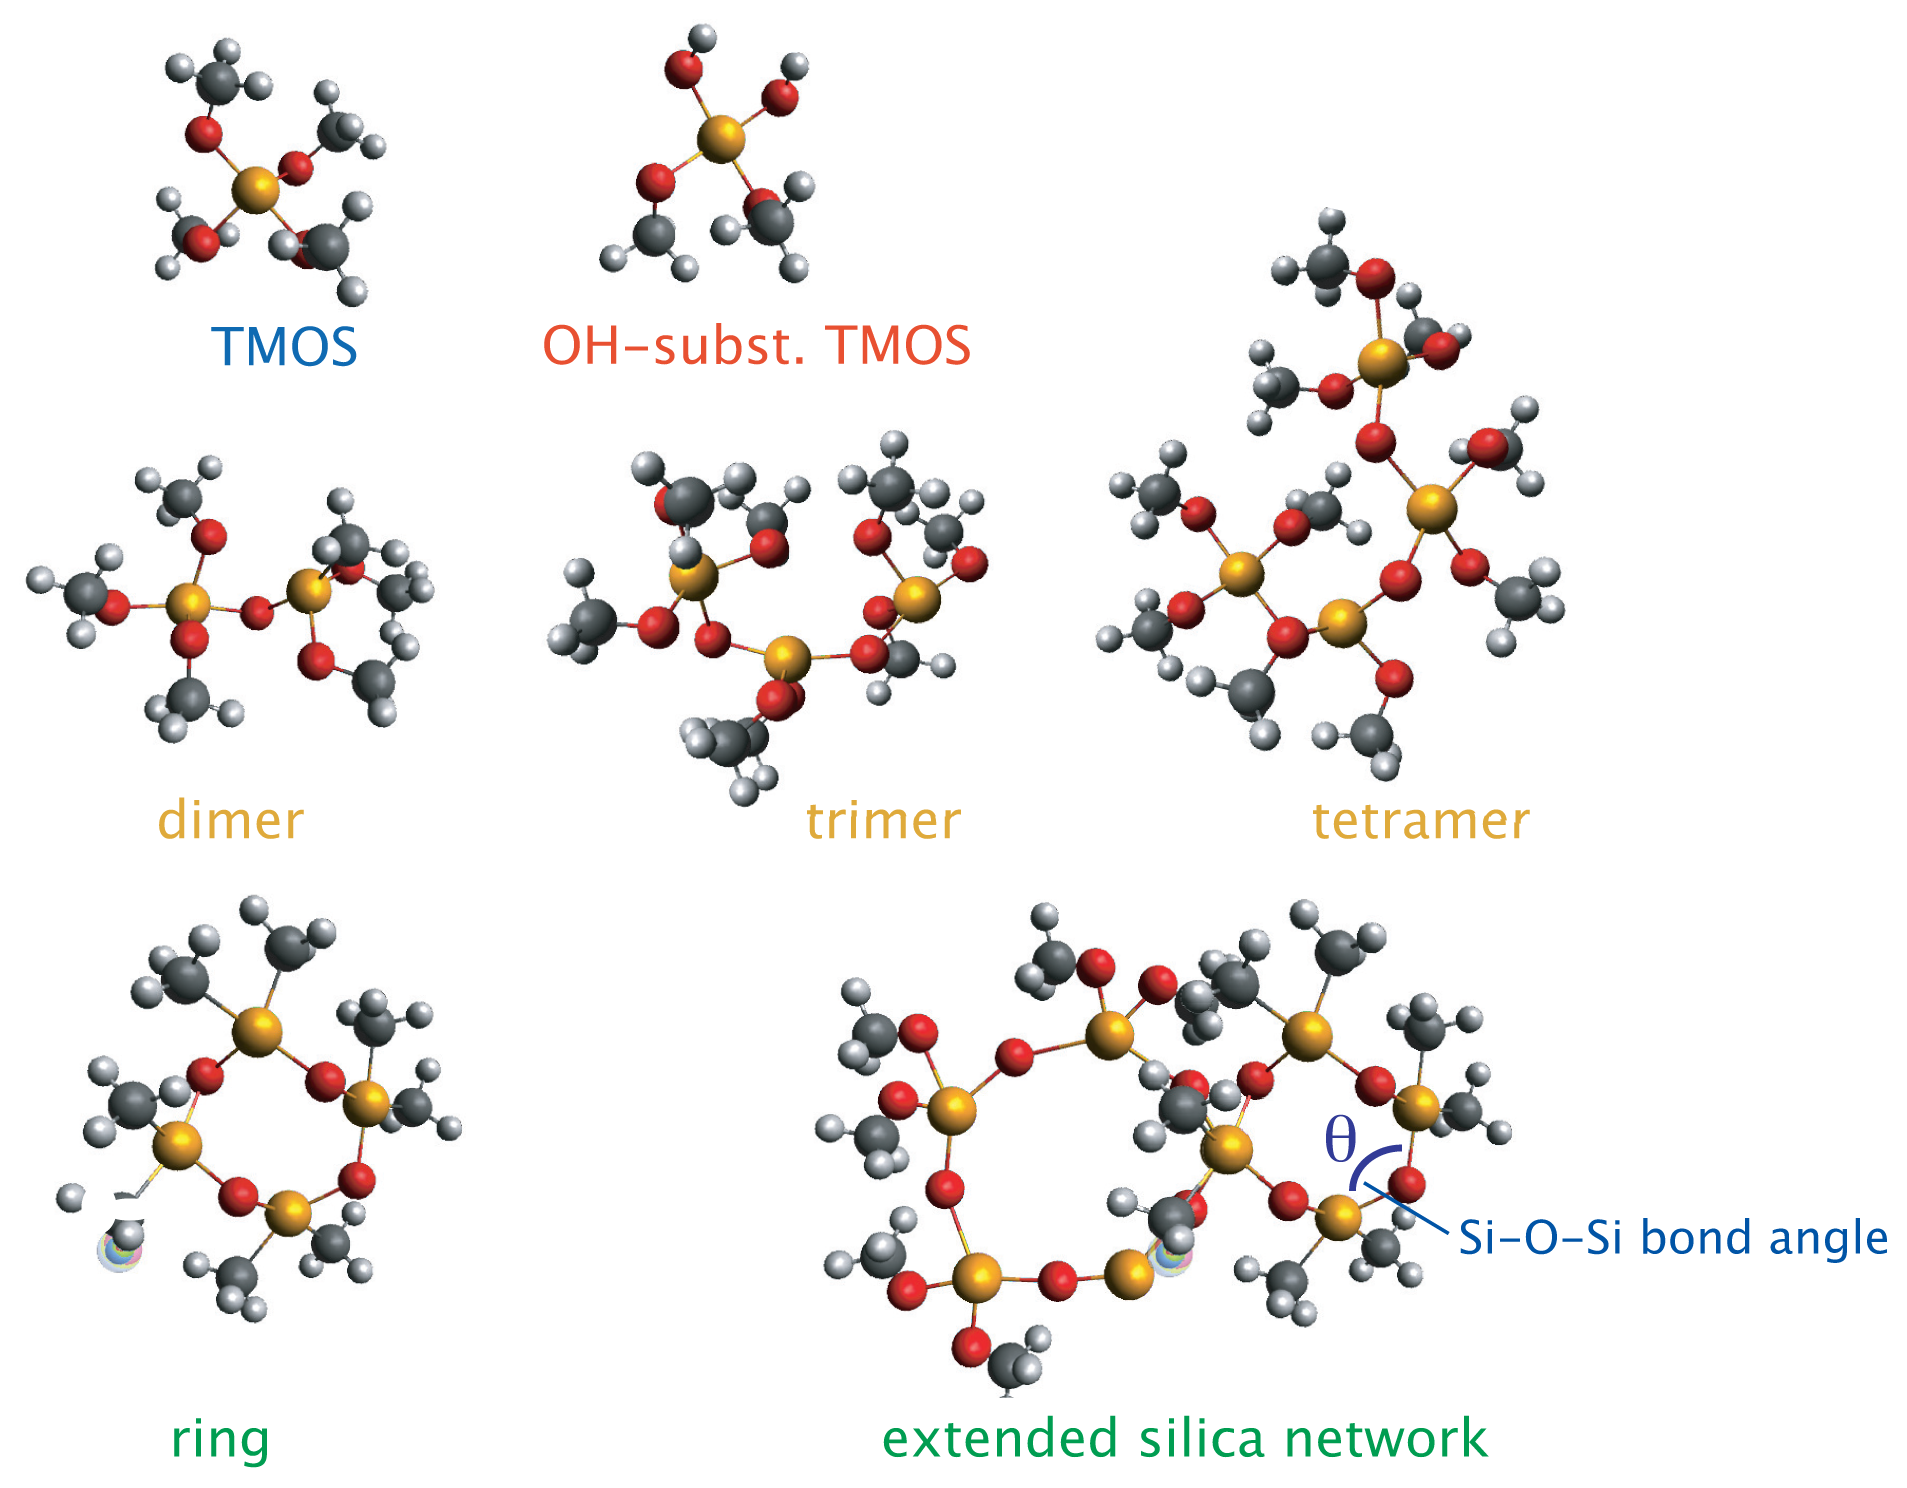
21]. In
Figure 2 the different silica intermediate species,
i.e., TMOS, –OH substituted TMOS, linear chains, and rings, are schematically shown to facilitate the discussion that follows.
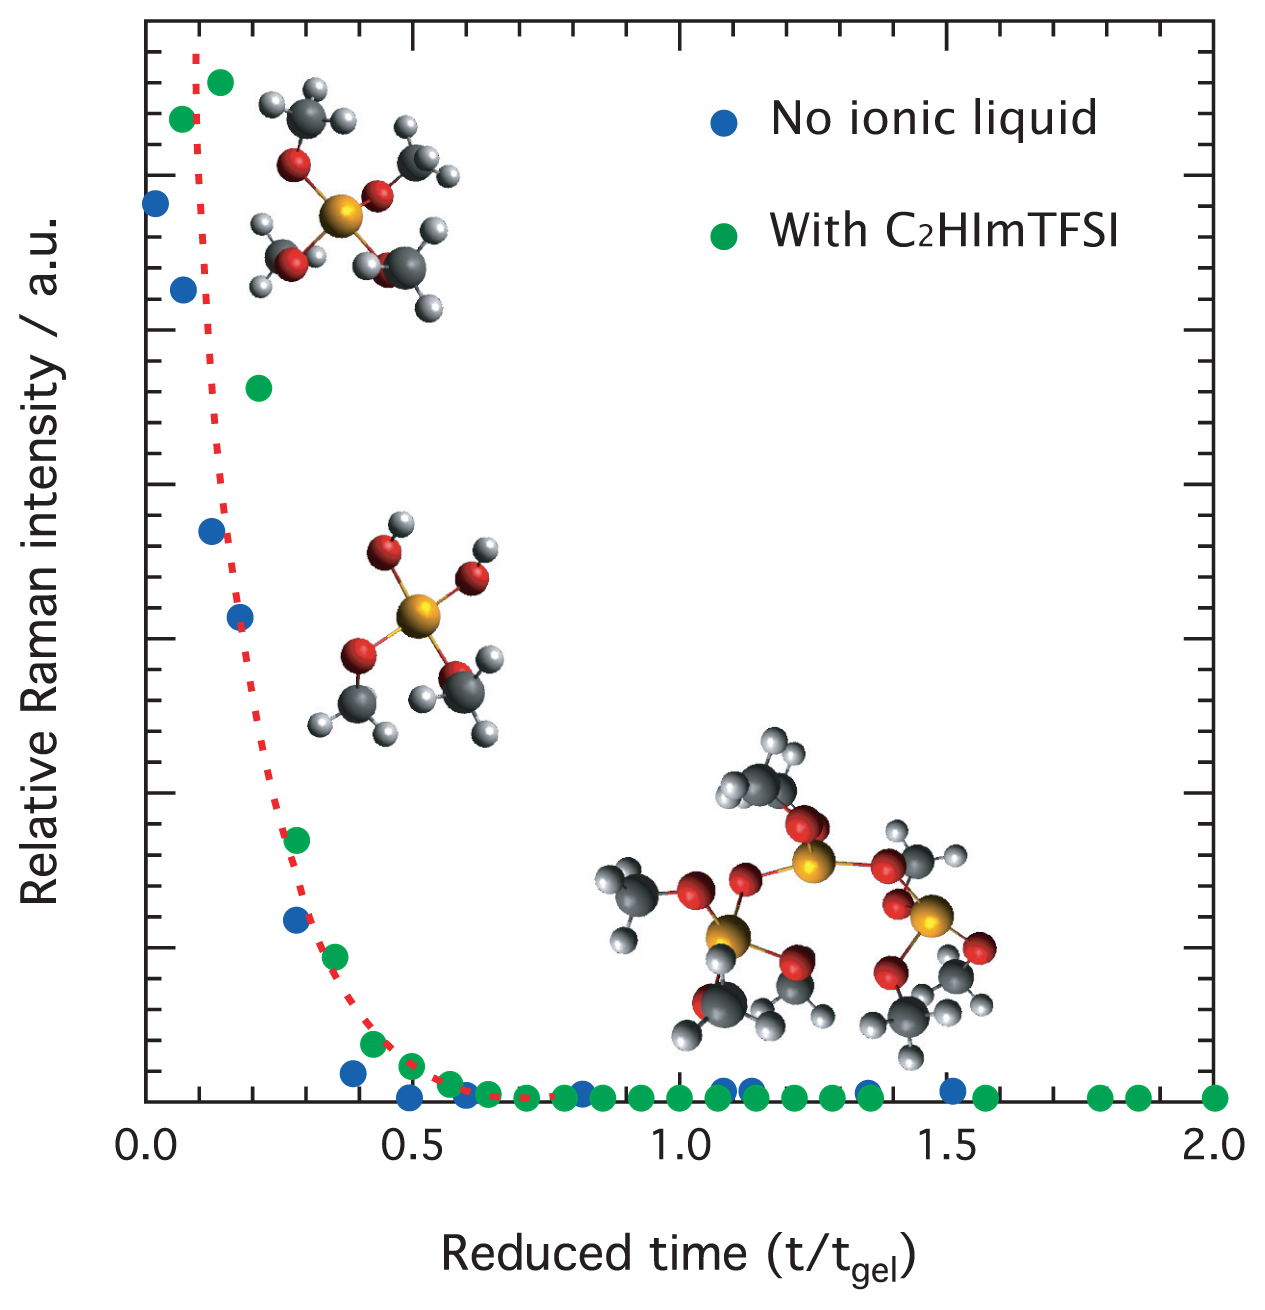
2.2. Fast Hydrolysis Reactions
Figure 3 shows the rate of consumption of TMOS on a reduced time scale, that is as a function of t/t
gel where t/t
gel = 1 corresponds to the time of gelation. Here it is worth recalling the strong effect on t
gel of the ionic liquid addition [
9], and that in this study t
gel for for no ionic liquid added is 170 min while t
gel for the ionogel with
x = 0.05 of C
2HImTFSI is 65 min. Data collected from solutions with and without the ionic liquid are shown in the same plot. From this figure it can be appreciated that the consumption of TMOS is very fast, and appears almost complete at t
gel = 0.5. Here, it is crucial to remark that since the vibration at 643 cm
−1 arises from the symmetric stretching of the four Si–O bonds in Si–(OCH
3)
4, even the reaction of one –OCH
3 group only would result in symmetry breaking and thus in a decrease of the 643 cm
−1 intensity. Hence, a ~zero intensity of the Raman peak at 643 cm
−1 does not necessarily mean complete hydrolysis, rather the –OH substitution of at least one functional group for all TMOS molecules. In fact, the evolution of
1H NMR intensities recorded during an equivalent sol-gel reaction to that investigated in this work indicates that at t/t
gel = 0.5 approximately 20% of the –OCH
3 groups are not reacted (see Figure 4B in reference [
9]). Nevertheless, the same work also shows that TMOS is completely hydrolyzed at t/t
gel = 1. Very fast hydrolysis reactions, with respect to the time of gelation, are typical of sol-gel reactions that occur in acidic conditions and at sub-stoichiometric water contents [
26,
28]. These conditions are in fact reproduced in the systems investigated here, due to the very high formic acid concentration and very low water content in the initial solution. More precisely, considering that formic acid is commercially available with 4 wt % of water, our initial solution actually contains 0.3 water molecules per TMOS unit, which corresponds to a H
2O:TMOS ratio of
r = 0.3. This is much smaller than the values of 1–25 normally used in the traditional sol-gel synthesis of silica [
19]. In addition, the data shown in
Figure 3 reveal that the rate at which TMOS is consumed is very little affected when the reaction occurs in the presence of the protic ionic liquid C
2HImTFSI.
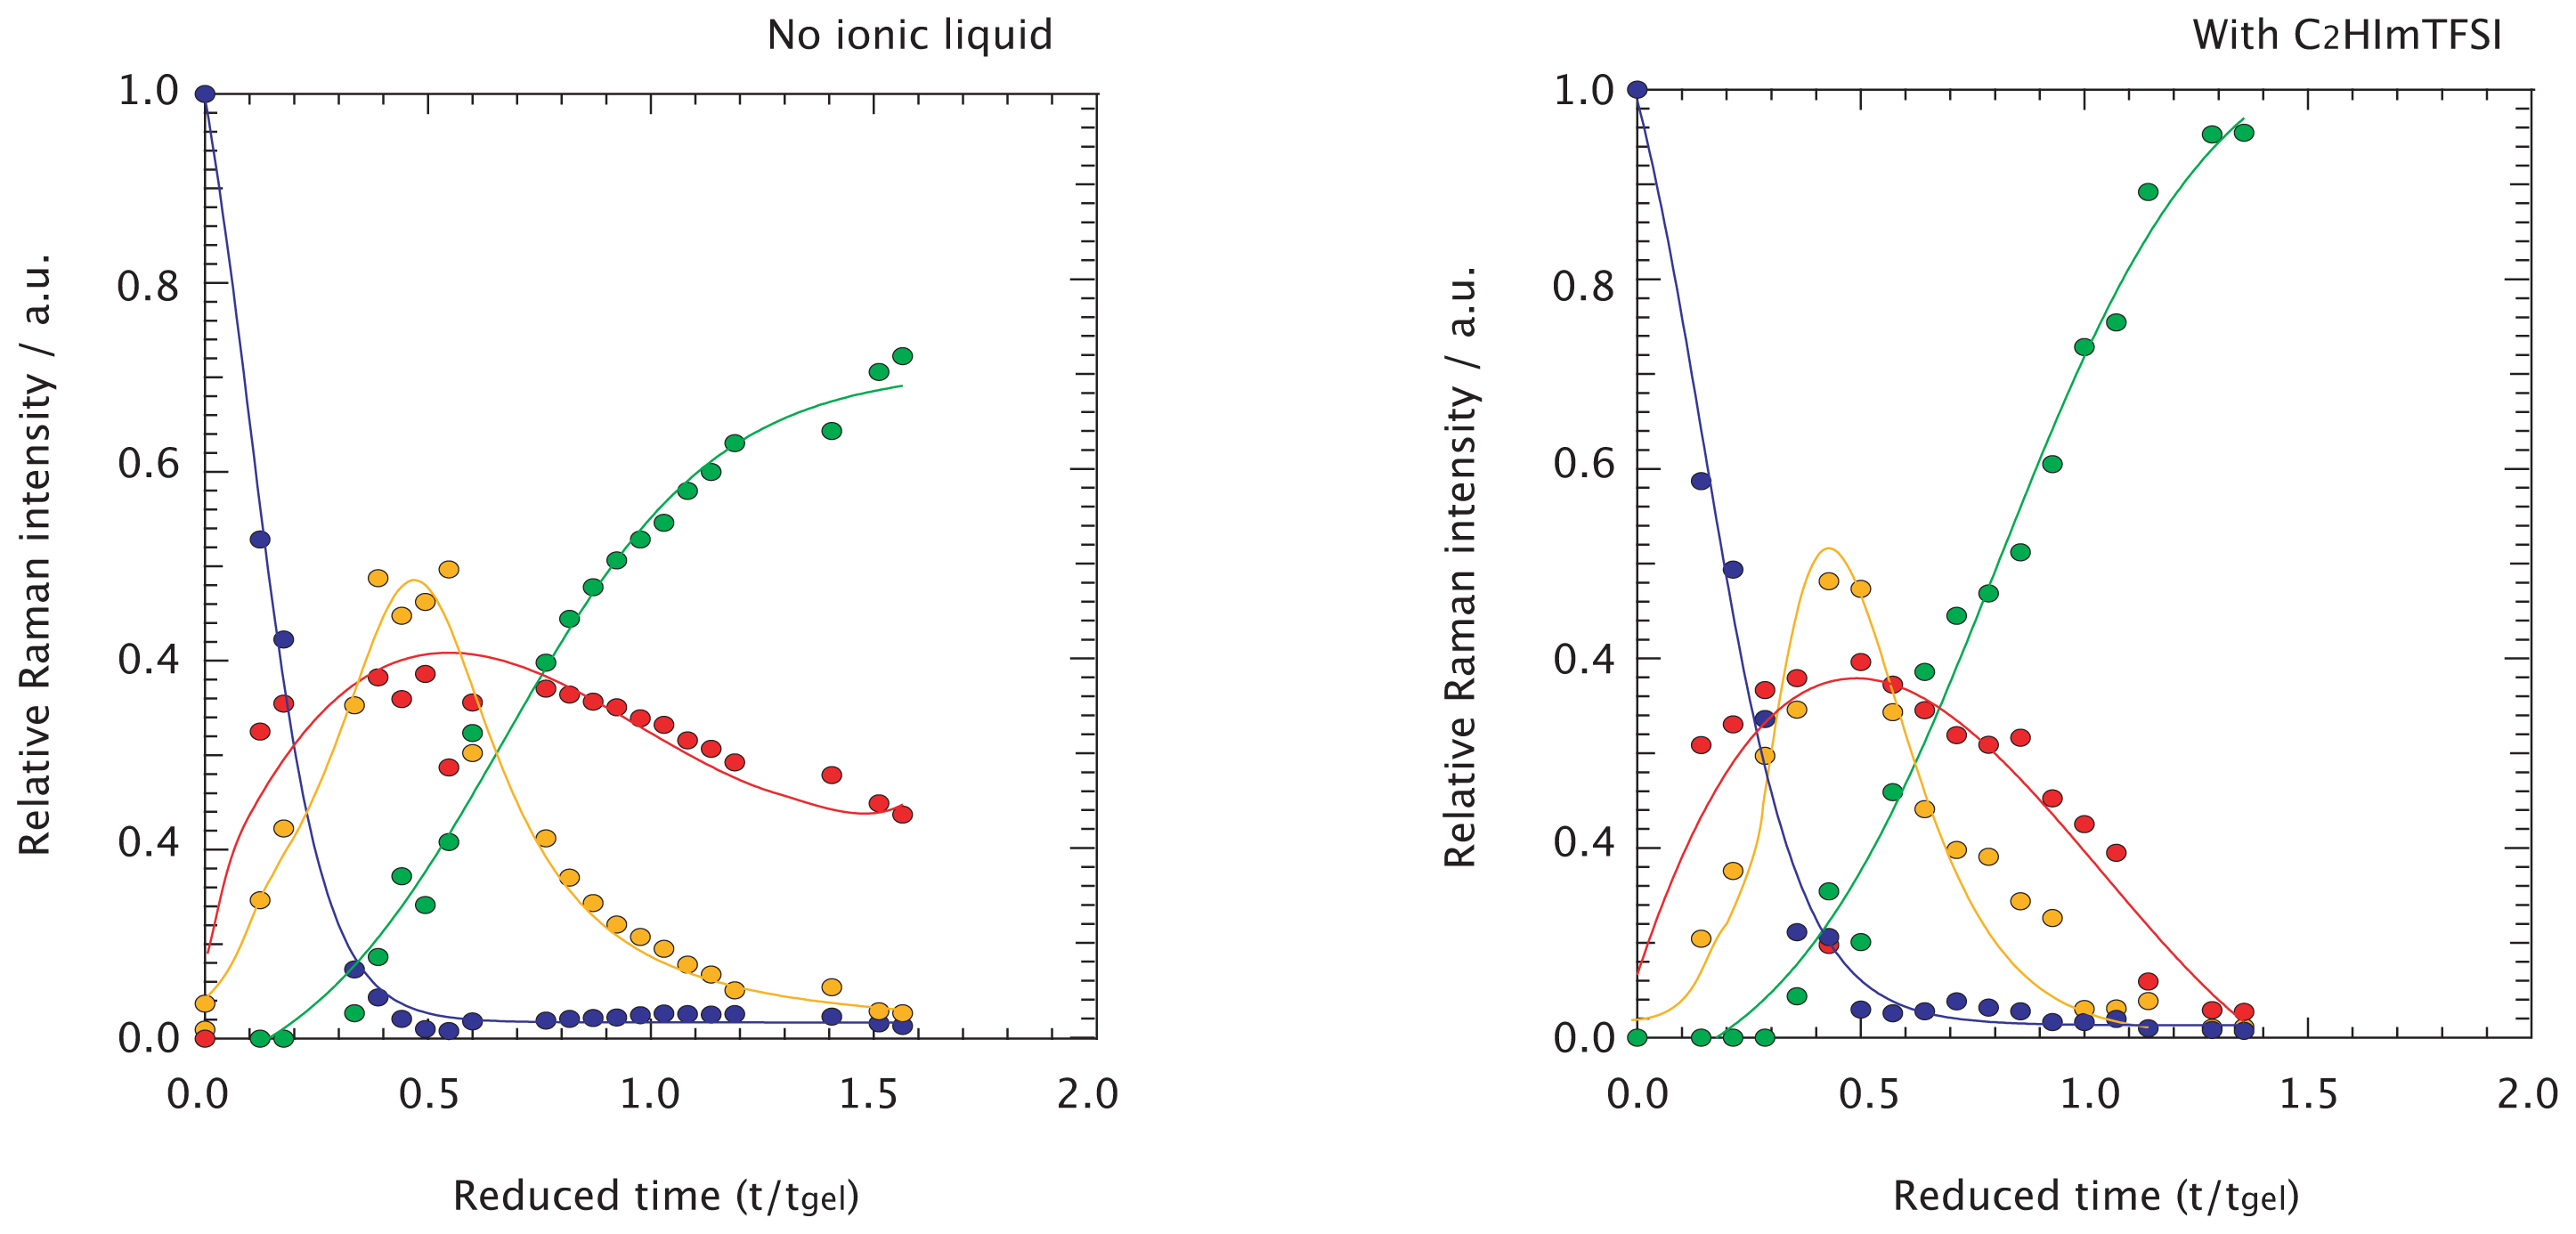
2.3. Competing Condensation Reactions
In
Figure 4 the relative integrated Raman intensities of different silica species,
i.e., monomeric, linear, and cyclic, are plotted as a function of reduced time, t/t
gel, together with the time evolution of the Raman feature assigned to TMOS. As previously found from both experimental and theoretical works [
22,
26,
28], the Raman signatures of linearly polymerized silica (tetramers, trimers, and dimers) are very close in frequency and may slightly shift as a consequence of different configurations or degree of –OH substitution. Significant peak overlap could than make a quantitative analysis of the individual signatures of ambiguous interpretation. Therefore, as a first approximation, we find it more appropriate to consider these signatures altogether, the sum of the dimer, trimer, and tetramer intensities being representative of the
linear silica species:
where the subscripts on the right-hand term indicate the approximate frequency at which the Raman vibration of that silica species is found. Similarly, the TMOS molecules with different degrees of –OH substitution (i.e., Si(OH)i(OCH3)4−i, where i can vary from 1 to 4) altogether represent the monomeric species:
where any species with a value of
i larger than one represents a monomer available for further condensation reactions. The successive increase in Raman frequency with substitution of the –OCH
3 groups by –OH is consistent with the smaller reduced mass of the vibrating unit. Nevertheless, the assignment of the vibrational mode at 795 cm
−1 is more uncertain, and has been assigned to silica dimers by Artaki
et al. [
31] and to silicic acid or Si(OH)
4 by Lippert
et al. [
28]. In this work we do not observe a shoulder at 795 cm
−1 but at 810 cm
−1, which in our opinion can not be assigned to silicic acid since the shift from 726 to 810 cm
−1 is too large to be motivated by mass reduction from only one extra –OH group. On the other hand, the assignment to dimers is in contrast with the assignment scheme discussed above. Moreover, as clearly shown in the Raman spectra plotted in
Figure 1, the shoulder at ~810 cm
−1 grows and diminishes consistently with the features in the range 510–620 cm
−1, assigned to linear silica species. We therefore propose the assignment of the 810 cm
−1 mode to Si–O(CH
3) vibrations in side-groups of central parts of trimers or tetramers, see also
Table 1. As a consequence, in this analysis we consider only the signatures in the range 670–730 cm
−1 as representative of the monomeric species, while the term in parenthesis in
Equation (6) is not taken into account when calculating relative Raman contributions. The broad signature growing in the spectral range below 530 cm
−1 is attributed to Si–O–Si bending modes in
n-membered rings with partial contribution from the two adjacent Si atoms [
21]. In analogy to the approaches above, rings of different nature are considered altogether to represent the
cyclic species:
Hence, in
Figure 4 the relative Raman intensities so calculated represent relative contributions to the entire 450–750 cm
−1 spectral range. To clarify, the linear species shown in yellow are in fact
Ilinear/(
ITMOS +
Imonomer +
Ilinear +
Iring). The reader should consider, however, that differently from NMR spectroscopy were NMR intensities are directly proportional to concentrations, in Raman spectroscopy the Raman intensity is also proportional to the Raman scattering cross section, which can variate between molecular groups. This implies that the conversion of relative Raman intensities into relative population is not straightforward. However, the qualitative trends of produced and consumed species as shown in
Figure 4 remains sound. As shown in
Figure 4A for no ionic liquid added to the reaction, the species most readily formed are partially –OH substituted TMOS,
i.e., Si(OH)
2(OCH
3)
2, Si(OH)
3(OCH
3)
1 etc. shown in red, followed with a little delay by the linearly polymerized silica species, shown in yellow. Although this Figure confirms a very fast hydrolysis reaction, differently from the case of traditional acid-catalyzed sol-gel synthesis of silica [
19] where complete hydrolysis precedes condensation we here observe an earlier formation of monomeric and linear species. The population of both these species increases with time, up to approximately half-way to the gelation point, t/t
gel = 0.5. This is also the time at which the population of linear species starts to dramatically decrease while that of silica rings (green) starts to raise. As can be deduced from intensity changes in the time scale t/t
gel = 0.5–1.0, silica rings are formed mainly at the expenses of linear species, which is also consistent with the delay with which the cyclic forms are produced. After gelation, the cyclic species dominate the spectral range investigated, with a non-negligible contribution from monomers.
The intensity evolution with time of the different silica species is essentially the same in the presence of the ionic liquid C
2HImTFSI, as shown in
Figures 4B. One clear difference, however, is that after t
gel the consumption of monomers and the increase of ring population is much faster than for the case of no ionic liquid added. At t/t
gel = 1.5 practically no monomers or oligomers are present in the ionogel and the spectrum is dominated by the feature peaked at ~490 cm
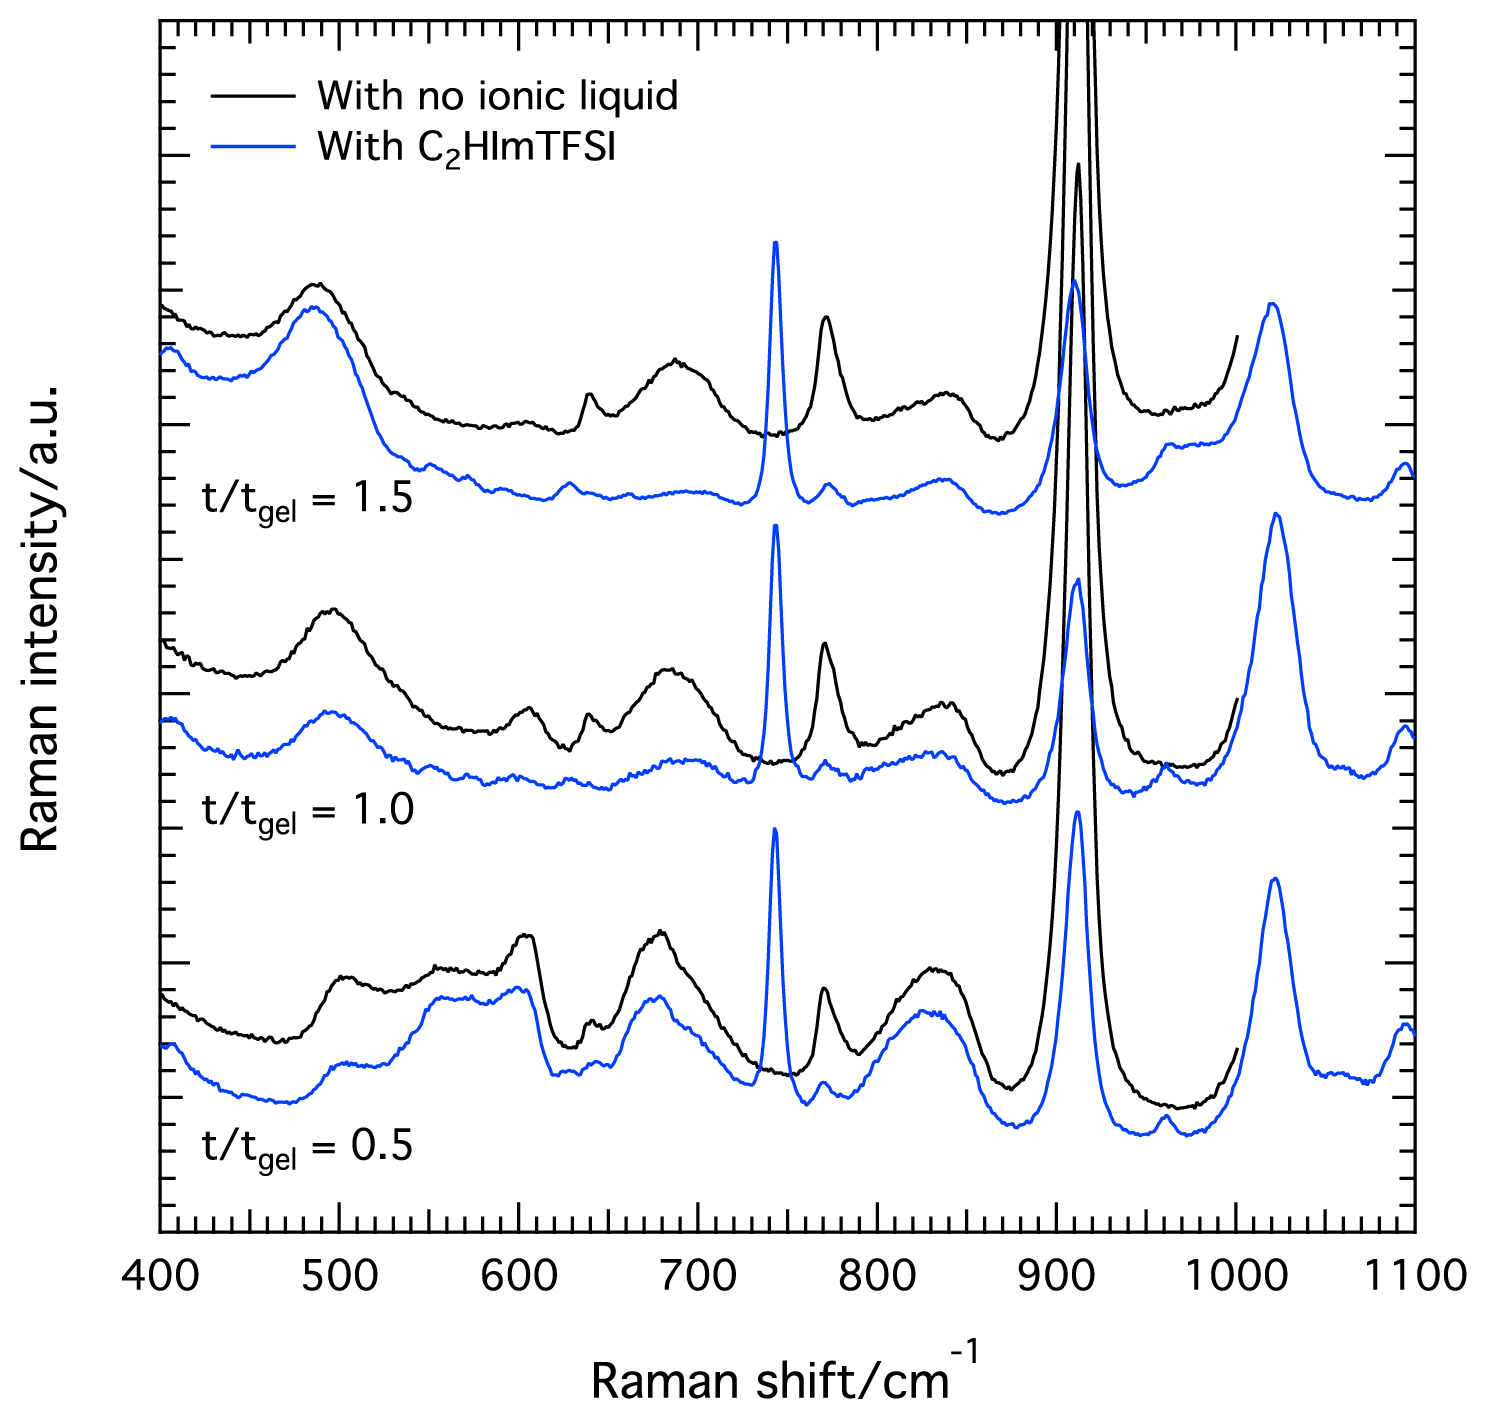
−1. These differences suggest that the cyclization process is significantly accelerated in the presence of the ionic liquid. The different kinetics can be visualized in
Figure 5, in which Raman spectra recorded at comparable t/t
gel times are plotted for solutions with and without the ionic liquid C
2HImTFSI.
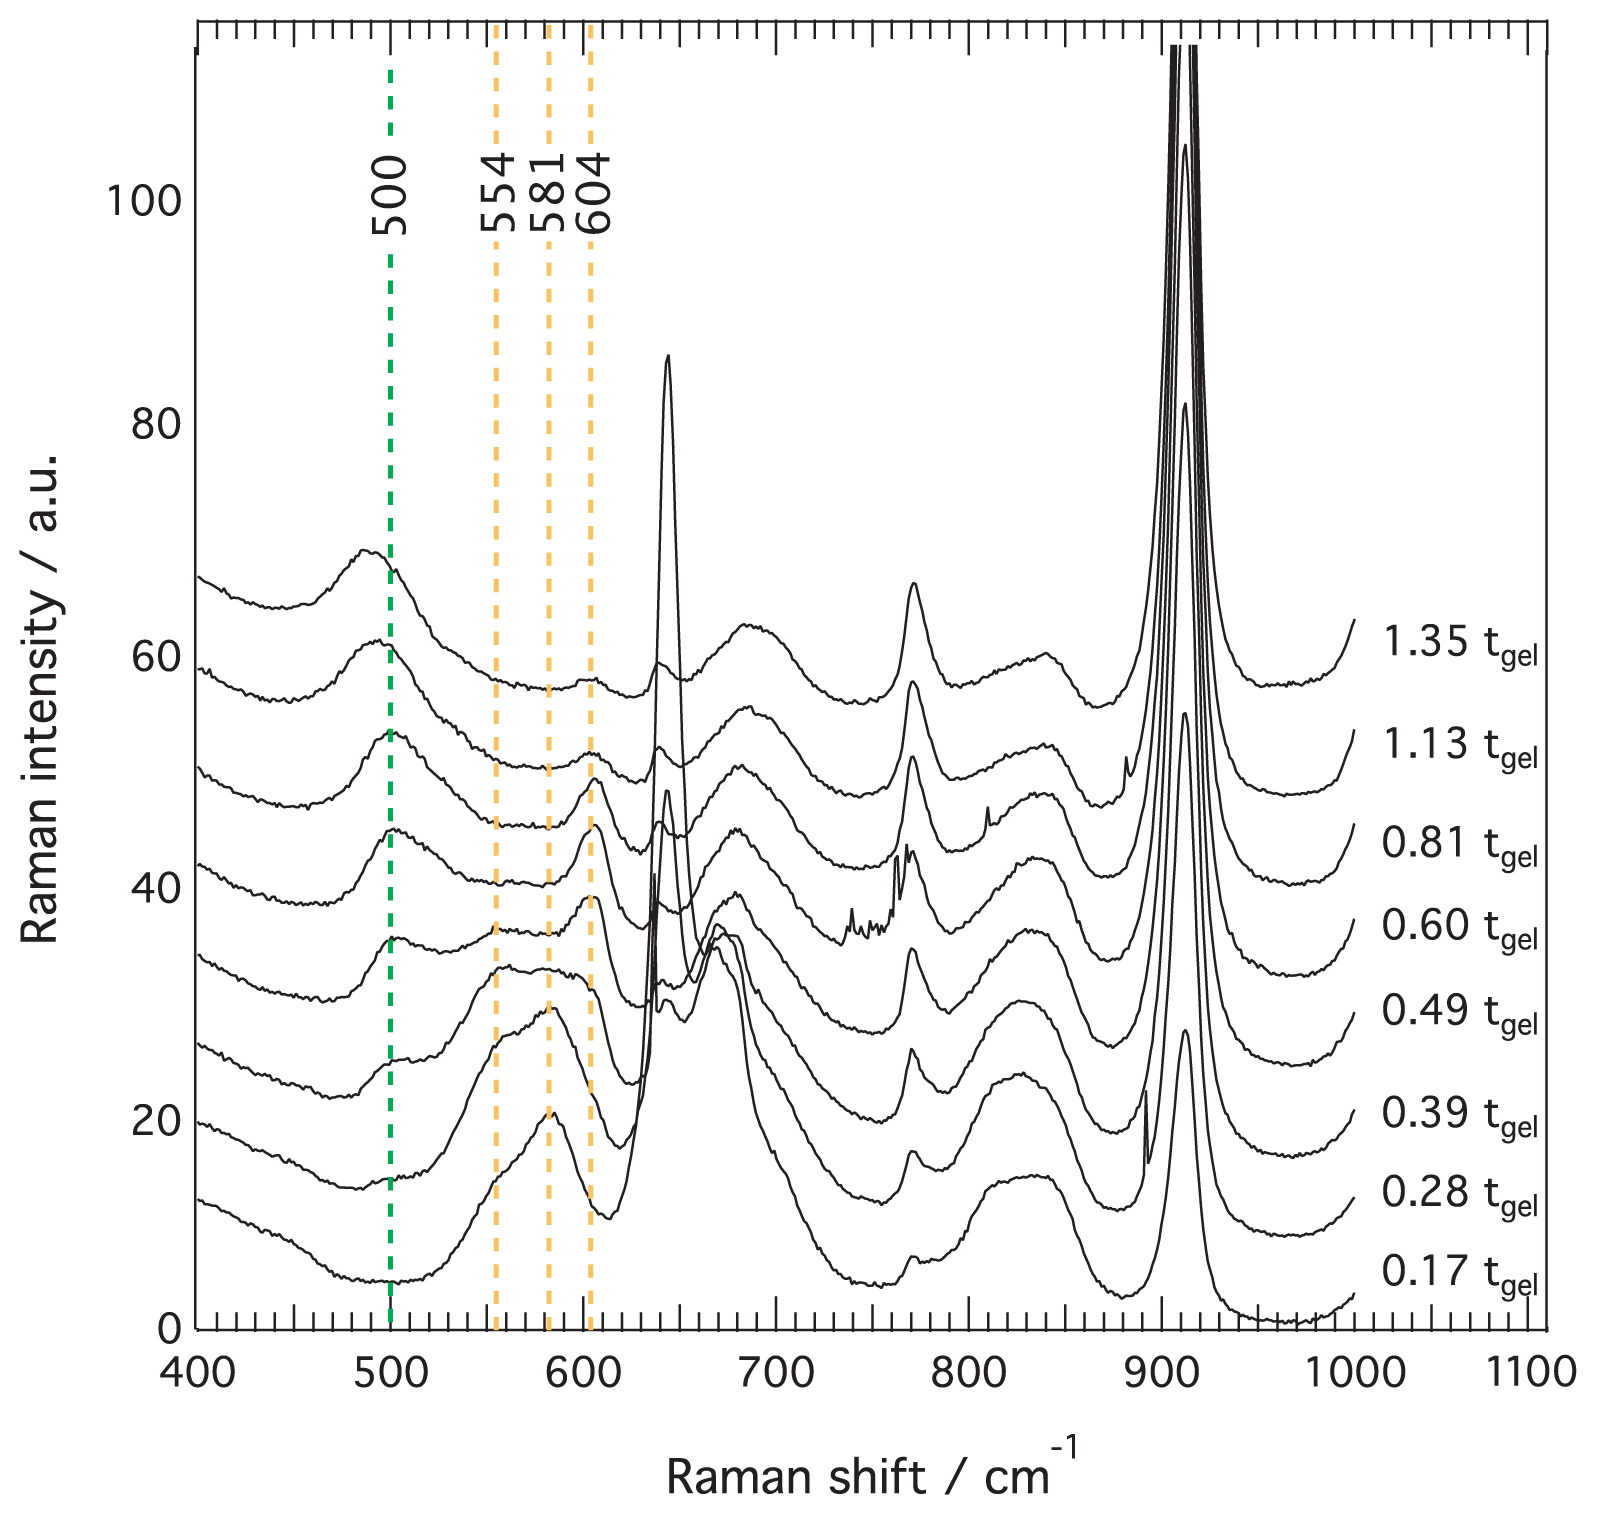
The condensation mechanism has been further analyzed by a closer inspection of the Raman spectral region 400–1000 cm
−1, with focus on spectra recorded close to the gelation point,
i.e., between 0.17 and 1.35 t/t
gel, see
Figure 6. The dotted lines indicate the distinct features at ~554, ~581, and ~604 cm
−1, that increase and decrease at different rates. According to the works of Mulder
et al. [
22] and Depla
et al. [
26] and as summarized in
Table 1, these are assigned to non-OH substituted tetra-, tri-, and dimers of silica respectively. From
Figure 6 it is clear that after a concomitant increase of both trimers and tetramers, at ~ 0.39 t/t
gel these start to be consumed with an apparently faster consumption of the trimers (581 cm
−1) as compared to the tetramers (554 cm
−1). This consumption is concomitant with the formation of cyclic silica forms (feature at ~490 cm
−1), while the feature at ~604 cm
−1 remains of significant intensity, see spectra between 0.49 and 0.81 t/t
gel. However, from 1.13 t/t
gel also this feature shows an intensity decrease, while the intensity of the signal at ~490 cm
−1 is observed to further and smoothly increase. The observation of the ~604 cm
−1 feature at later times than that at ~581 or ~554 cm
−1, implies that dimers should exist in solution together with rings. These species would then act as cross linkers between rings, a process that seems to coincide with the set in of gelation. This scenario, however, is in contrast with other time-resolved studies on the polymerization of TEOS, which have shown that the consumption of dimers precedes the formation of trimers or tetramers [
22–
24]. However, as discussed by Depla
et al. [
26] this feature has contributions from end-groups of chains (602 cm
−1), wherefore for consistency with previous reaction models the residual peak at ~604 cm
−1 may be more correctly attributed to non-condensed Si–OCH
3 side groups of small silica rings. This assignment is supported by that the decrease of the ~604 cm
−1 feature is concomitant with the increased degree of cyclic condensation,
vide infra.
2.4. Evolution of the Cyclic Forms of Silica
As extensively discussed by Hehlen [
21], the Raman feature at ~490 cm
−1 is characteristic of all amorphous silica-derived materials, although its frequency can vary depending on the inter-tetrahedral Si–O–Si bond angles formed, and therefore on the size of the
n-membered rings that build up the silica network. In his work, Hehlen concludes that by using a silica sample with known structure as a reference, the average inter-tetrahedral bond angles of an unknown silicate can be deduced from the reduced Raman spectrum in the frequency range of the ring breathing modes. Here, the reduced Raman spectrum G(
ω) is related to the experimentally recorded Raman spectrum I(
ω) through G(
ω) ∝ I(
ω)/(
ω·[n(
ω) + 1)], where
ω is the Raman frequency (in cm
−1) and n(
ω) is the Bose occupation factor. We aim to use this finding to get new insights on the cyclization process during the sol-to-gel transition investigated.
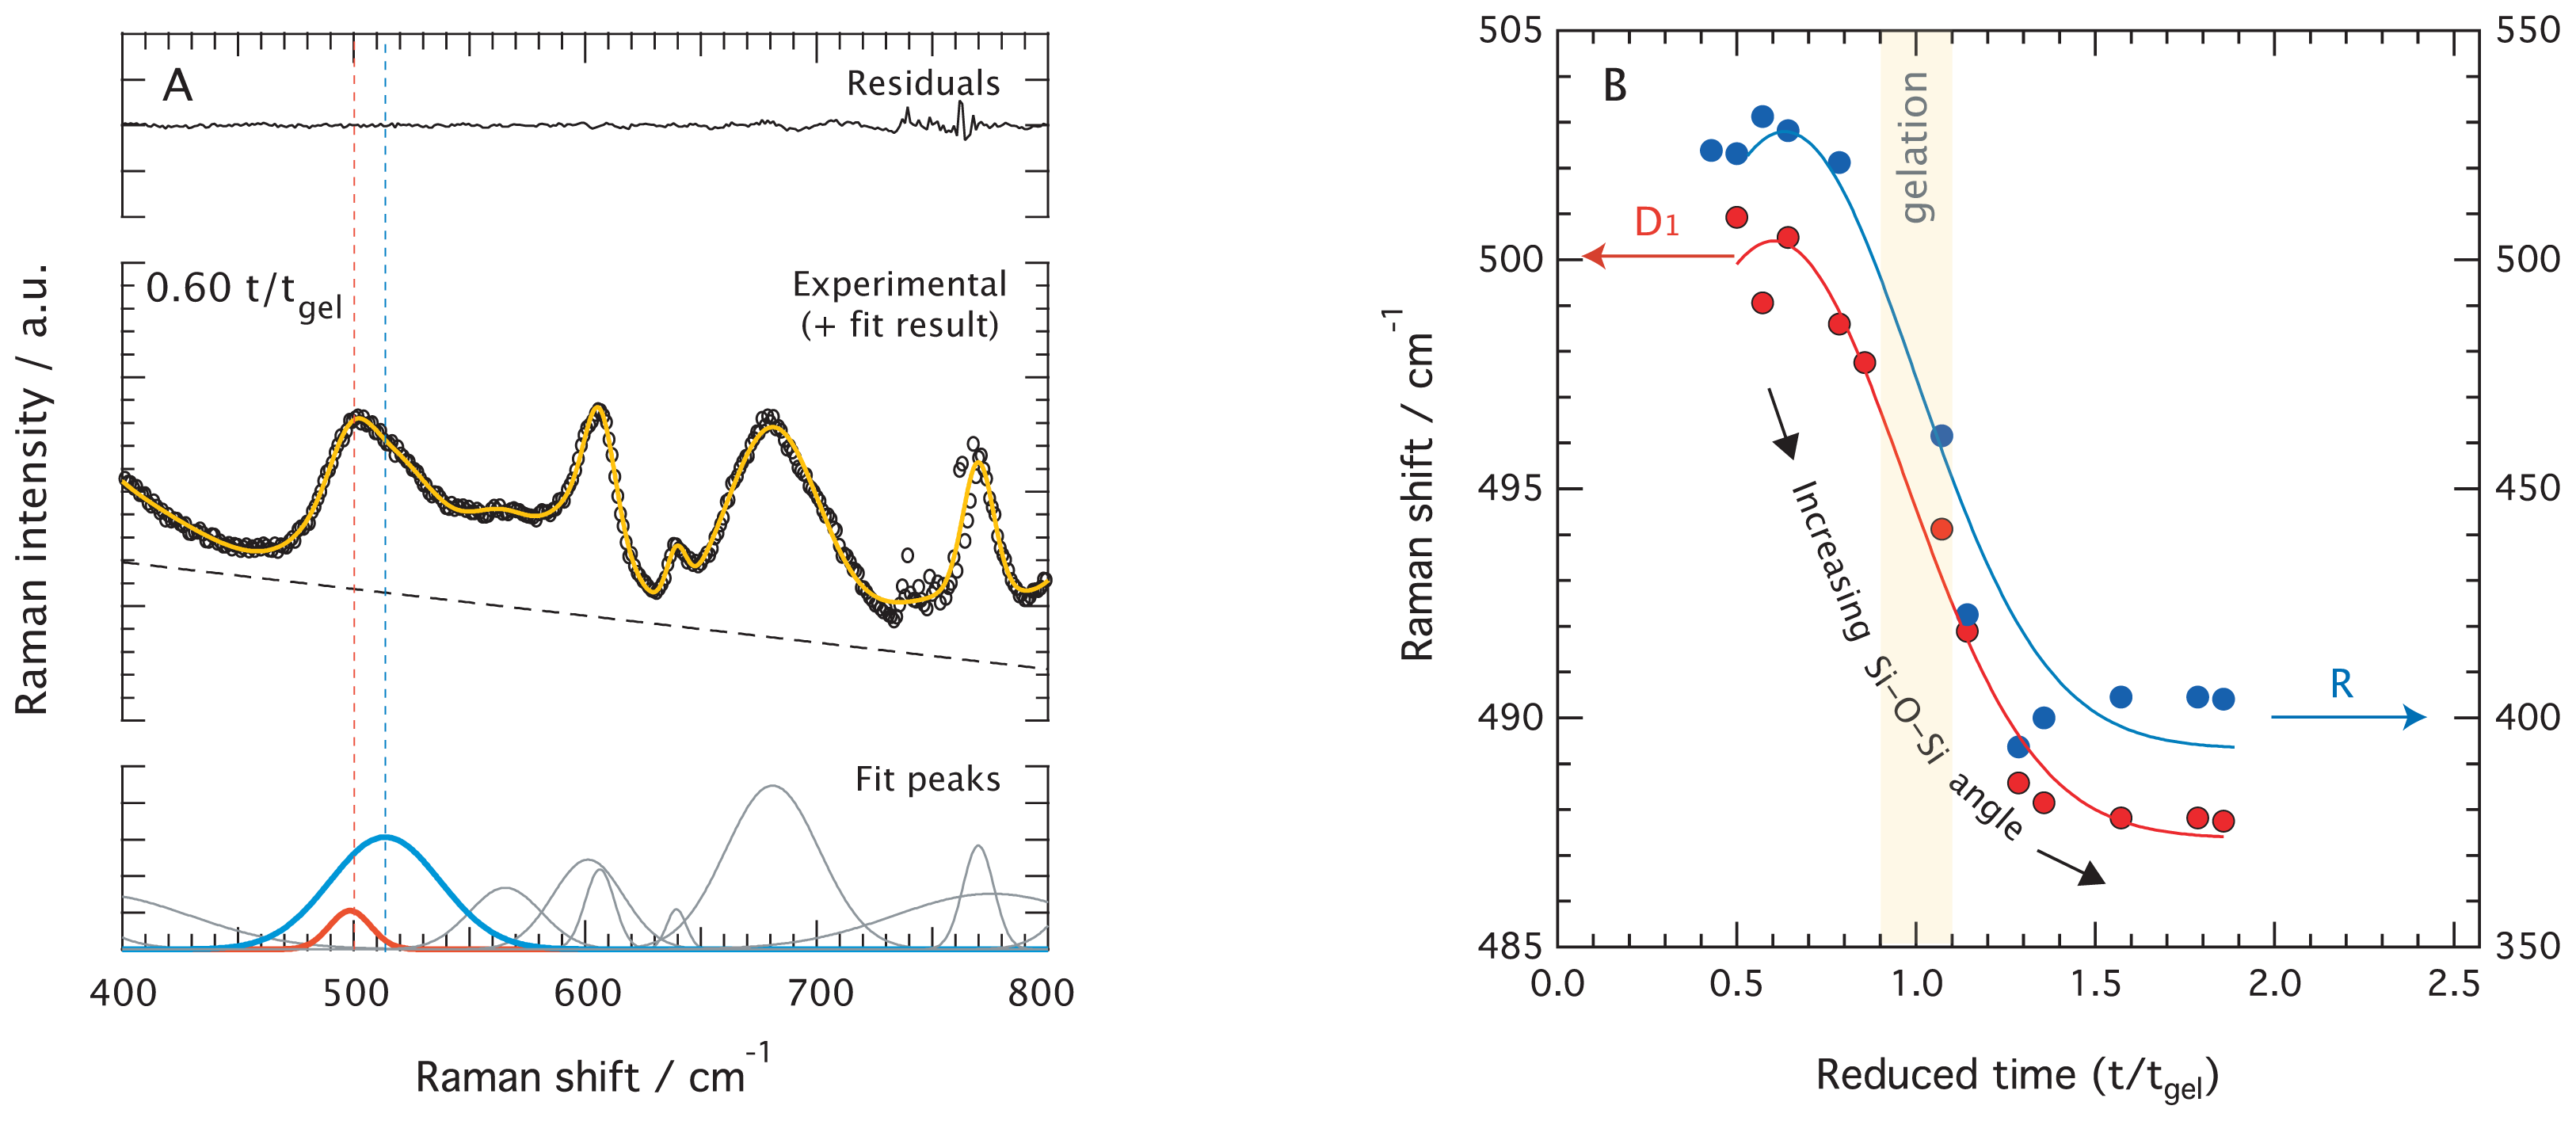
The peak fitting analysis of reduced Raman spectra reveals that the ~490 cm
−1 feature must be deconvoluted into two components. In fact, as can be seen in
Figure 7A for the representative case of the ionic liquid added gel at t/t
gel = 0.60, this feature is broad and asymmetric. We also find that both these components systematically shift towards lower frequencies as the reaction proceeds, see also
Figure S1 for further details on this evolution. The frequency shift of the two fitting components as a function of reduced time is displayed in
Figure 7B, revealing that the broader component shifts from ~528 to ~408 cm
−1 (blue), while the weaker one from ~501 to ~487 cm
−1 (red). Judging from the frequency ranges in which these features variate, and based on many Raman spectroscopic studies on densified amorphous silica gels and glasses that display the characteristic broad feature at ~432 cm
−1 and the so-called D
1 defect mode at ~490 cm
−1, these features are assigned to the Si–O–Si bending modes in non-planar network
n-membered rings and the Si–O–Si in-phase “breathing mode” in planar 4-membered rings respectively [
21]. While the“breathing mode” (D
1) of the smaller rings do not involve a significant contribution from the two adjacent silicon atoms of the Si–O–Si bond, the vibrations that lead to the network modes (R) do so and are probably closer to pure bendings.
The relation proposed by Hehlen [
21] between the Raman frequency shift for the Si–O–Si bending mode and the corresponding Si–O–Si bond angle is cos
θ/2 = 7.323 · 10
−4 ·
ω, where
ω is the Raman frequency shift in cm
−1. This relation has been established considering that the angle at the maximum of the distribution in v-SiO
2 is 145° [
21]. Using this, the frequency variation between ~501 and 487 cm
−1 translates into Si–O–Si bond angles that vary from ~137.1° to ~138.2° in the time domain 0.7–2·t/t
gel. On the other hand, the frequency change of the broader feature from ~528 to ~408 cm
−1 in the same time domain corresponds to Si–O–Si angles varying from ~134.7° to ~146.1°, see
Figure 7B. Although these values have been calculated for a gel material under structural evolution, they are in very good agreement with the results obtained for the D
1 defect mode and the R network modes in densified silica [
21]. The small bond angle variation observed for the D
1 mode with reaction time is ascribed to a relaxation of the structure, while the more significant changes found for the R network mode are indicative of the formation of new and progressively larger rings. It is noteworthy that the major changes occur at around gelation, at t/t
gel = 1, whereas at roughly t/t
gel = 2 the frequency shift of both the D
1 and the R network vibrational modes have reached a plateau indicating that no further structural changes take place. These findings indicate that while the first cyclic forms are 4-membered rings, after gelation (more exactly after t/t
gel = 1.5) these contain on average 6 Si atoms. This is consistent with the results found for densified silica [
21] where network frequencies at around 420 cm
−1 are representative of Si–O–Si bond angles of about 144° and ≃6-membered rings, which is also the most probable silica ring size found by numerical simulations [
32].
To summarize, the concomitant decrease of the component at ~560 cm
−1 and the increase of a new one at below ~530 cm
−1 reveals a smooth structural transition from linear tetramers, in the open or closed conformation [
26], to 4-membered rings. The progressively more open and extended network is then formed by either ring-ring or ring-chain condensation reactions. This scenario finds support from our observation that oligomers longer than tetramers have not been detected, which is also in good agreement with the findings of Depla
et al. who have investigated the formation of silica through an acid-catalyzed sol-gel reaction at very low water contents by NMR and Raman spectroscopy [
26]. Since both the intensity and the frequency evolutions that we have investigated in the silica sensitive range 400–800 cm
−1 are very similar on the time scale that extends to well beyond gelation with and without the ionic liquid, we conclude that the reaction pathway
per se does not significantly change upon the addition of C
2HImTFSI. In both cases the formation of
n-membered rings is strongly correlated to the point of gelation, but we also observe that the cyclization process is much faster when C
2HImTFSI is included in the reaction (see Section 2.3). The faster cyclization process can be in line with the role of ionic liquids as reaction catalysts as recently proposed by Karout
et al. [
33] as well as with our observation that small amounts of an imidazolium ionic liquid can slightly enhance the Q
4/Q
3 ratio in ionogels [
34].
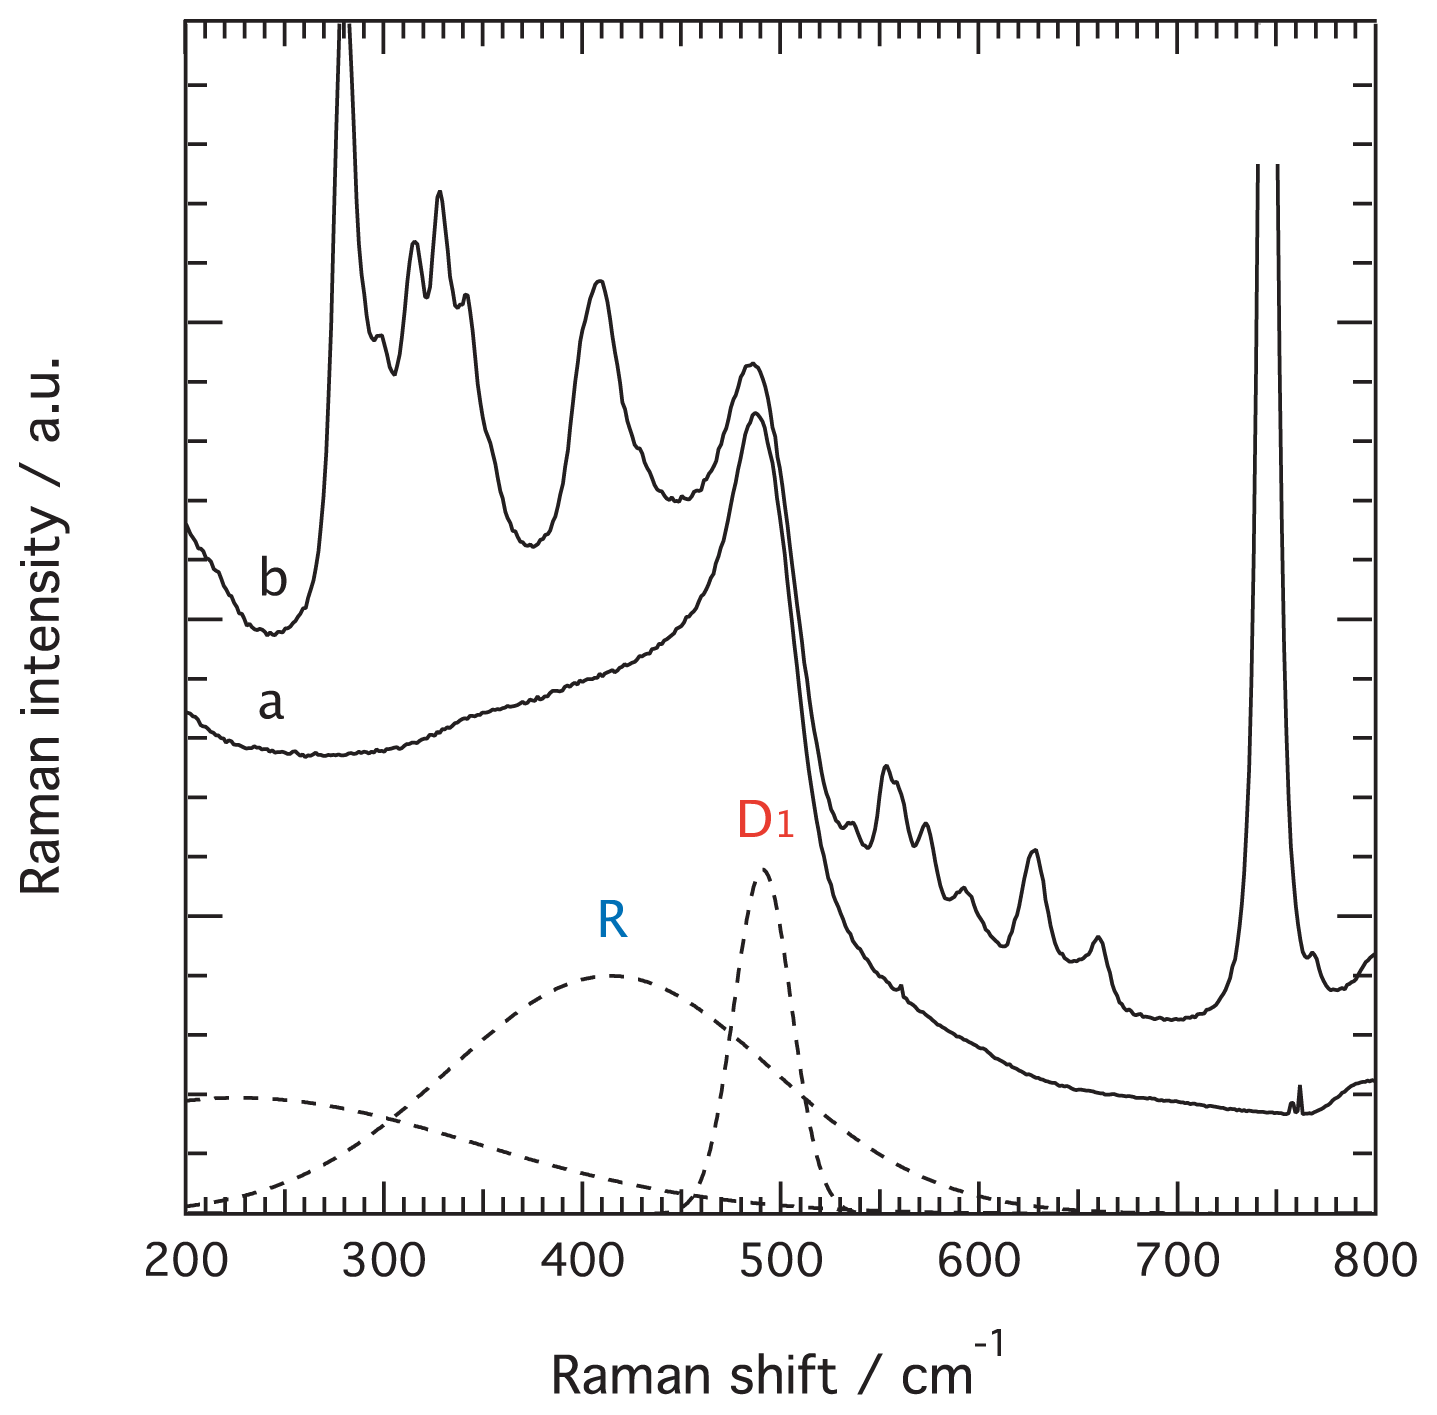
That no significant structural changes occur after gelation is further confirmed by Raman spectra recorded for aged gels,
i.e., six months after preparation, which show that the Raman feature representing the silica network has still an apparent maximum at ~491 cm
−1, and that the broader feature is still located at ~410–430 cm
−1, see
Figure 8. In these spectra no residual peaks are found in the range 520–780 cm
−1, meaning that all silica intermediates have undergone condensation. The weak features in the spectrum of the aged ionogel between 550 and 700 cm
−1 are intrinsic vibrations of the ionic liquid’s cation. The Raman spectra of both the aged gel and the aged ionogel also show a relatively strong signature at 977 cm
−1, which is attributed to Si–OH stretching and thus indicates the presence of silanol groups, see
Figure S2. The spectral features of most silica gels and glasses do show the presence of silanol groups, which however undergo condensation upon treatment at very high temperatures [
35]. However, since we have recently shown that in ionogels the ionic liquid strongly interacts with the silica surface, more precisely with the aromatic head of
n-alkyl-imidazolium ionic liquids oriented flatly to the silica surface forming a “bound and immobil” solvation layer [
11], the surface chemistry in gels and ionogels may differ and result in different responses to heat treatment/dehydration. This aspect should be of importance when designing ionogels for real applications.


