Article

Genetic Variation of the Endangered Gentiana lutea L. var. aurantiaca (Gentianaceae) in Populations from the Northwest Iberian Peninsula

by
Oscar González-López
1,
Carlos Polanco
2,
Zsuzsanna György
3,
Andrzej Pedryc
3 and
Pedro A. Casquero
1,*
1
Department of Agrarian Engineering and Sciences, Natural Resources Institute, University of León, Av. Portugal 41, 24071 León, Spain
2
Genetics Lab, Department of Molecular Biology, University of León, Campus de Vegazana, 24071 León, Spain
3
Department of Genetics and Plant Breeding, Corvinus University of Budapest, Ménesi Street, H-1118 Budapest, Hungary
*
Author to whom correspondence should be addressed.
Int. J. Mol. Sci. 2014, 15(6), 10052-10066; https://doi.org/10.3390/ijms150610052
Submission received: 10 April 2014 / Revised: 21 May 2014 / Accepted: 26 May 2014 / Published: 5 June 2014
(This article belongs to the Section Biochemistry)

Abstract

:
Gentiana lutea L. (G. lutea L.) is an endangered plant, patchily distributed along the mountains of Central and Southern Europe. In this study, inter-simple sequence repeat (ISSR) markers were used to investigate the genetic variation in this species within and among populations of G. lutea L. var. aurantiaca of the Cantabrian Mountains (Northwest Iberian Peninsula). Samples of G. lutea L. collected at different locations of the Pyrenees and samples of G. lutea L. subsp. vardjanii of the Dolomites Alps were also analyzed for comparison. Using nine ISSR primers, 106 bands were generated, and 89.6% of those were polymorphic. The populations from the Northwest Iberian Peninsula were clustered in three different groups, with a significant correlation between genetic and geographic distances. Gentiana lutea L. var. aurantiaca showed 19.8% private loci and demonstrated a remarkable level of genetic variation, both among populations and within populations; those populations with the highest level of isolation show the lowest genetic variation within populations. The low number of individuals, as well as the observed genetic structure of the analyzed populations makes it necessary to protect them to ensure their survival before they are too small to persist naturally.

Graphical Abstract

1. Introduction

Gentiana lutea L. (Gentianaceae) is an herbaceous perennial plant native to the mountains of Central and Southern Europe, where their typical habitat is cattle grazing pastures [1]. In summer, the plant produces one tall inflorescence (up to 200 cm) that carries four to 10 pairs of pseudo-umbels, each consisting of 20 flowers, spaced at 5–10-cm intervals. Gentiana lutea is self-incompatible and, thus, depends on pollination by insects to produce any seeds, being pollinated mainly by Hymenoptera and Diptera, although neither has special features to facilitate dispersal [2].
Gentian roots are widely used in bitter beverages, in food products and also in traditional medicine to stimulate the appetite and improve digestion [2]. Such uses have generated a great demand, so that more than 1500 tons of gentian root is produced from 6000 tons of the wild stocks every year [3]. The increasing demand has raised concerns about the species’ extinction, and for this reason, gentian is protected by law throughout Europe; but there are divergent regulations across Europe, and the degree of protection varies regionally, concentrating collections where the regulation is laxer.
Gentiana lutea L. includes G. lutea var. aurantiaca (M. Lainz), G. lutea L. subsp. vardjanii Wraber and G. lutea L. subsp. montserratii (Vivant ex Greuter) Romo. The populations of the Iberian Peninsula correspond to G. lutea, except for small areas of the Pre-Pyrenees and Central Pyrenees, where G. lutea L. subsp. montserratii is endemic. However, most of the populations from the Northwest Iberian Peninsula have flowers ranging in color from orange to almost red, as compared to the yellow flowers of G. lutea. These populations have been classified as Gentiana lutea L. var. aurantiaca [4].
The Iberian Peninsula is the northwestern region of the Mediterranean Basin hotspot, one of the world’s biodiversity hotspots, with a high diversity in endemic vascular plant species. As Europe’s vacation destination, populations of threatened species are increasingly fragmented and isolated to make way for resort development and infrastructure.
This study mainly focuses on the wild populations of G. lutea located in northwestern León province (Spain), in the Cantabrian Mountains. In this region, gentian has been collected historically, for sale and use in medicinal remedies, as in other European regions. Due to the slow growth of this species, its populations have been decimated, and now, they are close to their disappearance and/or are difficult to recover. The main economic sources in the area include coal mining (ceasing activity), ranching and tourism, which all also directly affect gentian populations. People in this area have begun to collect gentian again in a furtive way for extra income due to the current economic crisis. Besides, the local tradition of burning the mountain hillsides to create new pastures for free-range cattle farming can affect the gentian populations, because even though mature plants tolerate fire, undeveloped young plants die because of burning or drying.
Understanding the level of genetic diversity and the population’s genetic structure is important for endangered plant species, because this allows the establishment of effective and efficient conservation practices and can guide choices for their genetic management. Although there are different botanical [5,6] and chemical [7] studies of G. lutea, the genetic variability at population levels remains unknown for this species to date. Nowadays, it is possible to use several molecular methods to analyze the genetic variability in plant species. One of them, inter-simple sequence repeat polymorphism (ISSR), has been successfully used for genetic analysis in the case of medicinal plants, requiring no prior knowledge of the DNA sequence and being universally applicable as dominant markers [8] for rapid exploratory work on new species. Furthermore, ISSRs have been demonstrated to be useful for the analysis of inter- or/and intra-specific genetic diversity in different Gentianaceae species [9,10,11,12].
The aim of this study was to investigate for the first time the level of genetic diversity, within and among populations of G. lutea L. var. aurantiaca from the northwest of the Iberian Peninsula using ISSR markers and to compare their relationship and variation with other populations of G. lutea and G. lutea L. subs. vardjanii collected in the Pyrenees and Dolomite mountains, respectively. The knowledge of the genetic diversity and variation within and among the populations not only enhances our understanding of population dynamics, adaptation and evolution, but also provides useful information for biological conservation of these endangered species.

2. Results

The amplification of the ISSR fragments in the 123 individuals, analyzed with nine primers, yielded 106 unambiguous and reproducible electrophoretic bands ranging from five to 17 bands for each of the primers, with an average of 11.7 bands per primer. Ninety-five bands (89.6%) were polymorphic when comparing all the samples (Table 1); of the 106 bands, 43 (43.4%) were found in the three geographical regions studied, and 21 (19.8%), three (2.8%) and 12 (11.3%) bands were detected only at the Cantabrian (G. lutea L. var. aurantiaca), Pyrenees (G. lutea) and Dolomite Mountains (G. lutea L. subsp. vardjanii), respectively. Among populations of the variety, aurantiaca, the wild populations, CMV, CVJ and CTL, and the cultivated population, FCP, showed just one, two, one and three private loci, respectively. AMOVA analysis revealed significant (p < 0.001) genetic differences among the three taxonomical units analyzed (Table 2). Of the total genetic diversity, 57% was attributable to among taxons and the remaining 43% to within taxons. The percentages of polymorphic loci for a single population ranged from 18.77% (CTL) to 38.68% (CVJ) with an average of 27.79% in the Cantabrian Mountains populations. The Dolomite Mountain populations showed a significant lower mean value (18.16% at p = 0.05 according to the Student’s t-test), although the different number of samples analyzed for each population may be responsible for such results. The average gene diversity was estimated to be 0.0900 at the population level and 0.2168 at the species level. The CVJ population showed the highest level of genetic diversity (0.1329), while the DBT population exhibited the lowest (0.0546). The average Shannon’s indices showed a strong correlation (Pearson’s r = 0.999) with gene diversity, and they were 0.1342 at the population level and 0.3415 at the species level, respectively. The values of gene diversity and Shannon’s index showed a similar trend to the percentages of polymorphic loci.
Table 1. Genetic variation in populations of Gentiana lutea (G. lutea) detected by inter-simple sequence repeat (ISSR) markers.
Geographic Region (Taxon)Population NamesNnPPLNaNeIHe (S.E.)
Cantabrian Mountains (G. lutea var. aurantiaca)CMV83331.131.31131.17430.15790.1042 (0.0167)
CLU82624.531.24531.12970.11920.0780 (0.0149)
CTB83230.191.30191.18000.15680.1046 (0.0172)
CSN82725.471.25471.13610.12180.0801 (0.0154)
CLT82927.361.27361.15300.13980.0922 (0.0159)
CPN83533.021.33021.20330.17160.1152 (0.0181)
CVJ84138.681.38681.22660.19930.1329 (0.0184)
CTN83230.191.30191.18780.16080.1081 (0.0176)
CTR82119.811.19811.12640.10660.0719 (0.0153)
CTL82018.871.18871.12900.10820.0736 (0.0155)
FCP82826.421.26421.15830.13630.0911 (0.0165)
Mean values 29.4527.791.27791.16400.14350.0956 (0.0058)
Group887066.041.66041.23460.23610.1480 (0.0028)
Pyrenees (G. lutea), Dolomite Alps (G. lutea L. sub sp. vardjanii)Group153028.301.2831.18830.15810.1074 (0.0179)
DBN51816.981.16981.11380.09640.0654 (0.0147)
DPL52422.641.22641.15020.12630.0856 (0.0164)
DTZ52018.871.18871.13040.10780.0735 (0.0157)
DBT51514.151.14151.09780.080.0546 (0.0139)
Mean values 19.2518.161.18161.12310.10260.0698 (0.0065)
AllGroup203129.201.29251.17350.14990.1002 (0.0017)
Global mean 26.925.401.25411.15530.13420.0900 (0.0052)
Total1239589.601.89621.34460.34150.2168 (0.0166)
N, sample size; n, number of polymorphic loci; PPL, percentage of polymorphic loci; Na, observed mean number of alleles per locus; Ne, effective mean number of alleles per locus; I, Shannon’s information index; He, Nei’s gene diversity; S.E., standard error.
Table 2. Summary of the analysis of molecular variance (AMOVA) using GenAIEx.
AnalysisSource of Variationd.f.Sum of SquaresEstimated Variance% Total VarianceΦSignificance (p)
G. luteaAmong taxons2552.7219.786570.568<0.001
Within taxons120891.9627.43343
G. lutea var. aurantiacaAmong clusters *2123.6081.765200.198<0.001
Among populations8124.6881.208140.169<0.001
Within populations77456.2505.925670.334<0.001
d.f., degree of freedom; * three clusters obtained after analysis by population structure methods.
Pairwise Nei’s genetic distance based on band frequencies ranged from 0.0261 (between the CTB and CLT populations) to 0.3998 (between the CTR and DBN populations), with a mean of 0.1734. The neighbor joining cladogram based on these genetic distances clustered the populations according to their geographical regions of origin (Figure 1A). A nearly identical cladogram was obtained when the genetic distance based on the genetic diversity index for dominant markers, Qxy, was used (Figure 1B). Two clusters of populations of the variety, aurantiaca, from the Cantabrian Mountains, were obtained in both cladograms with high bootstrap values: the cluster formed by CTL and CTR populations, both located in the southwest of the region, and the cluster formed by CPN, CVJ and CTN, the three populations located in the east of the sampled region.
Figure 1. Unrooted neighbor joining tree of G. lutea populations obtained using pairwise Nei’s genetic distance (A) and the 1 − Qxy distance (B). P*, Pyrenees samples grouped. Black circles in nodes indicate bootstrap support ranging from 90% to 100%; White circles in nodes indicate bootstrap support ranging from 70% to 89%.
Ijms 15 10052 g001
In the PCoA (principal coordinates) analysis using Jaccard’s genetic distance matrix for the 123 samples, the first two coordinates that accounted, respectively, for 40.33% and 24.95% of the total genetic variability clearly discriminate the three geographical groups of individuals (Figure 2A). PCoA analysis was also carried out using only the 88 samples of the variety, aurantiaca, from the Cantabrian Mountains, showing a clearly separated cluster of individuals from the CTL and CTR populations, with the first two coordinates explaining 29.21% and 22.69% of the variation, respectively. All the individuals from eastern populations (CPN, CVJ and CTN) were also grouped, but without a clear boundary that separates the rest of the individuals (Figure 2B).
Figure 2. Two-dimensional ordination of principal coordinate (coord.) analysis of 123 individuals of G. lutea (A) and the subset of 88 individuals of G. lutea var. aurantiaca from the Cantabrian Mountains (B) using Jaccard’s genetic distance between individuals.
Ijms 15 10052 g002
The analysis of individual multilocus genotypes of the 123 samples using the Structure algorithm showed the best clustering solution for K = 5 (∆K = 8.15 with the most closely values of 4.69 and 3.10 for K = 4 and K = 7, respectively). Figure 3 shows the results obtained after the Bayesian analysis performed for K = 5. All the individuals from the Pyrenees and the Dolomite Mountains are clearly separated into two independent clusters, respectively. The 88 individuals from the Cantabrian Mountain populations were assigned to the three remaining clusters: (i) individuals from CTL and CTR (southwestern populations); (ii) individuals from CPN, CVJ (except one individual) and CTN (eastern populations); (iii) individuals from the CMV, CLU, CTB, CSN, FCP and CLT (northwestern populations). Individuals showing probabilities of assignment to more than one cluster were observed in all of the Cantabrian Mountains populations, revealing that there has been some gene flow between clusters. The proportions of individuals that have at least a 5% of probability of assignment to another cluster were 33.3% for the northwestern population group, 37.5% for the eastern population group and 12.5% for the southwestern population group. The Z-test (p < 0.5, two-tailed) comparing such proportions resulted in a non-statistically significant difference.
Figure 3. Probability of assignment to each of the five clusters obtained with the Bayesian approach (Structure, version 2.3.4 [13]) for each of the 123 individuals of G. lutea analyzed. Individuals are sorted according to their population of origin (codes on top).
Ijms 15 10052 g003
AMOVA analysis further revealed significant (p < 0.001) differences among the clusters and populations of G. lutea var. aurantiaca. Of the total genetic diversity, 20% was attributable to among the above clusters of populations, 14% among the populations and the remainder (67%) to within population diversity (Table 2).
The Mantel test detected a significant correlation (r = 0.945; p = 0.001) between Nei’s distance and geographical distance for the 16 populations (samples from the Pyrenees were grouped as a single population located at PBQ coordinates) and also for the 11 populations from the Cantabrian Mountains (r = 0.844; p = 0.001) when analyzed independently. No significant correlation (r = 0.457; p = 0.159) was observed when the four populations from the Dolomite Mountains were analyzed alone. The Mantel test using Jaccard’s distances calculated for the samples from the Pyrenees Mountains did not detect a significant correlation with the geographical distances (r = 0.248; p = 0.062) between those populations.

3. Discussion

There are some publications about gentians, where the use of molecular markers are an important part of the study, like Struwe and Albert [14], with a large study about Gentianaceae; another is more specific in the phylogeny of the European gentians based on the analysis of chloroplast DNA [15]. However, we report the first study of genetic polymorphism in G. lutea L. populations using ISSR markers. This is also the first study of variation using samples that correspond to the description of G. lutea L. var. aurantiaca. Although ISSR markers have not been used in Gentiana lutea L. earlier, this methodology has been used successfully in diversity and botanic studies of other gentians [9,10,11,12].
Applying different statistics and analysis (Nei’s distance, Qxy genetic diversity, Jaccard’s distance and Structure for multilocus genotypes), we observed clear genetic differences between samples collected in the Dolomite Alps (G. lutea L. subsp. vardjanii) and those sampled in the Iberian Peninsula (G. lutea L. and G. lutea L. var. aurantiaca), as expected, due to their taxonomical classification. Furthermore, the individuals from the Pyrenees and Cantabrian Mountains are also clearly differentiated in our analysis, giving support to previous taxonomic classifications for the red flowered populations from the Cantabrian Mountains, such as the subspecies, aurantiaca [16], or, even, the species, G. aurantiaca [17].
Renobales [4] indicated that the orange or reddish corolla was the only significant morphological difference when comparing with yellow gentian (G. lutea L.), and therefore, he proposed their classification as a variety. However, we also reported a large number of ISSRs bands (21 out of 106, 19.8%) detected only in the red flowered plants from the Cantabrian Mountains populations. This percentage is about twice as much as the percentages obtained when the gentian species, G. atuntsiensis (8.5%) and G. striolata (11.3%), were compared using 129 ISSR bands [10].
Renobales [4] stated the existence of the variety, aurantiaca, all along the Cantabrian Mountains, but the Ventana Pass (43°03'20.86''N 6°00'28.03''W, approximately in the center of the Cantabrian Mountains) was set as the easternmost point from which their populations are less common, and the plants show this distinguishing feature attenuated. Anchisi [18] also describes a population at Laurentii Lake, in the Pyrenees, showing the same reddish corolla. We reported here the presence of populations that correspond to the description of G. lutea L. var. aurantiaca, located outside of the growing areas described by Renobales [4] in the Cantabrian Mountains.
The analysis of the Cantabrian Mountain populations revealed that they are clustered in three different groups with a significant correlation between genetic and geographic distances. The analysis of genetic distances using neighbor joining trees and PCoA methods showed a well-defined cluster, including the two southwestern populations, CTL and CTR. The Bayesian analysis of individual genotypes also separated CTL and CTR from the rest of the populations and grouped the eastern populations (CPN, CVJ and CTN) in a different cluster. Besides, AMOVA analysis assigned 20% of the total variance to differences among the three clusters. This population structure can be explained by the lack of continuity in the typical mountainous habitat where gentian grows. This discontinuity might have generated the partial isolation of the CTL and CTR populations. Gentiana lutea L. is a self-incompatible species and, thus, depends on pollination by insects to produce any seeds [19,20]. Outcrossing is further suggested by field observations of flowering plants attracting bumblebees, known to be the foremost pollinators of many alpine Gentiana species, such as G. lutea L. [21] or G. cruciata L. [22]. Their long foraging flights may result in relatively frequent long-distance pollen dispersal in G. lutea. The small and light seeds can be blown by the wind, and gene flow by seeds can occur among close populations. Therefore, this potential for dispersal by both pollen and seeds may help to explain gene flow between neighboring populations and genetic isolation between widely separated populations.
Zhang et al. [10] reported high levels of ISSR diversity in G. striolata (percentage of polymorphic loci (PPL) = 80.5% at the species level, with a range from 40.42% to 52.57% at the population level) and G. atuntsiensis (PPL = 70.2% at the species level, with a range from 33.41%–46.58% at the population level). Several endangered Chinese gentians (Gentiana macrophylla Pall, Gentiana dahurica Fisch, Gentiana straminea Maxim and Gentiana crassicaulis Duthie ex Burk) showed lower levels of ISSR diversity at the species level, with a range of PPL = 43.75%–67.71% [12]. The estimates of genetic diversity in G. lutea L. var. aurantiaca demonstrated a remarkable level of genetic variation among populations (PPL = 66.04%, Nei’s gene diversity (He) = 0.1480) and low-moderate genetic variation within populations when compared with G. striolata (PPL for a single population ranged from 18.87% to 38.68%; the average genetic diversity at the population level He = 0.0956). The most threatened taxa have lower genetic diversity than closely related, non-threatened taxa, indicating reduced reproductive fitness and elevated extinction risks [23]. Gentiana lutea L. var. aurantiaca is a perennial herb with a patchy distribution. The populations are often located in distant mountains and are isolated from each other by plateaus or valleys. Southwestern populations (CTL and CTR, partially isolated from the rest) show the lowest level of genetic diversity (PPL = 18.87 and 19.81; He = 0.0719 and 0.0736), due to the higher genetic isolation of these two populations.
Rare species are typically considered to be genetically less variable than common and widespread species [23]. This indicates that the level of genetic variation might be less strongly associated with population size in rare plants compared with common plants. This is because genetic variation is likely to be low in all populations of rare plants and higher in all populations of common plants regardless of the size of the populations [24]. The observed generality of the positive relationships between population size, plant fitness and genetic diversity implies that the negative effects of habitat fragmentation on plant fitness and genetic variation are common. Moreover, the stronger positive associations were observed in self-incompatible species [25] and, to some degree, in rare species, such as G. lutea, that are, to a greater extent, affected by the effects of habitat fragmentation [24]. Kery et al. [25] studied reproduction and offspring performance in relation to population size in G. lutea. Reproduction was strongly reduced in small populations, where plants produced fewer seeds per fruit and per plant. Reproduction was most strongly depressed in populations consisting of fewer than 500 plants, which occurs in the studied gentian populations (with less than 150 plants per population). These small populations may face an increased short-term risk of extinction, because of reduced reproduction, and an increased long-term risk, because they are less able to respond to environmental changes. There is controversy about the impact of genetic factors on the risk of extinction for threatened species and populations in nature [26]. Population size is reduced by habitat loss, over-exploitation, the impact of introduced species and pollution, until it reaches a point where stochastic factors further elevate extinction risk [27].
The genetic structure of plant populations reflects the interactions of various evolutionary processes, including the long-term evolutionary history, such as shifts in distribution, habitat fragmentation and population isolation, mutation, genetic drift, mating system, gene flow and selection [28]. A high level of population differentiation may be explained by genetic drift and habitat fragmentation, leading to the genetic isolation of populations [29]. Human activity is the main cause of this habitat fragmentation, reduced population size and, consequently, restricted gene flow [30]. The observed genetic structure of the analyzed populations of Gentiana lutea L. var. aurantiaca from the Cantabrian Mountains implies that as many populations of this variety as possible should be considered for conservation practice.

4. Experimental Section

4.1. Study Species and Population Sampling
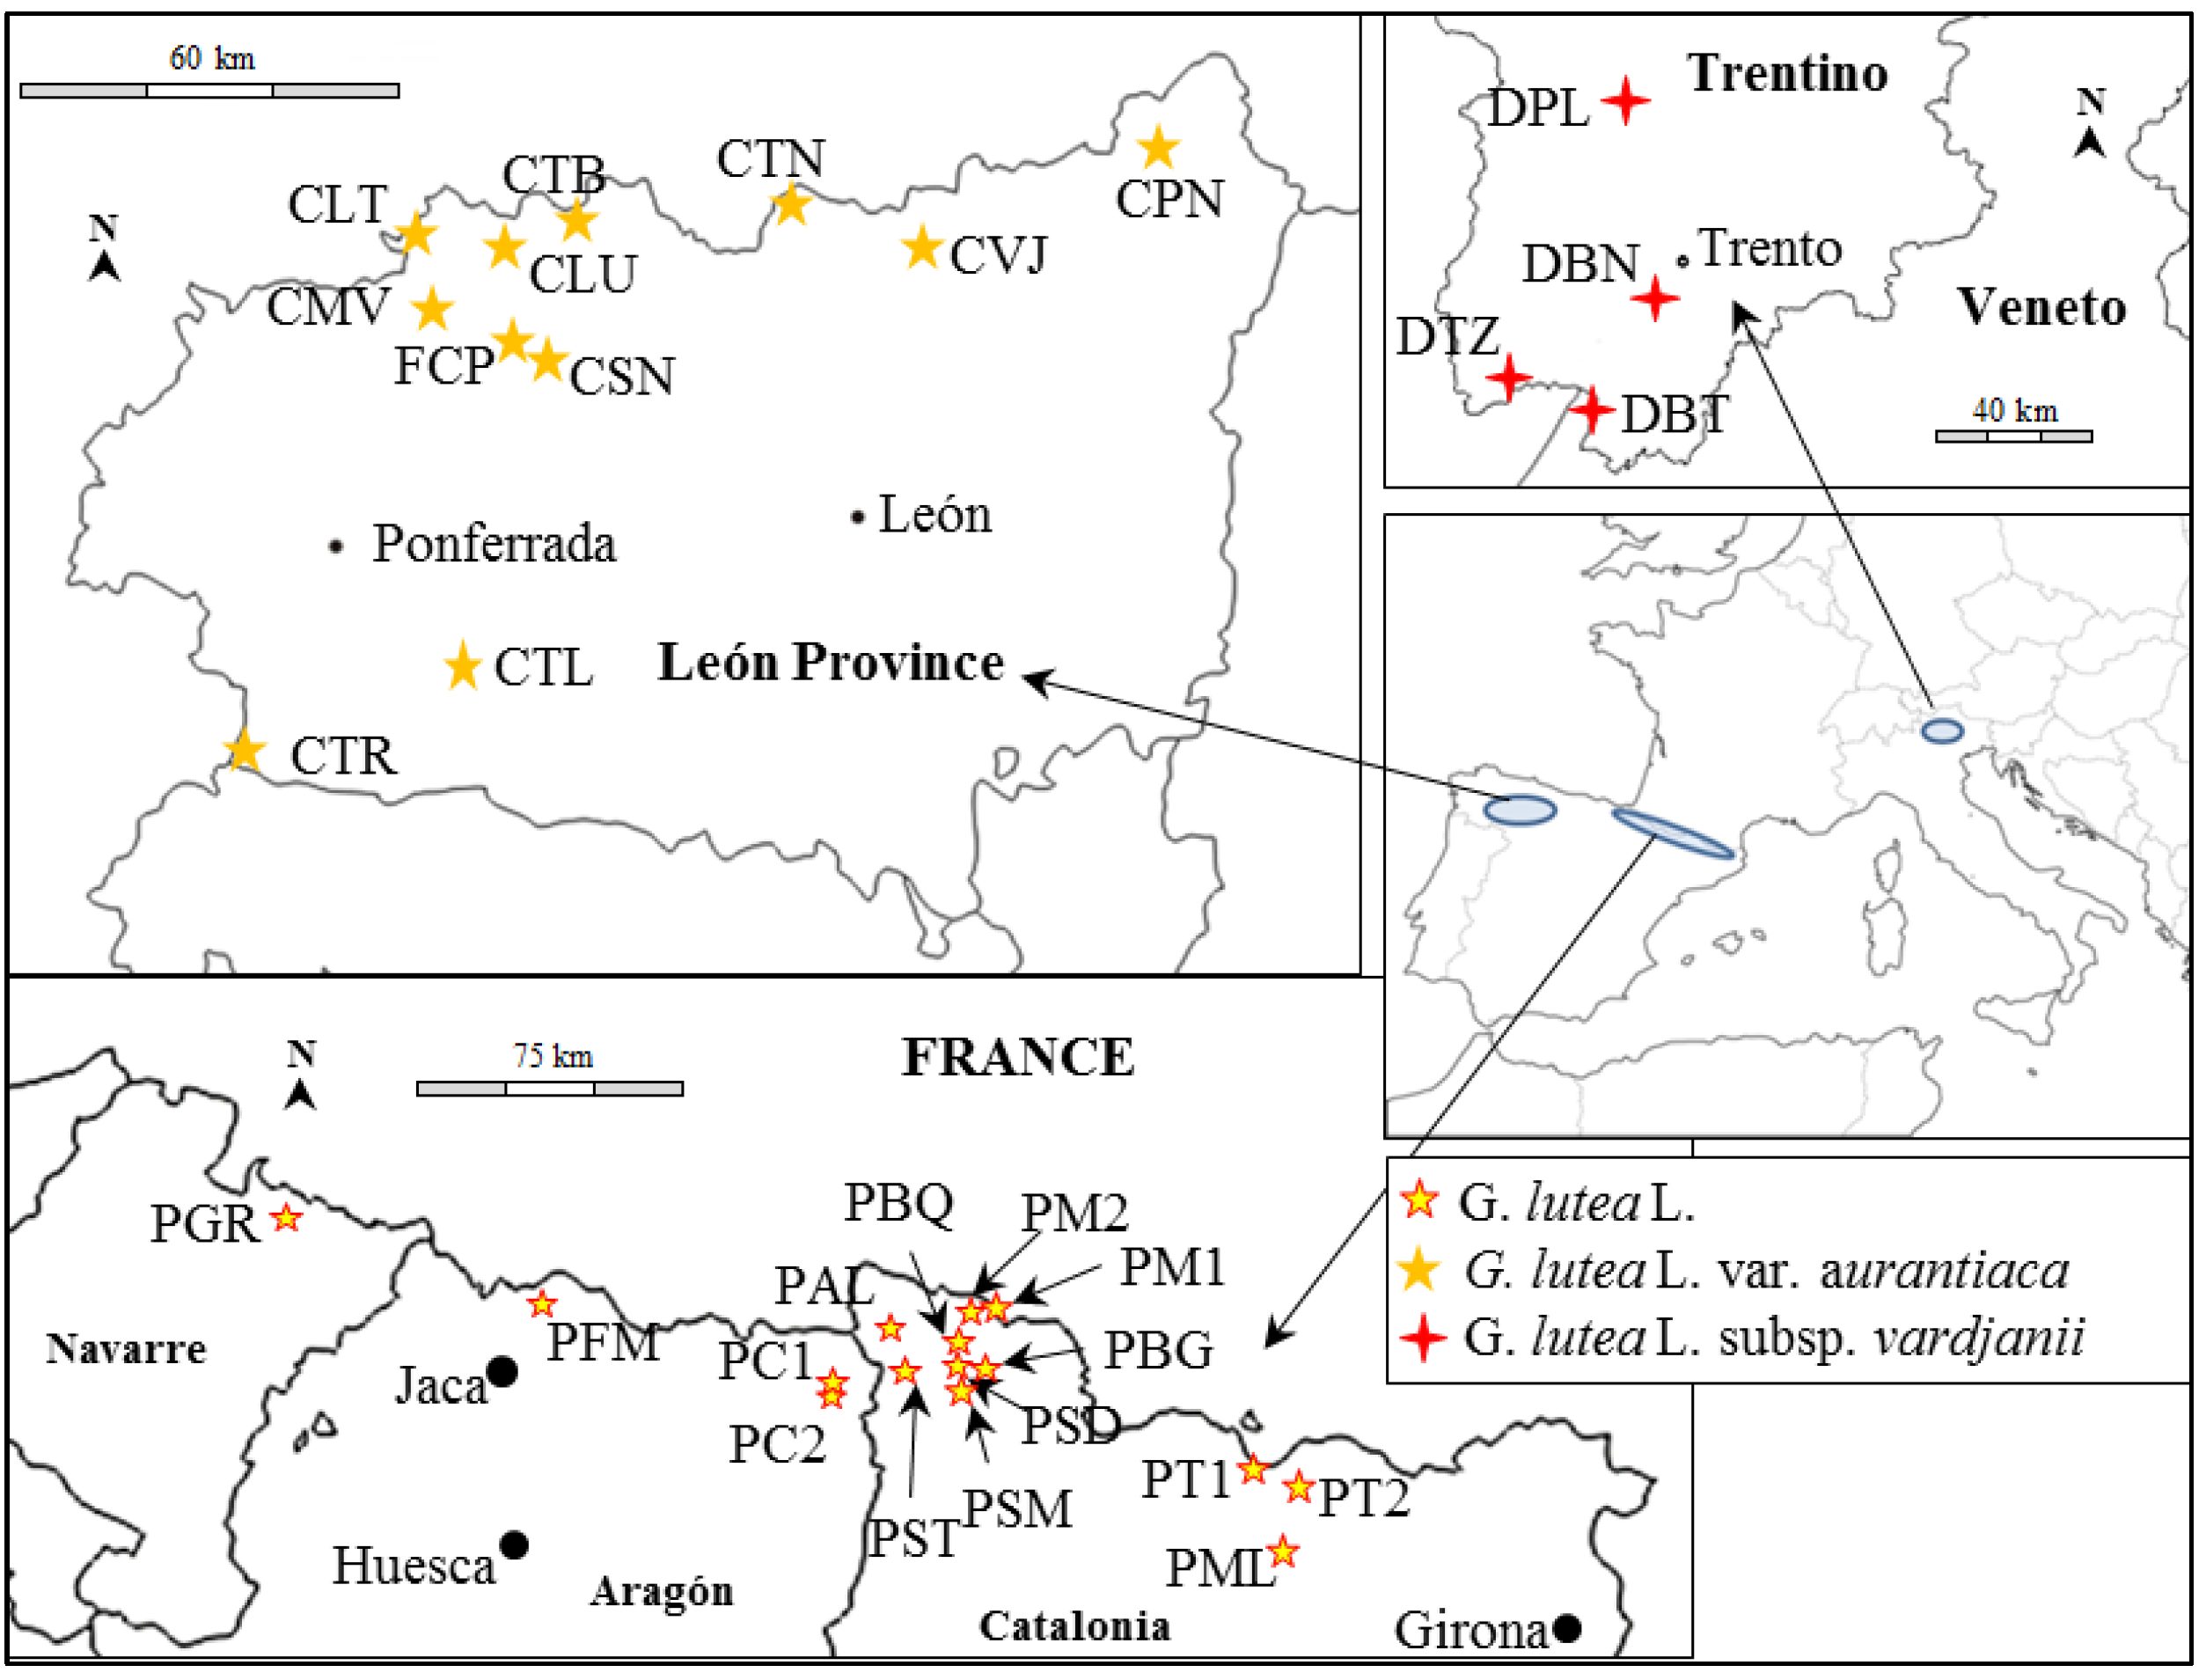
Root samples of 123 individuals were collected from three regions (Figure 4; Table 3): eight individuals from each of 10 populations of G. lutea L. var. aurantiaca, in the Cantabrian Mountains (northwest of Iberian Peninsula); one sample of G. lutea L. from fifteen locations along the Pyrenees, and five individuals from each of four populations of G. lutea subsp. vardjanii from the Dolomite Alps, near Trento (Italy). All wild populations studied are endangered due to their small size.
Figure 4. Maps showing the location of sampled populations of Gentiana lutea L., G. lutea subsp. vardjanii and G. lutea var. aurantiaca. Population names correspond to those given in Table 3.
Ijms 15 10052 g004
Table 3. Populations of G. lutea surveyed.
LocationPop name (Figure 1)Latitude (North)LongitudeAltitude (m)Sample Size
MatalavillaCMV42°52'13''06°23'06''W17948
LumajoCLU42°59'14''06°15'33''W13968
Torre de BabiaCTB43°00'47''06°05'59''W18018
SenraCSN42°50'07''06°11'25''W17248
LeitariegosCLT42°59'18''06°25'26''W18808
PontónCPN43°06'02''05°00'29''W12788
ValdetejaCVJ42°56'28''05°27'34''W14198
ToninCTN43°00'15''05°41'00''W12948
TrevincaCTR42°09'30''06°44'29''W17278
TelenoCTL42°21'20''06°25'22''W18678
Cultivated fieldFCP42°52'09''06°12'49''W14398
Collada de Tosas 1PT142°20'53''01°59'08''E17381
Collada de Tosas 2PT242°20'29''02°01'49''E16541
La MolinaPML42°17'13''02°02'07''E15781
La BonaiguaPBG42°40'10''00°58'11''E18131
SalarduPSD42°40'20''00°54'58''E15161
MontgarriPMG42°45'27''01°01'58''E16021
Montgarri 2PMA42°45'33''01°01'14''E15881
BaqueiraPBQ42°43'31''00°55'59''E17641
Sant MauriciPSM42°39'28''00°55'24''E15161
Artiga de LinPAL42°40'50''00°42'24''E14581
SenetPST42°36'23''00°46'01''E14871
Cerler 1PC142°33'55''00°34'01''E19021
Cerler 2PC242°33'43''00°34'03''E18921
GaraioaPGR42°53'23''01°13'51''W11701
FormigalPFM42°47'45''00°24'11''W17011
BondoneDBN46°00'34''11°02'50''E15575
PellerDPL46°19'04''10°57'34''E19045
TremalzoDTZ45°50'15''10°41'23''E16945
BrentonicoDBT45°47'16''10°54'04''E14825
Eight individuals from a cultivated population of Gentiana lutea L. var. aurantiaca have also been analyzed. This population was cultivated in an experimental field located in the Cantabrian Mountains where natural conditions allow gentian also to be found growing wild in the area.
Populations were sampled randomly; individuals 5–10 m from each another were chosen to avoid collecting the same plant, since, due to their root development, it is possible that several shoots correspond to the same individual. The altitude of the sampled populations ranged from 1170 to 1904 m. The collected fresh roots were dried in a ventilated oven at 38 °C for 72 h to avoid degradation of their chemical compounds. Dried roots were stored at room temperature with silica gel, since these roots are very hydrophilic.

4.2. DNA Extraction and Polymerase Chain Reaction (PCR) Amplification of Inter-Simple Sequence Repeat Polymorphism (ISSR) Markers

Genomic DNA was extracted from 0.2 g of dried root ground using a hammer mill with a 1-mm diameter sieve. The extraction protocol was based on the CTAB (Cetyl Trimethyl Ammonium Bromide) method [31]. DNA concentration and quality was assessed using a NanoDrop spectrophotometer (NanoDrop Technologies, Wilmington, DE, USA) and on 1% agarose gel.
Polymerase chain reaction (PCR) was performed in 15 µL of reaction volume containing 100 ng DNA, 10× DreamTaq Green Buffer (Thermo Scientific, Waltham, MA, USA), 2.5 mM MgCl2, 0.02 mM dNTP mix, 5 µmol of primers, 0.25 units of DreamTaq Green DNA Polymerase (Thermo Scientific) and sterile distilled water. Sixteen primers from UBC primer set No.9 (Biotechnology Laboratory, University of British Columbia, Vancouver, BC, Canada), were selected based on previous studies on other Gentianaceae species [9,10,12,32,33] and were screened for PCR amplification. Nine primers (UBC 807, 809, 810, 812, 817, 825, 827, 842 and 857) that gave clear and reproducible banding patterns in G. lutea were chosen for the analysis. For the amplification of ISSR fragments, the following program was used: initial denaturation at 95 °C for 1 min; followed by 45 cycles of 94 °C for 30 s, 50 °C for 30 s, 72 °C for 2 min; and a final synthesis at 72 °C for 10 min.
The PCR products were applied on a 1.5% (w/v) ethidium bromide-stained agarose gel in 1× TBE (Tris–Borate–EDTA) buffer with xylencyanol loading buffer. PCR products were separated for 2 or 3 h (depending on the primer used) at 100 V, avoiding distortions caused by higher voltages. The amplified DNA fragments were documented by using image analysis software Total Lab 1.2 (TotalLab Ltd., Newcastle upon Tyne, UK). The ISSR amplification protocol was reproduced at least twice for each DNA sample.

4.3. Data Analysis

Only bands that could be unambiguously scored were used in the analysis. Owing to the dominant character of ISSR markers, each ISSR band was treated as a binary character and was scored as present (1) or absent (0), and it was assumed that each observed band represented the phenotype at a single biallelic locus. Popgene version 1.32 [34] was used to calculate the genetic diversity parameters of the populations: the percentage of polymorphic loci (PPL), the observed number of alleles (Na), the effective number of alleles (Ne), the gene diversity (He) [35] and Shannon’s information index (I) [36]. The fifteen samples obtained from different locations across the Pyrenees Mountains were synthetically grouped for comparison purposes.
The population structure was studied using different methods. First, we obtained an unrooted neighbor joining cladogram [37] based on Nei’s genetic distance [38] matrix between populations. The cladogram was constructed using the NEIGHBOR module in PHYLIP version 3.695 [39]. The genetic diversity, Qxy [40], matrix between populations was also calculated, and a second dendrogram was produced from the genetic distances (estimated as 1 − Qxy) as above. The significance of the branch order for both cladograms was examined independently using 100 bootstraps across the set of loci to generate neighbor joining trees. A majority rule consensus tree was constructed by using the CONSENSE module in PHYLIP.
Grouping of the samples was also carried out by PCoA analysis based on Jaccard’s genetic distance matrix of the individuals, and implemented in the software, Genetic Analysis in Excel (GenAIEx) version 6.5 [41].
The third approach used the program, Structure version 2.3.4 [13], which identifies clusters of related individuals from multilocus genotypes. Individuals were assigned (probabilistically) to a cluster or jointly to two or more clusters if their haplotypes indicated that they are admixed; each cluster is characterized by a set of allele frequencies at each locus [13]. To choose the best number of genetic clusters (K), multiple values were tested (from 1 to 7) using a length of burning period of 10,000 steps and 10 repetitions. The results were analyzed using the on-line tool, Structure Harvester [42], which implements the method of Evanno, Regnaut and Gaudet [43] to detect the true number of clusters in a non-homogeneous sample of individuals.
Analysis of molecular variance (AMOVA) was also used to describe the genetic structure and variability among and within populations using GenAIEx version 6.5 [41]. The variance components were tested statistically by nonparametric randomization tests using 999 permutations.
In order to test the correlation between genetic and geographic distances among populations, the Mantel test was performed using GenAIEx (version 6.5), computing 999 permutations.

5. Conclusions

The gentian populations from the Northwest Iberian Peninsula were clustered in three different groups, with a significant correlation between genetic and geographic distances. Gentiana lutea L. var. aurantiaca showed a remarkable level of genetic variation, both among populations and within populations; those populations with the highest level of isolation show the lowest genetic variation within populations. The low number of individuals, as well as the observed genetic structure of the analyzed populations makes it necessary to protect them to ensure their survival before they are too small to persist naturally.

Acknowledgments

We thank the following: the Regional Ministry of Education of the Junta de Castilla y León and the European Social Fund PIRTU grants; Orden EDU/1867/2009; the Regional Ministry of the Environment of the Junta de Castilla y León, Project (2008/00134/001); the staff from the Forest and Range Management Research Institute (CRA Agricultural Research Council-Trento) for collaborating to collect gentian material from the Dolomite Alps.

Author Contributions

All authors contributed equally to this work.

Conflicts of Interest

The authors declare no conflict of interest.

References

  1. Aiello, N.; Bontempo, R.; Vender, C. Use of morphological features and amarogentin content for characterization of wild yellow gentian (Gentiana lutea L.) populations in north-east Italy. Acta Bot. Gallica 2013, 160, 33–41. [Google Scholar]
  2. Struwe, L. Gentian Research Network. Available online: http://gentian.rutgers.edu (accessed on 10 March 2014).
  3. Ando, H.; Hirai, Y.; Fujii, M.; Hori, Y.; Fukumura, M.; Niiho, Y.; Nakajima, Y.; Shibata, T.; Toriizuka, K.; Ida, Y. The chemical constituents of fresh gentian root. J. Nat. Med. 2007, 61, 269–279. [Google Scholar] [CrossRef]
  4. Renobales, G. Notas acerca del tratamiento de las gentianaceae para flora ibérica. Anales. Jard. Bot. Madrid 2003, 60, 461–469. (In Spanish) [Google Scholar]
  5. Ho, T.; Liu, S. A Worldwide Monograph of Gentiana; Science Press: Beijing, China, 2001. [Google Scholar]
  6. Struwe, L.; Kadereit, J.W.; Klackenberg, J.; Nilsson, S.; Thiv, M.; Hagen, K.B.V.; Albert, V.A. Systematics, character evolution, and biogeography of gentianaceae, including a new tribal and subtribal classification. In Gentianaceae: Systematics and Natural History; Struwe, L., Albert, V.A., Eds.; Cambridge University Press: Cambridge, UK, 2002; pp. 21–309. [Google Scholar]
  7. Carnat, A.; Fraisse, D.; Carnat, A.P.; Felgines, C.; Chaud, D.; Lamaison, J.L. Influence of drying mode on iridoid bitter constituent levels in gentian root. J. Sci. Food Agric. 2005, 85, 598–602. [Google Scholar] [CrossRef]
  8. Sa, O.; Pereira, J.A.; Baptista, P. Optimization of DNA extraction for RAPD and ISSR analysis of Arbutus unedo L. leaves. Int. J. Mol. Sci. 2011, 12, 4156–4164. [Google Scholar] [CrossRef]
  9. Ge, X.J.; Zhang, L.B.; Yuan, Y.M.; Hao, G.; Chiang, T.Y. Strong genetic differentiation of the east-Himalayan Megacodon stylophorus (Gentianaceae) detected by inter-simple sequence repeats (ISSR). Biodivers. Conserv. 2005, 14, 849–861. [Google Scholar] [CrossRef]
  10. Zhang, X.L.; Yuan, Y.M.; Ge, X.J. Genetic structure and differentiation of Gentiana atuntsiensis WW Smith and G. striolata TN Ho (Gentianaceae) as revealed by ISSR markers. Bot. J. Linn. Soc. 2007, 154, 225–232. [Google Scholar] [CrossRef]
  11. Yang, L.C.; Zhou, G.Y.; Chen, G.C. Genetic diversity and population structure of Swertia tetraptera (Gentianaceae), an endemic species of Qinghai-Tibetan plateau. Biochem. Syst. Ecol. 2011, 39, 302–308. [Google Scholar] [CrossRef]
  12. Zheng, P.; Zhang, K.; Wang, Z. Genetic diversity and gentiopicroside content of four gentiana species in China revealed by ISSR and HPLC methods. Biochem. Syst. Ecol. 2011, 39, 704–710. [Google Scholar]
  13. Pritchard, J.K.; Stephens, M.; Donnelly, P. Inference of population structure using multilocus genotype data. Genetics 2000, 155, 945–959. [Google Scholar]
  14. Struwe, L.; Albert, V.A. Gentianaceae: Systematics and Natural History; Cambridge University Press: Cambridge, UK, 2002. [Google Scholar]
  15. Gielly, L.; Taberlet, P. A phylogeny of the European gentians inferred from chloroplast trnl (uaa) intron sequences. Bot. J. Linn. Soc. 1996, 120, 57–75. [Google Scholar]
  16. Lainz, M. Mis Contribuciones al Conocimiento de la Flora de Asturias; (In Spanish). Diputación Provincial de Asturias, Instituto de Estudios Asturianos (del C.S.I.C): Oviedo, Spain, 1982. [Google Scholar]
  17. Silva, F.J.; Gómez, F.; García, X.R.; Blanco-Dios, J.B. Aportacions a flora de galicia, VI. Nova Acta Cient. Compostel. 2000, 10, 21–33. (In Spanish) [Google Scholar]
  18. Anchisi, E. Gentiana lutea L., la variabilità morfologica e le sue ibridazioni interspecifiche. Aigba Notes 2008, 30–39. [Google Scholar]
  19. Bucher, T. Biosystematische Untersuchungen an Gentiana lutea L., Gentiana purpurea L. und deren Hybriden (Biosystematic Investigations on Gentiana lutea L., Gentiana purpurea L. and Their Hybrids). Master’s Thesis, University of Zürich, Zürich, Switzerland, 1987. [Google Scholar]
  20. Hegi, G. Illustrierte Flora von Mitteleuropa; (In German). Julius Friedrich Lehmann: München, Germany, 1927. [Google Scholar]
  21. Kozuharova, E. Wild bees as pollinators of four Gentiana species on mount Vitosa (Bulgaria). Bocconea 1997, 5, 619–623. [Google Scholar]
  22. Kozuharova, E.K.; Anchev, M.E.; Popov, P. The pollination ecology of Gentiana cruciata (Gentianaceae)-specifics of a Bulgarian population in comparison to Dutch populations. Nord. J. Bot. 2003, 23, 365–372. [Google Scholar] [CrossRef]
  23. Spielman, D.; Brook, B.W.; Frankham, R. Most species are not driven to extinction before genetic factors impact them. Proc. Natl. Acad. Sci. USA 2004, 101, 15261–15264. [Google Scholar] [CrossRef]
  24. Leimu, R.; Mutikainen, P.I.A.; Koricheva, J.; Fischer, M. How general are positive relationships between plant population size, fitness and genetic variation? J. Ecol. 2006, 94, 942–952. [Google Scholar] [CrossRef]
  25. Kery, M.; Matthies, D.; Spillmann, H.H. Reduced fecundity and offspring performance in small populations of the declining grassland plants Primula veris and Gentiana lutea. J. Ecol. 2000, 88, 17–30. [Google Scholar] [CrossRef]
  26. Frankham, R.; Briscoe, D.A.; Ballou, J.D. Introduction to Conservation Genetics; Cambridge University Press: Cambridge, UK, 2002. [Google Scholar]
  27. Shaffer, M.L. Minimum population sizes for species conservation. BioScience 1981, 31, 131–134. [Google Scholar] [CrossRef]
  28. Schaal, B.A.; Hayworth, D.A.; Olsen, K.M.; Rauscher, J.T.; Smith, W.A. Phylogeographic studies in plants: Problems and prospects. Mol. Ecol. 1998, 7, 465–474. [Google Scholar] [CrossRef]
  29. Hogbin, P.M.; Peakall, R. Evaluation of the contribution of genetic research to the management of the endangered plant Zieria prostrata. Conserv. Biol. 1999, 13, 514–522. [Google Scholar] [CrossRef]
  30. Qian, X.; Wang, C.X.; Tian, M. Genetic diversity and population differentiation of Calanthe tsoongiana, a rare and endemic orchid in China. Int. J. Mol. Sci. 2013, 14, 20399–20413. [Google Scholar] [CrossRef]
  31. Pirttilä, A.; Hirsikorpi, M.; Kämäräinen, T.; Jaakola, L.; Hohtola, A. DNA isolation methods for medicinal and aromatic plants. Plant Mol. Biol. Rep. 2001, 19, 273–273. [Google Scholar] [CrossRef]
  32. He, T.; Yang, L.; Zhao, Z. Embryogenesis of Gentiana straminea and assessment of genetic stability of regenerated plants using inter simple sequence repeat (ISSR) marker. Afr. J. Biotechol. 2011, 10, 7604–7610. [Google Scholar]
  33. Gomez-Gomez, L.; Ahrazem, O.; Herranz, J.M.; Ferrandis, P. Genetic characterization and variation within and among populations of Anthyllis rupestris Coss., and endangered endemism of southern Spain. Biochem. Syst. Ecol. 2012, 45, 138–147. [Google Scholar] [CrossRef]
  34. Yeh, F.C.; Boyle, T.J.B. Population genetic analysis of co-dominant and dominant markers and quantitative traits. Belg. J. Bot. 1997, 129, 157–163. [Google Scholar]
  35. Nei, M. Analysis of gene diversity in subdivided populations. Proc. Natl. Acad. Sci. USA 1973, 70, 3321–3323. [Google Scholar] [CrossRef]
  36. Lewontin, R.C. The apportionment of human diversity. Evol. Biol. 1972, 6, 381–398. [Google Scholar] [CrossRef]
  37. Saitou, N.; Nei, M. The neighbor-joining method: A new method for reconstructing phylogenetic trees. Mol. Biol. Evol. 1987, 4, 406–425. [Google Scholar]
  38. Nei, M. Genetic distance between populations. Am. Nat. 1972, 106, 283–292. [Google Scholar]
  39. PHYLIP (Phylogeny Inference Package). Available online: http://evolution.genetics.washington.edu/phylip.html (accessed on 11 November 2013).
  40. Nei, M.; Kumar, S. Molecular Evolution and Phylogenetics; Oxford University Press: Oxford, UK, 2000. [Google Scholar]
  41. Peakall, R.; Smouse, P.E. Genalex 6.5: Genetic analysis in Excel. Population genetic software for teaching and research—An update. Bioinformatics 2012, 28, 2537–2539. [Google Scholar] [CrossRef]
  42. Earl, D.; von Holdt, B. STRUCTURE HARVESTER: A website and program for visualizing STRUCTURE output and implementing the evanno method. Conserv. Genet. Resour. 2012, 4, 359–361. [Google Scholar] [CrossRef]
  43. Evanno, G.; Regnaut, S.; Goudet, J. Detecting the number of clusters of individuals using the software STRUCTURE: A simulation study. Mol. Ecol. 2005, 14, 2611–2620. [Google Scholar] [CrossRef]

