2.1. Preparation and Characterization of 14-3-3ζ Proteins
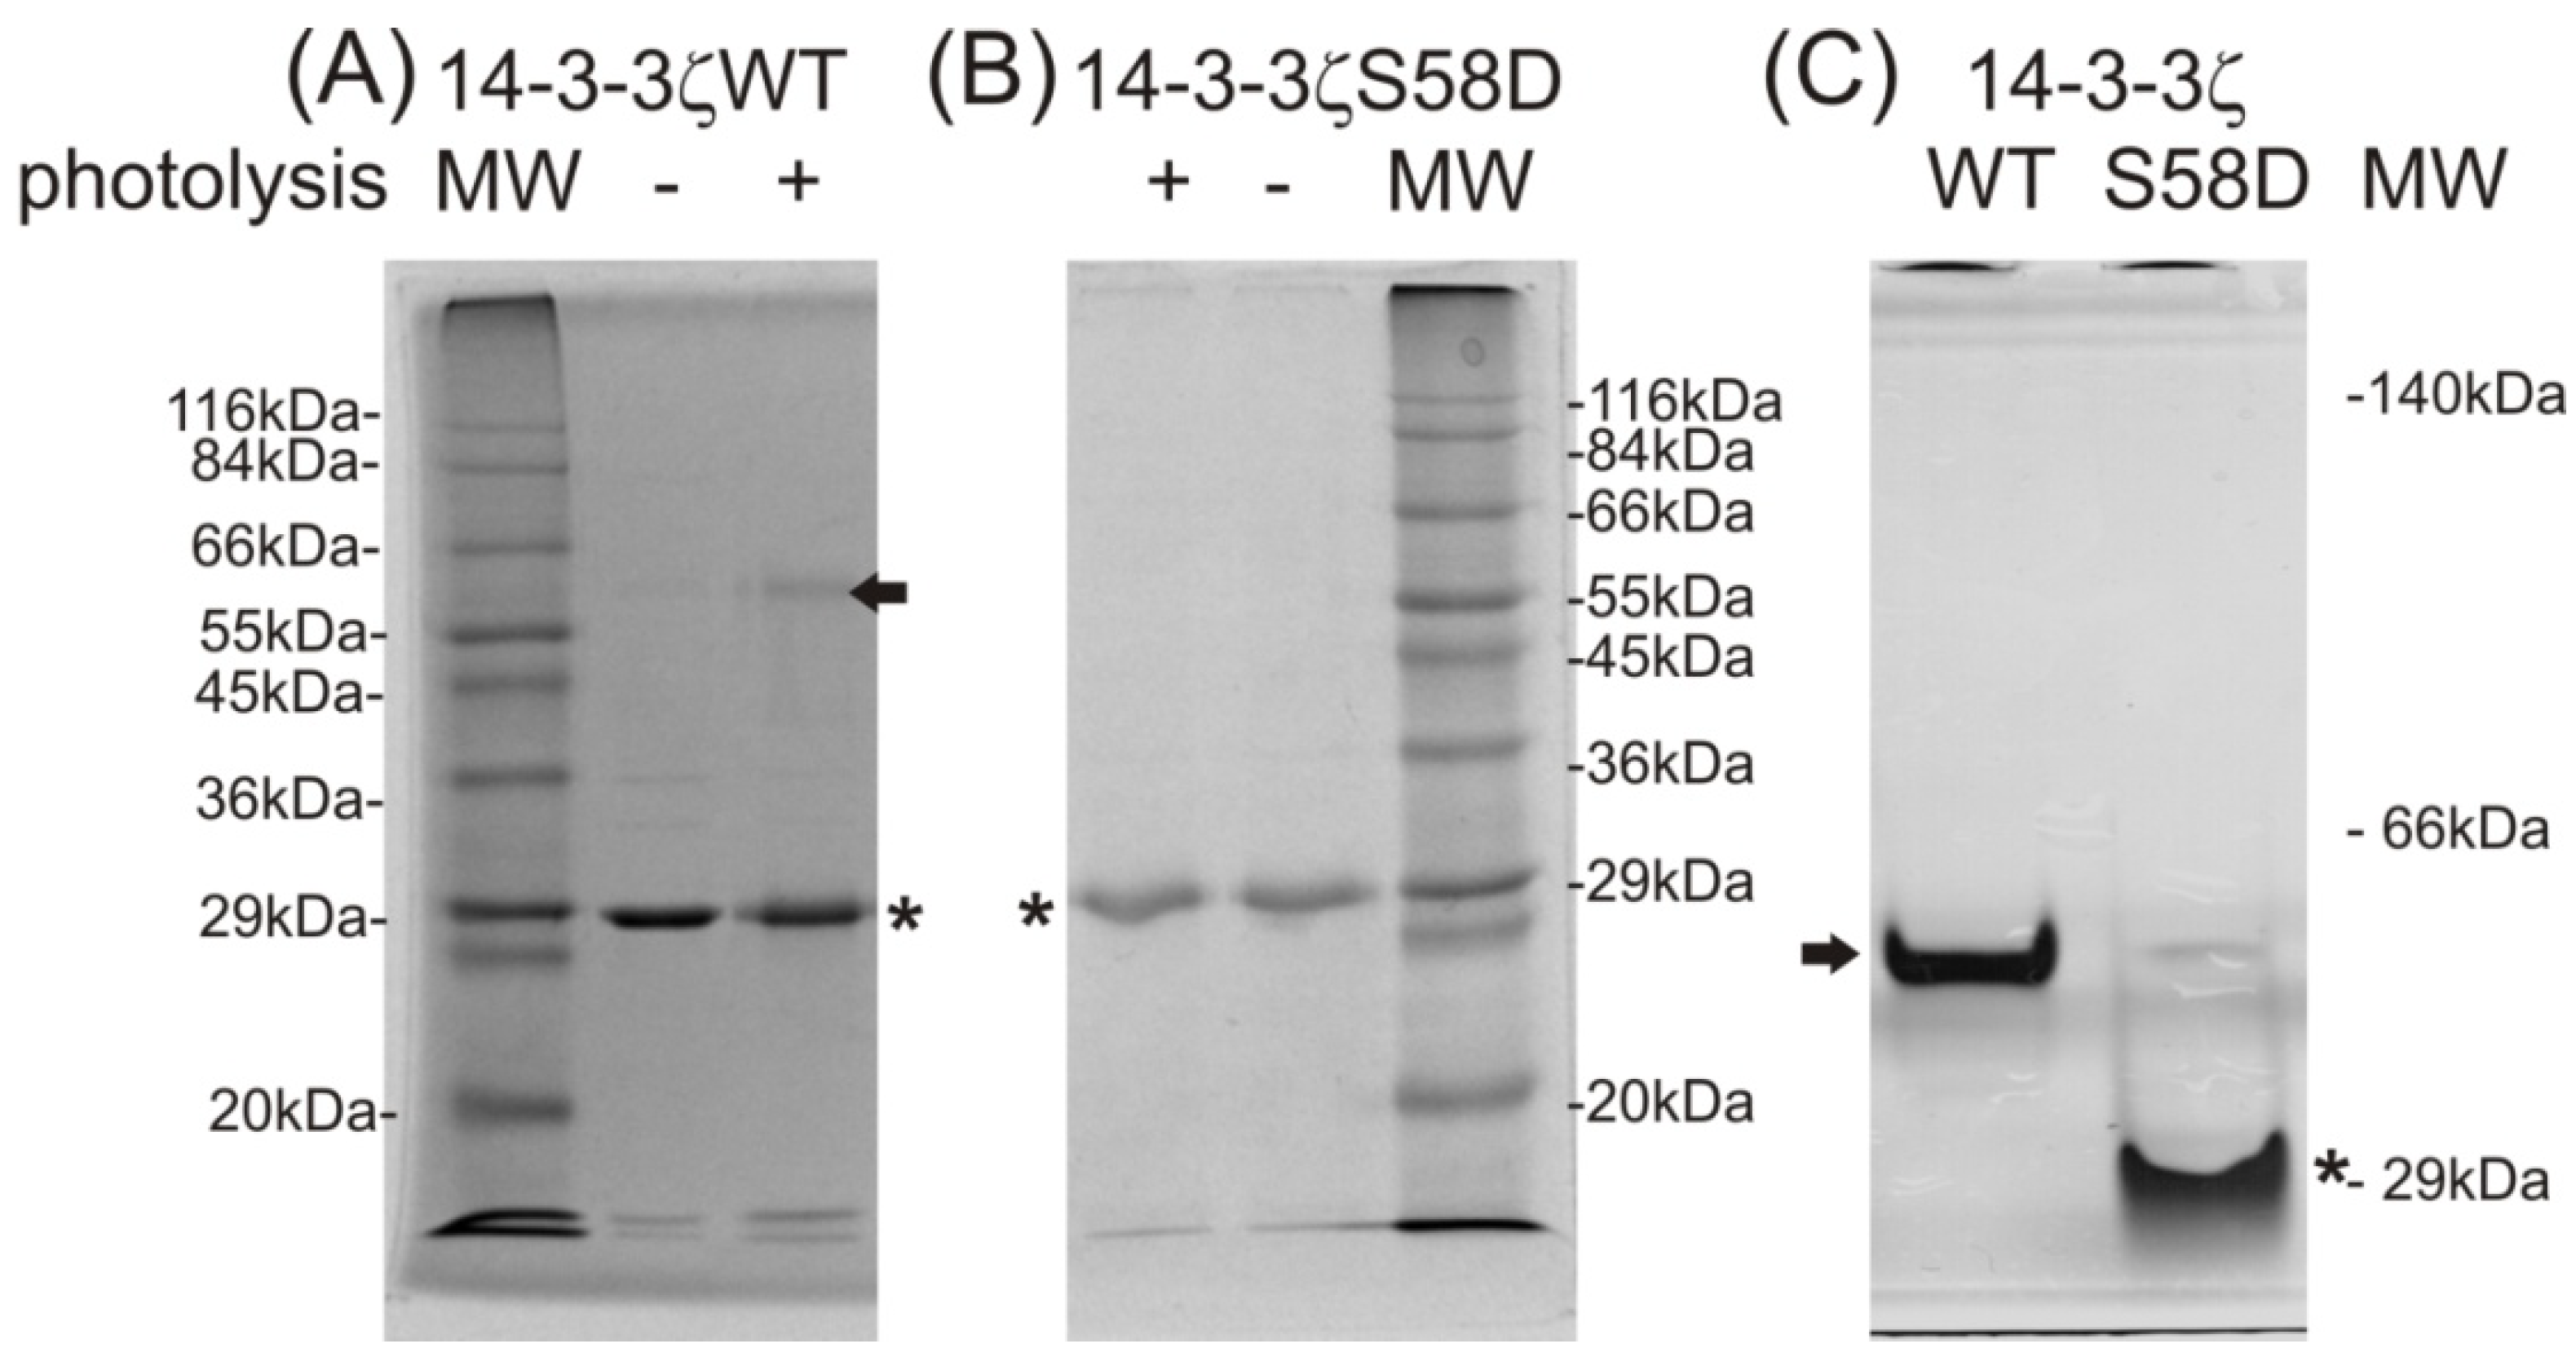
To carry out the above described experiment, highly purified and well-characterized recombinant proteins, dimeric 14-3-3ζ “wild type” (14-3-3ζWT) and monomeric 14-3-3ζ mutant, prepared with partial incorporation of the photo-labile analog of methionine into the protein sequence, were obtained from
Escherichia coli (
E. coli) lysate. In the mutant, the introduction of a negative charge at position 58 mimics Ser58 phosphorylation (14-3-3ζS58D) [
8]. They were brought to electrophoretic homogeneity by employing techniques preserving the native structure of these proteins. The incorporation of the photo-labile analog of methionine during recombinant expression in
E. coli is possible due to adequate structural analogy and the lower specificity of methionine-tRNA synthethase. The matrix-assisted laser desorption ionization-time of flight mass spectrometry (MALDI-TOF MS) analysis of trypsinized proteins using the mass fingerprinting approach confirmed not only the identities of both proteins (see
Table 1 for individual values of protein concentrations and sequence coverage), but also verified the successful cleavage of the
N-terminal histidine tag from protein sequence by thrombin for both protein constructs. The high number of matched peptides resulting from a manual interpretation of all the received
m/
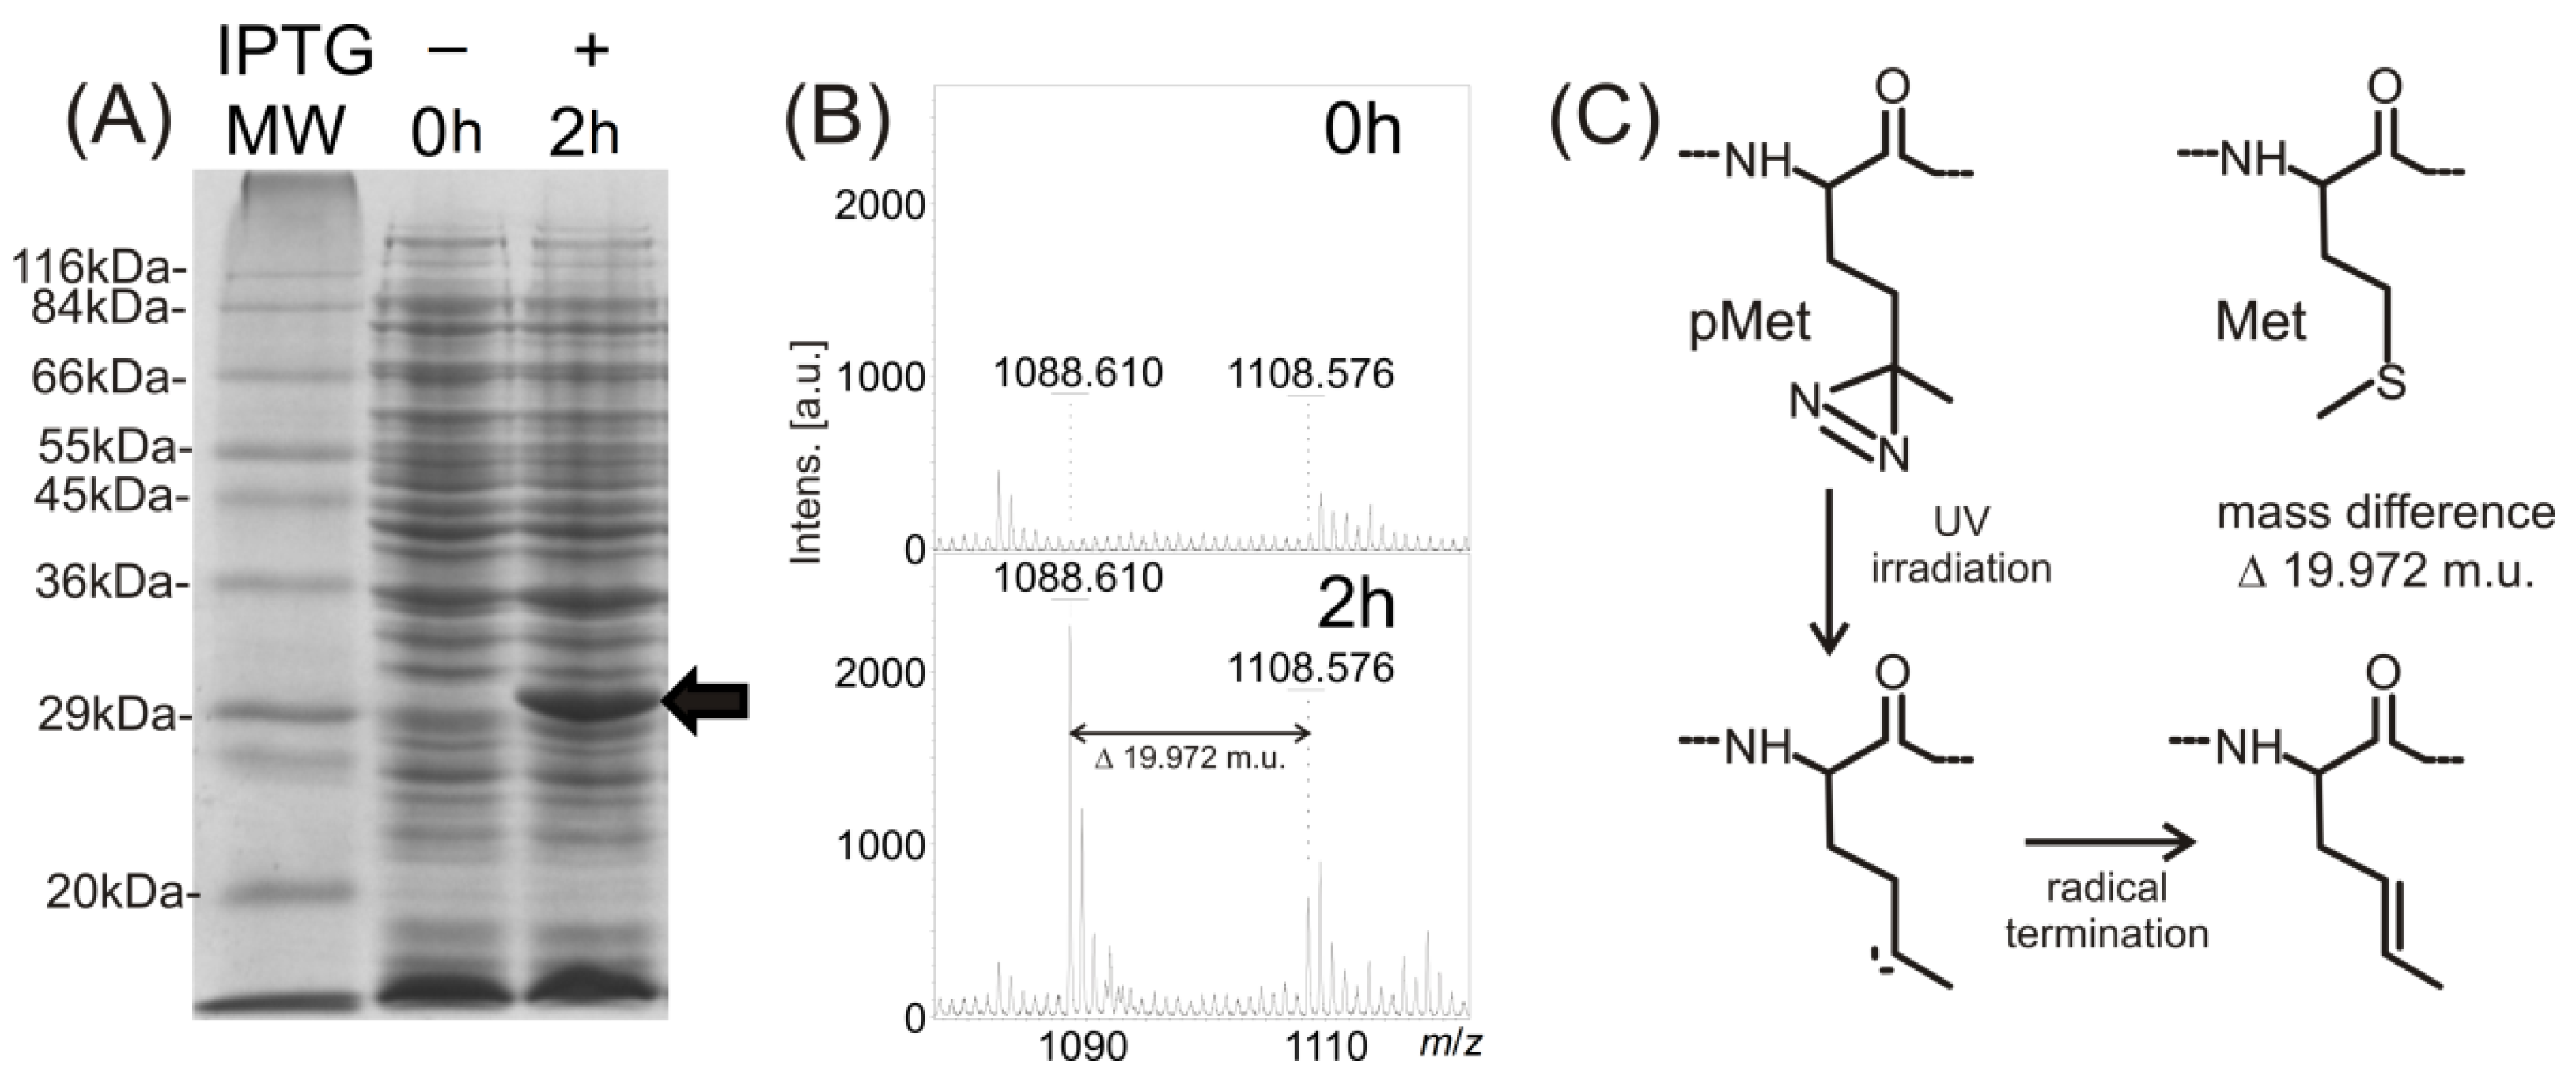
z signals indicates the high purity of both analyzed proteins. Because only partial incorporation of the photo-labile methionine analog in place of naturally present methionine within the protein sequence was suggested, the MALDI-TOF analysis of the trypsinized protein nanoprobe was also used to verify sufficient photo-labile analog incorporation. This was confirmed by the detection of signals indicating both tryptic peptides containing methionine and signals corresponding to tryptic peptides with methionine analog (mass shift 19.972 m.u.). For example in preparations of 14-3-3ζWT, the presence of the peptide (159)EMGPTHPIR(167) of the protein sequence should be revealed in the mixture of tryptic peptides by a signal at
m/
z 1108.5568. No such signal was detected before protein expression was induced through the addition of isopropyl β-
d-1-thiogalactopyranoside (IPTG). After two hours of 14-3-3ζWT protein expression under the IPTG regime, the protein band of relevant molecular weight was detected by SDS-PAGE of the whole cell lysate (see
Figure 1A). A signal at
m/
z 1108.576 in the MS spectrum of the trypsinized protein band, corresponding to the described tryptic peptide, was also detected (see
Figure 1B). Moreover, a signal corresponding to the peptide with the photo-labile methionine analog incorporated into its sequence was detected at
m/
z 1088.610 (see
Figure 1B). As shown in the reaction mechanism (
Figure 1C), the laser, with wavelength 337 nm used for the MALDI ionization process, photolyzed the diazirine in the structure of the methionine analog into reactive carbene that in the high vacuum of the MALDI ionization source, produced the termination product of the bi-radical with a double bond, and the MS signal with mass shift 19.972 m.u., compared to the peptide with natural methionine in its sequence.
Table 1.
Characterization of purified recombinant human 14-3-3ζ proteins.
Table 1.
Characterization of purified recombinant human 14-3-3ζ proteins.
| Quantity (unit) purified protein | Protein concentration (mg/mL) | Sequence coverage (%) | Matched/searched peptides |
|---|
| 14-3-3ζWT | 1.45 ± 0.17 | 74 | 25/27 |
| 14-3-3ζS58D | 1.27 ± 0.12 | 69 | 27/29 |
Figure 1.
Monitoring of 14-3-3ζ protein expression using 12% sodium dodecyl sulfate polyacrylamide gel electrophoresis (SDS-PAGE) (A); incorporation of the photo-labile analog of methionine by matrix-assisted laser desorption ionization-time of flight mass spectrometry (MALDI-TOF MS) (B), IPTG, β-d-1-thiogalactopyranoside; MW, molecular weight; a diagram of a reaction mechanism of photolysis (C). (A) SDS-PAGE of Sigma wide-range molecular weight standards, 14-3-3ζWT expression before induction (0 h) and after induction by β-d-1-thiogalactopyranoside (IPTG) and following incubation (2 h) (black arrow labels the 14-3-3ζWT, Coomassie Brilliant Blue R-250 staining); (B) MALDI-TOF MS monitoring of photo-labile methionine analog incorporation within 14-3-3 expressed protein after 0 and 2 h incubation; (C) schematic of the photo-methionine (pMet) photolysis reaction mechanism and the structural difference between its termination product and natural methionine (Met).
2.3. The Mass Spectrometry (MS) Analysis of Covalent 14-3-3ζWT Homodimeric Product
The photo cross-linking successfully formed a covalent 14-3-3ζWT homodimeric product detectable by SDS-PAGE. The MALDI-TOF MS analysis verified the identity of the trypsinized 14-3-3ζWT homodimeric product. Moreover, three signals with m/z values of 1342.744, 1470.824 and 1998.030, specific to the homodimeric product were detected. No such m/z signal was found in the photolyzed protein nanoprobe band corresponding to both monomers (14-3-3ζWT and 14-3-3ζS58D). Therefore, these three signals correspond to intermolecular cross-links rather than intramolecular ones, and were used to locate the covalently cross-linked regions between two 14-3-3ζ molecules. MALDI-FTICR (Fourier transform ion cyclotron resonance) MS with MALDI ionization and high resolution FTICR detection was used to obtain [M + H]+ monoisotopic signals to deduce the unique peptide combination involved in a covalent cross-link.
The values of experimental monoisotopic signals were searched against a database of theoretical monoisotopic masses of cross-linked products: the mass of any 14-3-3ζWT tryptic peptide plus the mass of any 14-3-3ζWT tryptic peptide minus the mass shift of a 19.972 m.u. eliminated during the photo cross-linking reaction. Similarly to MALDI-TOF analysis, the three signals with
m/
z values of 1342.7457, 1470.8408 and 1998.0234 were specifically detected in the homodimeric product by MALDI-FTICR analysis. Investigation of these
m/
z values revealed the corresponding cross-linked peptides (see
Table 2). To increase the resolution power, peptide separation by reverse phase liquid chromatography (LC) was used and on-line coupled to nano-electrospray ionization (ESI) and high resolution FTICR detection (LC-ESI-FTICR MS). In this way, the trypsinized 14-3-3ζWT homodimeric product was analyzed and the covalently cross-linked regions were located. The obtained dataset of experimental
m/
z values was automatically reduced to produce output files of monoisotopic masses that were searched against the database of theoretical monoisotopic masses of cross-linked products.
Table 2 summarizes all the experimentally determined
m/
z values and the corresponding mass error of the calculated and experimental
m/
z values (maximally 2 ppm). The sequences of the covalently cross-linked peptides (in the first and the second molecules of the 14-3-3ζWT homodimer) are also shown. The LC-MS analysis confirmed signal values at
m/
z 1998.0186 with a lower error of acquired mass. In addition to the described
m/
z signals, both techniques (LC-FTICR MS and MALDI-FTICR MS) also revealed several
m/
z values corresponding to internally cross-linked peptides or peptides with the termination product of the photolyzed Met analog (e.g., 1881.0186) in the photolyzed 14-3-3ζWT monomer, or 14-3-3ζS58D monomer, respectively. All these signals were removed from 14-3-3ζWT homodimer data sets as intra-molecular cross-links, and were not used for the subsequent analysis of the 14-3-3ζWT homodimer interface. Using the MS/MS analysis, the individual
m/
z signals were further resolved to identify the unique covalent cross-links between two amino acid residues involved in the formation of the homodimer.
Table 2.
Identified intermolecular photo cross-linked products in 14-3-3ζ homodimer between molecule 1 and molecule 2 by * MALDI-FTICR (matrix-assisted laser desorption ionization-time of flight-Fourier transform ion cyclotron resonance) or $ LC-FTICR MS.
Table 2.
Identified intermolecular photo cross-linked products in 14-3-3ζ homodimer between molecule 1 and molecule 2 by * MALDI-FTICR (matrix-assisted laser desorption ionization-time of flight-Fourier transform ion cyclotron resonance) or $ LC-FTICR MS.
| [M + H]+ experimental | Error (ppm) | 14-3-3ζ molecule (1) | 14-3-3ζ molecule (2) |
|---|
| 1342.7457 * | 1.9 | 4–9 K.NELVQK.A | 76–80 K.QQpMAR.E |
| 1470.8408 * | 1.8 | 4–9 K.NELVQK.A | 76–80 K.KQQpMAR.E |
| 1998.0186 $/1998.0234 * | 0.2 $/2.2 * | (−2)–9 .GSHMDKNELVQK.A | 76–80 K.QQpMAR.E |
2.4. The MS/MS Analysis of the Covalent 14-3-3ζWT Homodimeric Product
The MALDI-TOF/TOF instrument was used to acquire the MS/MS data from the
m/
z signals shown in
Table 2 after off-line separation of peptides. The interpretation of fragment peaks in the MS/MS spectrum allows for the location of interacting amino acid residues covalently connected by the photo cross-linking reaction. The first and the second row in
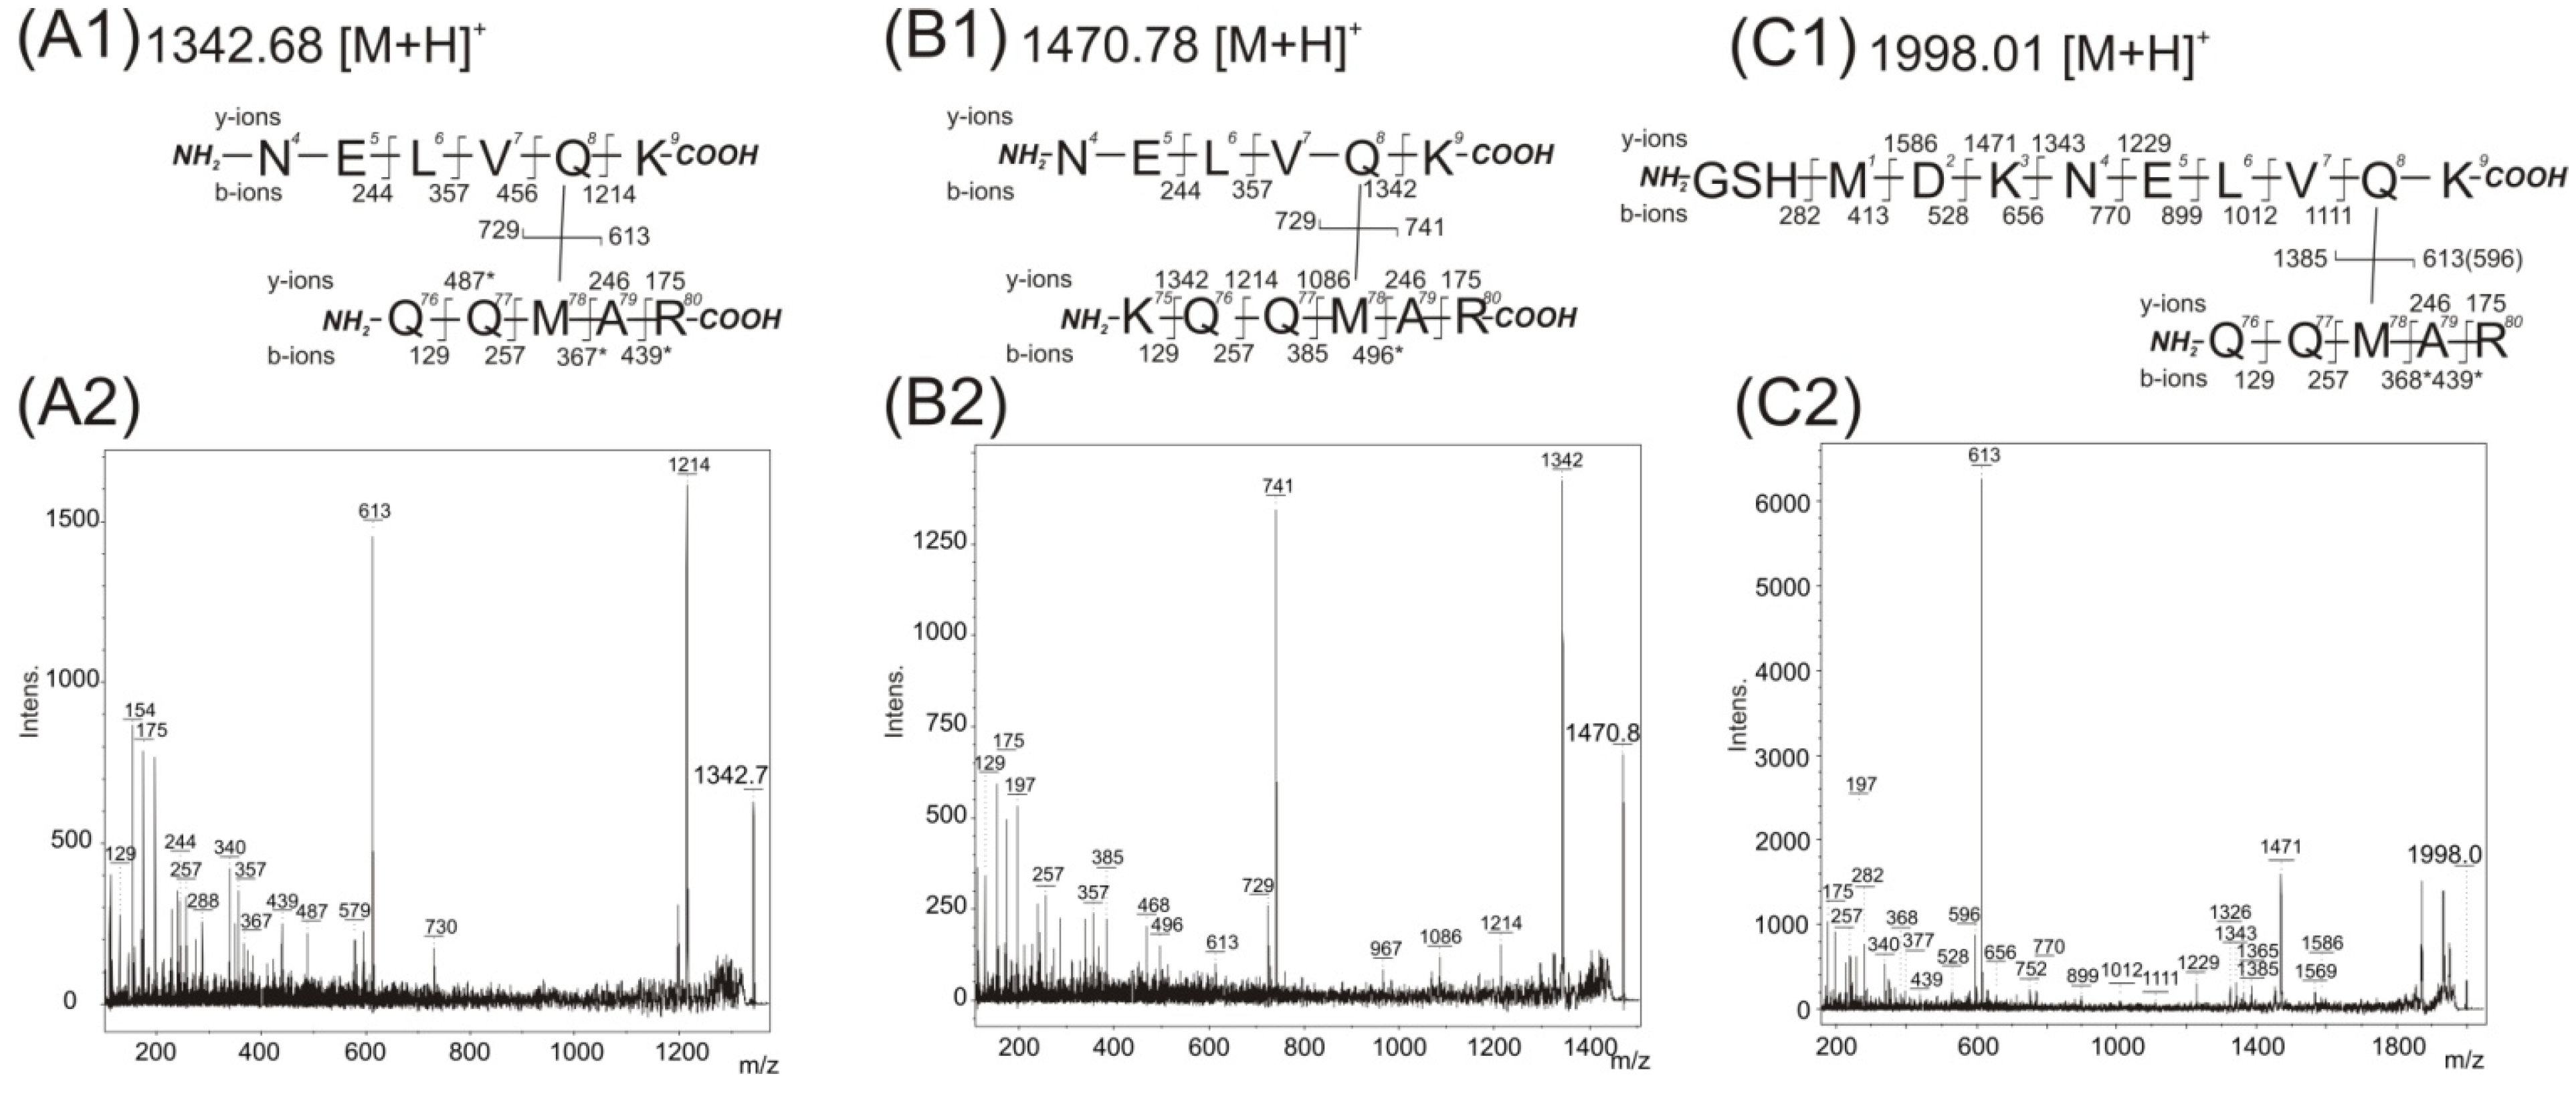
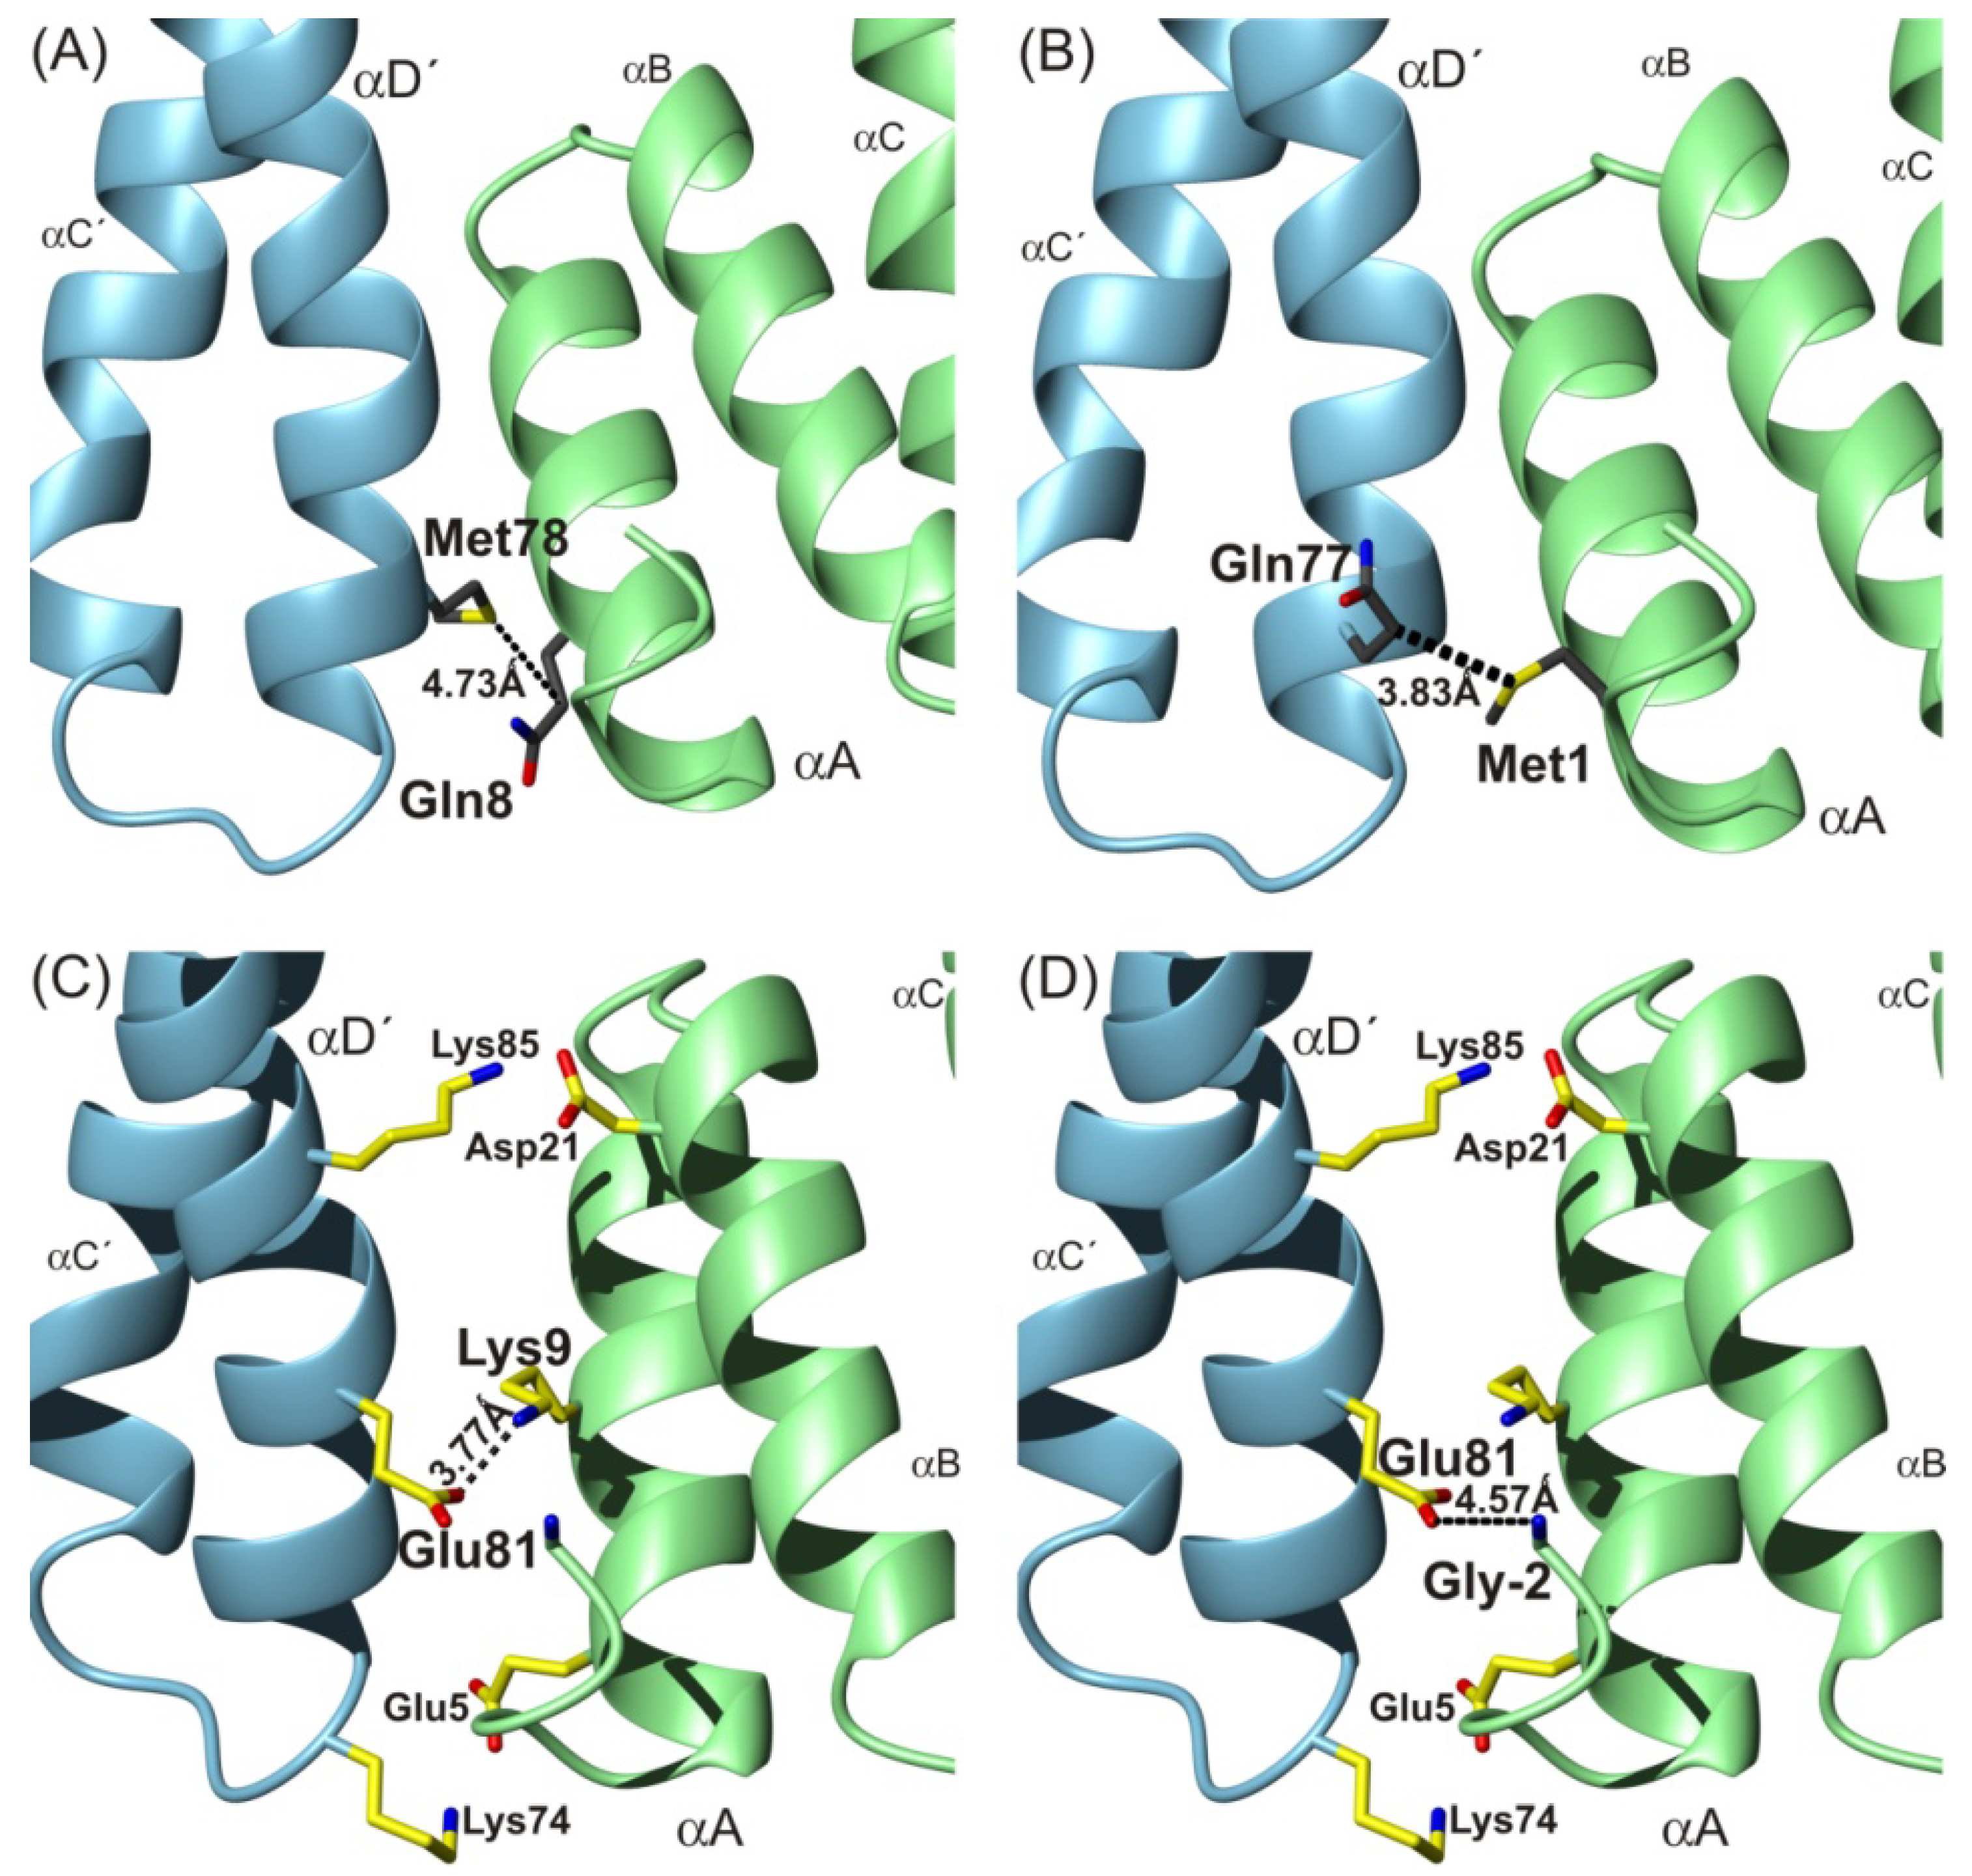
Table 2 show the contact of the pMet78 residue with a residue within the protein sequence at position 4–9 (peptide NELVQK). The contact of pMet78 residue with the Gln8 residue was confirmed by manual interpretation of recorded MS/MS spectra with its value identified at
m/
z 1342.7457 (
Figure 3A). The two major fragment ions are present in this spectrum. The first one,
m/
z 613 with the complementary ion at
m/
z 729, corresponds to the fragmentation of the covalent bond between two cross-linked peptides (76)QQpMAR(80) and (4)NELVQK(9). The second most abundant fragment at
m/
z value at 1214 belongs to
b-ions series (244, 357, 456 and 1214), and demonstrates the covalent modification of the Gln8 residue with the peptide (76)QQpMAR(80) (the signals at 244, 357 and 456 correspond to fragmentation of unmodified amino acids in the sequence (4)NELV(7)).
Figure 3.
Acquired mass spectrometry (MS)/MS spectra after trypsin digestion of 14-3-3 homodimer band and detected fragment ions corresponding to covalently photo cross-linked structures. The structures of covalently cross-linked Gln8–Met78 (A1), (B1), and (C1) determined from MS/MS daughter ion spectra with detected peaks at m/z 1342.75 (A2), m/z 1470.84 (B2), and m/z 1998.01 (C2), respectively. The residue numbering corresponds with the full-length sequence of the 14-3-3ζ (UniProtKB database accession number P63104). Intens. means absolute intensity; asterisks marks the secondary fragmentation after inter-peptide cross-linked bond cleavage.
The MS/MS spectrum (
Figure 3B with incorporated fragmentation scheme) of the observed
m/
z value 1470.8408 shows the same group of interacting amino acids, pMet78 and Gln8. The observed
m/
z difference is explained by the presence of the peptide sequence (75)KQQpMAR(80) formed by trypsin protease miscleavage at the
C-terminus of Lys75 residue. Also, two other major fragments are detected in this spectrum. The first one,
m/
z 741 with a complementary ion of
m/
z 729, corresponds to fragmentation of the covalent bond between the two cross-linked peptides (75)KQQpMAR(80) and (4)NELVQK(9). The second value of
m/
z 1342 belongs to
b-ions series (244, 357, 456 and 1342), and again demonstrates the covalent modification of the Gln8 residue with the (75)KQQpMAR(80) peptide (the signals at 244, 357 and 456 correspond to fragmentation of unmodified amino acids in the sequence (4)NELV(7)). The MS/MS spectrum of the identified
m/
z value at 1470.8408 contains the full
y-ion series of (75)KQQpMAR(80) (
m/
z 1342, 1214, 1086, 246, 175). This indicates the modification of the pMet78 residue by peptide (4)NELVQK(9) (
Figure 3B with incorporated fragmentation scheme).
The
m/
z signal at 1998.0186 in the third row of
Table 2 can be interpreted as either of two possible cross-links, because each peptide contains a methionine amino acid. The first probably suggests the previously described pMet78 and Gln8 contact. In the second the pMet1 residue can bind to any residue presented within sequence 76–80. The first interpretation, pMet78 and Gln8 contact, is supported by the MS/MS spectrum acquired from a sample that was photolysed with in the absence of glycerol (
Figure 3C). The most abundant fragment ion at
m/
z 613 with complementary ion at
m/
z 1385 corresponds to fragmentation of the covalent bond between two cross-linked peptides (76)QQpMAR(80) and (−2)GSHMDKNELVQK(9). The identified fragments (1111, 1012, 899, 770, 656, 528, 413) confirmed unmodified Met1 (covered sequence (−2)GSHMDKNELV(10)). Moreover, a covalent bond between pMet78 and Gln8 with no modification of Met1 is supported by the presence of fragments 1586, 1471, 1343 and 1229. A similar MS/MS spectrum with a corresponding interpretation of amino acid contact was also obtained with the presence of 150 mM NaCl during photolysis.
Additional tests were done, separately, in the presence of two compounds (10% glycerol (
v/
v) and 150 mM NaCl) during photolysis, because both are usually used in protein samples to protect them during storage at −80 °C. No influence of 150 mM NaCl was observed on the MS/MS spectra of all three
m/
z signals (1342.74, 1470.84 and 1998.01). The presence of 10% glycerol (
v/
v) had no effect on MS/MS spectra at
m/
z signal 1342.74 and 1470.84, but surprisingly, was found to have an effect on the MS/MS spectra at
m/
z signal 1998.01, revealing additional peaks (
Figure 4A). The highly abundant fragments in this MS/MS spectrum corroborated the contact between pMet78 and the Gln8 (similarly to
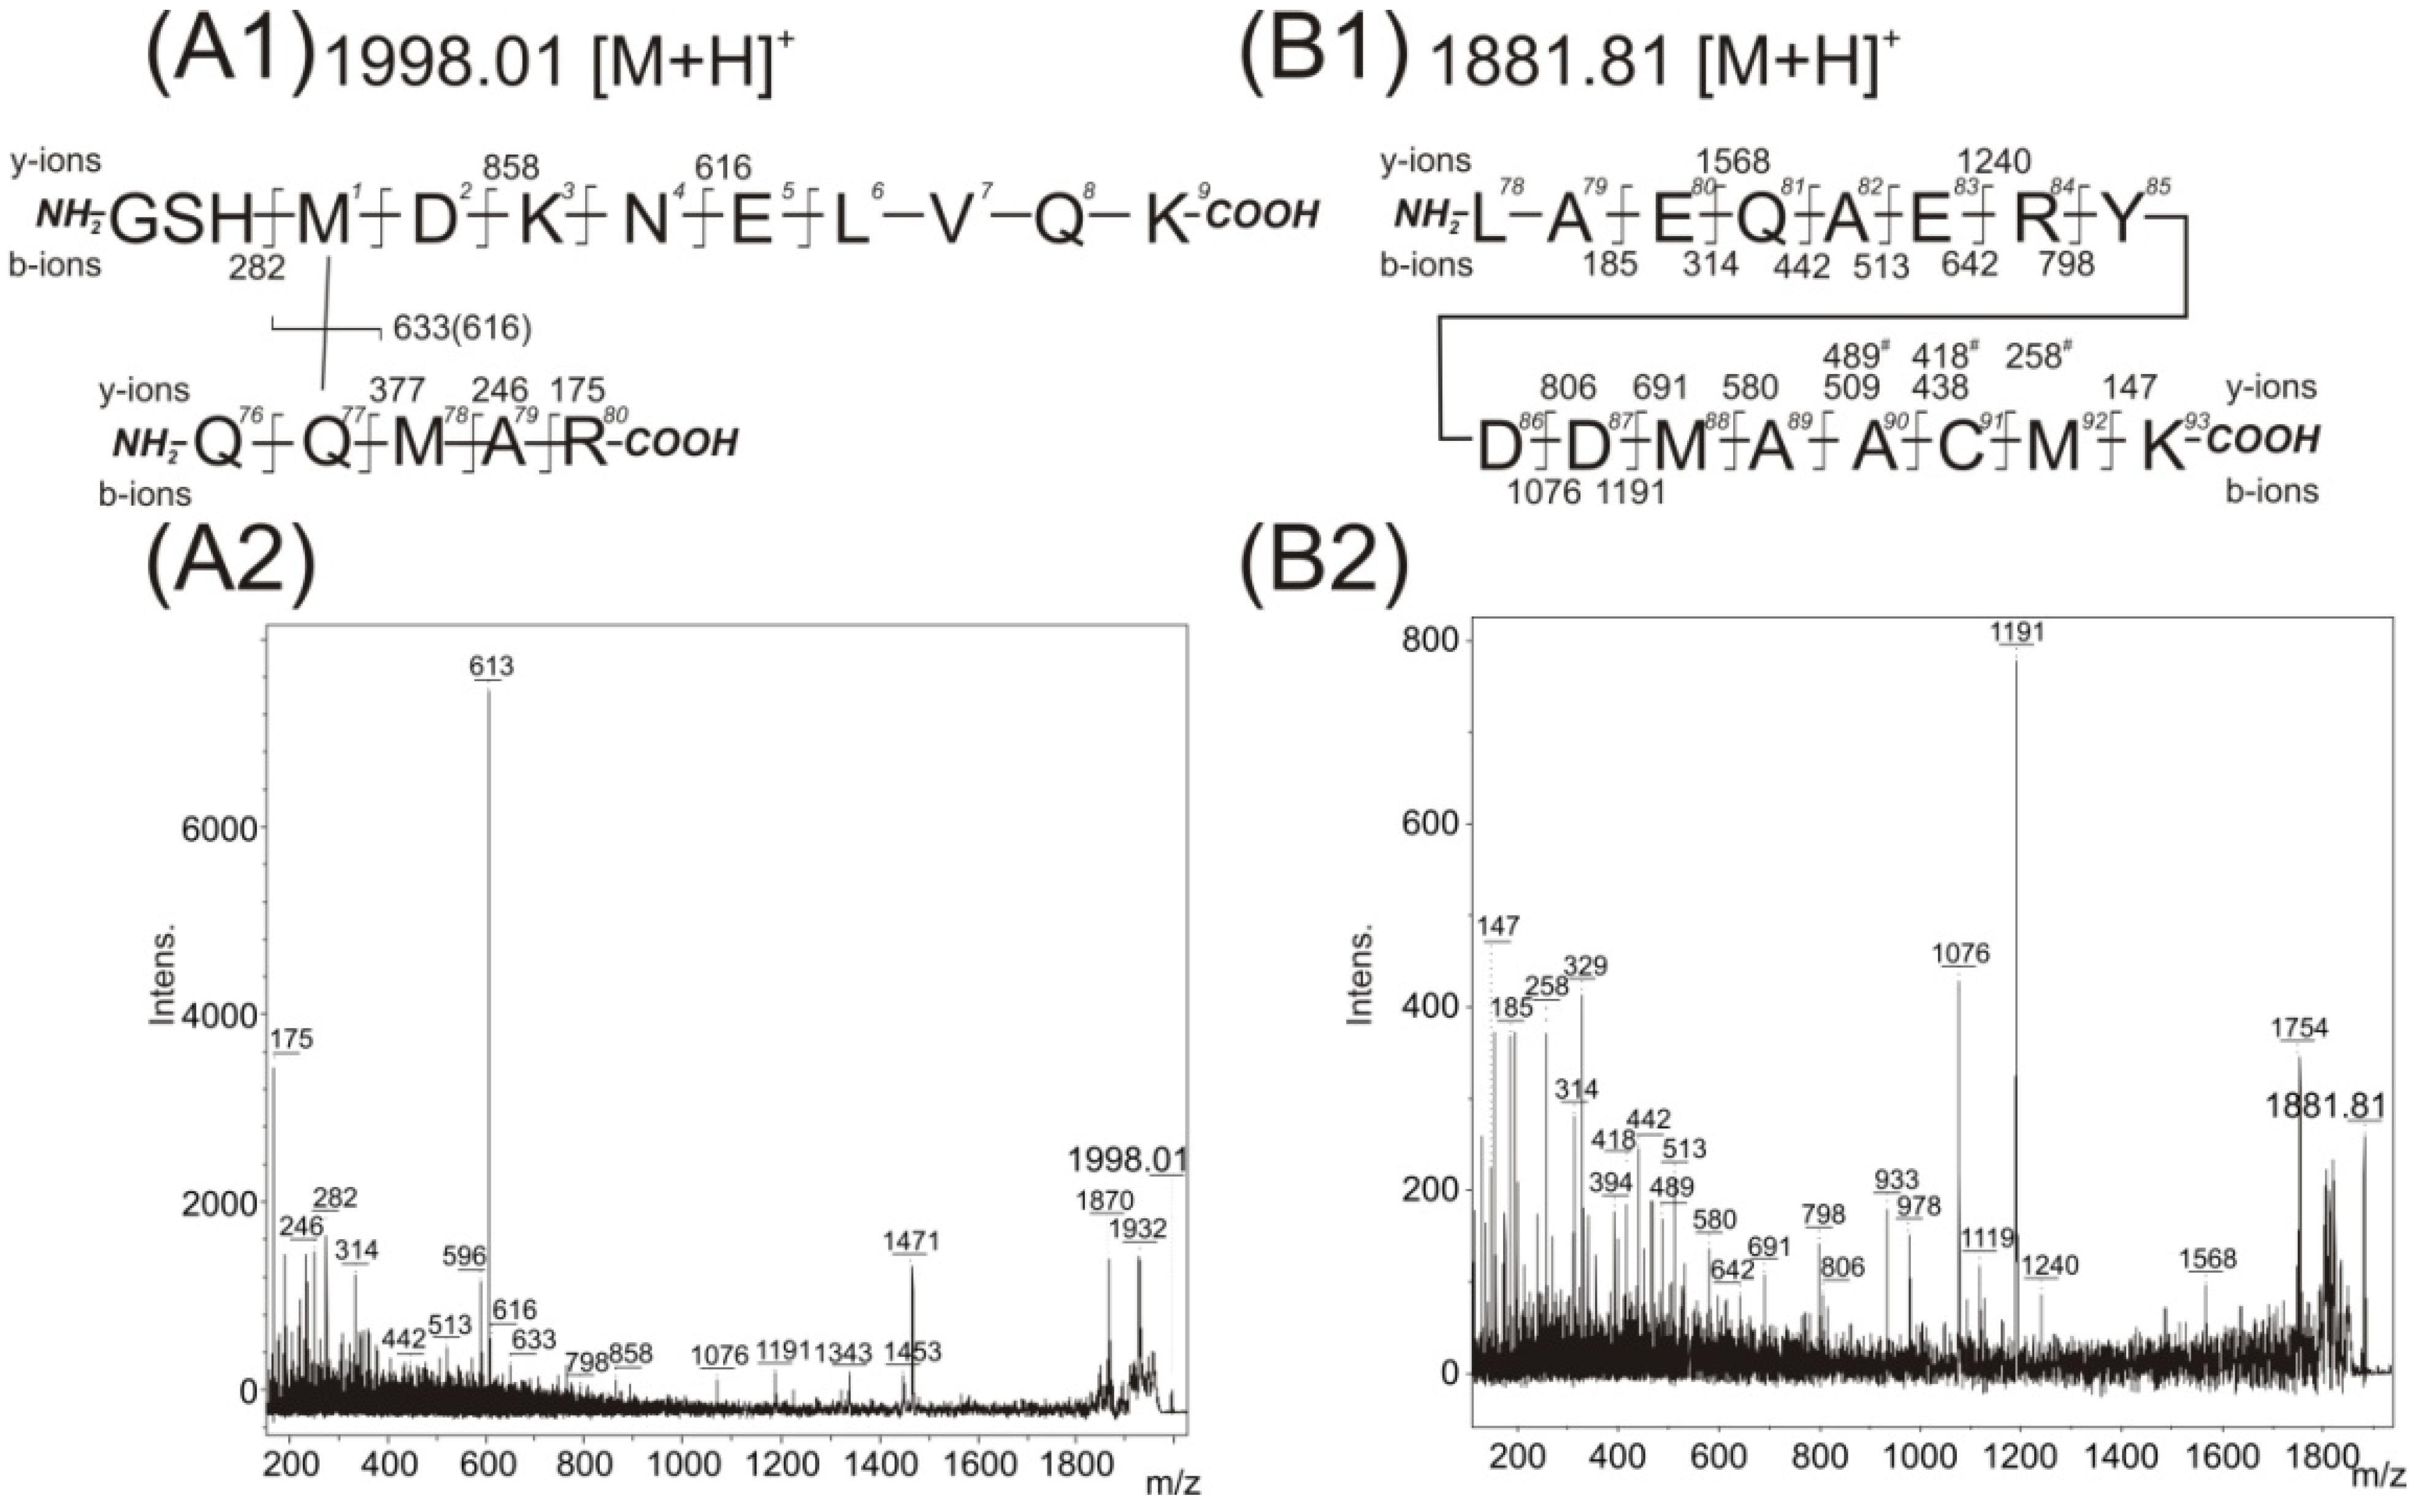
Figure 3C). But some of the observed low intensity fragments could also be interpreted as the existence of a covalent bond between pMet1 and Gln77. The fragment with
m/
z value 633 could suggest the presence of the peptide (76)QQMAR(80) with unmodified methionine, the fragments of the
y-ions series (
m/
z values 282, 858 and 616) could indicate the covalent modification of pMet1 with the peptide (76)QQMAR(80). Similarly, the
y-fragments, corresponding to peptides sequenced from
C-termini, up to the value of
m/
z 377 could demonstrate the absence of modification of the peptide (78)MAR(80). However, several abundant fragments cannot be interpreted according to the proposed structures shown in
Figure 3C1 or
Figure 4A1. Therefore a detailed reanalysis was made of the LC-FTICR MS data at the retention time corresponding to the elution of the
m/
z signal 1998.0186 to determine if any co-eluted peptides could have contaminated the spectra. The partially co-eluted peptide (12)LAEQAERYDD(
pM)AAC(
pM)K(27) with an
m/
z value of 1881.8459 containing two methionine in its sequence (one of which being the photo-analog) and a species with an
m/z value of 1861.8735 (with two incorporated photo-analogs) were detected (
Table 3). The MS/MS of the species with
m/
z value 1881.84 was acquired (
Figure 4B) and an almost complete
b-ion series with
m/
z values up to Asp21, and with two major fragments with
m/
z values of 1076 and 1191 was detected. The latter two
m/
z values were surprisingly also detected in the MS/MS spectrum of
m/
z signal 1998.01. There is no simple explanation for such an event. Nevertheless, the
m/
z values of both peptides (
m/
z 1881.8459 and 1861.8735 are so distinct from those of the interpretation of the MS/MS spectrum for
m/
z 1998.01 that their mutual contamination can be excluded. Moreover, no fragments with
m/
z values 282, 616, 633, 858 and 377 were found in the MS/MS spectrum of
m/
z signal 1881.84. Further study revealed a weak signal of a third co-eluted peptide at
m/
z 1995.8791 (
Table 3 row 3), suggesting the presence of the peptide (12)LAEQAERYDD(
pM)AAC(
pM)K(27) with a covalently bonded monosodiated glycerol molecule on one of the methionine photo-analogues in the sequence. Because the MS/MS spectrum of
m/
z 1998.01 was acquired with a wider
m/
z window of 6 m.u. due to the low intensity of this signal in MS mode, the fragments of the proposed peptide with
m/
z value 1995.87 should be present in this MS/MS spectrum. The presence of fragments with
m/
z values 314, 442, 513, 642, 798, 961, 1076 and 1191 strongly confirm the presence of the sequence (12)LAEQAERYDD(21). Therefore, to correctly interpret the obtained MS/MS spectrum of 1998.01, the chromatographic separation of the species with
m/
z value 1995.87 from the species with
m/
z value 1998.01 is necessary. Unfortunately, no chromatographic conditions with adequate separation of both signals were found.
Table 3.
Photo-initiated cross-linked products (potentially intramolecular or modified) identified in 14-3-3ζ monomer (molecule 1) by * MALDI-FTICR or $ LC-FTICR MS.
Table 3.
Photo-initiated cross-linked products (potentially intramolecular or modified) identified in 14-3-3ζ monomer (molecule 1) by * MALDI-FTICR or $ LC-FTICR MS.
| [M + H]+ experimental | Error (ppm) | 14-3-3ζ molecule (1) | 14-3-3ζ molecule (2) |
|---|
| 1861. 8735 $,* | 1.0 $ | 12-27+CAM K.LAEQAERYDDpMAACpMK.S | – |
| 1881.8459 $,* | 0.9 $ | 12-27+CAM K.LAEQAERYDD(pM)AAC(pM)K.S | – |
| 1995.8791 $,* | 1.2 $ | 12-27+CAM+GONa K.LAEQAERYDD(pM)AAC(pM)K.S | – |
The
m/
z value 1881.8439 (row 2 of
Table 3,
Figure 4B) allows for the potential presence of an intramolecular cross-link. However, detailed analysis of the fragments in the acquired MS/MS spectrum revealed no such intramolecularly linked pMet residue and the existence of a mixture of two species (the first species with presence of pMet at position 22, the second one at position 26). The fragments with
m/
z values of 438, 509 and 580 demonstrated the existence of a double bond on the methionine analog at position 22. On the other hand, the fragments with
m/
z values of 258, 418 and 489 showed the presence of a double bond on the methionine analog at position 26. The accessibility of one or both Met residues at positions 22 and 26 to the solvent also demonstrate the identification of covalent modification of this residue by glycerol in
m/
z signal 1995.8791 (row 3 of
Table 3).
To summarize, in agreement with previously performed molecular dynamic experiments [
7], one detected covalent cross-link: Gln8–pMet78 was found within the 14-3-3ζWT homodimer complex interface by MS/MS experiments. At the same time these results verified the applicability of the described methodology (the combination of photo-initiated cross-linking protein nanoprobes and mass spectrometry analysis) to map the protein-protein interface.
Figure 4.
Acquired MS/MS spectra of detected peaks at
m/
z 1998.01 (
A2) and
m/
z 1881.87 (
B2); and structural interpretation of potentially covalently cross-linked Met1–Gln77 (
A1) and peptide Leu15–Lys30 (
B1). The residue numbering corresponds with the full-length sequence of the 14-3-3ζ (UniProtKB database accession number P63104 [
10]). Intens. means absolute intensity.


 and
and 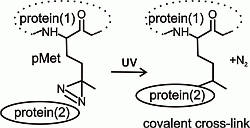
