Proteomic Analyses Reveal that Sky1 Modulates Apoptosis and Mitophagy in Saccharomyces cerevisiae Cells Exposed to Cisplatin


 ,
,  and
and 
Abstract
: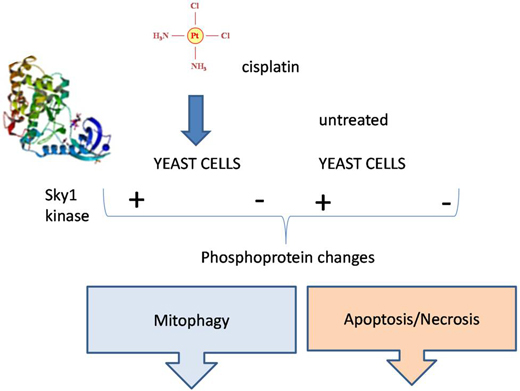
1. Introduction
2. Results and Discussion
2.2. Identification of the Differentially Quantified Proteins


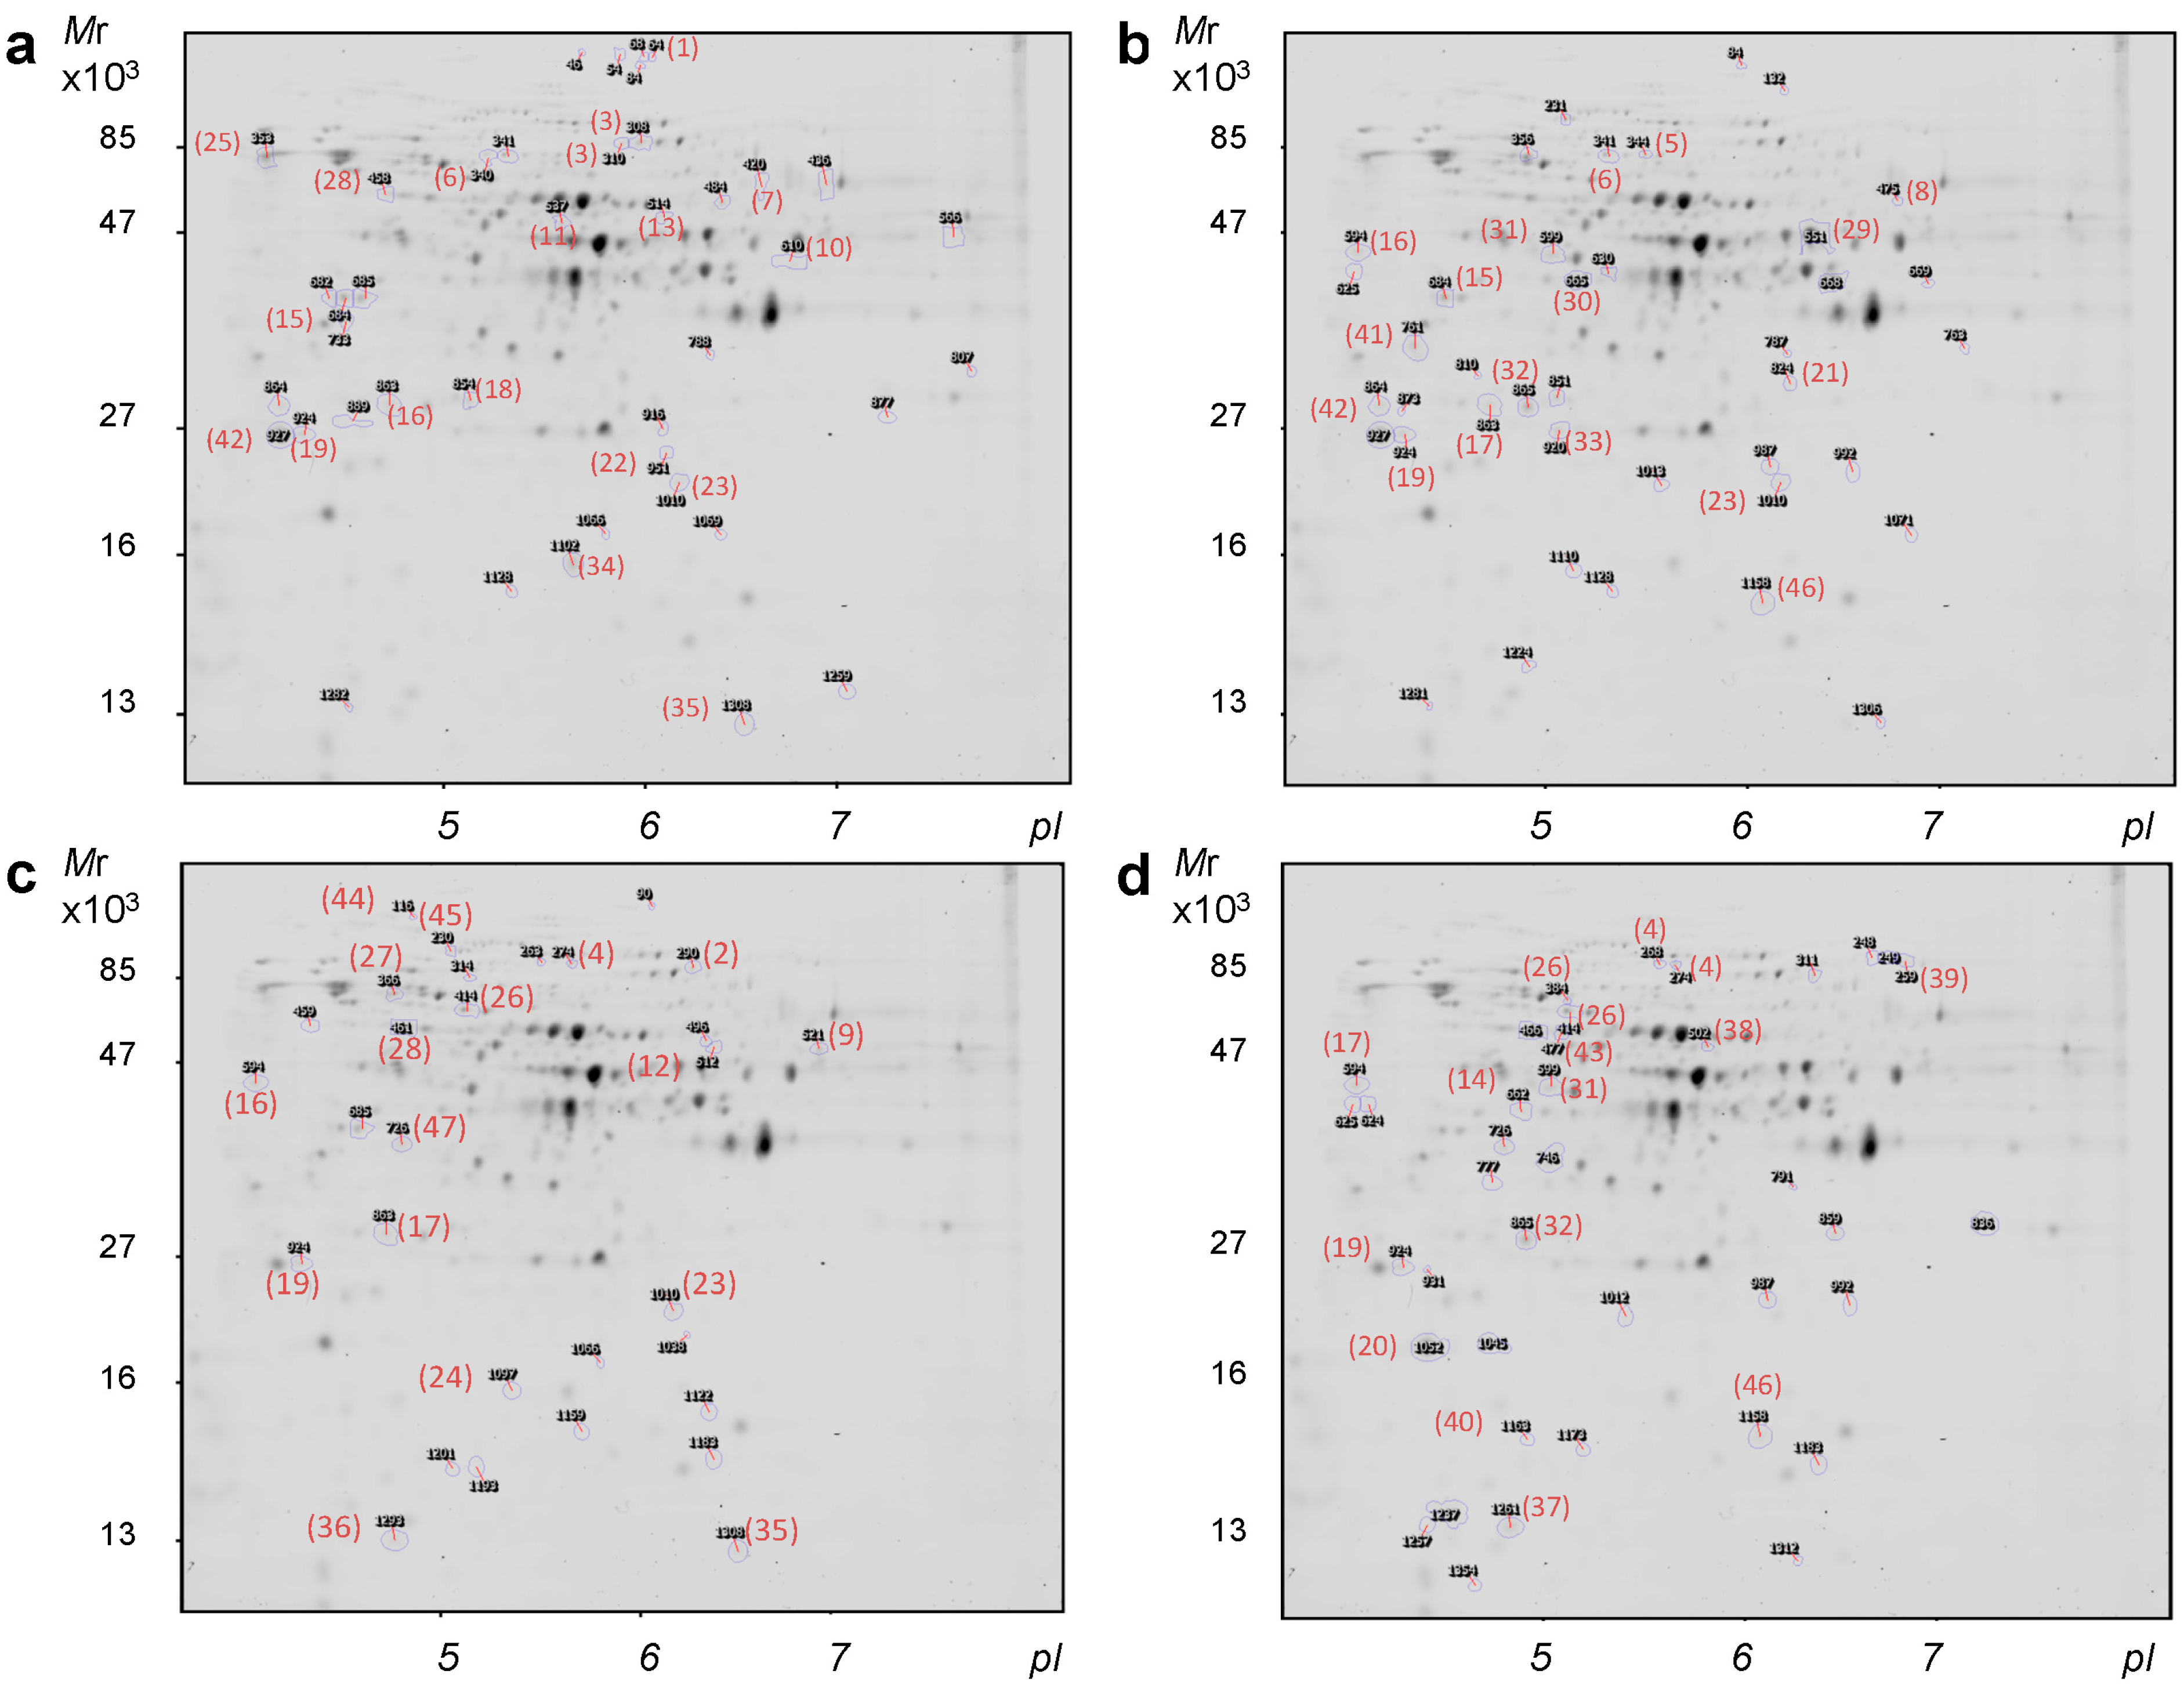
| Untreated Mutant Δsky1 versus Untreated Wild-Type | ||||||||
|---|---|---|---|---|---|---|---|---|
| Spot | Anova (p) | Fold | ID | Identification | Experimental | Predicted | ||
| Mr | pI | Mr | pI | |||||
| 924 | 0.05 | −1.6 | 19 | YLR179C | 27 | 3.98 | 22.15 | 4.77 |
| 290 | 0.05 | −1.3 | 2 | ACS2; YLR153C | 76 | 6.10 | 75.49 | 6.21 |
| 521 | 0.03 | −1.3 | 9 | SHM2; YLR058C | 53 | 7.24 | 52.21 | 6.98 |
| 1010 | 0.05 | −1.3 | 23 | GUK1; YDR454C | 22 | 5.98 | 20.64 | 6.63 |
| 1293 | 0.05 | −1.3 | 36 | PFY1; YOR122C | 13 | 4.85 | 13.68 | 5.47 |
| Wild-Type Treated versus Untreated | ||||||||
| Spot | Anova (p) | Fold | ID | Identification | Experimental | Predicted | ||
| Mr | pI | Mr | pI | |||||
| 310 | 0.02 | 1.3 | 3 | MET6; YER091C | 73 | 5.70 | 85.86 | 6.07 |
| 537 | 0.04 | 1.3 | 11 | LYS20; YDL182W | 51 | 5.58 | 47.10 | 6.84 |
| 684 | 0.02 | −1.4 | 15 | ADO1; YJR105W | 41 | 4.36 | 36.37 | 4.99 |
| 610 | 0.05 | −1.3 | 10 | ADH1; YOL086C | 45 | 6.89 | 36.85 40.01 | 6.21 6.47 |
| Mutant Δsky1 Treated versus Untreated | ||||||||
| Spot | Anova (p) | Fold | ID | Identification | Experimental | Predicted | ||
| Mr | pI | Mr | pI | |||||
| 475 | 0.05 | 1.8 | 8 | UGP1; YKL035W | 54 | 6.89 | 55.99 | 6.98 |
| 824 | 0.03 | 1.7 | 21 | PRB1; YEL060C | 32 | 6.04 | 69.62 | 5.94 |
| 341 | 0.04 | 1.3 | 6 | STI1; YOR027W | 69 | 5.4 | 66.26 | 5.45 |
| 761 | 0.02 | 1.3 | 41 | BMH1/BMH2 | 36 | 4.09 | 30.09 | 4.82 |
| 927 | 0.05 | −1.5 | 42 | TMA19; YKL056C | 17 | 3.78 | 18.741 | 4.41 |
| 1010 | 0.01 | −1.3 | 23 | GUK1; YDR454C | 22 | 5.98 | 20.64 | 6.63 |
| 684 | 0.05 | −1.3 | 15 | ADO1; YJR105W | 41 | 4.36 | 36.37 | 4.99 |
| Treated Mutant Δsky1 versus Treated Wild-Type | ||||||||
| Spot | Anova (p) | Fold | ID | Identification | Experimental | Predicted | ||
| Mr | pI | Mr | pI | |||||
| 865 | 0.03 | 1.4 | 32 | HSP26; YBR072W | 30 | 5.11 | 23.88 | 5.31 |
| 1052 | 0.05 | 1.3 | 20 | AHP1; YLR109W | 19 | 4.21 | 19.11 | 5.01 |
| 924 | 0.01 | −1.6 | 19 | YLR179C | 27 | 3.98 | 22.15 | 4.77 |
2.3. Validation of the Experimental Design
2.4. Proteome Changes Produced by Δsky1 Deletion
2.5. Proteome Changes Produced by Cisplatin Treatment and Their Dependence on Sky1 Function
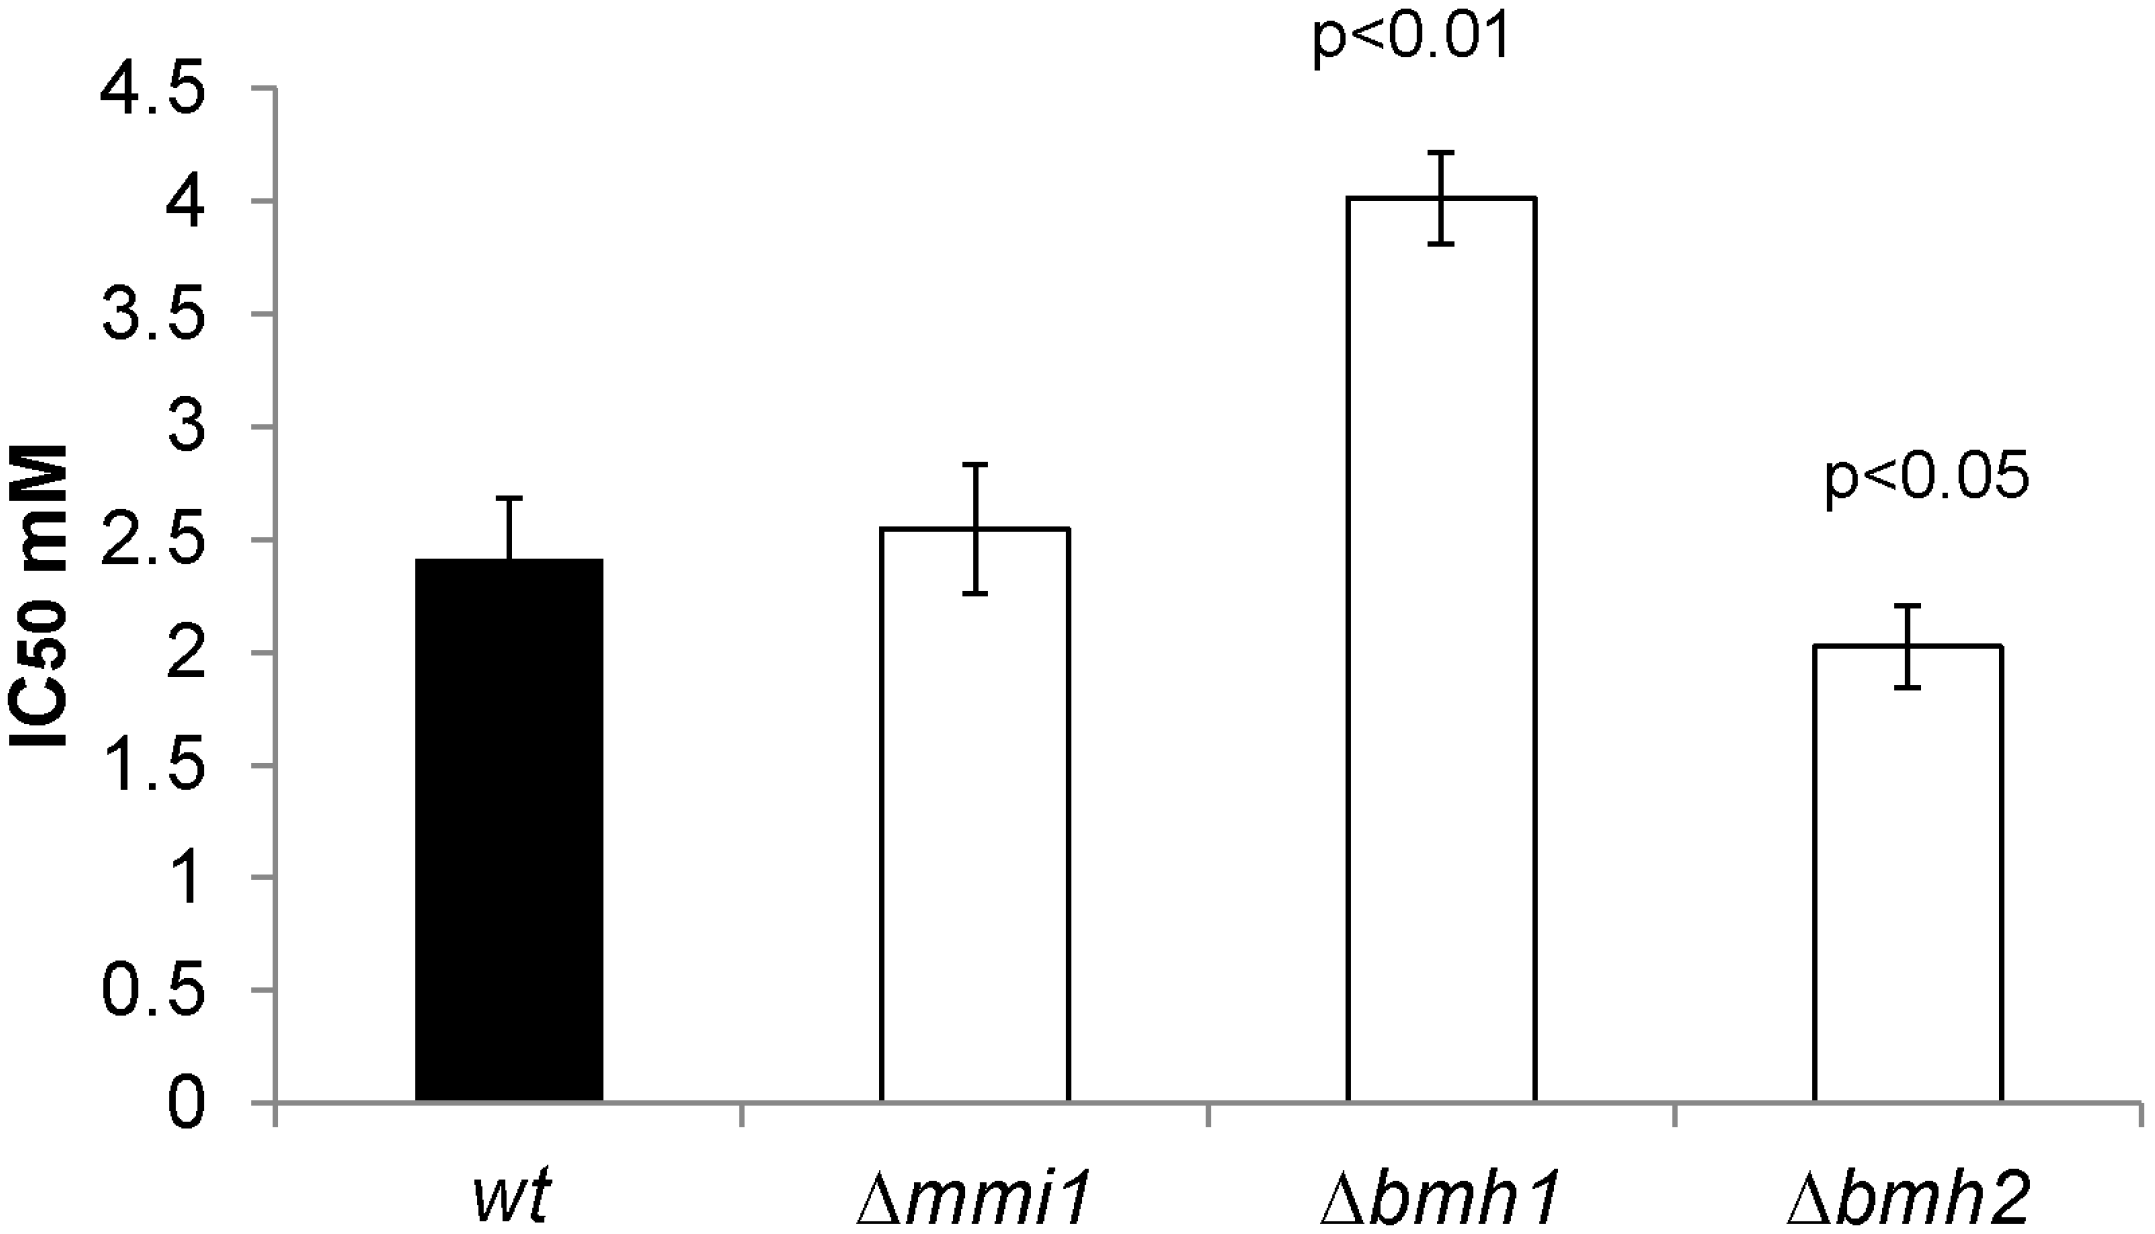
2.6. Proteins Related to the Increased Resistance of Cisplatin in the Δsky1 Mutant

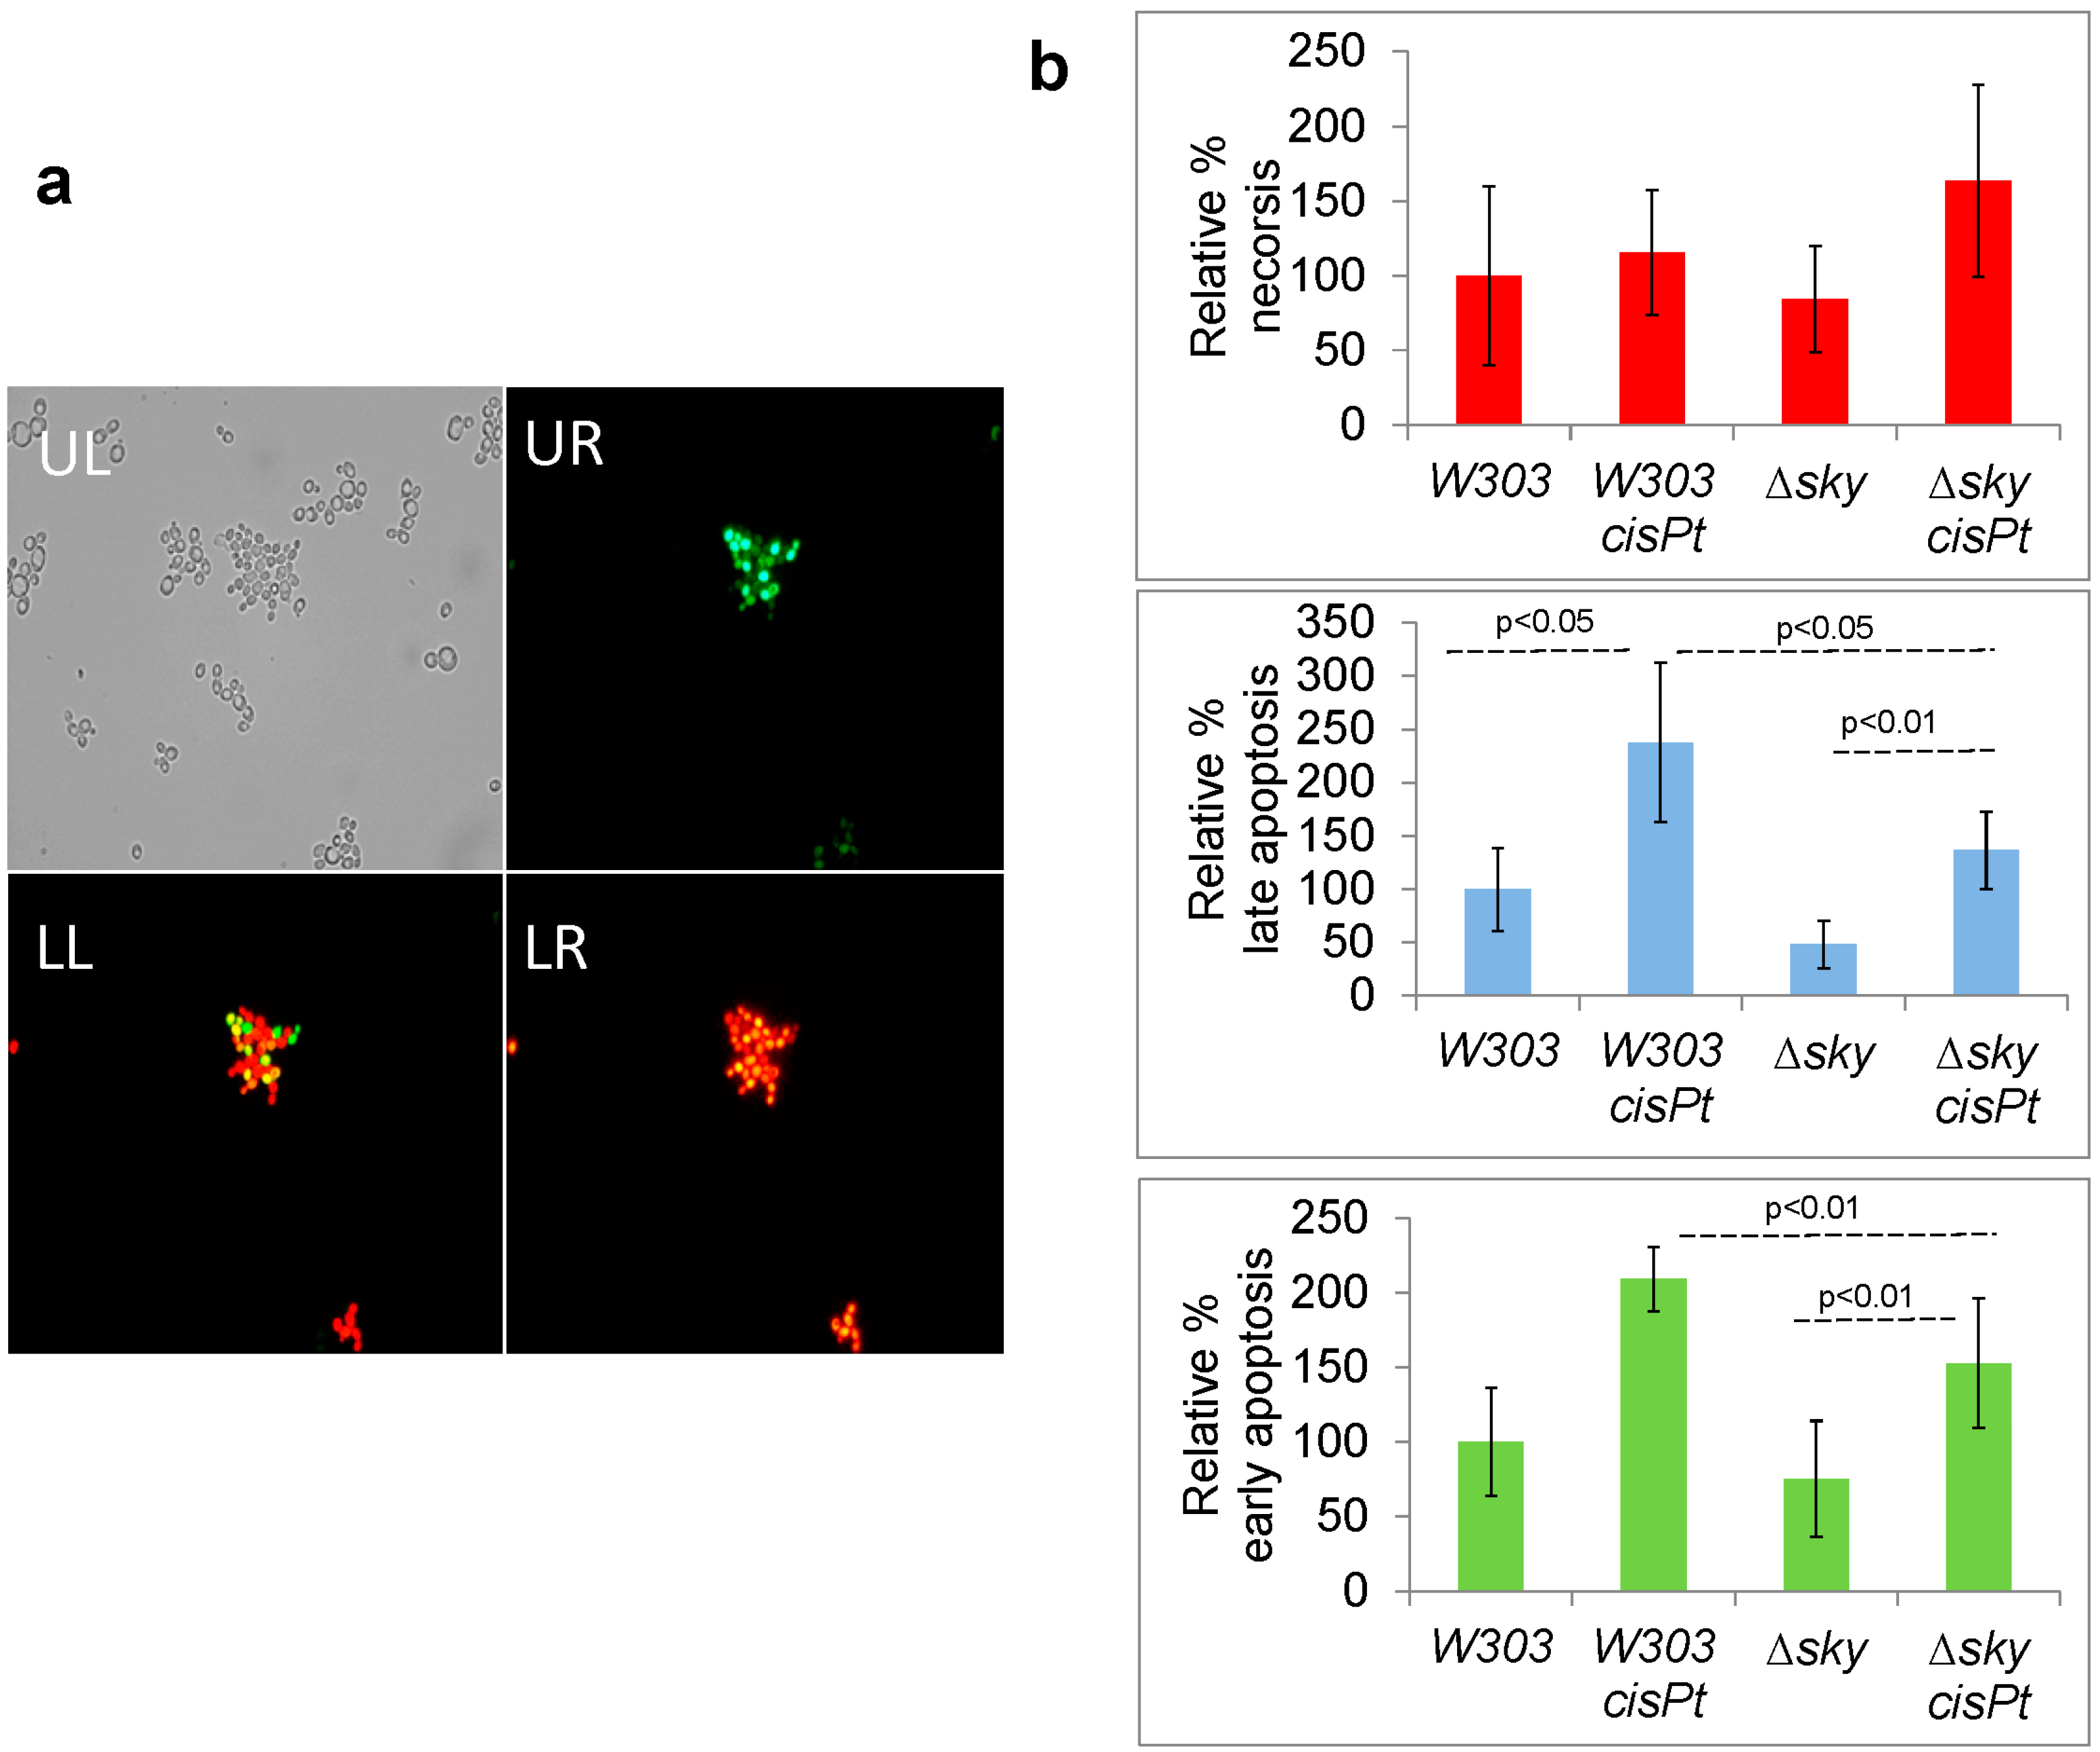
2.7. Cisplatin Increases Apoptotic-Like Events in Yeast Cells and Sky1 Modulates this Response
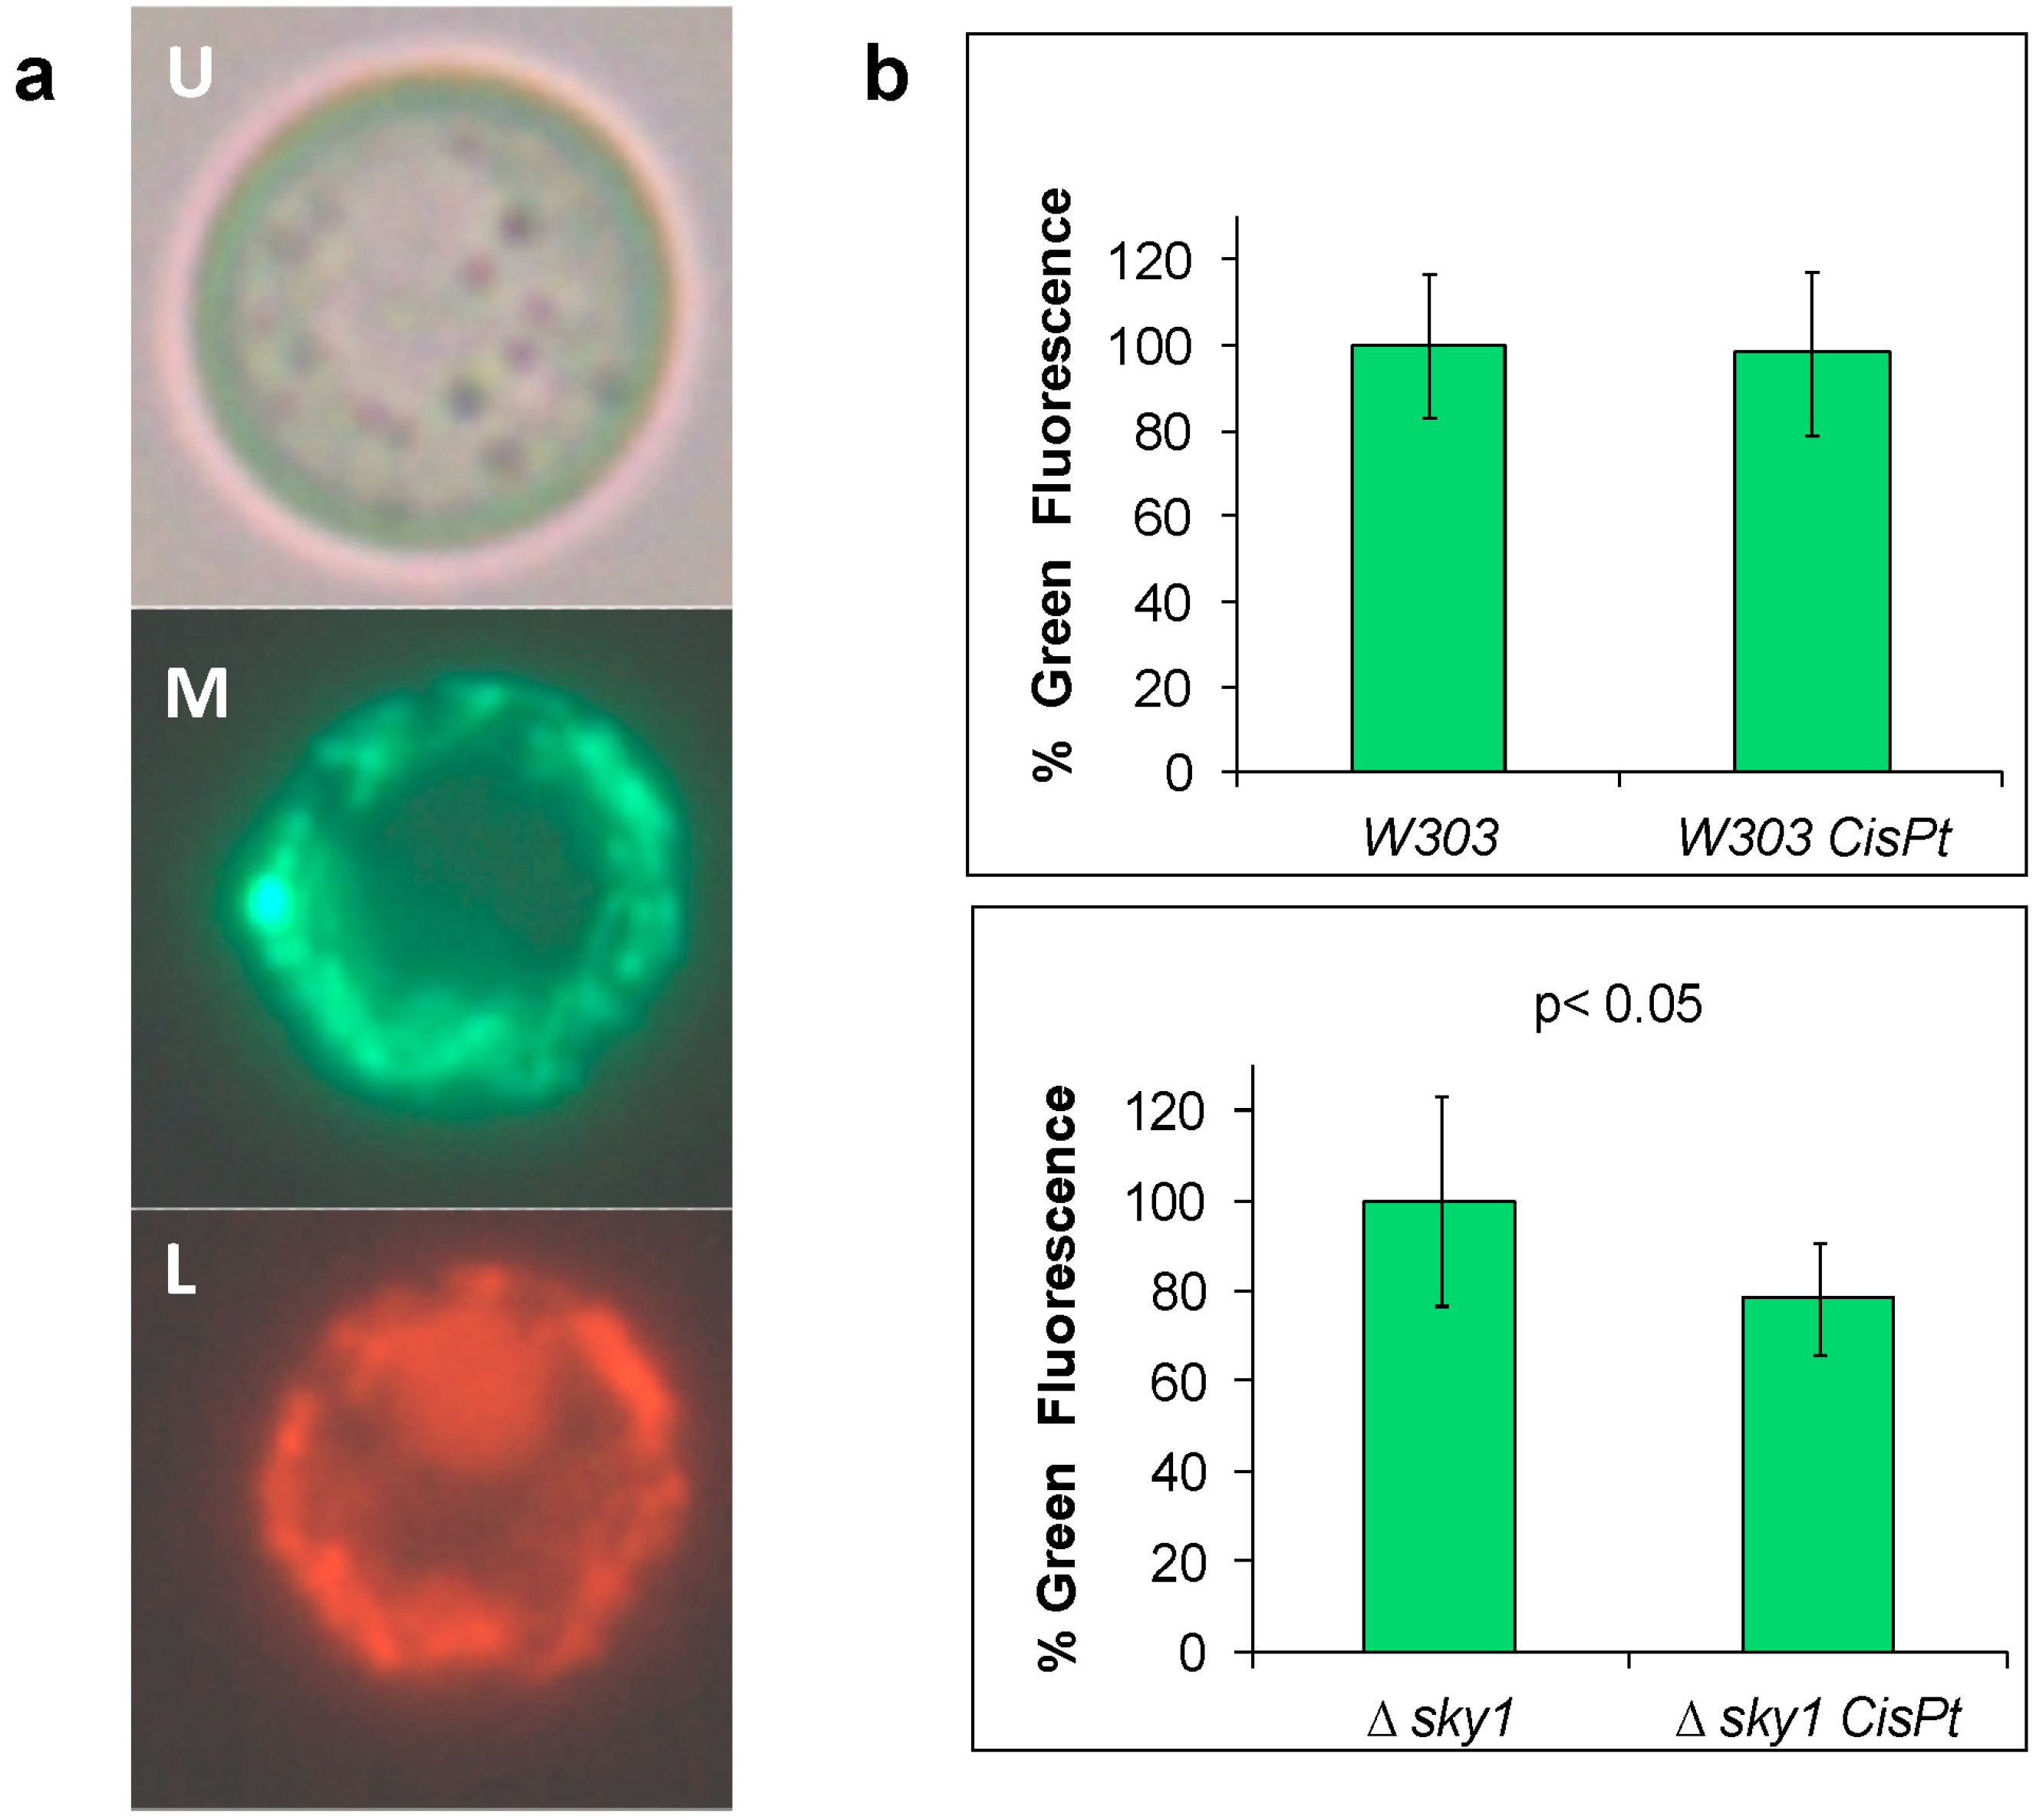
2.8. Deletion of SKY1 Increases Mitophagy in Yeast Cells after Cisplatin Treatment

3. Experimental Section
3.1. Strains and Culture Conditions
3.2. Protein Extracts Preparation and Phosphoprotein Enrichment
3.3. DIGE Experimental Design and Protein Labeling
3.4. 2-DE and Imaging of Cy-Labeled Proteins
3.5. Image Acquisition and DIGE Data Analysis
3.6. MS Analysis of the Gel Spots
3.7. Database Search
3.8. Cisplatin Resistance
3.9. Fluorescence Microscopy Assay for Monitoring Mitophagy
3.10. Fluorescence Assay to Quantify Mitophagy
3.11. Flow Cytometry Apoptotic Assay
4. Conclusions
Supplementary Files
Supplementary File 1Acknowledgments
Author Contributions
Conflicts of Interest
References
- Eastman, A. Alkylating and platinum-based agents. Curr. Opin. Oncol. 1990, 2, 1109–1114. [Google Scholar] [CrossRef]
- Eastman, A. Activation of programmed cell death by anticancer agents: Cisplatin as a model system. Cancer Cells 1990, 2, 275–280. [Google Scholar]
- Florea, A.M.; Busselberg, D. Metals and breast cancer: Risk factors or healing agents? J. Toxicol. 2011, 2011, 159619. [Google Scholar]
- Basu, A.; Krishnamurthy, S. Cellular responses to cisplatin-induced DNA damage. J. NucleicAcids 2010, 2010, 201367. [Google Scholar]
- Burger, H.; Capello, A.; Schenk, P.W.; Stoter, G.; Brouwer, J.; Nooter, K. A genome-wide screening in Saccharomyces cerevisiae for genes that confer resistance to the anticancer agent cisplatin. Biochem. Biophys. Res. Commun. 2000, 269, 767–774. [Google Scholar] [CrossRef]
- Huang, R.Y.; Eddy, M.; Vujcic, M.; Kowalski, D. Genome-wide screen identifies genes whose inactivation confer resistance to cisplatin in Saccharomyces cerevisiae. Cancer Res. 2005, 65, 5890–5897. [Google Scholar] [CrossRef]
- Cunha, D.; Cunha, R.; Corte-Real, M.; Chaves, S.R. Cisplatin-induced cell death in Saccharomyces cerevisiae is programmed and rescued by proteasome inhibition. DNA Repair 2013, 12, 444–449. [Google Scholar] [CrossRef]
- Schenk, P.W.; Boersma, A.W.; Brandsma, J.A.; den Dulk, H.; Burger, H.; Stoter, G.; Brouwer, J.; Nooter, K. SKY1 is involved in cisplatin-induced cell kill in Saccharomyces cerevisiae, and inactivation of its human homologue, SRPK1, induces cisplatin resistance in a human ovarian carcinoma cell line. Cancer Res. 2001, 61, 6982–6986. [Google Scholar]
- Siebel, C.W.; Feng, L.; Guthrie, C.; Fu, X.D. Conservation in budding yeast of a kinase specific for SR splicing factors. Proc. Natl. Acad. Sci. USA 1999, 96, 5440–5445. [Google Scholar] [CrossRef]
- Yun, C.Y.; Fu, X.D. Conserved SR protein kinase functions in nuclear import and its action is counteracted by arginine methylation in Saccharomyces cerevisiae. J. Cell Biol. 2000, 150, 707–718. [Google Scholar] [CrossRef]
- Windgassen, M.; Krebber, H. Identification of Gbp2 as a novel poly(A)+ RNA-binding protein involved in the cytoplasmic delivery of messenger RNAs in yeast. EMBO Rep. 2003, 4, 278–283. [Google Scholar]
- Porat, Z.; Erez, O.; Kahana, C. Cellular localization and phosphorylation of Hrb1p is independent of Sky1p. Biochim. Biophys. Acta 2006, 1763, 207–213. [Google Scholar] [CrossRef]
- Nolen, B.; Yun, C.Y.; Wong, C.F.; McCammon, J.A.; Fu, X.D.; Ghosh, G. The structure of Sky1p reveals a novel mechanism for constitutive activity. Nat. Struct. Biol. 2001, 8, 176–183. [Google Scholar] [CrossRef]
- Papoutsopoulou, S.; Nikolakaki, E.; Giannakouros, T. SRPK1 and LBR protein kinases show identical substrate specificities. Biochem. Biophys. Res. Commun. 1999, 255, 602–607. [Google Scholar] [CrossRef]
- Edmond, V.; Moysan, E.; Khochbin, S.; Matthias, P.; Brambilla, C.; Brambilla, E.; Gazzeri, S.; Eymin, B. Acetylation and phosphorylation of SRSF2 control cell fate decision in response to cisplatin. EMBO J. 2011, 30, 510–523. [Google Scholar] [CrossRef]
- Schenk, P.W.; Boersma, A.W.; Brok, M.; Burger, H.; Stoter, G.; Nooter, K. Inactivation of the Saccharomyces cerevisiae SKY1 gene induces a specific modification of the yeast anticancer drug sensitivity profile accompanied by a mutator phenotype. Mol. Pharmacol. 2002, 61, 659–666. [Google Scholar] [CrossRef]
- Erez, O.; Kahana, C. Screening for modulators of spermine tolerance identifies Sky1, the SR protein kinase of Saccharomyces cerevisiae, as a regulator of polyamine transport and ion homeostasis. Mol. Cell. Biol. 2001, 21, 175–184. [Google Scholar]
- Forment, J.; Mulet, J.M.; Vicente, O.; Serrano, R. The yeast SR protein kinase Sky1p modulates salt tolerance, Membrane potential and the Trk1,2 potassium transporter. Biochim. Biophys. Acta 2002, 1565, 36–40. [Google Scholar]
- Deka, P.; Bucheli, M.E.; Moore, C.; Buratowski, S.; Varani, G. Structure of the yeast SR protein Npl3 and interaction with mRNA 3'-end processing signals. J. Mol. Biol. 2008, 375, 136–150. [Google Scholar]
- Totallab. Available online: http://www.nonlinear.com/products/progenesis/samespots/ (accessed on 10 October 2012).
- Amoutzias, G.D.; He, Y.; Lilley, K.S.; van de Peer, Y.; Oliver, S.G. Evaluation and properties of the budding yeast phosphoproteome. Mol. Cell. Proteomics 2012, 11. [Google Scholar] [CrossRef] [Green Version]
- Huber, A.; Bodenmiller, B.; Uotila, A.; Stahl, M.; Wanka, S.; Gerrits, B.; Aebersold, R.; Loewith, R. Characterization of the rapamycin-sensitive phosphoproteome reveals that Sch9 is a central coordinator of protein synthesis. Genes Dev. 2009, 23, 1929–1943. [Google Scholar]
- Albuquerque, C.P.; Smolka, M.B.; Payne, S.H.; Bafna, V.; Eng, J.; Zhou, H. A multidimensional chromatography technology for in-depth phosphoproteome analysis. Mol. Cell. Proteomics 2008, 7, 1389–1396. [Google Scholar] [CrossRef]
- Swiss-Prot. Available online: http://www.expasy.ch/sprot (accessed on 15 October 2012).
- Ghaemmaghami, S.; Huh, W.K.; Bower, K.; Howson, R.W.; Belle, A.; Dephoure, N.; O’Shea, E.K.; Weissman, J.S. Global analysis of protein expression in yeast. Nature 2003, 425, 737–741. [Google Scholar] [CrossRef]
- ProtParam. Available online: http://web.expasy.org/protparam/ (accessed on 22 October 2012).
- Kastanos, E.K.; Woldman, Y.Y.; Appling, D.R. Role of mitochondrial and cytoplasmic serine hydroxymethyltransferase isozymes in de novo purine synthesis in Saccharomyces cerevisiae. Biochemistry 1997, 36, 14956–14964. [Google Scholar] [CrossRef]
- Konrad, M. Cloning and expression of the essential gene for guanylate kinase from yeast. J. Biol. Chem. 1992, 267, 25652–25655. [Google Scholar]
- Takahashi, H.; McCaffery, J.M.; Irizarry, R.A.; Boeke, J.D. Nucleocytosolic acetyl-coenzyme a synthetase is required for histone acetylation and global transcription. Mol. Cell 2006, 23, 207–217. [Google Scholar] [CrossRef]
- Pujol, N.; Bonet, C.; Vilella, F.; Petkova, M.I.; Mozo-Villarias, A.; de la Torre-Ruiz, M.A. Two proteins from Saccharomyces cerevisiae: Pfy1 and Pkc1, play a dual role in activating actin polymerization and in increasing cell viability in the adaptive response to oxidative stress. FEMS Yeast Res. 2009, 9, 1196–1207. [Google Scholar] [CrossRef]
- Kowalski, D.; Pendyala, L.; Daignan-Fornier, B.; Howell, S.B.; Huang, R.Y. Dysregulation of purine nucleotide biosynthesis pathways modulates cisplatin cytotoxicity in Saccharomyces cerevisiae. Mol. Pharmacol. 2008, 74, 1092–1100. [Google Scholar] [CrossRef]
- Petti, A.A.; Crutchfield, C.A.; Rabinowitz, J.D.; Botstein, D. Survival of starving yeast is correlated with Oxidative stress response and nonrespiratory mitochondrial function. Proc. Natl. Acad. Sci. USA 2011, 108, E1089–E1098. [Google Scholar] [CrossRef]
- Lee, J.; Spector, D.; Godon, C.; Labarre, J.; Toledano, M.B. A new antioxidant with Alkyl hydroperoxide defense properties in yeast. J. Biol. Chem. 1999, 274, 4537–4544. [Google Scholar]
- Kim, I.S.; Sohn, H.Y.; Jin, I. Adaptive stress response to menadione-induced Oxidative stress in Saccharomyces cerevisiae KNU5377. J. Microbiol. 2011, 49, 816–823. [Google Scholar] [CrossRef]
- McDonagh, B.; Ogueta, S.; Lasarte, G.; Padilla, C.A.; Barcena, J.A. Shotgun redox proteomics identifies specifically modified cysteines in key metabolic enzymes under oxidative stress in Saccharomyces cerevisiae. J. Proteomics 2009, 72, 677–689. [Google Scholar] [CrossRef]
- Santos, N.A.; Bezerra, C.S.; Martins, N.M.; Curti, C.; Bianchi, M.L.; Santos, A.C. Hydroxyl radical scavenger ameliorates cisplatin-induced nephrotoxicity by preventing oxidative stress, redox state unbalance, impairment of energetic metabolism and apoptosis in rat kidney mitochondria. Cancer Chemother. Pharmacol. 2008, 61, 145–155. [Google Scholar]
- Martins, N.M.; Santos, N.A.; Curti, C.; Bianchi, M.L.; Santos, A.C. Cisplatin induces mitochondrial oxidative stress with resultant energetic metabolism impairment, membrane rigidification and apoptosis in rat liver. J. Appl. Toxicol. 2008, 28, 337–344. [Google Scholar] [CrossRef]
- Lucibello, M.; Gambacurta, A.; Zonfrillo, M.; Pierimarchi, P.; Serafino, A.; Rasi, G.; Rubartelli, A.; Garaci, E. TCTP is a critical survival factor that protects cancer cells from oxidative stress-induced cell-death. Exp. Cell Res. 2011, 317, 2479–2489. [Google Scholar] [CrossRef]
- Rinnerthaler, M.; Jarolim, S.; Heeren, G.; Palle, E.; Perju, S.; Klinger, H.; Bogengruber, E.; Madeo, F.; Braun, R.J.; Breitenbach-Koller, L.; et al. MMI1 (YKL056c, TMA19), the yeast orthologue of the translationally controlled tumor protein (TCTP) has apoptotic functions and interacts with both microtubules and mitochondria. Biochim. Biophys. Acta 2006, 1757, 631–638. [Google Scholar] [CrossRef]
- Farah, M.E.; Sirotkin, V.; Haarer, B.; Kakhniashvili, D.; Amberg, D.C. Diverse protective roles of the actin cytoskeleton during oxidative stress. Cytoskeleton 2011, 68, 340–354. [Google Scholar] [CrossRef]
- Smolka, M.B.; Albuquerque, C.P.; Chen, S.H.; Zhou, H. Proteome-wide identification of in vivo targets of DNA damage checkpoint kinases. Proc. Natl. Acad. Sci. USA 2007, 104, 10364–10369. [Google Scholar] [CrossRef]
- Walter, W.; Clynes, D.; Tang, Y.; Marmorstein, R.; Mellor, J.; Berger, S.L. 14-3-3 interaction with histone H3 involves a dual modification pattern of phosphoacetylation. Mol. Cell. Biol. 2008, 28, 2840–2849. [Google Scholar] [CrossRef]
- Tkach, J.M.; Yimit, A.; Lee, A.Y.; Riffle, M.; Costanzo, M.; Jaschob, D.; Hendry, J.A.; Ou, J.; Moffat, J.; Boone, C.; et al. Dissecting DNA damage response pathways by analysing protein localization and abundance changes during DNA replication stress. Nat. Cell Biol. 2012, 14, 966–976. [Google Scholar] [CrossRef]
- Burbelo, P.D.; Hall, A. 14-3-3 proteins hot numbers in signal transduction. Curr. Biol. 1995, 5, 95–96. [Google Scholar] [CrossRef]
- Clapp, C.; Portt, L.; Khoury, C.; Sheibani, S.; Norman, G.; Ebner, P.; Eid, R.; Vali, H.; Mandato, C.A.; Madeo, F.; et al. 14-3-3 protects against stress-induced apoptosis. Cell. Death Dis. 2012, 3, e348. [Google Scholar] [CrossRef]
- Jazwinski, S.M.; Kriete, A. The yeast retrograde response as a model of intracellular signaling of mitochondrial dysfunction. Front. Physiol. 2012, 3, 139. [Google Scholar]
- Jazwinski, S.M. The retrograde response and other pathways of interorganelle communication in yeast replicative aging. Subcell. Biochem. 2012, 57, 79–100. [Google Scholar] [CrossRef]
- Rosado, C.J.; Mijaljica, D.; Hatzinisiriou, I.; Prescott, M.; Devenish, R.J. Rosella: A fluorescent pH-biosensor for reporting vacuolar turnover of cytosol and organelles in yeast. Autophagy 2008, 4, 205–213. [Google Scholar] [CrossRef]
- Rodríguez Lombardero, S.; Vizoso Vázquez, A.; Rodríguez Belmonte, E.; González Siso, M.I.; Cerdán, M.E. SKY1 and IXR1 interactions, their effects on cisplatin and spermine resistance in Saccharomyces cerevisiae. Can. J. Microbiol. 2012, 58, 184–188. [Google Scholar] [CrossRef]
- Euroscarf. Available online: http://web.uni-frankfurt.de/fb15/mikro/euroscarf/ (accessed on 21 November 2012).
- Zitomer, R.S.; Hall, B.D. Yeast cytochrome C messenger RNA in vitro translation and specific immunoprecipitation of the CYC1 gene product. J. Biol. Chem. 1976, 251, 6320–6326. [Google Scholar]
- Ruiz-Romero, C.; Lopez-Armada, M.J.; Blanco, F.J. Mitochondrial proteomic characterization of human normal articular chondrocytes. Osteoarthr. Cartil. 2006, 14, 507–518. [Google Scholar] [CrossRef]
- Sechi, S.; Chait, B.T. Modification of cysteine residues by alkylation. A tool in peptide mapping and protein identification. Anal. Chem. 1998, 70, 5150–5158. [Google Scholar] [CrossRef]
- Matrixscience. Available online: http://www.matrixscience.com (accessed on 15 December 2012).
© 2014 by the authors; licensee MDPI, Basel, Switzerland. This article is an open access article distributed under the terms and conditions of the Creative Commons Attribution license (http://creativecommons.org/licenses/by/3.0/).
Share and Cite
Rodríguez-Lombardero, S.; Rodríguez-Belmonte, M.E.; González-Siso, M.I.; Vizoso-Vázquez, Á.; Valdiglesias, V.; Laffón, B.; Cerdán, M.E. Proteomic Analyses Reveal that Sky1 Modulates Apoptosis and Mitophagy in Saccharomyces cerevisiae Cells Exposed to Cisplatin. Int. J. Mol. Sci. 2014, 15, 12573-12590. https://doi.org/10.3390/ijms150712573
Rodríguez-Lombardero S, Rodríguez-Belmonte ME, González-Siso MI, Vizoso-Vázquez Á, Valdiglesias V, Laffón B, Cerdán ME. Proteomic Analyses Reveal that Sky1 Modulates Apoptosis and Mitophagy in Saccharomyces cerevisiae Cells Exposed to Cisplatin. International Journal of Molecular Sciences. 2014; 15(7):12573-12590. https://doi.org/10.3390/ijms150712573
Chicago/Turabian StyleRodríguez-Lombardero, Silvia, M. Esther Rodríguez-Belmonte, M. Isabel González-Siso, Ángel Vizoso-Vázquez, Vanessa Valdiglesias, Blanca Laffón, and M. Esperanza Cerdán. 2014. "Proteomic Analyses Reveal that Sky1 Modulates Apoptosis and Mitophagy in Saccharomyces cerevisiae Cells Exposed to Cisplatin" International Journal of Molecular Sciences 15, no. 7: 12573-12590. https://doi.org/10.3390/ijms150712573