Next Article in Journal
Cystic Fibrosis Related Liver Disease—Another Black Box in Hepatology
Previous Article in Journal
Non-Coding RNAs and Lipid Metabolism
 
 
Correction published on 5 September 2014, see Int. J. Mol. Sci. 2014, 15(9), 15766.
Article

Population Structure of the Greenhouse Whitefly, Trialeurodes vaporariorum (Westwood), an Invasive Species from the Americas, 60 Years after Invading China

1
Key Lab of Integrated Crop Pest Management of Shandong Province, College of Agronomy and Plant Protection, Qingdao Agricultural University, Qingdao 266109, China
2
Department of Plant Protection, Institute of Vegetables and Flowers, Chinese Academy of Agricultural Sciences, Beijing 100081, China
3
School of Plant Sciences, University of Arizona, Tucson, AZ 85721, USA
*
Authors to whom correspondence should be addressed.
These authors contributed equally to this study.
Int. J. Mol. Sci. 2014, 15(8), 13514-13528; https://doi.org/10.3390/ijms150813514
Submission received: 18 May 2014 / Revised: 16 June 2014 / Accepted: 21 July 2014 / Published: 4 August 2014
(This article belongs to the Section Biochemistry)

Abstract

:
Though the greenhouse whitefly, Trialeurodes vaporariorum (Westwood) (Hemiptera: Aleyrodidae) was introduced into China more than 60 years ago, the genetic diversity and structure of this exotic insect pest and virus vector have not been studied. To investigate the population genetic characteristics of this invasive species and to identify potential invasion routes, the genetic diversity and population structure of 17 collections of T. vaporariorum from nine provinces in China were analyzed using seven microsatellite loci. The results of the analyses indicated that the genetic diversity for the populations examined from the four provinces: Jilin, Ningxia, Guizhou and Qinghai, was lower than the genetic diversity of populations from the five provinces: Yunnan, Shandong, Shanxi, Liaoning, and Gansu. The T. vaporariorum populations analyzed in this study grouped as two distinct genetic clusters based on the analysis using STRUCTURE, whereas, 8 clusters were identified based on the BAPS analysis. Of the 136 genetic distance (Fst) values, 128 (94%) were associated with a significant exact test. There was a significant relationship between Fst and geographical distance. These results demonstrate that populations of T. vaporariorum in China exhibit significant genetic differentiation, indicating the likelihood that multiple introductions of T. vaporariorum into China have occurred. Also, the populations collected from the provinces of Jilin, Ningxia, Guizhou and Qinghai appear to represent secondary introductions originating from other Chinese provinces.

1. Introduction

The greenhouse whitefly, Trialeurodes vaporariorum (Westwood), which has its origin in tropical or subtropical America (Mound & Halsey, 1978), is an economically important pest of horticultural and ornamental crops, worldwide [1]. It is distributed on all continents except Antarctica [2,3,4,5,6]. The greenhouse whitefly is a polyphagous species, colonizing more than 250 host plants [7,8]. It can be both a vector of plant viruses [9,10,11,12], and a pest, causing considerable damage to the plant by feeding in the phloem [1]. Under greenhouse conditions this pest can multiply quickly many generations [2], and in addition, this whitefly has a propensity to develop resistance to insecticides [13].
In China, T. vaporariorum was first discovered in Beijing during the 1940s. During the early 1960s, it was found in Tianjin, and then in Inner Mongolia in the 1970s [14]. Since the first serious outbreak of the greenhouse whitefly in fields and greenhouses in Beijing during 1976 [15], it has reached pest status, causing damage to food crop and ornamental plants in a number of provinces including Xinjiang and Gansu in the 1990s. Currently, the greenhouse whitefly is known to be distributed in at least 22 provinces of China [14]. Though the greenhouse whitefly has existed in China for more than 60 years, its genetic diversity and population structure have not been studied to understand the extent of genetic differentiation, the number of distinct invasive events, and the routes by which these invasions have occurred. Such information will aid in understanding the invasion biology and microevolution of the greenhouse whitefly in China.
Extensive studies using molecular markers have provided estimates of the potential invasion routes, and of genetic characteristics of a number of invasive species [16,17,18]. For example, analysis of the genetic structure of the western flower thrips, Frankliniella occidentalis (Pergande) has revealed the invasion route and potential source of a secondary introduction in China [19], which could be useful for avoiding further spread and/or additional introductions of this pest. Because introduced populations usually experience rapid genetic differentiation in new environments, genetic structure analysis can lend insights into the genetic characteristics, and the degree of expansion or contraction that has occurred in invasive species populations [20,21]. Microsatellite loci have been used to study the genetics of insect populations because they are widely distributed in the genome, are inherited codominantly, exhibit abundant variation, and yield reproducible results [19,22,23,24].
The objective of this study was to determine the genetic structure and subsequent spread of the greenhouse whitefly, T. vaporariorum within China. To accomplish this, the genetic structure of 17 populations collected from nine provinces in China was analyzed using seven microsatellite loci.

2. Results and Discussion

2.1. Genetic Diversity

The values of genetic diversity indexes of the Chinese populations are provided in Table 1. The average number of alleles per locus (Na) ranged from 2.1429 (Xining, Qinghai) to 5.000 (Yuxi, Yunnan), and the effective number of alleles (Ne) ranged from 1.4428 (Xining, Qinghai) to 2.4447 (Yuxi, Yunnan). The expected heterozygosity (He) ranged from 0.2324 (Changchun, Jilin) to 0.5061 (Yuxi, Yunnan), while the observed heterozygosity (Ho) ranged from 0.1068 (Changchun, Jilin) to 0.4550 (Xishuangbanna, Yunnan). The value of He in each population was higher than the value of Ho. Nei’s expected heterozygosity (Nei) ranged from 0.2276 (Changchun, Jilin) to 0.4945 (Yuxi, Yunnan).
The population of Yuxi, Yunnan (YN3) had the highest value of He, at 0.5061, while the population of Changchun, Jilin (JL3) had the lowest value at 0.2324. The populations from Yunnan (YN1-YN3), Shandong (SD), Shanxi (SX), Liaoning (LN), and Gansu (GS1-GS2) exhibited a He value of greater than the mean value of He 0.3683. In contrast, the He values of the other 9 populations from four provinces (Jilin, Ningxia, Guizhou, and Qinghai) were lower.

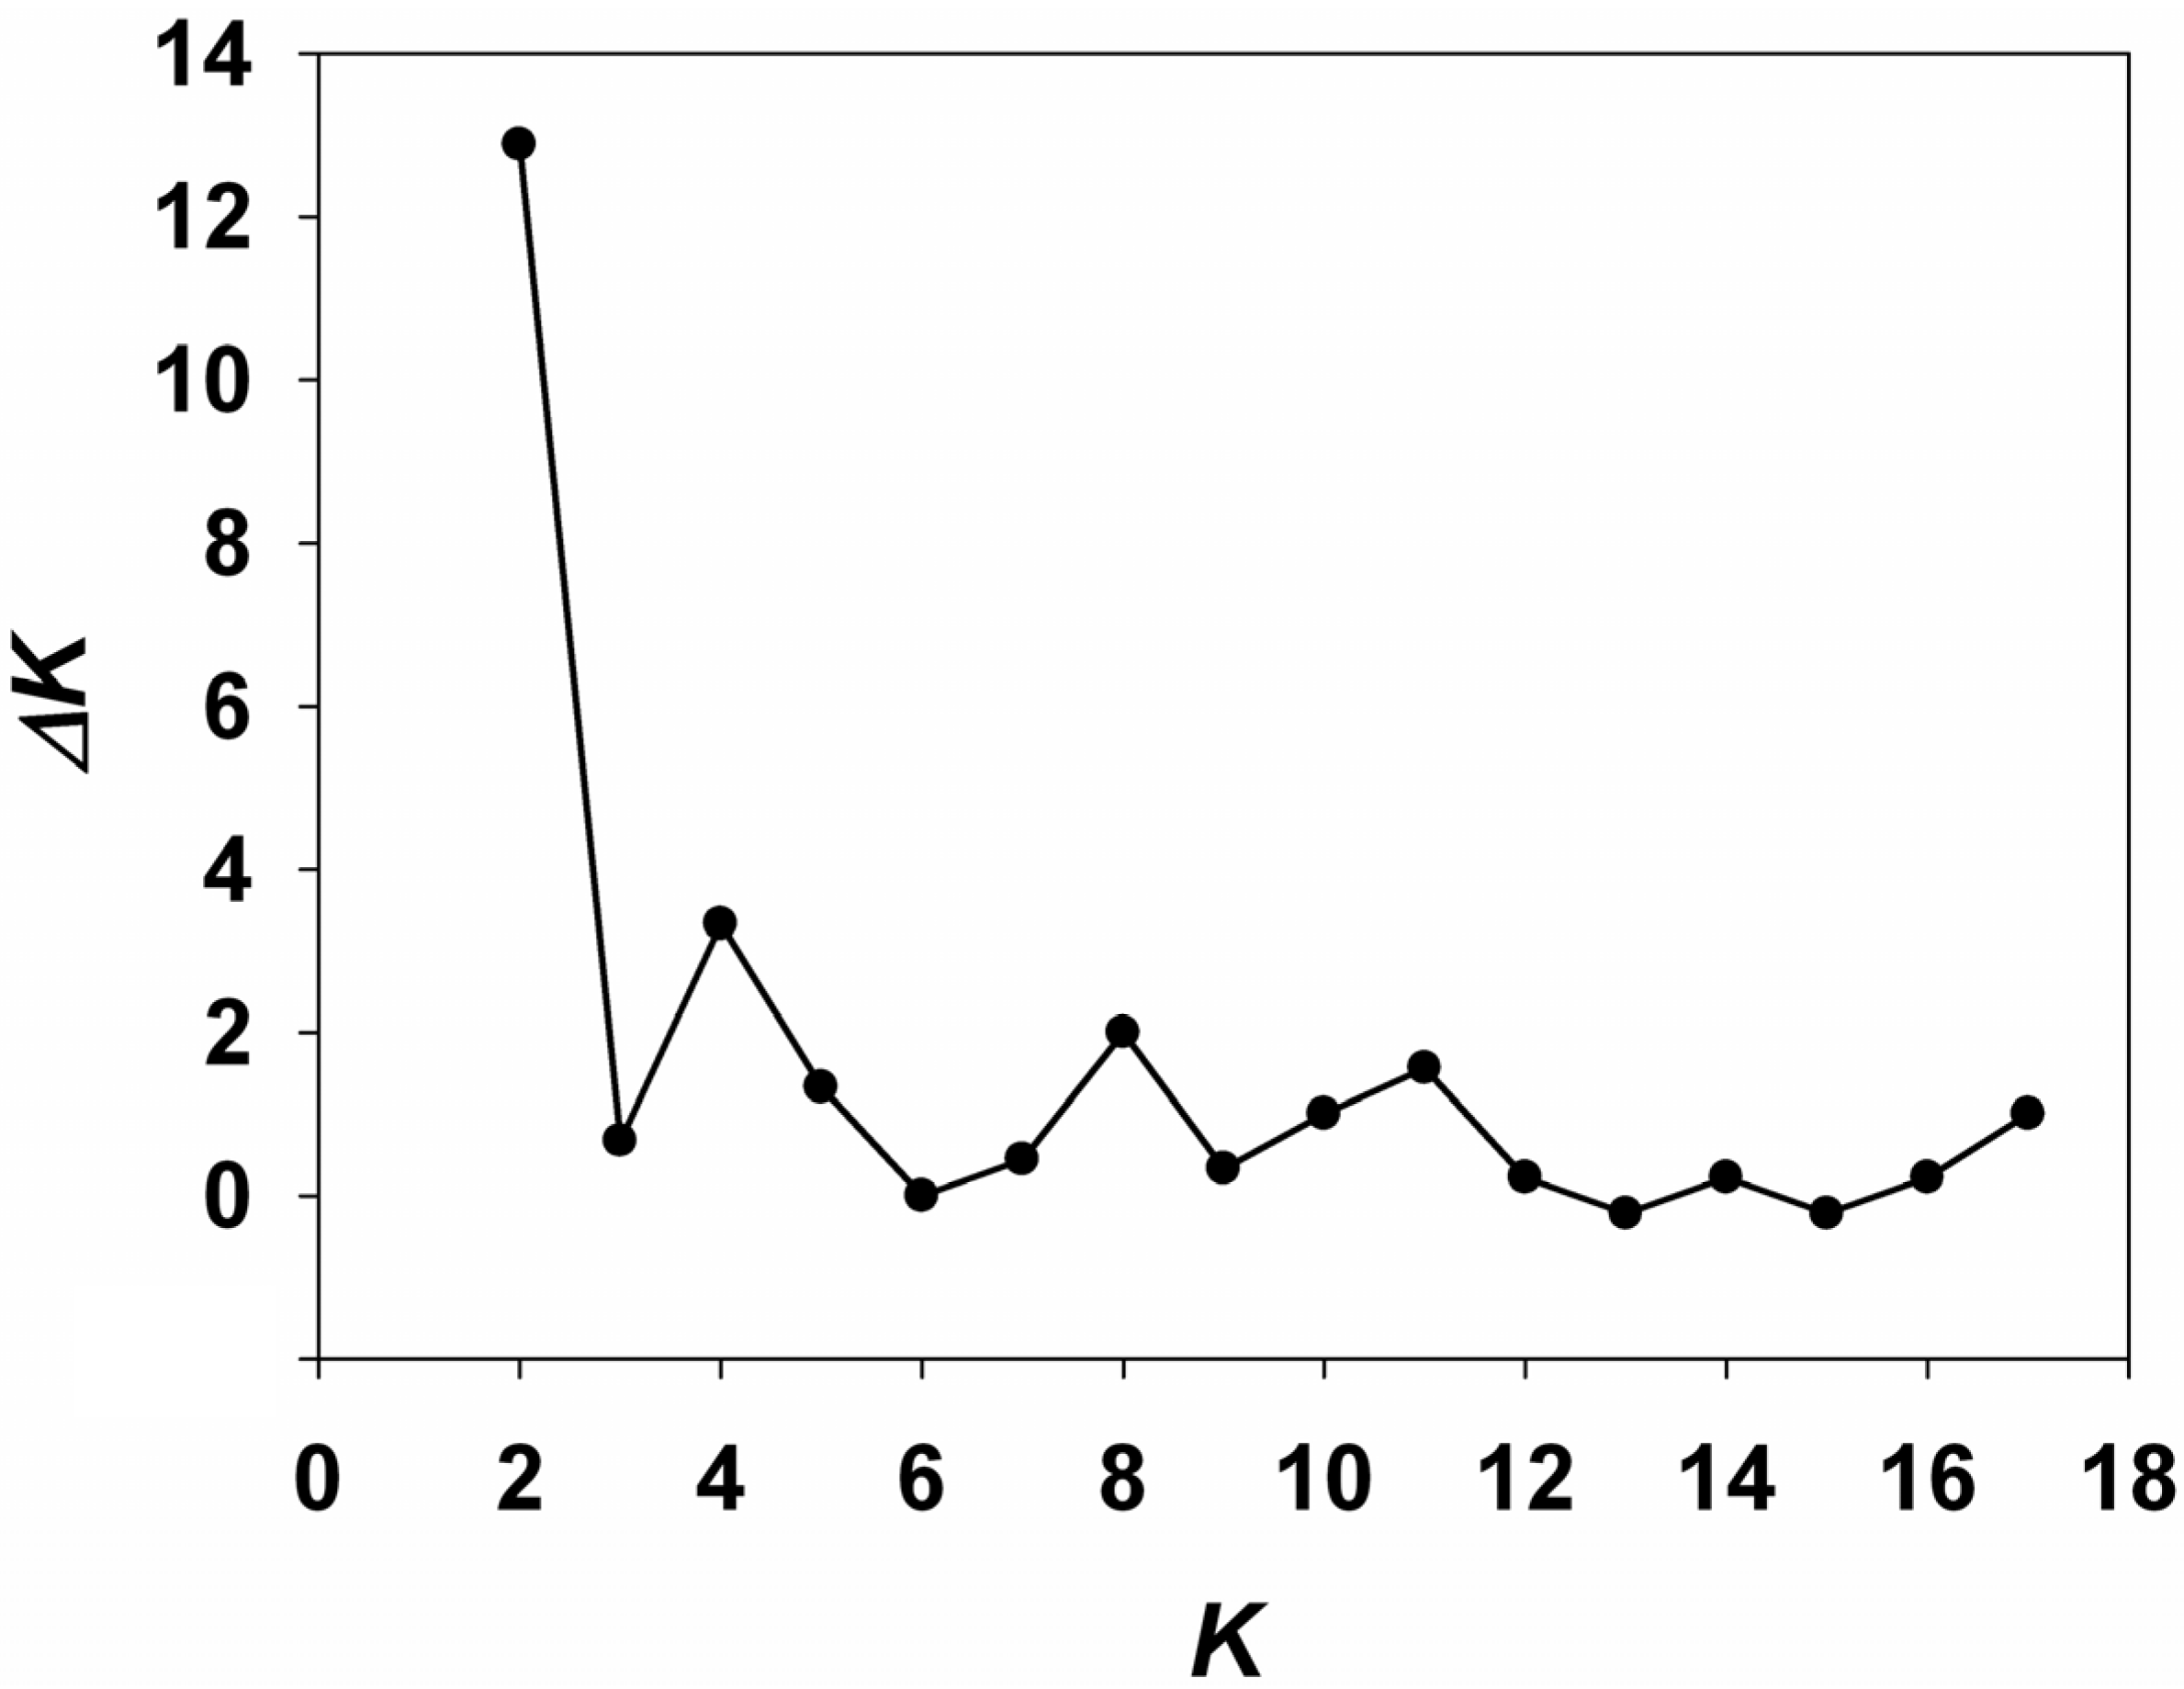
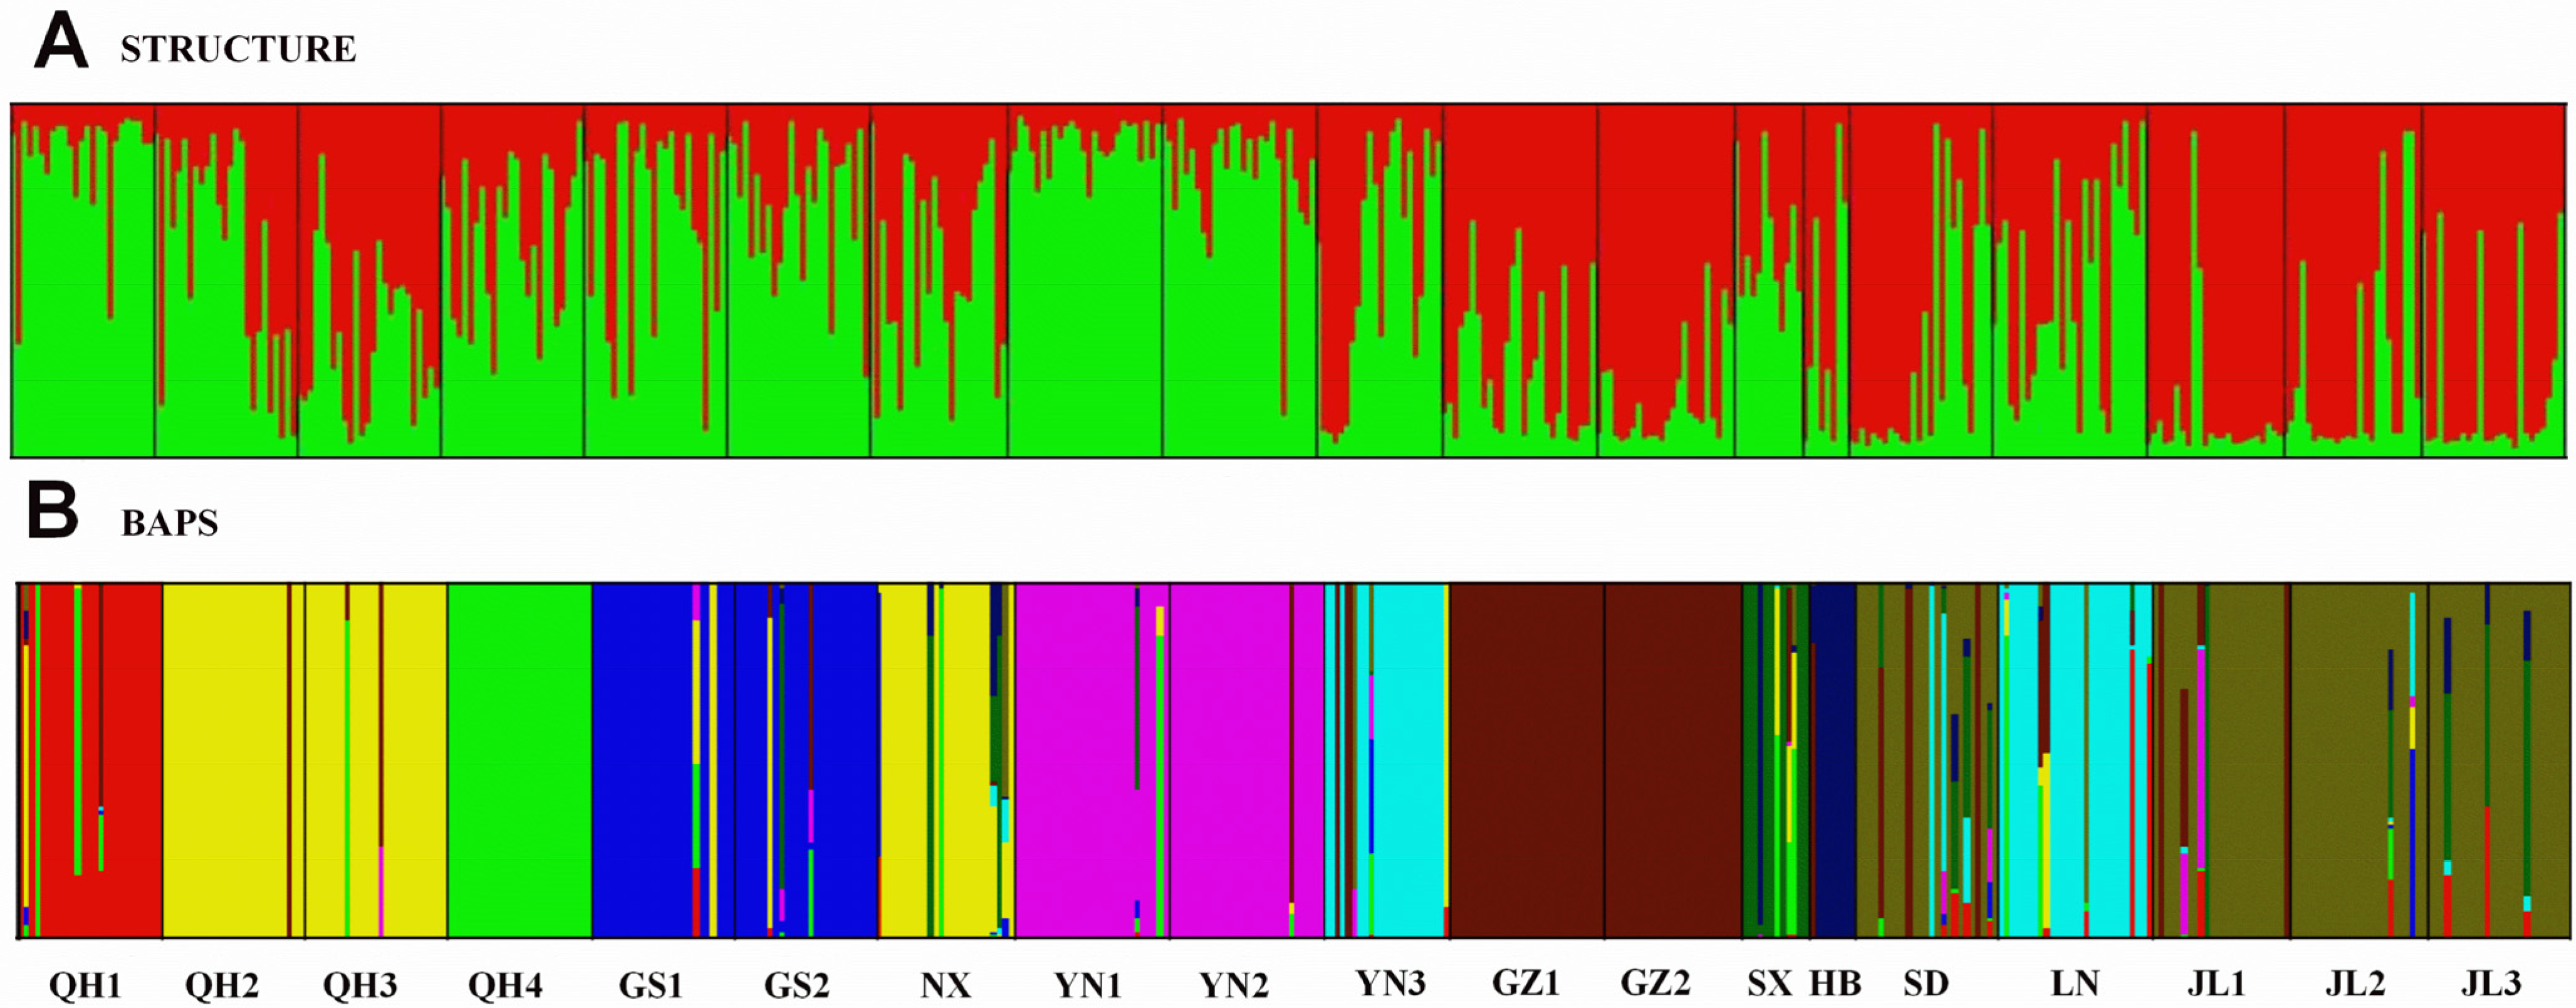
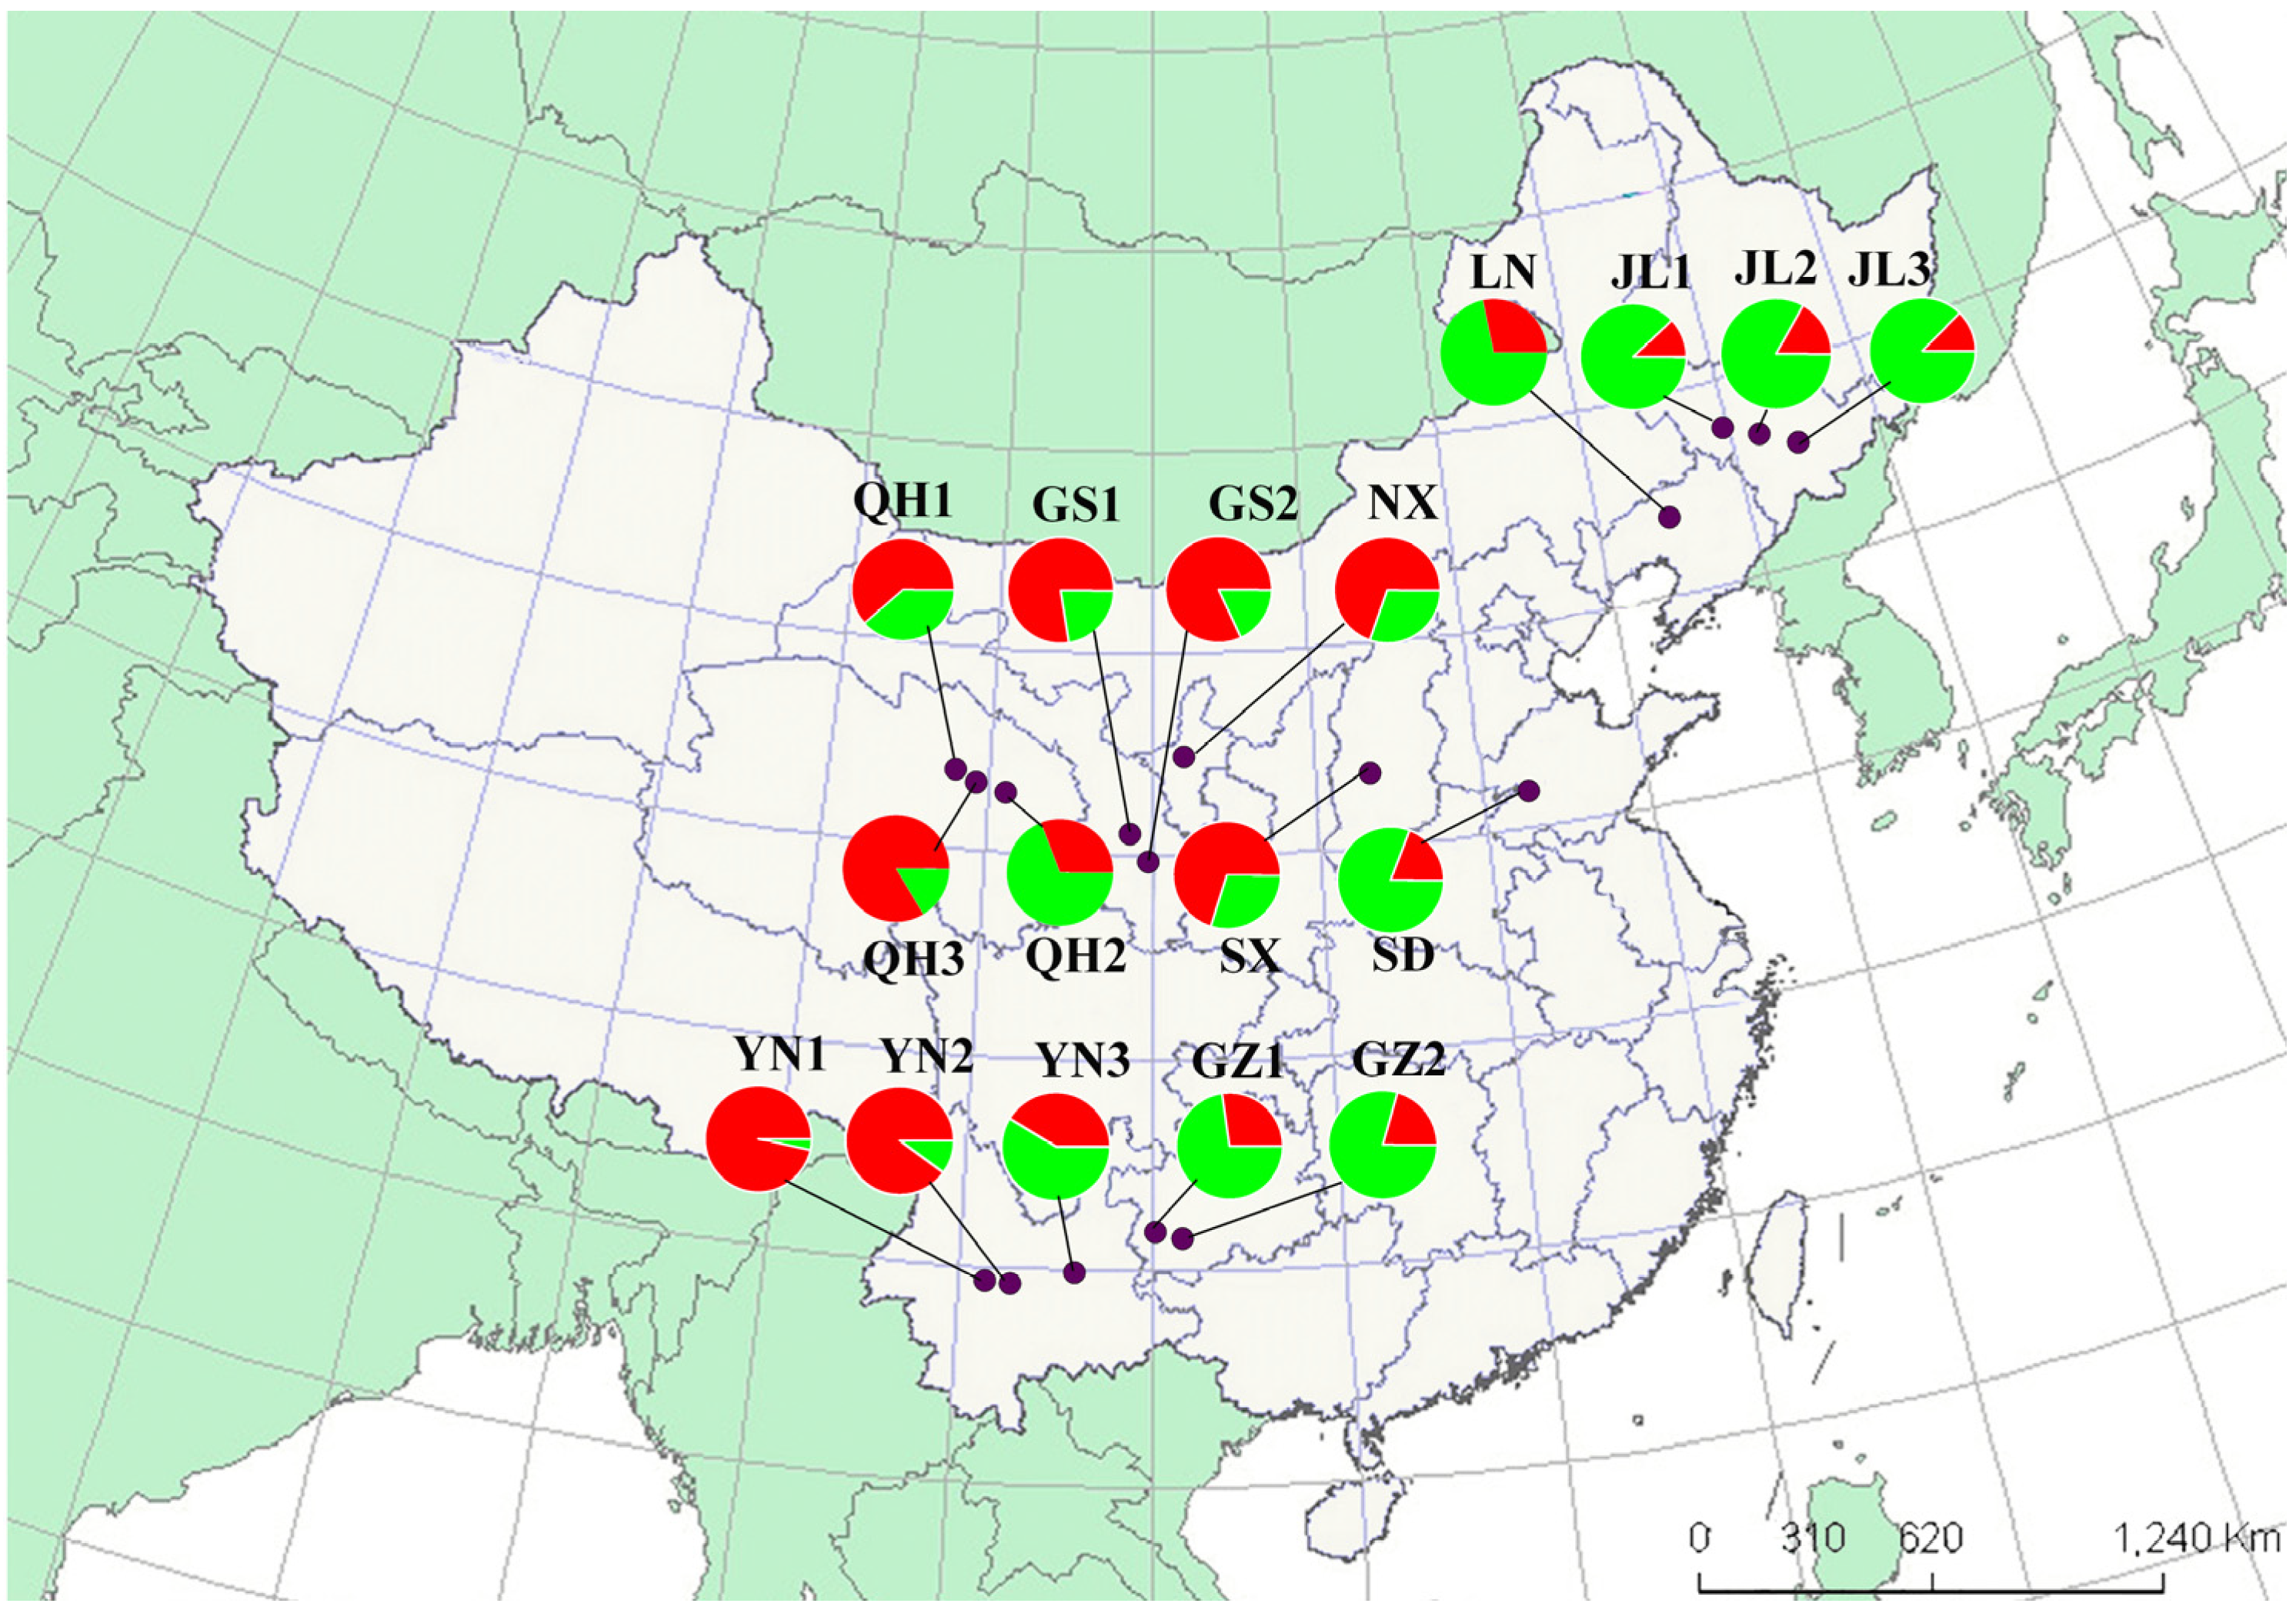
2.2. Analyses of Genetic Structure within Populations

The estimator of the fixation index, Fis, was not significant, indicating that there was no sub-structure within all populations (Table 1). In testing for deviation from mutation-drift equilibrium in BOTTLENECK software [25], the significant heterozygosity deficiency was not detected in the 17 populations. Significant heterozygosity excess was not detected in any population under either the TPM (two-phase mutation model) or SMM (stepwise mutation model), respectively. However, using the IAM (infinite allele model) a significant heterozygosity excess (p < 0.05) was detected in the six populations: QH1, QH2, GS1, YN1, YN2, and JL1 (Table 2), indicating that they may have undergone a genetic bottleneck.

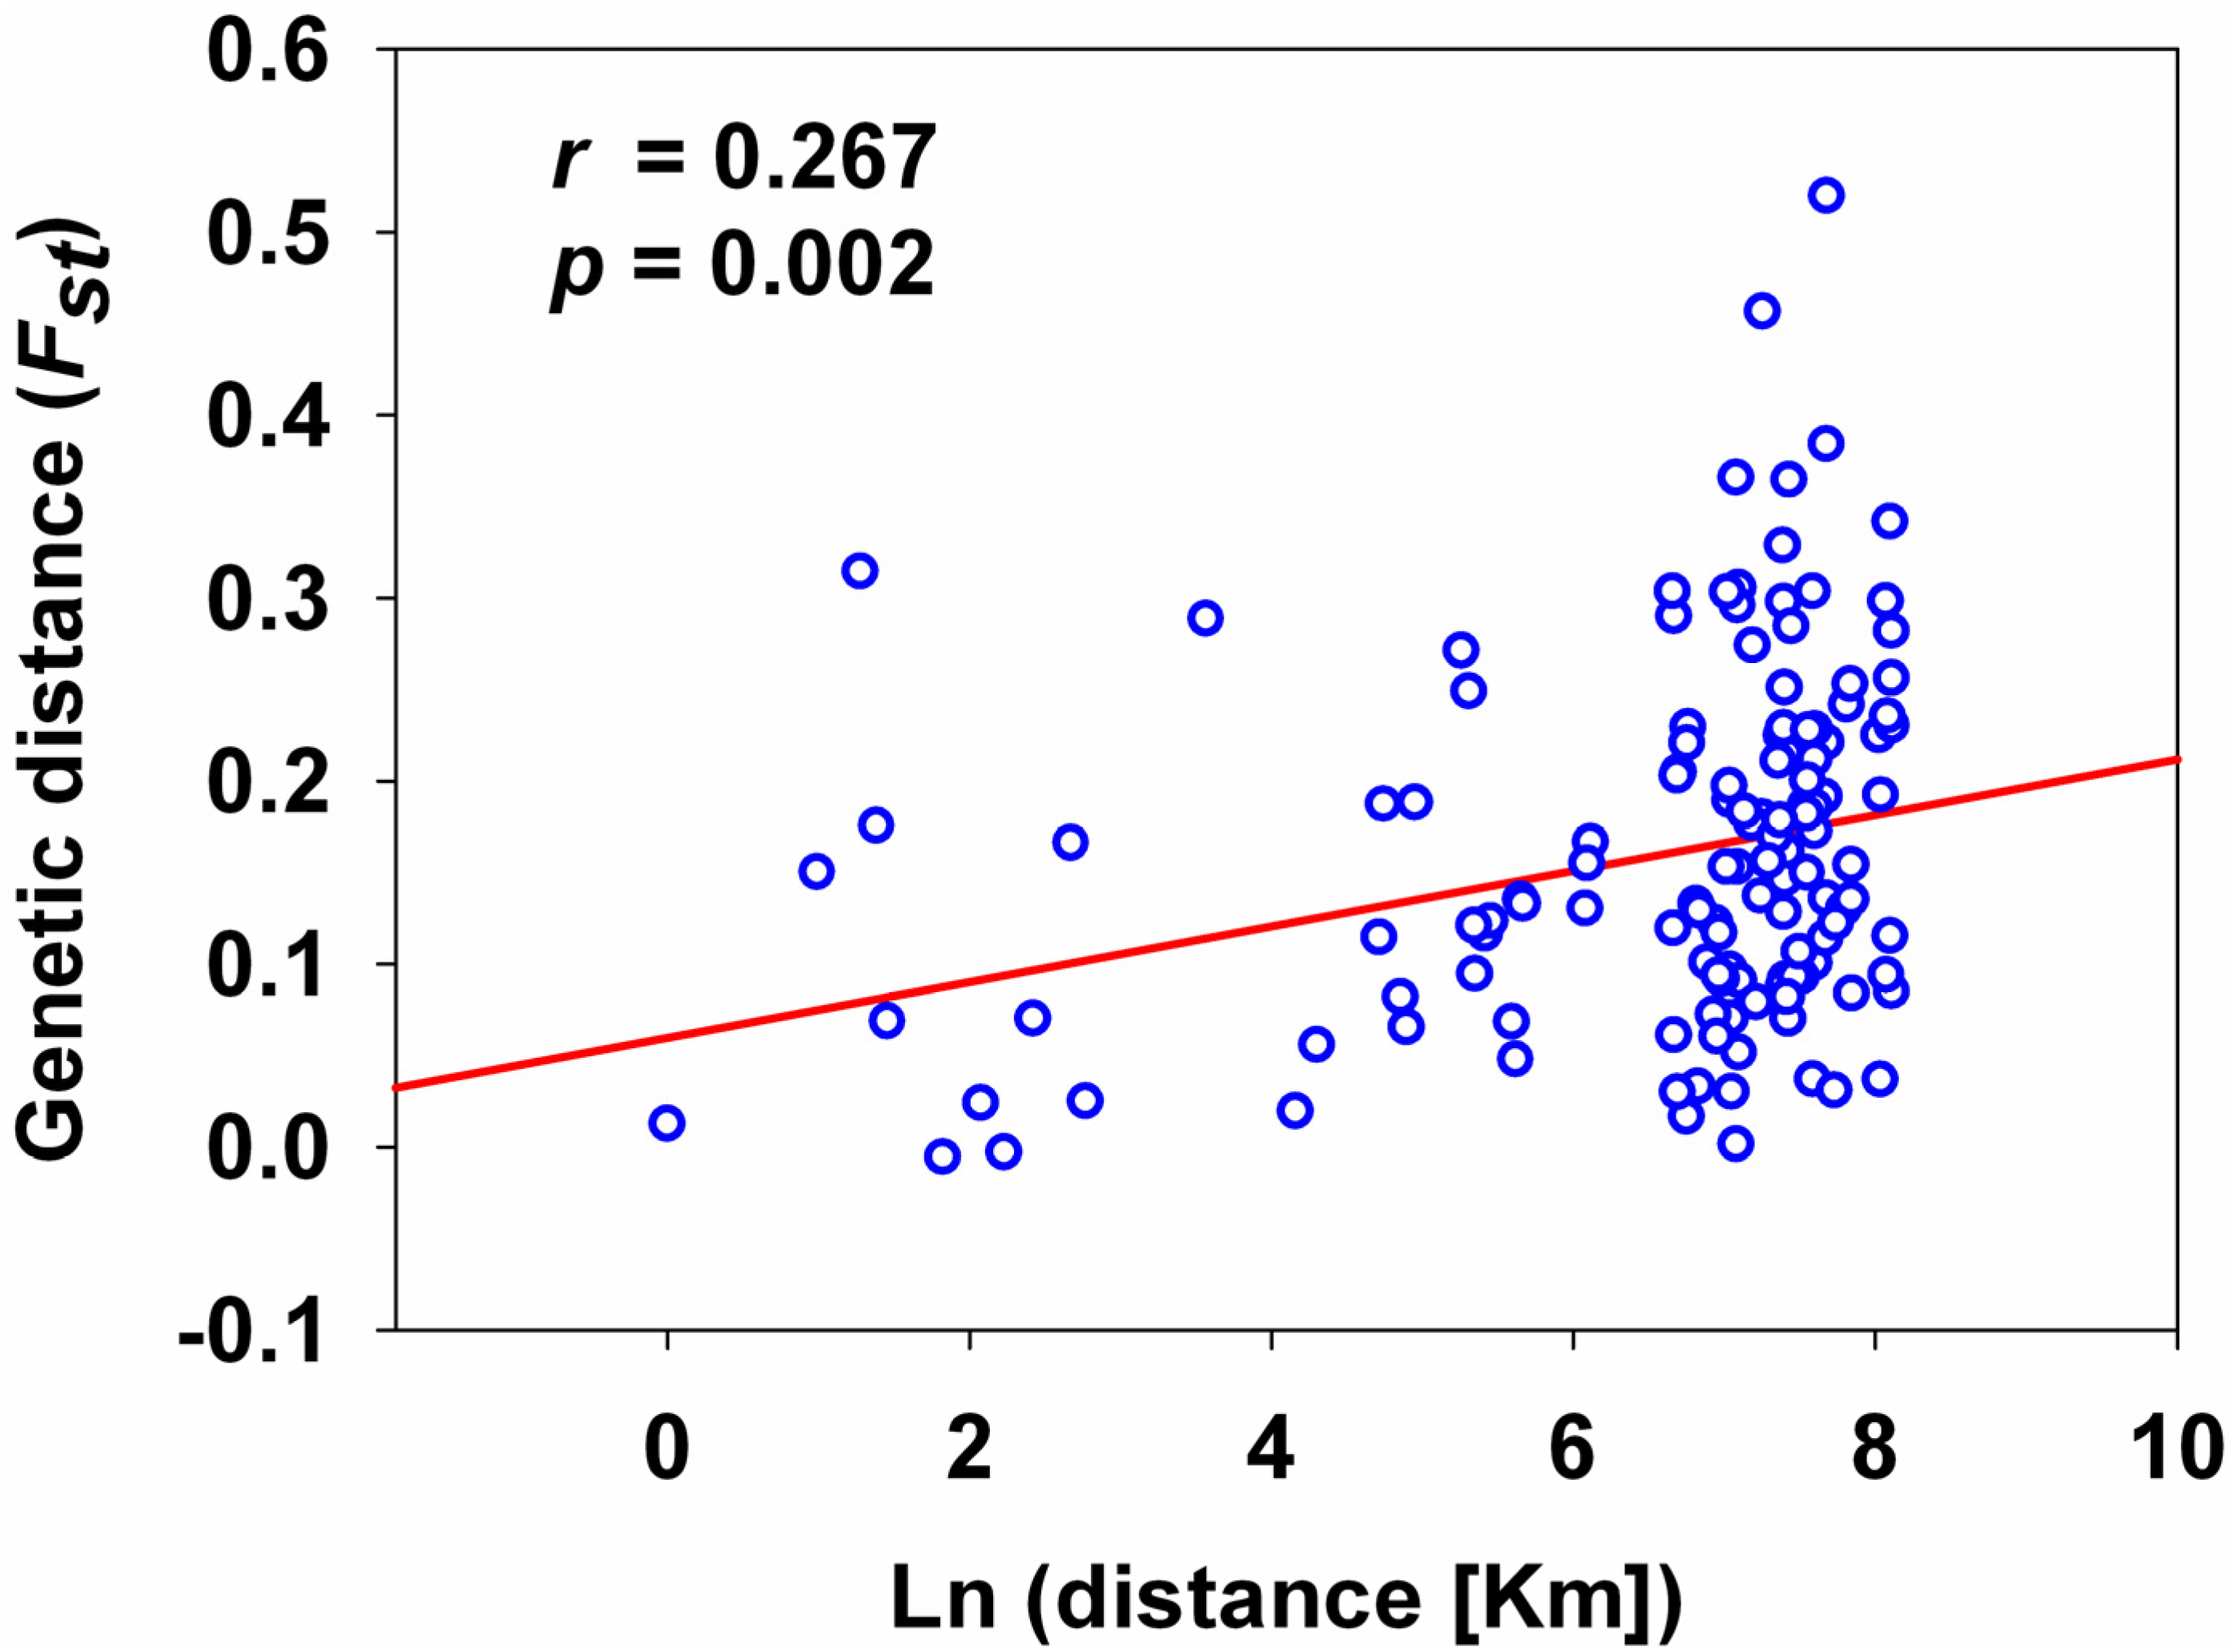
2.3. Analyses of Genetic Structure among Populations

The analysis using MICRO-CHEKCER software [26] showed that only two of the seven loci had low frequencies of the null alleles. The estimated null alleles frequency ranged from 0.09 to 0.19 among all populations. When considering each population pair, 128 of 136 Fst values (94%) were associated with a significant test (Table 3). Estimates of pairwise Fst values ranged from −0.0057 (GS1/GS2) to 0.5194 (QH3/JL3). Obvious variation in allelic diversity and heterozygosity was found among the different populations (Table 1). Evidence of isolation by distance was found, based on the Mantel test for correlation between pairwise Fst and geographic distance (r = 0.267; p = 0.002) (Figure 1).
Table 1. Collection sites, population codes, dates of collection, host plants, and genetic diversity indexes for the greenhouse whitefly Trialeurodes vaporariorum populations from China examined in this study.
LocalityCodeDateHostNNaNeHoHeNeiArFisp ValuesPwil
Xining, QinghaiQH12011.8Eggplant252.28571.69870.32000.34130.33452.0350−0.00940.42500.9844
Xining, QinghaiQH22012.9Eggplant252.14291.50740.30290.31440.30811.95490.04600.59660.9453
Xining, QinghaiQH32012.9Kidney bean252.14291.44280.22290.24990.24491.79260.16480.37680.6875
Baiyin, GansuGS12011.8Tomato252.57141.86880.31430.37740.36982.24390.19190.12610.8906
Baiyin, GansuGS22011.8Eggplant252.85711.74950.33860.38490.37712.27210.09160.28040.5000
Yinchuan, NingxiaNX2012.9Eggplant243.14291.59850.22290.32770.32082.23440.33380.20160.0547
Xishuangbanna, YunnanYN12011.9Tomato273.00001.99850.43080.45630.44782.52290.04960.26310.9219
Xishuangbanna, YunnanYN22011.9Eggplant273.00002.13050.45500.48360.47462.60010.03290.49140.9453
Yuxi, YunnanYN32012.1Kidney bean225.00002.44470.29930.50610.49453.60000.42470.17000.1484
Guiyang, GuizhouGZ12011.7Tomato272.57141.66850.40110.36510.35832.2656−0.04620.41250.9219
Guiyang, GuizhouGZ22011.8Eggplant243.14291.56650.30030.31210.30552.2867−0.02030.57580.0156
Yuncheng, ShanxiSX2011.1Tomato123.42862.06780.36930.44080.41893.01060.14760.18630.3438
Jinan, ShandongSD2012.9Cucumber254.42861.98860.30260.43070.42193.01810.27210.17710.0195
Fushun, LiaoningLN2011.1Tomato273.42861.85390.21160.37000.36312.54960.28530.22080.2891
Changchun, JilinJL12012.8Tomato242.42861.67350.33230.34950.34212.10440.06990.31410.9453
Changchun, JilinJL22012.8Cucumber243.00001.74210.23070.31810.31132.37990.20630.15600.2813
Changchun, JilinJL32012.9Pepper252.42861.49490.10680.23240.22762.00030.58120.05050.0781
Mean----3.00001.79380.30360.36830.36002.4042---
For each sample, the following genetic diversity indexes are indicated: sampling site, population code, date of collection, host plant, sample size (N), average number of alleles per locus (Na), the effective number of alleles (Ne), the observed heterozygosity (Ho), the expected heterozygosity (He), Nei’s expected heterozygosity (Nei), allelic richness (Ar), estimator of the fixation index (Fis), and the Wilcoxon test p value for heterozygosity deficit, compared to expectations at mutation-drift equilibrium (Pwil).
Table 2. Comparison of the within-population tests for heterozygosity excess tests using the models IAM (infinite allele model), TPM (two-phase mutation model), and SMM (stepwise mutation model) in BOTTLENECK.
LocalityPopulation CodeHeterozygosity Excess p Values
IAMTPMSMM
Xining, QinghaiQH10.03130.03130.1094
Xining, QinghaiQH20.02340.07810.2813
Xining, QinghaiQH30.31250.40630.8906
Baiyin, GansuGS10.04690.31250.4063
Baiyin, GansuGS20.34380.57810.5781
Yinchuan, NingxiaNX0.71090.96090.9883
Xishuangbanna, YunnanYN10.03910.21880.2813
Xishuangbanna, YunnanYN20.01950.14840.3438
Yuxi, YunnanYN30.76560.94530.9883
Guiyang, GuizhouGZ10.05470.21880.4219
Guiyang, GuizhouGZ20.94530.99221.0000
Yuncheng, ShanxiSX0.42190.71880.9453
Jinan, ShandongSD0.94530.98830.9922
Fushun, LiaoningLN0.71090.76560.9727
Changchun, JilinJL10.02340.07810.5000
Changchun, JilinJL20.57810.78130.9609
Changchun, JilinJL30.71880.94530.9922
Bolded numbers indicate they are significant at p < 0.05.
Figure 1. Relationship between genetic distance and log of geographical distance for Trialeurodes vaporariorum. The red line represents the regression line and blue circles represent the logarithm transformation of distance.
Ijms 15 13514 g001
Table 3. Population pairwise Fst (genetic distance) values.
Population CodeQH1QH2QH3GS1GS2NXYN1YN2YN3GZ1GZ2SXSDLNJL1JL2
QH20.1661---------------
QH30.28830.3145--------------
GS10.11640.12080.2489-------------
GS20.12320.09430.2711−0.0057------------
NX0.16640.15490.13010.13520.1327-----------
YN10.16150.22460.25080.08960.08770.2003----------
YN20.12820.21480.29780.09130.09280.22750.0126---------
YN30.14630.06990.22890.08260.08160.14990.17550.1503--------
GZ10.15290.00150.29580.11440.09690.17680.20450.20250.0609-------
GZ20.30560.05170.36560.19730.18720.27370.29000.30350.11950.0248------
SX0.07030.08560.15300.07230.06030.09070.13260.12890.03310.08170.1879-----
SD0.18910.03010.30290.12230.11690.18300.22930.22040.01650.01940.05580.1008----
LN0.10020.03700.30360.09290.10640.16980.22500.19220.03680.03090.12210.07900.0238---
JL10.19140.11390.38380.17260.18550.28420.25620.23010.08480.08370.15410.17840.03000.0478--
JL20.18030.13700.45620.18640.18190.32840.29810.23540.09390.12980.24180.15620.09160.06540.0686-
JL30.22100.13560.51940.22800.21180.36440.34150.28170.11500.13510.25270.21090.09360.06840.0703−0.0031
Significant values (p < 0.05) for pairwise Fst are in bold.
The optimal number of clusters obtained with Evanno’s ΔK method was two (Figure 2 and Figure 3a). Thus, analyses using STRUCTURE software [27] identified two distinct genetic clusters. Eight populations (NX, GS1, GS2, SX, QH1, QH3, YN1, YN2) formed one cluster, and nine populations (JL1, JL2, JL3, LN, SD, QH2, YN3, GZ1, GZ2) formed another cluster. Analyses using BAPS software [28,29] identified ten genetic clusters overall (Figure 3b), with three clusters consisting of only one population each: QH3, SX, and SD, respectively; the three populations QH1, QH2, and NX formed one cluster, the populations GS1 and GS2 formed one cluster, YN1 and YN2 formed one cluster, YN3 and LN formed one cluster, and GZ1 and GZ2 formed one cluster.
Figure 2. Scatter plots of ΔK.
Ijms 15 13514 g002
Figure 3. Results of genetic clustering using STRUCTURE (a) and BAPS (b) analysis, based on the 7 microsatellite loci used in the study.
Ijms 15 13514 g003

2.4. Discussion

An investigation of the genetic diversity and structure of T. vaporariorum populations introduced into China beginning at least 60 years ago, has revealed new information about the genetic diversity and structure, based on the analysis of 17 populations from nine provinces using seven microsatellite loci. The results indicated that the genetic diversity for the populations from Jilin, Ningxia, Guizhou, and Qinghai was lower than for those from Yunnan, Shandong, Shanxi, Liaoning, and Gansu. T. vaporariorum populations formed two genetic clusters based on STRUCTURE analysis, and eight clusters based on BAPS analysis. The discrepancy in clustering between STRUCTURE and BAPS may have been due to the underlying model of admixture implemented by each program. Both genetic clustering analyses showed that Chinese populations of T. vaporariorum have significant genetic differentiation, which indicates multiple introductions of T. vaporariorum have occurred into China. The invasion pattern involving multiple introductions has been revealed in many invasive species including mosquitofish Gambusia spp., ctenophore Mnemiopsis leidyi, and caprellid Caprella scaura [30,31,32]. Multiple introductions are regarded as one main source for genetic diversity [33], which is often associated with successful invasions of some species [34,35]. Thus, we speculate that multiple introductions of T. vaporariorum have occurred into China, which might have been helpful to its successful invasion.
Of the 136 Fst values, 128 (94%) were associated with a significant exact test. However, the significant correlation was observed between Fst and geographical distance, suggesting that the spread of the populations was most likely associated with natural dispersal. The Fst data and analyses support the hypothesis that the introduced populations represent several distinct genetic lineages. Three possible explanations can be considered to explain the genetic differentiation of T. vaporariorum populations in China. One possible explanation could be a low rate of gene flow among the populations, which is known to result in the rapid genetic differentiation. The second possibility is that whitefly experienced rapid evolution to facilitate adaptation to new environments following the introduction. The genetic drift and natural selection resulting from exposure to some new plant hosts, climate, and management practices, all features that differ among regions in China, may have resulted in the selection of different variants [20].
The genetic diversity analysis based on He values indicates that the populations from four provinces: Jilin, Ningxia, Guizhou, and Qinghai might represent a secondary introduction stemming from the Yunnan, Shandong, Shanxi, Liaoning, and Gansu populations. When the results are considered together with the STRUCTURE and BAPS analysis, Jilin populations appear to have come from Shandong, whereas, the Ningxia population is more closely associated with Qinghai. However, it is not clear which population represents the primary introduction. Further, an association between a single population pair (the LN population from Liaoning and YN population from Yunnan) was observed, which can be explained by long distance transport of infested plant materials.
The significant deviation from Hardy-Weinberg equilibrium (HWE) could have arisen from inbreeding, subpopulation structure, and/or null alleles. Null alleles can be ruled out as an explanation in this study. Our study revealed that only two of the seven loci had low frequencies of the null alleles and the estimated null allele frequency ranged from 0.09 to 0.19 among all populations. Dakin and Avise [36] concluded that when the null alleles frequencies are less than 0.2, their presence causes a slight underestimate of the average exclusion probability at a locus. Thus, the null allele in our study is unlikely to appreciably influence Hardy-Weinberg equilibrium. The test for deviation from mutation-drift equilibrium suggested that bottleneck effects did not contribute importantly during the genetic differentiation of T. vaporariorum in China. This is based on the observation that only 6 of the 17 populations exhibited significant heterozygosity excess, the signature of a bottleneck (under the IAM model), further because heterozygosity excess was not predicted under either the TPM or SMM models.
Overall, the genetic diversity and the distinct genetic structure revealed by the cluster analysis suggest the likelihood of multiple introductions into China since the initial introduction of this exotic species 60 years ago.

3. Experimental Section

3.1. Field Sampling

Adult T. vaporariorum were collected from cucumber, eggplant, and kidney bean plants in nine provinces throughout China during 2011–2012 (Figure 4). The sampling locations are shown in Figure 4. At least 100 adult whitefly specimens were collected from whitefly-colonized plants at each location. A total of 413 individuals from 17 populations (average sample size of 24 individuals ranging from 12 to 27 per population) were genotyped. The host plants and sample sizes per location are listed in Table 1. The whitefly specimens were stored in 95% ethanol at −20 °C until the DNA was extracted.
Figure 4. The geographical distribution of the populations and the genetic structure of the Trialeurodes vaporariorum revealed by STRUCTURE analysis (Figure 3a). The codes are listed in Table 1. QH1, QH2, and QH3 represent three populations from Qinghai. GS1 and GS2 represent two populations from Gansu. YN1, YN2, and YN3 represent three populations from Yunnan. GZ1 and GZ2 represent two populations from Guizhou. JL1, JL2 and JL3 represent three populations from Jilin. NX, SX, SD, and LN represent the population from Ningxia, Shanxi, Shandong, and Liaoning, respectively.
Ijms 15 13514 g004

3.2. DNA Extraction and Microsatellite Genotyping

Genomic DNA was extracted from each individual adult T. vaporariorum using the DNAzol kit (Molecular Research Center, Inc., Cincinnati, OH, USA), and stored at −20 °C. The T. vaporariorum-specific primers (the forward primer CO1-F: 5'-GCCTGGTTTTGGCATTA-3', and the reverse primer CO1-R: 5'-GCTTATTTAGCACCCACTCTA-3') were used to amplify the mitochondrial cytochrome oxidase I gene fragment (752 bp in size) to determine the identity of each whitefly individual (patent number is CN201310192726.5), resulting in the confirmation of 413 individuals as the whitefly T. vaporariorum. The PCR reactions were performed in 20 μL buffer containing 2 μL 10× buffer, 1.5 mM MgCl2, 0.2 μM dNTPs, 1 unit Taq DNA polymerase, 2 μL template DNA and 0.2 μM of each primer. PCR amplification was carried out as follows: initial denaturation at 94 °C for 5 min, followed by 35 cycles of 30 s at 94 °C, 30 s at 50 °C, and 60 s at 72 °C, and a final elongation step at 72 °C for 30 min.
Seven pairs of microsatellite primers (code: Tvap-1-2, Tvap-2-2C, Tvap-3-3, Tvap-3-2, Tvap-1-1C, Tvap-1-3, and Tvap-1-4) were used to amplify the microsatellite loci using T. vaporariorum DNA as the template [37]. The primers and the annealing temperature were described in Table 4. The PCR reactions were performed in 20 μL buffer containing 2 μL 10× buffer, 1.5 mM MgCl2, 0.2 μM dNTPs, 1 unit Taq DNA polymerase, 2 μL template DNA and 0.2 μM of each primer. PCR amplification was carried out as follows: initial denaturation at 94 °C for 4 min, followed by 35 cycles of 30 s at 94 °C, 90 s at the primer-specific annealing temperature (Table 4) and 60 s at 72 °C, and a final elongation step at 72 °C for 30 min. The PCR products were run on an ABI 3730xl DNA analyzer (Sangon, Shanghai, China) and the allele size was determined by comparing the mobility of the PCR products to the GeneScan™ 400HD size standard using GeneMapper software version 3.2 (Applied Biosystems, Shanghai, China).
Table 4. The seven pairs of microsatellite primers used in this study (as previously described in Ovcarenko et al. [37]).
CodeGenBank NumberPrimer (5'–3')Annealing Temperature (°C)Range (bp)
Tvap-1-2GF112025PrimerA: CTGTGAATCCCTCAGAAATC
PrimerB: TGACCTCTCTCAGGCTTTTA
57180–238
Tvap-2-2CGF112021PrimerA: CTGAAAGTCTTATTAGAGCC
PrimerB: CTAACTGATTCCATAGTCG
55150–220
Tvap-3-3GF112019PrimerA: CGCAAATCATACTTCCTTTC
PrimerB: AAATACAGGCGACTCATGTC
55222–238
Tvap-3-2GF112017PrimerA: GGAGGTCATTACTCATTTCG
PrimerB: CATAAATTTTCGGCTCACTC
55176–184
Tvap-1-1CGF112015PrimerA: GAGACTCCACGATGTCTGTC
PrimerB: TTCCCCTATCGTATGTTCAC
57193–233
Tvap-1-3GF112026PrimerA: TATAGGGGTGTTGTGGTGTT
PrimerB: CGCTACCAAATCGTAATTAC
55147–197
Tvap-1-4GF112020PrimerA: GATTTAGCCCAGTTCATTTG
PrimerB: CTTCAGTTGAGCTGCTGATG
55218–268

3.3. Analyses of Genetic Diversity

For each of the 17 populations of T. vaporariorum, the average number of alleles per locus (Na), the effective number of alleles (Ne), the observed heterozygosity (Ho), the expected heterozygosity (He), and Nei’s expected heterozygosity (Nei) were calculated using POPGENE v.1.31 [38]. The program FSTAT 2.9.3.2 was used to calculate allelic richness (Ar) [39].

3.4. Analyses of Genetic Structure within Populations

The Weir and Cockerham’s Fis [40] within each population was quantified with GENEPOP v.3.4 software [41]. Conformity to Hardy-Weinberg equilibrium was assessed with exact tests in GENEPOP v.3.4 with Markov chain parameters of 10,000 de-memorization steps, 1000 batches and 10,000 iterations per batch. To correct for multiple comparisons, a sequential Bonferroni correction was applied to both HWE tests. When deviation from HWE was detected, the presence of null alleles or/and scoring errors was estimated using MICRO-CHECKER [26].
Deviation of the mutation-drift equilibrium in the populations was tested using the approach in BOTTLENECK software [25]. The heterozygosity deficit is used to test for population expansion, whereas the heterozygosity excess test is used to provide evidence of a genetic bottleneck. Using the Wilcoxon test, the heterozygosity deficit was evaluated under the two-phase mutation model (TPM) recommended for microsatellite data [42]. The possibility of bottleneck events within the 17 populations was examined under three mutation models (Two Phase Mutation Model (TPM), Infinite Allele Model (IAM), and Stepwise Mutation Model (SMM)) [25,42]. The TPM model was used with the default settings of 30% variation from the IAM model, and 70% from the SMM model.

3.5. Analyses of Genetic Structure among Populations

The traditional population differentiation approach was based on Fst values. The Weir and Cockerham’s estimator of the fixation index Fst [40] was calculated using GENEPOP v.3.4 [41]. The correlation between genetic differentiation and geographic distance was examined by Mantel test using IBDWS v.3.15 [43].The distribution of genetic variation was investigated by performing an analysis of molecular variance (AMOVA) using ARLEQUIN v.3.5 [44], and by calculating allelic diversity, heterozygosity, and pairwise values of Fst among 17 populations. The genetic clustering of samples was examined using STRUCTURE v.2.3.2 and BAPS v.4.14 [27,28,29]. Population structure analyzed using STRUCTURE v.2.3.2 employed the Bayesian clustering approach with a burn-in period of 50,000 iterations and one million Markov chain Monte Carlo (MCMC) repetitions under the admixture ancestry model. 20 independent runs were performed for each testing K value, ranging from K = 1 to 17, and ΔK was used to calculate the optimal number of genetic clusters (K) [45]. When estimating individual ancestry coefficients using BAPS v.4.14 [28,29], we used the recommended values that 100 iterations to estimate the admixture coefficients individual, 20 iterations to estimate the admixture coefficients for the reference individuals and 200 reference individuals from each population.

4. Conclusions

These results demonstrate that populations of T. vaporariorum in China exhibit significant genetic differentiation, indicating the likelihood that multiple introductions of T. vaporariorum into China have occurred. Also, the populations collected from the provinces of Jilin, Ningxia, Guizhou and Qinghai appear to represent secondary introductions originating from other Chinese provinces.

Acknowledgments

We thank all the sample providers. This research was supported by the National Science and Technology Support Program (2012BAD19B06), the Science and Technology Development Planning Program of Qingdao (13-1-3-108-nsh), the Shandong Modern Agricultural Technology & Industry System (SDAIT-02-021-11), and the Taishan Mountain Scholar Constructive Engineering Foundation of Shandong.

Author Contributions

Conceived and designed the experiments: D.C. and Y.-J.Z. Performed the experiments: R.-R.G., H.-T.W. and H.-P.P. Analyzed the data: H.-P.P., R.-M.Z., H.-X.Z. and D.C. Wrote the paper: W.-P.Z., D.C., J.K.B. and Y.-J.Z.

Conflicts of Interest

The authors declare no conflict of interest.

References

  1. López, Y.I.A.; Martínez-Gallardo, N.A.; Ramírez-Romero, R.; López, M.G.; Sánchez-Hernández, C. Cross-kingdom effects of plant-plant signaling via volatile organic compounds emitted by tomato (Solanum lycopersicum) plants infested by the greenhouse whitefly (Trialeurodes vaporariorum). J. Chem. Phys. 2012, 38, 1376–1386. [Google Scholar]
  2. Simmonds, M.S.J.; Manlove, J.D.; Blaney, W.M.; Khambay, B.P.S. Effects of selected botanical insecticides on the behaviour and mortality of the glasshouse whitefly Trialeurodes. vaporariorum and the parasitoid Encarsia formosa. Entomol. Exp. Appl. 2002, 102, 39–47. [Google Scholar]
  3. De Vis, R.M.J.; Fuentes, L.E.; van Lenteren, J.C. Life history of Amitus fuscipennis (Hym., Platygastridae) as parasitoid of the greenhouse whitefly Trialeurodes vaporariorum (Hom., Aleyrodidae) on tomato as function of temperature. J. Appl. Entomol. 2002, 126, 24–33. [Google Scholar] [CrossRef]
  4. Bouhous, M.; Larous, L. Efficiency of the entomopathogenic fungus Verticillium. lecanii in the biological control of Trialeurodes vaporariorum, (Homoptera: Aleyrodidae), a greenhouse culture pest. Afr. J. Microbiol. Res. 2012, 6, 2435–2442. [Google Scholar]
  5. Puthoff, D.P.; Holzer, F.M.; Perring, T.M.; Walling, L.L. Tomato pathogenesis-related protein genes are expressed in response to Trialeurodes vaporariorum and Bemisia. tabaci biotype B feeding. J. Chem. Ecol. 2010, 36, 1271–1285. [Google Scholar]
  6. Lourenção, A.L.; Alves, A.C.; Fugi, C.G.; Matos, E.S. Outbreaks of Trialeurodes vaporariorum (West.) (Hemiptera: Aleyrodidae) under field conditions in the State of São Paulo, Brazil. Neotrop. Entomol. 2008, 37, 89–91. [Google Scholar] [CrossRef]
  7. Russell, L.M. Hosts and distribution of five species of Trialeurodes. (Homoptera: Aleyrodidae). Ann. Entomol. Soc. Am. 1963, 56, 149–153. [Google Scholar]
  8. Landa, Z.; Osborne, L.; Lopez, F.; Eyal, J. A bioassay for determining pathogenicity of entomogenous fungi on whiteflies. Biol. Control. 1994, 4, 341–350. [Google Scholar] [CrossRef]
  9. Duffus, J.E.; Johnstone, G.R. Beet pseudo-yellows virus in Tasmania: The first report of a whitefly transmitted virus in Australiasia. Aust. Plant. Path. 1981, 10, 68–69. [Google Scholar] [CrossRef]
  10. Yamashita, S.; Doi, Y.; Yora, K.; Yoshino, M. Cucumber yellows virus: Its transmission by the greenhouse whitefly, Trialeurodes vaporariorum (Westwood), and the yellowing disease of cucumber and muskmelon caused by the virus. Ann. Phytopath. Soc. Jpn. 1979, 45, 484–496. [Google Scholar] [CrossRef]
  11. Coffin, R.S.; Coutts, R.H.A. The occurrence of beet pseudo yellows virus in England. Plant Pathol. 1990, 39, 632–635. [Google Scholar] [CrossRef]
  12. Jones, D.R. Plant viruses transmitted by whiteflies. Eur. J. Plant Pathol. 2003, 109, 195–219. [Google Scholar] [CrossRef]
  13. Helgesen, R.G.; Tauber, M.J. Biological control of greenhouse whitefly, Trialeurodes vaporariorum (Aleyrodidae: Homoptera), on short-term crops by manipulating biotic and abiotic factors. Can. Entomol. 1974, 106, 1175–1188. [Google Scholar] [CrossRef]
  14. Xiang, Y.Y.; Li, Z.Z.; Zhang, F.; Luo, C. Progress of study on Bemisia tabaci (Gennadius) and Trialeurodes vaprorariorum (Westwood). J. Mt. Agric. Biol. 2004, 23, 352–359. [Google Scholar]
  15. Zhang, Z.L.; Chen, W.L.; Wang, J. Preliminary observation and control of the greenhouse whitefly, Trialeurodes. vaporariorum in the suburban regions of Beijing. Entomol. Knowl. 1980, 17, 158–160. [Google Scholar]
  16. Chu, D.; Gao, C.S.; de Barro, P.; Zhang, Y.J.; Wan, F.H. Investigation of the genetic diversity of an invasive whitefly (Bemisia tabaci) in China using both mitochondrial and nuclear DNA markers. Bull. Entomol. Res. 2011, 101, 467–475. [Google Scholar] [CrossRef]
  17. Men, Q.L.; Chen, M.H.; Zhang, Y.L.; Feng, J.N. Genetic structure and diversity of a newly invasive species, the codling moth, Cydia pomonella (L.) (Lepidoptera: Tortricidae) in China. Biol. Invasions 2012, 15, 447–458. [Google Scholar]
  18. Chu, D.; Pan, H.P.; Li, X.C.; Guo, D.; Tao, Y.L.; Liu, B.M.; Zhang, Y.J. Spatial genetic heterogeneity in populations of a newly invasive whitefly in China revealed by a nation-wide field survey. PLoS One 2013, 8, e79997. [Google Scholar]
  19. Yang, X.M.; Sun, J.T.; Xue, X.F.; Li, J.B.; Hong, X.Y. Invasion genetics of the western flower thrips in China: Evidence for genetic bottleneck, hybridization and bridgehead effect. PLoS One 2012, 7, e34567. [Google Scholar]
  20. Sakai, A.K.; Allendorf, F.W.; Holt, J.S.; Lodge, D.M.; Molofsky, J. The population biology of invasive species. Annu. Rev. Ecol. Syst. 2001, 32, 305–332. [Google Scholar] [CrossRef]
  21. Kirk, H.; Dorn, S.; Mazzi, D. Molecular genetics and genomics generate new insights into invertebrate pest invasions. Evol. Appl. 2013, 6, 842–856. [Google Scholar] [CrossRef]
  22. Selkoe, K.A.; Toonen, R.J. Microsatellites for ecologists: A practical guide to using and evaluating microsatellite markers. Ecol. Lett. 2006, 9, 615–629. [Google Scholar] [CrossRef]
  23. Teng, Z.Q.; Kang, L. Microsatellites reveal the genetic structure of thelytokous strains of the migratory locust. Insect Sci. 2007, 14, 193–199. [Google Scholar] [CrossRef]
  24. Sun, J.T.; Lian, C.L.; Navajas, M.; Hong, X.Y. Microsatellites reveal a strong subdivision of genetic structure in Chinese populations of the mite Tetranychus urticae Koch (Acari: Tetranychidae). BMC Med. Genet. 2012, 13. [Google Scholar] [CrossRef]
  25. Cornuet, J.M.; Luikart, G. Description and power analysis of two tests for detecting recent population bottlenecks from allele frequency data. Genetics 1996, 144, 2001–2014. [Google Scholar]
  26. Van, O.C.; Hutchinson, W.F.; Wills, D.; Shipley, P. MICRO-CHECKER: Software for identifying and correcting genotyping errors in microsatellite data. Mol. Ecol. Notes 2004, 4, 535–553. [Google Scholar] [CrossRef]
  27. Pritchard, J.K.; Stephens, M.; Donnelly, P. Inference of population structure using multilocus genotype data. Genetics 2000, 155, 945–959. [Google Scholar]
  28. Corander, J.; Waldmann, P.; Sillanpaa, M.J. Bayesian analysis of genetic differentiation between populations. Genetics 2003, 163, 367–374. [Google Scholar]
  29. Corander, J.; Sirén, J.; Arjas, E. Bayesian spatial modeling of genetic population structure. Comput. Stat. 2008, 23, 111–129. [Google Scholar] [CrossRef]
  30. Sanz, N.; Araguas, R.M.; Vidal, O.; Diez-del-Molino, D.; Fernández-Cebrián, R.; García-Marín, J.L. Genetic characterization of the invasive mosquitofish (Gambusia spp.) introduced to Europe: Population structure and colonization routes. Biol. Invasions 2013, 15, 2333–2346. [Google Scholar] [CrossRef]
  31. Ghabooli, S.; Shiganova, T.A.; Zhan, A.; Cristescu, M.E.; Eghtesadi-Araghi, P.; MacIsaac, H.J. Multiple introductions and invasion pathways for the invasive ctenophore Mnemiopsis leidyi in Eurasia. Biol. Invasions 2011, 13, 679–690. [Google Scholar] [CrossRef]
  32. Cabezas, M.P.; Xavier, R.; Branco, M.; Santos, A.M.; Guerra-García, J.M. Invasion history of Caprella scaura Templeton, 1836 (Amphipoda: Caprellidae) in the Iberian Peninsula: Multiple introductions revealed by mitochondrial sequence data. Biol. Invasions 2014. [Google Scholar] [CrossRef]
  33. Reem, E.; Douek, J.; Katzir, G.; Rinkevich, B. Long-term population genetic structure of an invasive urochordate: The ascidian Botryllus schlosseri. Biol. Invasions 2013, 15, 225–241. [Google Scholar] [CrossRef]
  34. Roman, J.; Darling, J.A. Paradox lost: Genetic diversity and the success of aquatic invasions. Trends Ecol. Evol. 2007, 22, 454–464. [Google Scholar] [CrossRef]
  35. Suarez, A.V.; Tsutsui, N.D. The evolutionary consequences of biological invasions. Mol. Ecol. 2008, 17, 351–360. [Google Scholar] [CrossRef]
  36. Dakin, E.E.; Avise, J.C. Microsatellite null alleles in parentage analysis. Heredity 2004, 93, 504–509. [Google Scholar] [CrossRef]
  37. Ovcarenko, I.; Clouet, C.; Knott, K.; Tsagkarakou, A.; Gauthier, N. Thirteen polymorphic microsatellite loci and PCR multiplexing in the greenhouse whitefly, Trialeurodes vaporariorum Westwood (Homoptera: Aleyrodidae). Mol. Ecol. Res. 2013, 13, 341–343. [Google Scholar] [CrossRef] [Green Version]
  38. POPGENE, version 1.31. The User-Friendly Shareware for Population Genetic Analysis; Molecular Biology and Biotechnology Centre, University of Alberta: Edmonton, AB, Canada, 1997.
  39. Franks, S.J.; Pratt, P.D.; Tsutsui, N.D. The genetic consequences of a demographic bottleneck in an introduced biological control insect. Conserv. Genet. 2010, 12, 201–211. [Google Scholar] [CrossRef]
  40. Weir, B.S.; Cockerham, C.C. Estimating F-statistics for the analysis of population structure. Evolution 1984, 38, 1358–1370. [Google Scholar] [CrossRef]
  41. Raymond, M.; Rousset, F. GENEPOP (version 1.2): Population genetics software for exact tests and ecumenicism. J. Hered. 1955, 86, 248–249. [Google Scholar]
  42. Di Rienzo, A.; Peterson, A.C.; Garcza, J.C.; Valdes, A.M.; Slatkin, M. Mutational processes of simple sequence repeat loci in human populations. Proc. Natl. Acad. Sci. USA 1994, 91, 3166–3170. [Google Scholar] [CrossRef]
  43. Jensen, J.L.; Bohonak, A.J.; Kelley, S.T. Isolation by distance web service. BMC Genet. 2005, 6. [Google Scholar] [CrossRef]
  44. Excoffier, L.; Lischer, H.E.L. Arlequin suite ver 3.5: A new series of programs to perform population genetics analyses under Linux and Windows. Mol. Ecol. Res. 2010, 10, 564–567. [Google Scholar] [CrossRef]
  45. Evanno, G.; Regnaut, S.; Goudet, J. Detecting the number of clusters of individuals using the software structure: Asimulation study. Mol. Ecol. Notes 2005, 14, 2611–2620. [Google Scholar] [CrossRef]

