Article

Heterosis in Early Maize Ear Inflorescence Development: A Genome-Wide Transcription Analysis for Two Maize Inbred Lines and Their Hybrid

1
Maize Research Institute of Sichuan Agricultural University/Key Laboratory of Biology and Genetic Improvement of Maize in Southwest Region, Ministry of Agriculture, Chengdu 611130, China
2
Zunyi Academy of Agricultural Sciences, Zunyi 563102, China
3
Life Science College, Sichuan Agricultural University, Ya'an 625014, China
4
Department of Agronomy, Iowa State University, Ames, IA 50011, USA
*
Author to whom correspondence should be addressed.
These authors contributed equally to this work.
Int. J. Mol. Sci. 2014, 15(8), 13892-13915; https://doi.org/10.3390/ijms150813892
Submission received: 10 May 2014 / Revised: 1 July 2014 / Accepted: 2 July 2014 / Published: 11 August 2014
(This article belongs to the Section Biochemistry)

Abstract

:
Heterosis, or hybrid vigor, contributes to superior agronomic performance of hybrids compared to their inbred parents. Despite its importance, little is known about the genetic and molecular basis of heterosis. Early maize ear inflorescences formation affects grain yield, and are thus an excellent model for molecular mechanisms involved in heterosis. To determine the parental contributions and their regulation during maize ear-development-genesis, we analyzed genome-wide digital gene expression profiles in two maize elite inbred lines (B73 and Mo17) and their F1 hybrid using deep sequencing technology. Our analysis revealed 17,128 genes expressed in these three genotypes and 22,789 genes expressed collectively in the present study. Approximately 38% of the genes were differentially expressed in early maize ear inflorescences from heterotic cross, including many transcription factor genes and some presence/absence variations (PAVs) genes, and exhibited multiple modes of gene action. These different genes showing differential expression patterns were mainly enriched in five cellular component categories (organelle, cell, cell part, organelle part and macromolecular complex), five molecular function categories (structural molecule activity, binding, transporter activity, nucleic acid binding transcription factor activity and catalytic activity), and eight biological process categories (cellular process, metabolic process, biological regulation, regulation of biological process, establishment of localization, cellular component organization or biogenesis, response to stimulus and localization). Additionally, a significant number of genes were expressed in only one inbred line or absent in both inbred lines. Comparison of the differences of modes of gene action between previous studies and the present study revealed only a small number of different genes had the same modes of gene action in both maize seedlings and ear inflorescences. This might be an indication that in different tissues or developmental stages, different global expression patterns prevail, which might nevertheless be related to heterosis. Our results support the hypotheses that multiple molecular mechanisms (dominance and overdominance modes) contribute to heterosis.

1. Introduction

Heterosis, or hybrid vigor, refers to the phenomenon in which progeny of two inbred lines (hybrids) exhibit enhanced agronomic performance such as biomass production, growth rate, fertility, and disease resistance relative to both parents [1]. Heterosis has been extensively used in agriculture, especially in the breeding of maize and rice. For example, it is estimated that approximately 95% of the United States maize acreage and 55% of rice acreage in China are planted with hybrids. Furthermore, hybrid maize technology for large-scale production has a yield advantage of 15% over the elite inbred varieties. Though the concept of heterosis has been introduced over 100 years ago and different genetic models considered [1,2,3], the genetic and molecular basis of heterosis remains elusive.
Three classical genetic hypotheses to explain heterosis have been proposed: the dominance, overdominance, and epistasis hypotheses. The dominance hypothesis states that deleterious recessive alleles cause inbreeding depression. A cross of two inbred parents will benefit from complementation of these deleterious alleles and will display a superior phenotype [2,3,4]. The over-dominance hypothesis refers to allelic interactions at one or multiple heterozygous genes resulting in superior trait expression compared to the better parent [1,5]. Both hypotheses may be insufficient to explain the molecular mechanism for heterosis [6]. Epistasis hypothesis refers to interactions of alleles at different loci from two parents in F1 hybrids, leading to heterosis [7,8].
Recently, genetic and molecular studies provided experimental support for above-mentioned hypotheses. Using molecular markers in segregating populations, quantitative trait locus (QTL) mapping studies provided support for the dominance [9], over-dominance [10], and epistasis [7,8] models. With the advent of genomic methods to assay genome-wide patterns of gene expression, recent studies indifferent tissues and developmental stages of model and crop plants (such as maize, rice, wheat, Populus, and Arabidopsis) have determined the roles of different gene expression [11,12,13,14,15,16,17,18,19,20,21,22,23,24,25,26,27,28,29,30,31,32], small RNAs [33,34,35,36], and epigenetic regulation [37,38], including circadian-mediated metabolic pathways [39], in heterosis. For instance, additive gene expression was prevalent in some studies of maize [14,26,32], and there were varying numbers of genes that exhibited a non-additive behavior in other studies [12,17,18,19,20,21,22,23,24,25,26,27,29,30,35].
Maize immature ear inflorescences show heterosis in ear architectural traits [40], and significant positive correlations between grain yield and ear architectural traits, such as ear length, kernel row number, number of kernels per row, kernel number density, and cob diameter have been reported [40], which suggests that each of these components contributes to greater yields. A thorough knowledge of the genes affecting the various components and their interactions will facilitate our understanding of the molecular basis of heterosis of grain yield. In this study, we applied a highly effective approach of high throughout deep sequencing to identify genes, which are highly expressed in maize elite inbred lines of B73 and Mo17, and their F1 hybrid (B73 × Mo17) at an early stage of ear inflorescences development. We provide first molecular evidence that regulatory mechanisms underlying the phenomenon of heterosis are very early active in maize ear development. Furthermore, we also found that differentially expressed genes between hybrids and their parents can be involved in certain regulatory networks, which suggested that complicated gene networks might be underlying heterosis. Results of the present study might help promote further understanding of mechanisms underlying heterosis.

2. Results

2.1. Statistics and Analysis of Library Sequencing

Here, we sequenced three ear digital gene expression (DGE) libraries from two inbred parents (B73 and Mo17) and their F1 hybrid (B73 × Mo17) using massively parallel sequencing on the Illumina platform at BGI-Shenzhen, China (Table 1 and Table S1). A total of approximately 4.2 million raw tags per library with 259,890 distinct tag sequences were identified. After data-processing steps (see Materials and Methods), the total number of filtered, high-quality clean tags was almost the same in three libraries. Furthermore, the F1 library had the highest number of distinct tags (259,282), followed by the B73 (242,184), and Mo17 (239,963) libraries (Table 1 and Table S1). These distinct tags and their genomic frequency as well as the raw data were deposited in NCBI Sequence Read Archive (SRA) database with the accession number (PRJNA248701). Copy numbers of most of the distinct tags (over 77%) ranged from 1–5. However, a small number of distinct tags (less than 3.29%) with a frequency higher than 100 make up over 62% of all clean tags in all three libraries (Figure S1).
When sequencing depths reach 1 million total tags, the number of novel distinct tags discovered dropped dramatically in all three libraries (Figure S2A). From that point, increasing sequence depth results in a slow and stable accumulation of new distinct tags indicating that sequencing has reached saturation. Moreover, as shown in Figure 2B, when the total tag number in B73 reached 1 million, the increase of identified genes started to level out, and stabilized when the number of tags reached 3 million. Next, the level of gene expression was determined by calculating the number of unambiguous clean tags for each gene and then normalized to the number of transcripts per million tags (TPM). The Mo17 and F1 data showed a similar trend (Figure S2). This suggests that only few more distinct genes would be identified when the total clean tag number reached a certain value.
Table 1. Summary statistics from mapping digital gene expression (DGE) sequencetags to the maize B73 reference genome.
ClassSummaryF1B73Mo17
Raw DataTotal4,200,0004,200,0004,200,000
Distinct Tags272,402254,882252,386
Clean TagsTotal number4,176,6224,176,8254,176,752
Distinct Tags number259,282242,184239,963
All Tags Mapping to GenomeTotal number2,766,6852,979,6153,127,520
Total % of clean tags66.24%71.34%74.88%
Distinct Tags number134,449134,378141,476
Distinct Tags % of clean tags51.85%55.49%58.96%
Unambiguous Tags Mapping to GenomeTotal number2,452,2932,637,4192,804,389
Total % of clean tags58.71%63.14%67.14%
Distinct Tags number119,316118,719125,467
Distinct Tags % of clean tags46.02%49.02%52.29%
All Tags Mapping to GenesNumber24,62924,07824,198
% of ref. genes75.69%74%74.36%
Unambiguous Tags Mapping to GenesNumber21,37220,78420,938
% of ref. genes65.68%63.87%64.35%
Unknown TagsTotal number894,503721,786561,476
Total % of clean tags21.42%17.28%13.44%
Distinct Tags number85,15270,70061,016
Distinct Tags % of clean tags32.84%29.19%25.43%

2.2. Mapping Tags to the Maize Reference Genome

We used SOAP2 software [41] to map all distinct tags to the maize reference genome (B73 RefGen_v2) [42]. Mapping results showed that 51.85%, 55.49% and 58.96%, respectively, of distinct clean tags mapped to the reference database (sense or anti-sense), and 46.02%, 49.02%, and 52.29%, respectively, of the distinct clean tags mapped unambiguously to the reference genes (Table 1 and Table S1). Out these, we identified 20,784–21,372 genes expressed in the three genotype comparison (Table S2), our analysis revealed 17,128 genes expressed in all samples and 22,789 genes expressed collectively in the present study (Table S3). In total, 32.84%, 29.19%, and 25.43% of all distinct clean tags for F1, B73, and Mo17 data sets, respectively, did not map to the reference maize genome sequence or associated transcripts (Table 1 and Table S1). These non-mapped tags most likely represent regions where the maize reference sequence is incomplete [43] or there are differential mRNA processing events for most maize genes, such as alternative splicing [44]. Only 0.03% of non-mapped tags matched maize chloroplast or mitochondrial genome sequences (Table S1). Because Solexa sequencing can distinguish transcripts originating from both DNA strands, we found evidence for bidirectional transcription in 14,012–14,420 of all detectable overlapping genes and 1031–1119 antisense-stand specific transcripts based on the strand-specific nature of the sequenced tags (Table S2). By comparison, the ratio of sense to antisense strand of the transcripts was approximately 1.3:1 for all libraries. As summarized in Figure S3 and Table S3, most expressed genes (approx. 19,965) are represented in fewer than one hundred copies and only a small proportion of genes are highly expressed (Table S3). We map the clean tags, which cannot be mapped to mRNA, mitochondria and chloroplasts, to the whole genome, providing start positions that could be uniquely mapped by those tags (Table S4).

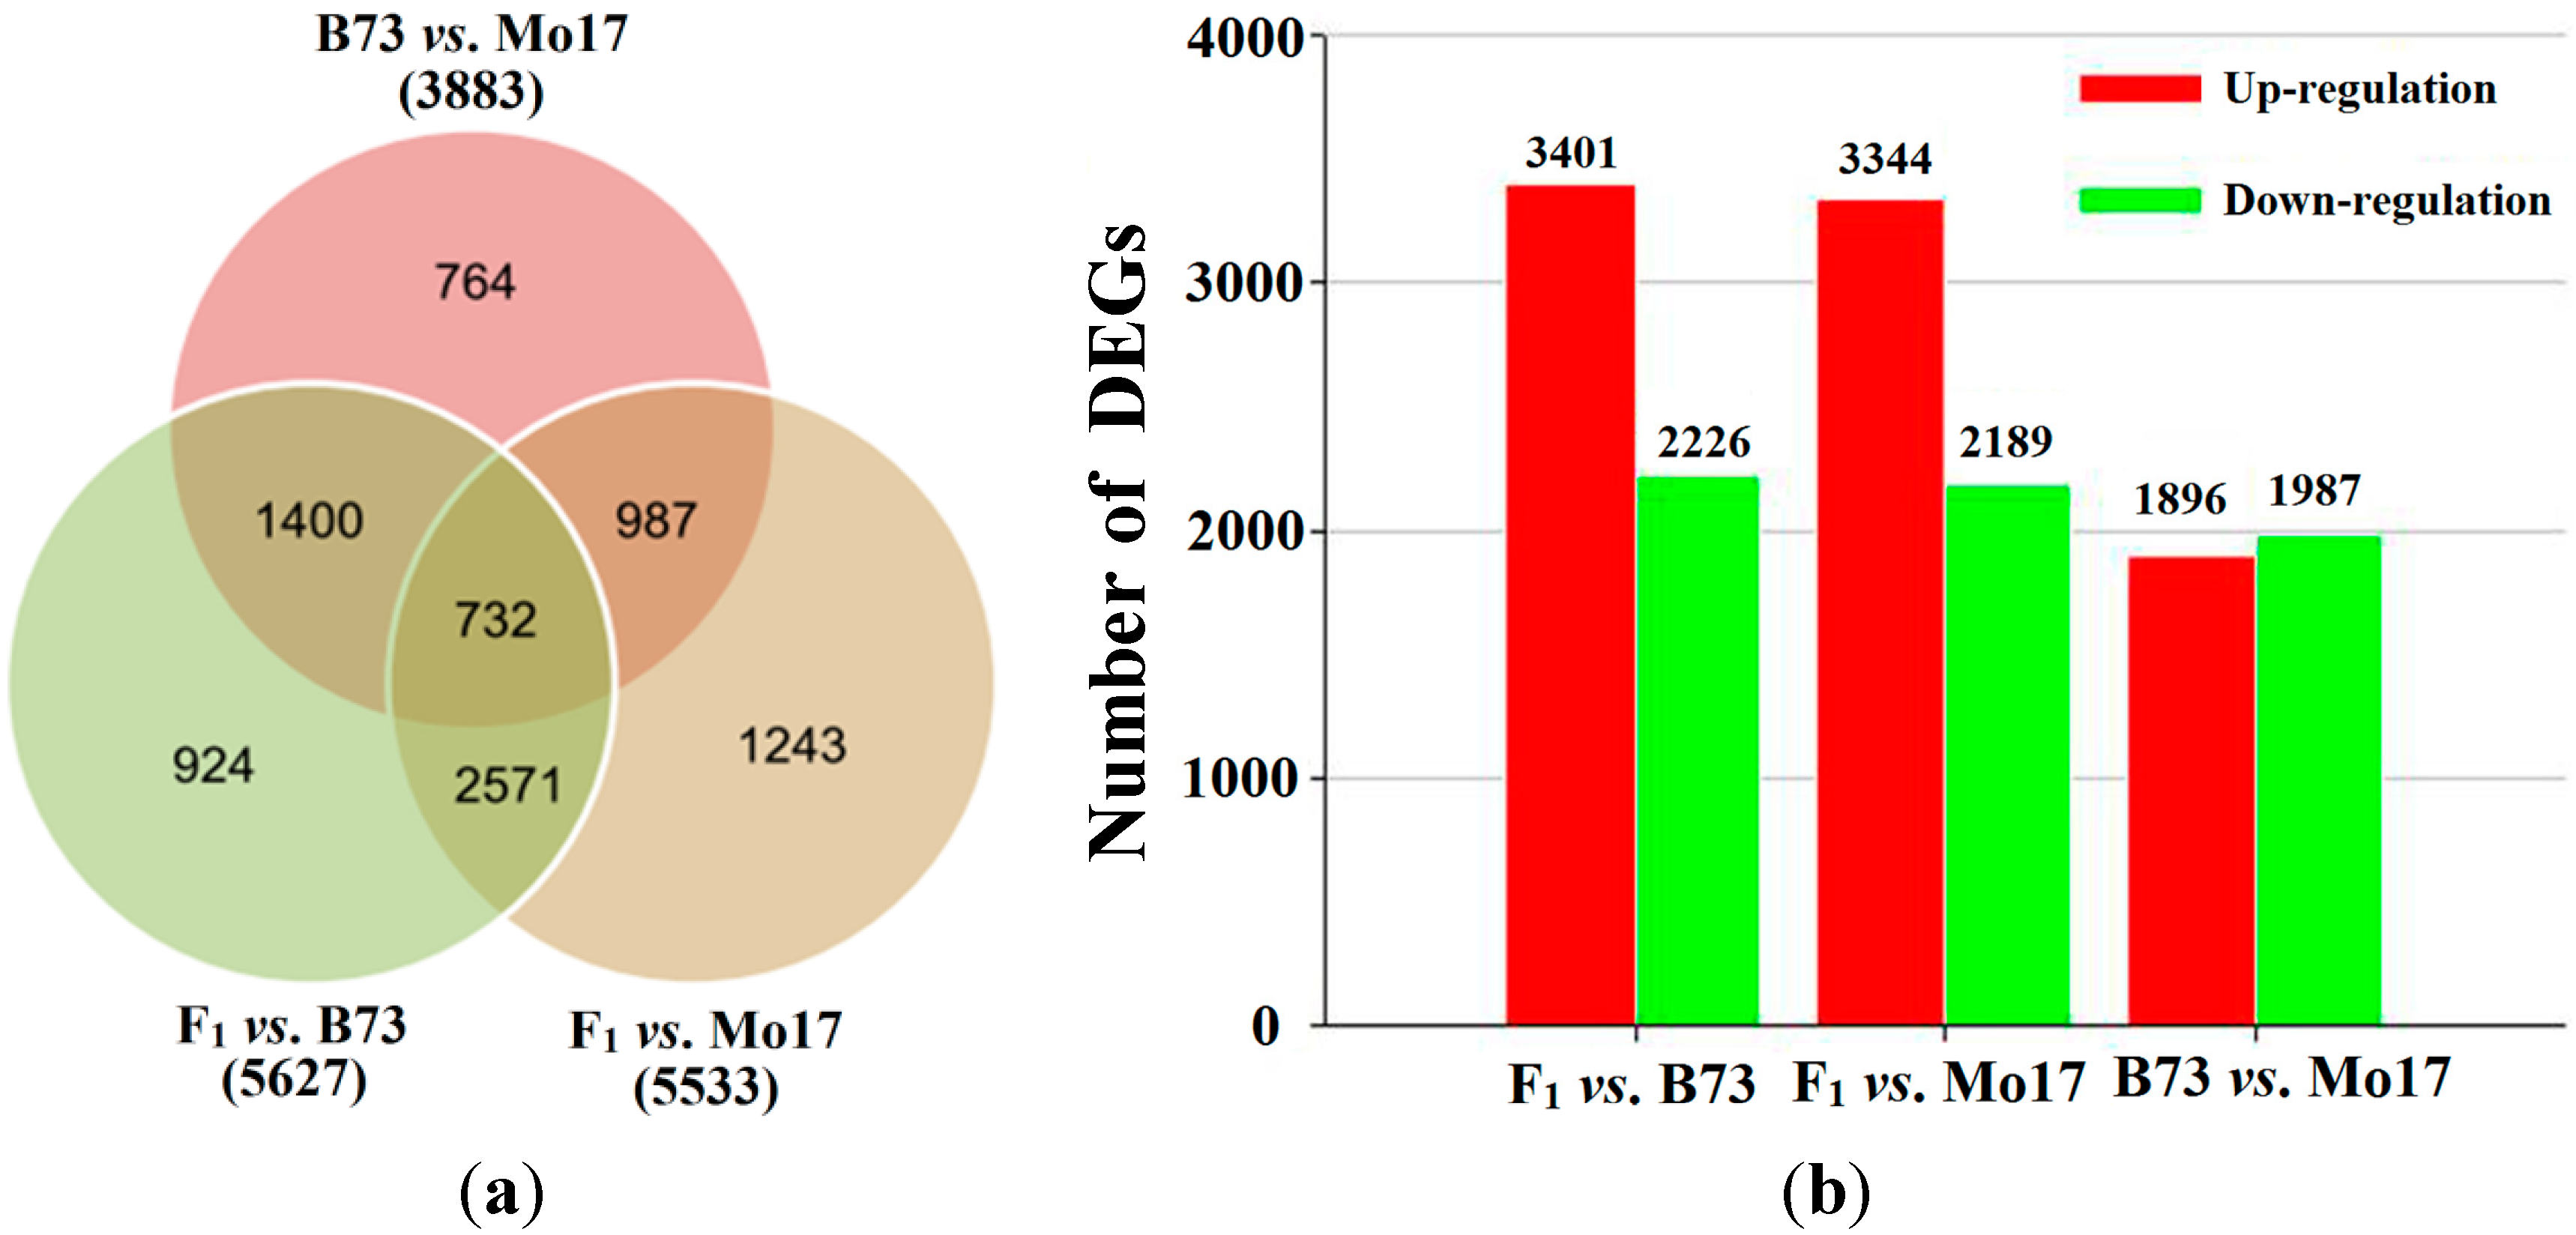
2.3. Different Gene Expression Analysis

A total of 32,973 significantly changed tags entities were detected among three genotypes (see Materials and Methods) (Figure S4A,C,E and Table S5). Then, the processed DGE data were used to determine different gene expression between inbred parents or between parental lines and their F1 hybrid and we identified 8621 out of 22,789 genes that were differentially expressed among B73, Mo17, and their hybrid, representing 38% of the ear digital gene expression (Figure 1A). Among them, 3401 (3344) and 2226 (2189) genes were significantly up-regulated and down-regulated, respectively, in the F1 compared to B73/Mo17 (Figure 1B, Figure S4B,D and Table S6). The comparison between parental line libraries also revealed significant variation in expression. A total of 3883 genes, including 1896 up-regulated and 1987 down-regulated genes, were identified in B73 compared to Mo17 (Figure 1B, Figure S4F and Table S6).
Figure 1. Differentially expressed genes in the maize heterotic cross. Venn diagram (a) and statistical analysis (b) of differentially expressed genes among inbred parents and their F1 hybrid.
Ijms 15 13892 g001
We further investigated the mode of gene action for these different genes (Table S6). 8.9% (767 of 8621) exhibited an expression pattern that was not distinguishable from additivity, while the other 91.1% (7854 of 8621) genes showed non-additive expression patterns (Figure 2A). The non-additive differentially expressed genes from the cross were further classified into four distinct classes: high-parent dominance (1984), low-parent dominance (2559), over-dominance (1085), and under-dominance (1963) (Figure 2B and Table 2). A sample of 30 differentially expressed genes was randomly selected for validation by qRT-PCR. The trends in the expression of these genes detected by DGE were consistent (29 genes) or partially (1 gene) consistent with those determined in qRT-PCR analyses (Figure 3). These findings are consistent with a recent study in maize [31] or rice [16] that supports the involvement of multiple modes (dominance and overdominance) of gene action in association with heterosis.
Figure 2. Functional categories of differentially expressed genes. Overall differentially expressed genes (a) and non-additive expressed genes (b) from B73 × Mo17 cross.
Ijms 15 13892 g002
Table 2. Statistical analysis of differentially expressed genes (FDR ≤ 0.001 and absolute value of log2Ratio ≥ 1).
Hybrid CrossB73 × Mo17
Total8621
Additivity767
Non Additivity7854
High-Parent Dominance1984
Low-Parent Dominance2559
Over Dominance1085
Under Dominance1963
Other263
F1 represents the hybrid line; P, paternal line, B73; and M, maternal line, Mo17. Additivity, F1≈ 1/2(P + M); non-additivity, F1 > 1/2 (P + M) or F1 < 1/2 (P + M). High-parent dominance (HPD), F1 ≈ P > M or F1 ≈ M < P; low-parent dominance (LPD), F1≈ P < M or F1≈ M < P; over-dominance (ODO), F1 > P and F1 > M; under-dominance (UDO), F1 < P and F1 < M.
Figure 3. Expression of 12 differentially expressed gene from arginine and proline metabolism, pyruvate metabolism, and purine metabolism in the maize heterotic cross. The expression pattern of 12 genes detected by digital gene expression platform(a) and quantitative Real-Time PCR (qRT-PCR) (b). The black, red, and green bars in graph b depicted the stem-loop qRT-PCR relative expression level ± standard error of three replicates for each gene inB73, Mo17 and their hybrid.
Ijms 15 13892 g003

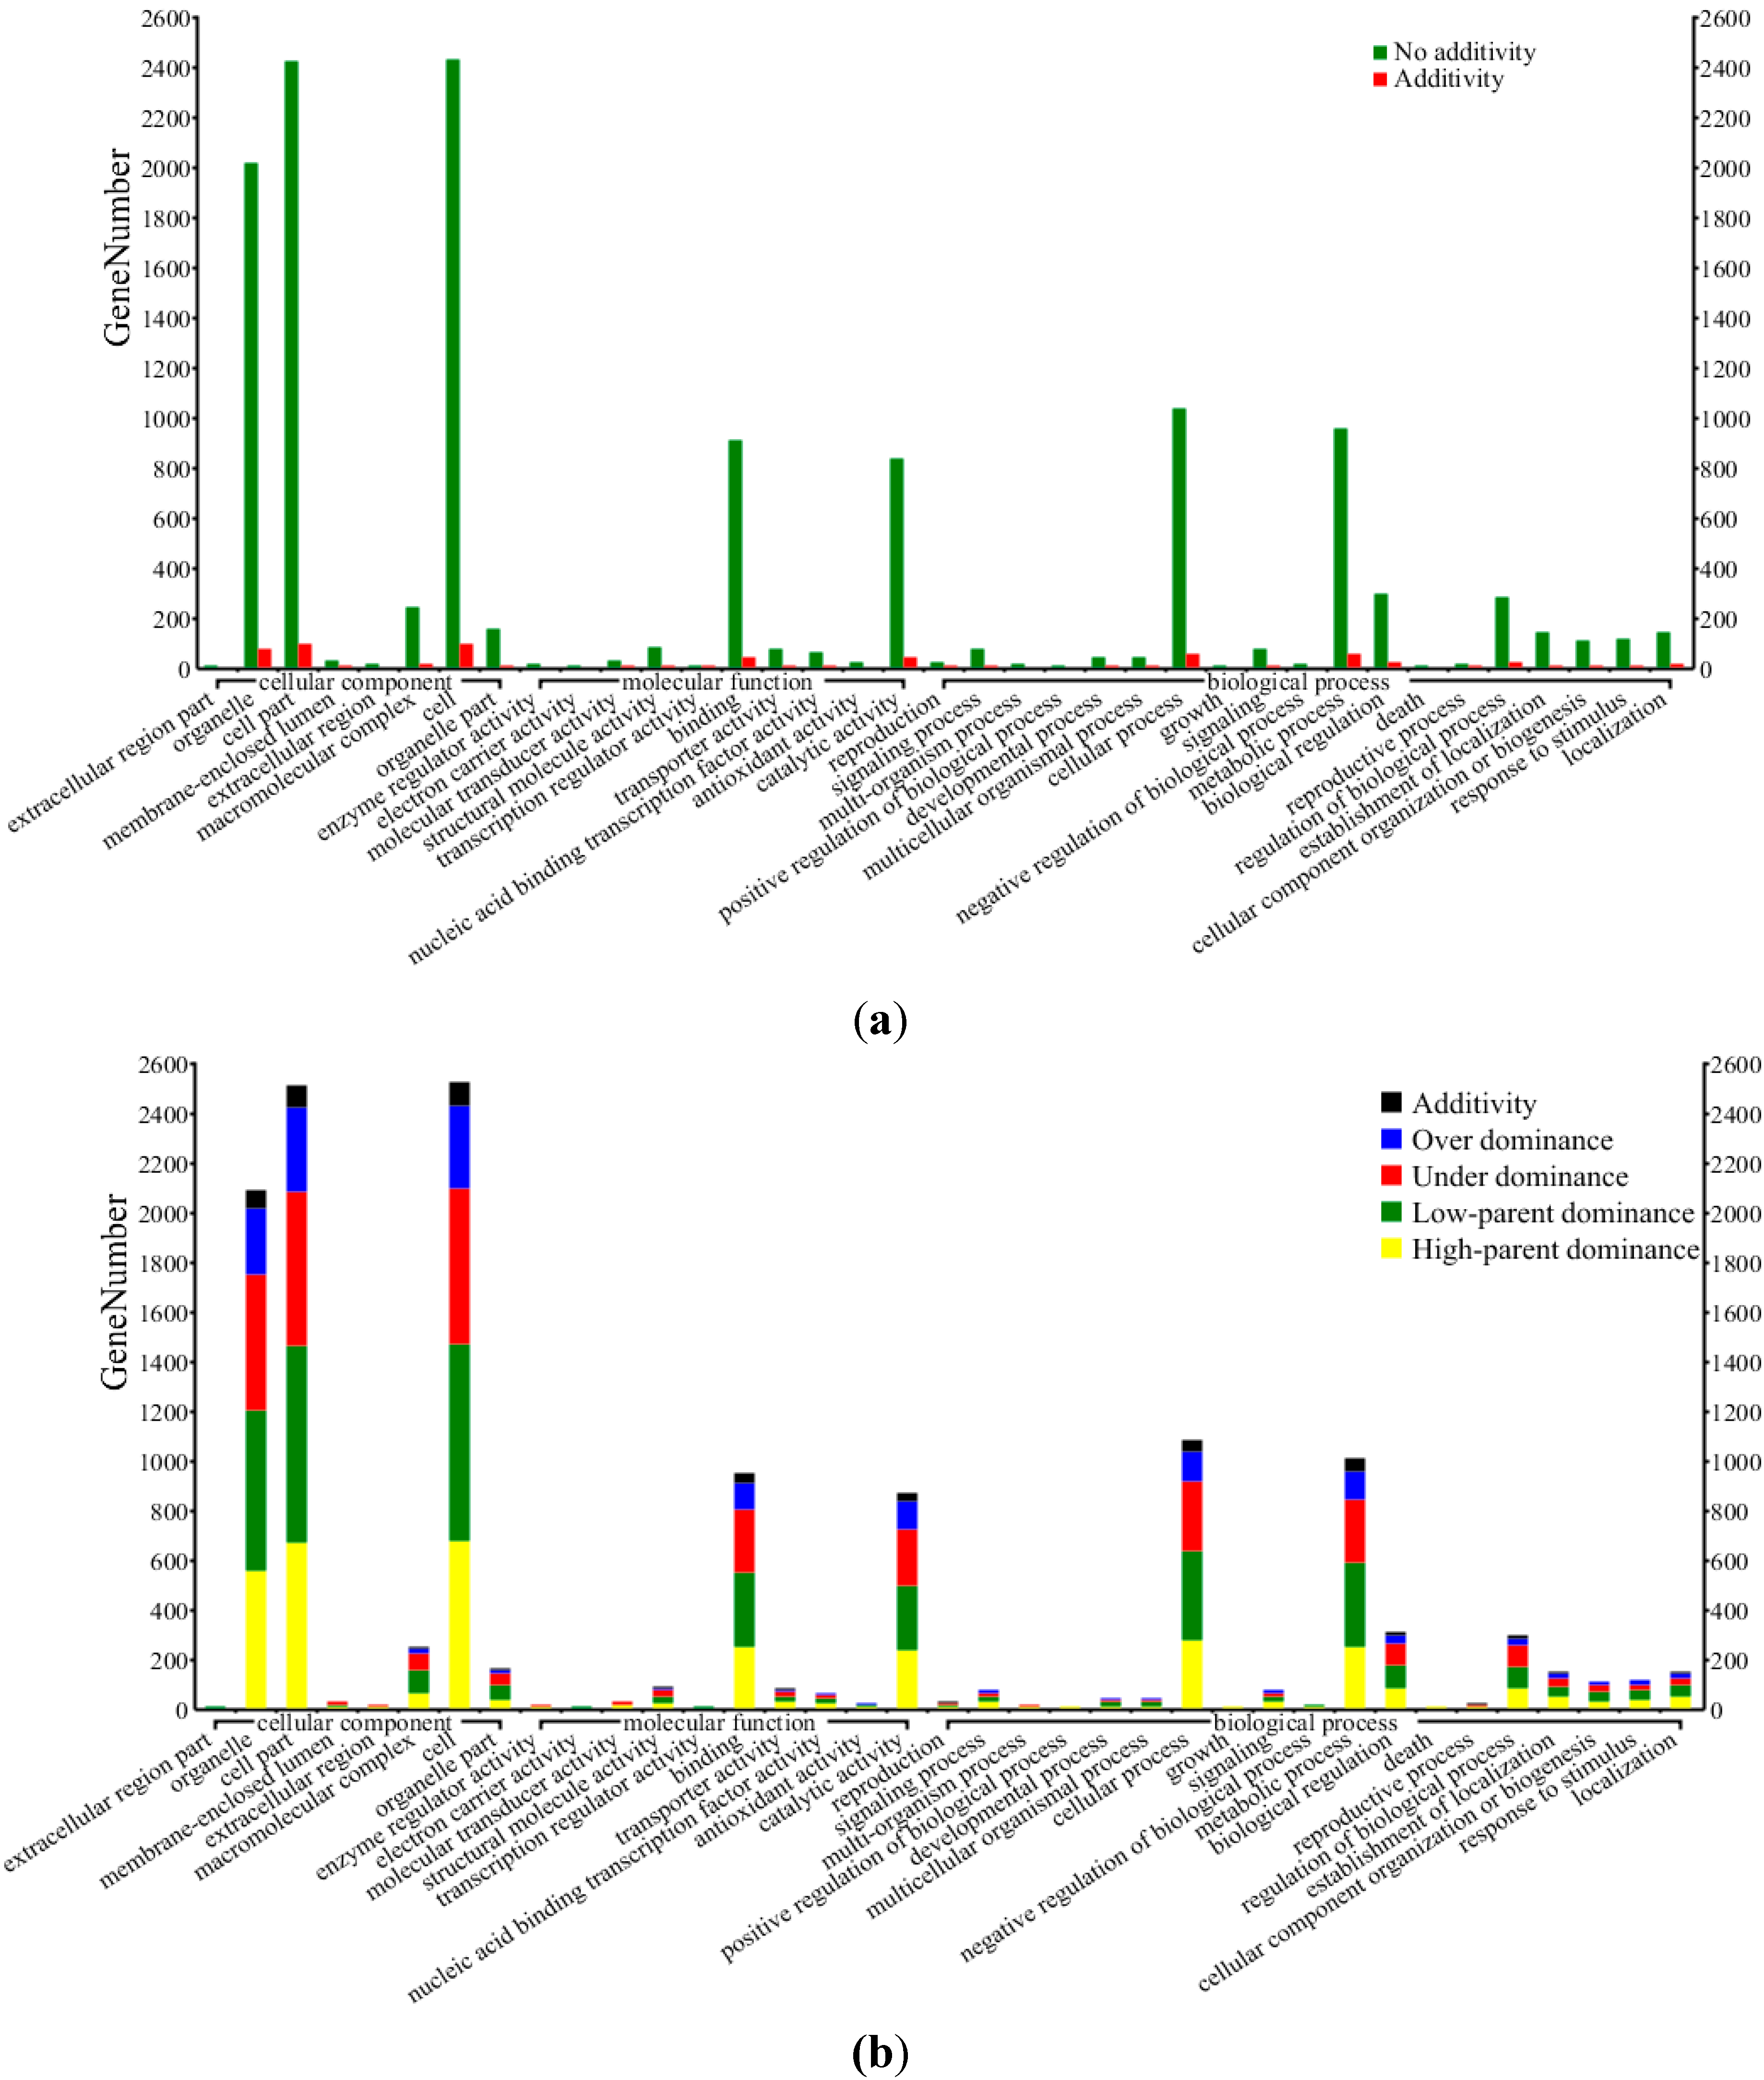
2.4. Functional Enrichment Analysis for Differentially Expressed Genes Using Gene Ontology (GO)

To gain a better understanding of the functional roles of different genes between inbred parents or between parental lines and their F1 hybrid, we looked for gene enrichment regarding the Gene Ontology (GO) cellular component, molecular function and biological process categories [44,45]. Functional-annotations from the maize genome (http://maizesequence.org) were used for functional classification of the 8621 different genes and performed by the official web-based tools for searching and browsing the Gene Ontology database (AmiGO) (http://www.geneontology.org/) [45] (Figure 2 and Table 3). We found that different genes showing differential expression patterns were mainly enriched in five cellular component categories (organelle, cell, cell part, organelle part and macromolecular complex), five molecular function categories (structural molecule activity, binding, transporter activity, nucleic acid binding transcription factor activity and catalytic activity), and eight biological process categories (cellular process, metabolic process, biological regulation, regulation of biological process, establishment of localization, cellular component organization or biogenesis, response to stimulus and localization) (Table 3). We further classified different genes in more detail based on Gene Ontology (GO) by AmiGO [45] (Table S7–S9). These different genes in GO annotation analysis of cellular component showed significant enrichment in the following components: non-membrane-bound organelle (6.40 × 10⁻⁴), intracellular non-membrane-bound organelle (6.40 × 10⁻⁴), nucleus (2.56 × 10⁻³), ribosome (3.34 × 10⁻²), and macromolecular complex (4.27 × 10⁻²). In the GO biological process enrichment analysis, there are five significant GO terms (FDR corrected p-value < 0.05). Eighty percent were macromolecular synthesis-related, such as cellular protein metabolic process, cellular macromolecule metabolic process, protein metabolic process, and macromolecule metabolic process (Table 4).
Table 3. Functional classification of different genes between inbred parents or between parental lines and their F1 hybrid.* indicated the significant enrichment in functional classification.
Functional CategoriesAdditivityNon-AdditivityHPDLPDUDOODOOther
Cellular Component
Extracellular Region Part 1302010
Organelle *181207754465054227170
Cell Part221249965579362433988
Membrane-Enclosed Lumen124391011
Extracellular Region11315250
Macromolecular Complex *162455889711611
Cell221251066079462834088
Organelle Part16155315747146
Molecular Function
Enzyme Regulator Activity31232340
Electron Carrier Activity0301200
Molecular Transducer Activity32475921
Structural Molecule Activity38017272844
Transcription Regulator Activity2601221
Binding7594024129725810836
Transporter Activity97625192093
Nucleic Acid Binding Transcription Factor Activity25818191524
Antioxidant Activity01753360
Catalytic Activity6786522926322611136
Biological Process
Reproduction02138532
Signaling Process57024201673
Multi-Organism Process0842110
Positive Regulation of Biological Process0321000
Developmental Process238221942
Multicellular Organismal Process239420942
Cellular Process71107926935728112547
Growth0512110
Signaling57024201673
Negative Regulation of Biological Process21226310
Metabolic Process7099924233825311848
Biological Regulation183037794882816
Death2621210
Reproductive Process01515522
Regulation of Biological Process172897688842615
Establishment of Localization15143414433196
Cellular Component Organization or Biogenesis10106243829105
Response to Stimulus4112333722191
Localization16145414533197
Table 4. Significant GO terms of DGs in the gene ontology (GO) annotation analysis of cellular component and biological process. a p-values calculated using a hypergeometric test-determines if the number of times that a GO term appears in the cluster is significant, relative to its occurrence in the genome.
GO TermDefinitionFDR Corrected p-Value a
Cellular Component
GO:0043228Non-membrane-bounded organelle6.40 × 10−4
GO:0043232Intracellular non-membrane-bounded organelle6.40 × 10−4
GO:0005634Nucleus2.56 × 10−3
GO:0005840Ribosome3.34 × 10−2
GO:0032991Macromolecular complex4.27 × 10−2
Biological Process
GO:0044267Cellular protein metabolic process4.22 × 10−3
GO:0044260Cellular macromolecule metabolic process8.84 × 10−3
GO:0019538Protein metabolic process3.30 × 10−2
GO:0009987Cellular process3.37 × 10−2
GO:0043170Macromolecule metabolic process4.59 × 10−2

2.5. The Expression Patterns of Biological Macromolecular Synthesis-Related Genes in the B73 × Mo17 Hybrid

To investigate pathways in which different genes were involved and enriched, pathway analysis was performed using the KOBAS 2.0 web tool [46]. 2935 out of 5627 different genes were involved in 122 pathways between F1 and B73, 2877 out of 5533 different genes were involved in 121 pathways between F1 and Mo17 (Table S10), Among them, the majority were present in ribosome, spliceosome and various metabolic pathways (such as arginine and proline metabolism, purine metabolism, glycolysis/gluconeogenesis, and biosynthesis of alkaloids derived from histidine and purine, etc.) (Table S10). q-value estimates [47] revealed only four pathways showing significance (q < 0.05): ribosome (q = 1.58 × 10⁻³), arginine and proline metabolism (q = 1.58 × 10⁻³), spliceosome (q = 1.63 × 10⁻²) and pyruvate metabolism (q = 3.80 × 10⁻²) (Table 5 and Table S11), and the first two pathways showed extreme significance (q < 0.01). Of the top 10 differentially expressed genes enriched in pathways between parental lines and their F1 hybrid, it should be noted that the purine metabolism pathway was the third largest pathway, following the ribosome pathway, although it does not reach the significance level (Table 5 and Table S11).
Table 5. Top 10 pathways differentially expressed genes enriched in between parental lines and their F1 hybrid.
Pathway aDifferent Genes with Pathway Annotation (4312)p -Value bq -Value cPathway ID
F1 vs. B73F1 vs. Mo17OverlapTotal (%)
Ribosome **14812989188 (4.68%)2.47 × 10−51.58 × 10−3ko03010
Arginine and Proline Metabolism **37342546 (1.11%)2.59 × 10−51.58 × 10−3ko00330
Spliceosome *14513687194 (4.82%)4.01 × 10−41.63 × 10−2ko03040
Pyruvate Metabolism *32412549 (1.69%)6.28 × 10−43.80 × 10−2ko00620
Proteasome33251939 (0.90%)2.00 × 10−36.09 × 10−2ko03050
Pentose Phosphate Pathway16241327 (0.63%)1.66 × 10−36.70 × 10−2ko00030
Purine Metabolism64723997 (2.25%)9.34 × 10−47.50 × 10−2ko00230
RNA Degradation43493161 (1.41%)4.38 × 10−38.84 × 10−2ko03018
Porphyrin and Chlorophyll Metabolism21161126 (0.60%)3.82 × 10−39.32 × 10−2ko00860
Glycolysis/Gluconeogenesis49573175 (1.74%)8.38 × 10−31.04 × 10−1ko00010
a Pathwayanalysisbased on KOBAS 2.0 (Mao et al. 2005; Wu et al. 2006; Xie et al. 2011) [46,48,49]; b p-value in hypergeometric test; c The q-value is similar to the well known p-value, except it is a measure of significance in terms of the false discovery rate rather than the false positive rate (Storey et al. 2003) [47]; the top 10 pathways with q-value are listed; * pathway with q-value < 0.05 is considered as significant; ** pathway with q-value < 0.01 is considered as extreme significant.
In the four significant pathways, 188 different genes (4.68%) were detected in the ribosome pathway, 46 different genes (1.11%) in the arginine and proline metabolism pathway, 194 (4.82%) in the spliceosome pathway and 49 (1.69%) in the pyruvate metabolism pathway. Approximately 50% of different genes in every pathway were differentially expressed between inbred and hybrid (Table 5). In the two significant metabolic pathways, almost all (202 out of 204) different genes showed non-additive expression patterns (HPD, UDO, LPD, or UDO). Seventeen of the 46 different genes in the arginine and proline metabolism pathway were up-regulated (with expression pattern of HPD or ODO) in the F1 hybrid, and 26 of 46 were down-regulated (with expression pattern of LPD or UDO). As compared with parental lines, the transcriptional level of one different gene in the F1 hybrid (GRMZM2G062142) encoding ornithine carbamoyltransferase (OTC) was up-regulated by 7- and 11.6-fold, respectively. The gene (GRMZM2G169458) encoding fatty aldehyde dehydrogenase 1 and another gene (GRMZM2G366392) encoding S-adenosylmethionine decarboxylase proenzyme (SAMDC) showed 4.7-/3.4-fold and 2.1-/2.9-fold higher expression in F1 hybrid than the parental lines, respectively. Simultaneously, the expression levels of another different gene in the F1 hybrid (GRMZM2G035042) encoding IMP dehydrogenase/GMP reductase were down-regulated by 8.5- and 9.3-fold, respectively, comparing with parental lines, another gene (GRMZM2G010406) encoding argininosuccinate synthase showed significant down-regulation expression in F1 hybrid. Moreover, 50 different genes involved in the pyruvate metabolism included genes encoding glyoxylatereductase (GRMZM2G166899), phosphoenolpyruvate carboxylase1 (PEPCase 1, GRMZM2G083841), oxidoreductase (GRMZM2G118770), and Pyruvate, orthophosphate dikinase 1 (GRMZM2G097457). (Table S8).

2.6. Resolving Transcription Factors (TFs) among Differentially Expressed Genes

A primary objective was to identify genes that encode TFs and to determine their modes of gene action. To test this, we retrieved putative orthologs of maize genes in our differently expressed data based on information from the Ensembl Compara gene trees [50] at maizesequence.org and gramene.org [51]. We then queried known Arabidopsis TFs in the database of Arabidopsis Transcription Factors (http://datf.cbi.pku.edu.cn/) and identified 435 maize different genes with sequence similarities to Arabidopsis TFs between parental lines and their F1 hybrid libraries (Table S12). We further interrogated these different genes using gene ontologies, InterPro domains, and known maize annotations. Of the 435 putative TFs, 11 exhibited additive gene action, and the majority of these TFs (n = 424) detected in this study exhibited nonadditive modes of gene expression. Most of these genes exhibited low-parent dominance (n = 138), high-parent dominance (n = 112), and underdominance (n = 112). However, overdominance (n = 42) and other gene action (n = 19) were also observed.
We also surveyed the differential expression of TFs across a wide range of transcript abundance in hybrid here and a mutant in RAMOSA3 (RA3) gene reported in a previous study [52], the latter of which showed an increased branching phenotype resulting from a loss of determinacy of basal spikelet pair meristems. A total of 39 differentially expressed putative TFs in our dataset were identified, and exhibited all nonadditive modes of gene expression (Table 6). Moreover, these TFs were also differentially expressed over a wide range of abundances in ra3 mutants [52]. These TFs includes several kinds of members of TF families associated with functions in development and meristem maintenance or identity (NAC, YABBY, GRAS and TCP), while others have roles in hormone-mediated or stress-mediated signaling by auxin (AUX/IAA), brassinosteroids (BES), or ethylene and stress (AP2/ERF). Among the 42 differentially expressed TFs, eight were characterized as AP2/ERF family proteins (Table 6). Therefore, these TFs possibly not only contribute to heterosis, but also provide insight into genetic control of branching.
Table 6. Differentially expressed maize genes were identified as putative TFs.
Maize Gene IDAnnotation aTF FamilySignificant Pattern bExpression Model cRegulated in ra3 Mutants d
GRMZM2G106673B3-domain TFB3Mo17 < F1 ≈ B73HPDUp
GRMZM2G177046Ocs element-binding factor 1bZIPMo17 < F1 ≈ B73HPDUp
GRMZM2G102514BES1/BZR1 proteinBESMo17 < F1 ≈ B73HPDDown
GRMZM2G172657UncharacterizedGRASMo17 < F1 ≈ B73HPDDown
GRMZM2G115357IAA24AUX/IAAMo17 < F1 ≈ B73HPDUp
GRMZM2G181376UncharacterizedB73 < F1 ≈ Mo17HPDDown
GRMZM2G173534Inducer of CBF expression 2B73 < F1 ≈ Mo17HPDUp
GRMZM2G173124Zinc fingerZnf-C3H1B73 ≈ F1 < Mo17LPDUp
GRMZM2G138886Cyclin B2CyclinB73 ≈ F1 < Mo17LPDUp
GRMZM2G020054UncharacterizedAP2/ERFMo17 ≈ F1 < B73LPDUp
GRMZM2G055243KNOX class 2 proteinKNOXMo17 ≈ F1 < B73LPDUp
GRMZM2G089995Ethylene responsiveAP2/ERFMo17 ≈ F1 < B73LPDUp
GRMZM2G079825Pathogenesis-relatedAP2/ERFMo17 ≈ F1 < B73LPDNS
GRMZM2G310368Ethylene responsiveAP2/ERFMo17 ≈ F1 < B73LPDUp
GRMZM2G132185Pathogenesis-relatedAP2/ERFMo17 ≈ F1 < B73LPDNS
GRMZM2G149940B3 DNA binding domainB3Mo17 ≈ F1 < B73LPDUp
GRMZM2G003927Ramosa1Znf-C2H2B73 ≈ F1 < Mo17LPDUp
GRMZM2G447406Progesterone receptorB73 ≈ F1 < Mo17LPDDown
GRMZM2G102218YABBY proteinYABBYMo17 ≈ F1 < B73LPDUp
GRMZM2G136769Ubiquitin-associatedUbiquitinMo17 ≈ F1 < B73LPDUp
GRMZM2G165972Heat shock factor (HSF)-typeHSFMo17 ≈ F1 < B73LPDDown
GRMZM2G140474Tyrosine protein kinaseMo17 ≈ F1 < B73LPDUp
GRMZM2G422205Zinc fingerZnf-C3H1Mo17 ≈ F1 < B73LPD
GRMZM2G171468UncharacterizedMYBMo17 ≈ F1 < B73LPDDown
AC206951.3_FG017Ethylene-responsive element binding protein 2ERFMo17 < B73 < F1ODOUp
GRMZM2G081012Transcription initiation factor IID, 18 kD subunit family proteinTFIID-18B73 ≈ Mo17 < F1ODOUp
GRMZM2G014653NAC protein 48NACB73 ≈ Mo17 < F1ODOUp
GRMZM2G127379NAM containingNACB73 ≈ Mo17 < F1ODOUp
GRMZM2G061487DRE binding factor 1AP2/ERFF1 < Mo17 < B73UDOUp
GRMZM2G431157Zinc finger, C2H2-typeZnf_C2H2-likeF1 < B73 ≈ Mo17UDOUp
GRMZM2G307119 Branched silkless1AP2/ERFF1 < B73 ≈ Mo17UDOUp
GRMZM2G144275bHLH transcription factorHLHF1 < B73 ≈ Mo17UDOUp
GRMZM2G132367HDZipI-1HD-ZipF1 < B73 ≈ Mo17UDOUp
GRMZM2G105266 Pathogenesis-relatedAP2/ERFF1 < B73 ≈ Mo17UDONS
GRMZM2G381395DNA-directed RNA polymeraseF1 < B73 ≈ Mo17UDODown
GRMZM2G453424UncharacterizedHRDC_likeF1 < B73 ≈ Mo17UDOUp
GRMZM2G118113DNA-directed RNA polymerase II 8.2 kDa polypeptideEFF1 < B73 ≈ Mo17UDOUp
GRMZM2G017606SHISHIF1 < B73 ≈ Mo17UDOUp
GRMZM2G039889Cold acclimation proteinF1 < B73 ≈ Mo17UDOUp
GRMZM2G088309Drooping leafYABBYF1 < B73 ≈ Mo17UDOUp
GRMZM2G078077TCP domain proteinTCPMo 17 < F1 < B73OtherUp
GRMZM2G404426Zinc fingerZnf-PHDB73 < F1 < Mo17OtherUp
a Annotations are based on Ensembl gene descriptions at maizesequence.org, gene build5b.60; b FDR ≤ 0.001 and the absolute value of log2Ratio ≥ 1; c Gene expression of F1 hybrid is classified into multiple patterns. HPD indicates high-parent dominance; LPD, low-parent dominance; ODO, over-dominance; UDO, under-dominance; ND, undistinguishable model from additivity and non-additivity; d reference Eveland et al. (2010) [52]. NS, Not significant.

2.7. A Significant Number of Genes Were Expressed in Only One Inbred Line or Absent in both Inbred Lines

A total of 5660 (24.8%) genes with no detectable expression in one inbred line or both two inbred lines were identified (Table 7). In other word, there are a significant number of genes that displayed presence–absence expression patterns. Among these genes, 46.4% (2624 of 5660) genes exhibited an expression pattern that was present in B73, and absent in Mo17, while some other 34.8% (1971 out of 5660) genes exhibited a similar expression pattern that present in Mo17, and absent in B73 (Table 7 and Table S13). Moreover, these genes expressed in only one inbred line also displayed presence–absence expression patterns in their hybrid. Specifically, regarding the genes present in B73 and absent in Mo17, the ratio of genes present to genes absent in their hybrid was approximately 0.56:1, while the ratio of genes present to genes absent in their hybrid was approximately 1.31:1 for other genes present in Mo17 and absent in B73. In combination, these results suggested that the majority of genes that were expressed in only one inbred line exhibited parental effects on gene expression levels, and presence–absence expression patterns of some genes may be related with presence/absence variations in maize genes [53] (See the following analysis). Surprisingly, it was found that 18.8% (1065 of 5660) genes were not expressed in the two inbred parents. However, these genes were expressed in their hybrid (Table 7 and Table S13). Additionally, nine genes expressed in only one inbred line were also found in previous study by Stupar et al. [14], and these results in two studies were consistent. For instance, GRMZM2G037255 (corresponding accession #CF629797) and GRMZM2G152258 (accession #BM073080) absent in both inbred lines in our study were not detected in both B73 and Mo17 by PCR in the study of Stupar et al. [14] (Table S13). However, the other 106 genes were expressed in only one inbred in Stupar’s study [14], and were expressed in both B73 and Mo17 in present study.
Table 7. Genes with no detectable expression in one inbred line or both two inbred lines.
ClassNo. of Genes Present in B73, Absent in Mo17% of GenesNo. of Genes Present in Mo17, Absent in B73% of GenesNo. of Genes Absent in both B73 and Mo17% of Genes
No. of genes present in their hybrid94216.6111719.7106518.8
No. of genes absent in their hybrid1,68229.785415.100
Total2,62446.4197134.8106518.8

2.8. Analysis of Presence/Absence Variation (PAVs) Genes Action in Maize Hybrids

Presence/absence variations (PAVs) have been described in maize genes [53], and most of the PAVs reflected true differences in gene content between the B73 and Mo17 genomes in recent research. Because of the availability of a complete list of PAV genes identified by Lai et al. [54], the B73 × Mo17 cross was first examined regarding PAV genes between the two parental lines and its relation to different gene expression among the three genotypes. As shown in Table S14, there were 104 PAV genes between the two parental lines, and only 37 PAV genes (35.6%) were mapped by identified tags in three libraries. Interestingly, most of these mapped genes products were hypothetical proteins, and the other 55.8% (58 of 104) of genes were unknown proteins except for nine genes including terpene synthase and ZCN20 (Table S14). Of these mapped genes, 45.9% (17 of 37) genes were expressed in only B73. Six genes expressed in only one inbred line were also not expressed in their hybrid. What was more puzzling is there were three genes which were not expressed in the two inbred parents, nevertheless, expressed in their hybrid. Interestingly, among the 37 PAV genes, the expression levels (TPM) of 30% genes in F1 hybrid was the same as that of B73 or Mo17, and 50% showed higher or lower expression in F1 hybrid than both the parental lines (Table S15). However, only five PAV genes were identified with significantly differential expression with HPD or LPD (Table S14).

3. Discussion

In this study, we assayed genome-wide patterns of gene expression of the maize ear at an early flower differentiation stage among two maize elite inbred lines (B73 and Mo17) and their F1 hybrid (B73 × Mo17) using Solexa’s digital gene expression (DGE) system, a tag-based novel high-throughput transcriptome deep sequencing method. Given the nature of the DGE system, we have pooled biological replicates from three varieties for each group to make representative samples for deep sequencing analysis. We obtained a sequencing depth of approximately 4.2 million tags per library (Table 1) and found 22,789 genes expressed collectively except for putative new transcripts found in the study. Levels of some genes not expressed in the present study were responsive to abiotic stress, e.g., aquaporin PIP1-6 gene (GRMZM2G136032), MADS-box transcription factor 14 gene (GRMZM2G137510), beta-fructofuranosidase 1 precursor gene (GRMZM2G394450), etc., were induced by heavy metal Pb treatment in one recent study [55]. Interestingly, we found evidence for bidirectional transcription in all datasets. By comparison of all libraries, the ratio of sense to antisense strands of the transcripts was approximately 1.3:1, which suggested that not only a high number of antisense expressions, but also the transcriptional regulation in the young ear development acted most strongly on the sense strand. A similar observation was also reported in a recent study [56]. Furthermore, approximately 20% of genes with no detectable expression in one inbred line were identified. These genes may exhibit parental effects on gene expression levels.
Based on our digital gene expression analysis, approximately 37.8% of genes exhibited differential expression between every two genotypes in the B73 × Mo17 hybrid cross. QPCR validation was performed both on the same pooled material that was used for deep sequencing and on independent RNA extractions from each sample, and almost all confirmed the direction of change detected by DGE analysis (Figure 3). These different genes exhibited additive and non-additive expression patterns (Figure 2). A small fraction of DGs (8.9%, 767 of 8621) exhibited a mode of gene action that was indistinguishable from additivity, which is similar to recent studies in maize [14,23,25,31]. Several studies reported more nonadditively expressed genes, including many with F1 expression levels outside the parental range [11,12,13,23,27]. Among those nonadditively expressed genes, the proportion of genes with clear over and under-dominant gene action were 12.6% and 22.8%, respectively, which is similar to results from prior studies [12,15,16,31,57]. Additionally, we further compared the differences of modes of gene action between Swanson-Wagner’s study [31] and the present study. A total of 8621 different gene BLAST searches were performed using 1367 ESTs as queries. Four hundred and twenty-one different genes were matched by 547 ESTs with high-scoring segment pairs (Table S15), but only a small number of these genes (75/421) had the same mode of gene action between the two studies. Thus, different global expression patterns in different tissues or developmental stages might prevail. Our results support that multiple molecular mechanisms (dominance and overdominance modes) contribute to heterosis, which is consistent with previous reports [21,31].
No consensus has yet been reached about the genetic basis of heterosis [58]. However, some mechanisms were supported by the observations that sequence polymorphism in promoter alleles between inbred lines preferentially occurred in those differentially transcribed genes [16]. When two alleles are exposed to a common trans-acting factor, cis-elements in hybrids might differentially interact with gene regulators, resulting in allele-specific gene expression [14,16,59]. This undoubtedly is one of the causes of gene-expression changes in hybrids. There was evidence that phenotypes in hybrids resulted from the dosage effect of such regulatory genes [60]. In this study, we found 424 putative TFs, exhibiting differential expression in the hybrid compared with either parent, in agreement with recent studies [16]. Remarkably, about 9.2% of these TFs were also differentially expressed in ra3 mutants (Table 6) and many of the differentially expressed genes that could be mapped onto metabolic pathways were associated with primary carbohydrate biosynthesis and degradation, respiration, and energy production as well as redox and nitrogen cycling processes [52]. In conclusion, the expression of TFs in maize hybrids might be important for allele-specific gene expression in heterosis. Another important finding in a recent study is that many SNPs, indel polymorphisms (IDPs) and PAV genes identified between the B73 and Mo17 genome [54] were consistent with the occurrence of insertion/deletion (indel) variants in 5' regions between the alleles of genes that are differentially expressed in different rice strains [16]. We also analyzed the expression of all 104 PAV genes between the two parental lines by DGE data. Of these genes, 67 PAV genes (64.4%) did not express in both B73 and Mo17, possibly because these genes were nonfunctional. For another 37 PAV genes, most (33/37) of their gene products were hypothetical proteins, unknown proteins, or no significant BLAST hits were obtained by using an e-value cutoff of 1 × 10⁻⁵, and almost 50% of these genes were expressed in both inbred lines and their hybrid. Specially, eight PAV genes were expressed only in one inbred line and their hybrid, which possibly contributed to heterosis, because the phenomenon conformed to the previous assumption that inbred lines with large differences in gene content could complement one another [54]. Moreover, the expression levels of approximately 30% (9 of 37) of these genes in the F1 hybrid was the same as that of B73 or Mo17, and 50% showed higher or lower expression in F1 hybrid than both the parental lines. Interestingly, only five PAV genes were identified with significantly differential expression in the hybrid. It suggests that the expression of only a part of PAV genes was consistent with the complementation hypothesis. In conclusion, it is unlikely that heterosis is the result of any single mechanism [58,61].

4. Experimental Section

4.1. Plant Growth and RNA Isolation

The hybrid corn combination, B73 × Mo17 (F1 and its parental lines, B73 and Mo17), was originally obtained from Thomas Lübberstedt (Iowa State University, Ames, IA, USA). The materials were offered for high-throughput sequencing and quantitative real time PCR (qRT-PCR) analysis. The inbred lines were cultivated at the experimental station of Sichuan Agricultural University, Chengdu, for seed propagation of the inbreds, and for production of B73 × Mo17 hybrid seed. Kernels of the combination were grown in environmentally controlled growth chambers that provided 15 h of light (25 °C) and 9 h of dark (20 °C) as described previously. Light intensity was ≈650–800 μmol·m−2·s−1. Ears of 10 random healthy plants at early flower differentiation stages were manually collected as a pool for each genotype as described previously [62]. In brief, ears at stage 3 (three stamen primordia and one pistil primordium can be observed) were collected according to the plant features (number of visible leaves, leaf age index, number of unfolded and folded leaves) combined with microscopic observation. At stage 3, the number of visible leaves, leaf age index, and the number of unfolded and folded leaves are 19, 65%, 13.7 and 5, respectively. Morphological observations of ears at stage 3 in two inbred lines and their F1 were almost the same as that in another inbred line X178 reported previously [62]. After separately grinding meristems in liquid nitrogen, RNA were extracted for constructing three digital gene expression libraries, and quantitative real-time PCR validation from ≈5 g of frozen tissue by using TRIzol reagent (Invitrogen, Carlsbad, CA, USA) according to the manufacturer’s instructions.

4.2. Digital Gene Expression Library Preparation and Sequencing

Tag library preparation for the three genotypes (B73, Mo17 and their F1) was performed in parallel by using the Illumina gene expression sample preparation kit as described previously [63]. An extract of 6 μg of total RNA was obtained and treated with Oligo (dT) magnetic bead adsorption to purify mRNA. Oligo (dT) was then used as a primer to synthesize the first- and second-strand cDNA. The 5' ends of tags were generated by two endonucleases NlaIII or DpnII. The bead-bound cDNA was subsequently digested with restriction enzyme NlaIII, which recognizes and cuts off the CATG sites. The fragments apart from the 3' cDNA fragments connected to Oligo (dT) beads were washed away and the Illumina adaptor 1 was ligated to the sticky 5' end of the digested bead-bound cDNA fragments. The junction of Illumina adaptor 1 and CATG site is the recognition site of MmeI, which is a type of Endonuclease with separate recognition and digestion sites. It cuts 17 bp downstream of the CATG site, producing tags with adaptor 1. After removing 3' fragments with magnetic beads by precipitation, Illumina adaptor 2 was ligated to the 3' ends of tags, acquiring tags with different adaptors at both ends to form a tag library. After 15 cycles of linear PCR amplification, 95 bp fragments were purified by 6% TBE PAGE Gel electrophoresis. After denaturation, the single-chain molecules were fixed onto the Illumina Sequencing flowcell. Each molecule grows into a single-molecule cluster sequencing template through in situ amplification. The four types of nucleotides were labeled by four colors, and added to perform sequencing by synthesis (SBS) [64]. Each tunnel will generate millions of raw reads with sequencing length of 35 bp.

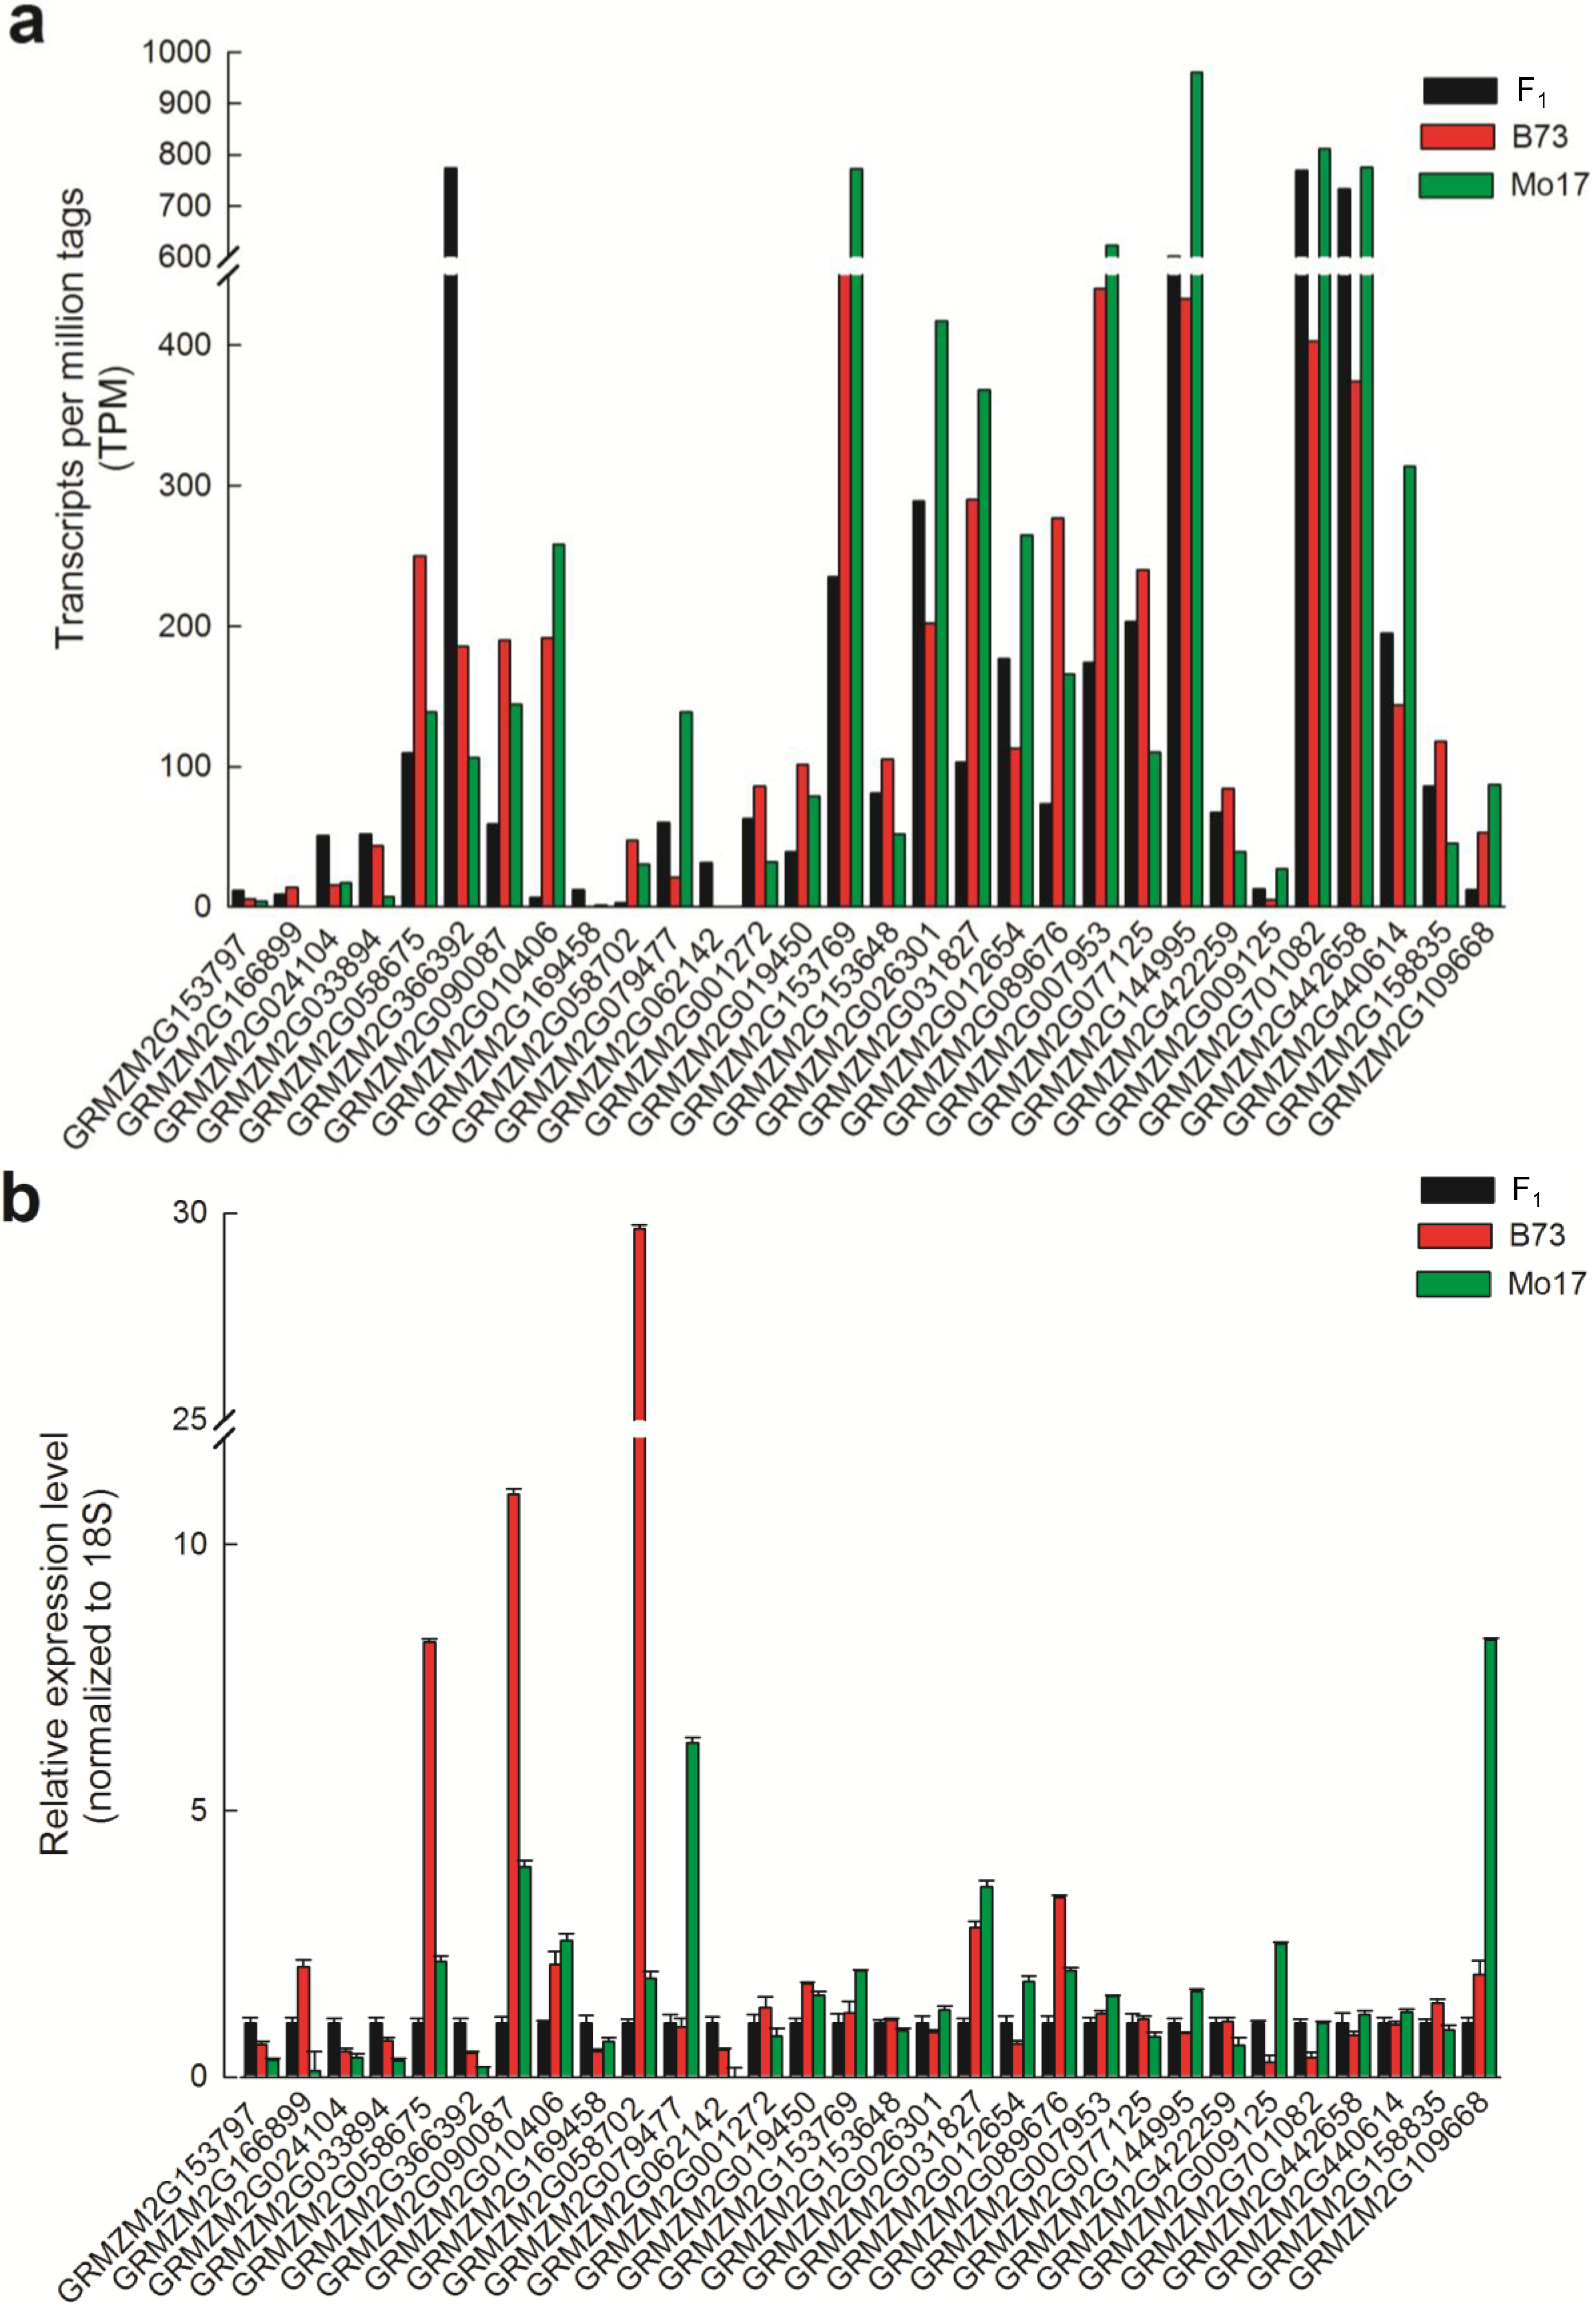
4.3. Quantitative RT-PCR and Gene Expression Analysis

In order to verify a sample of genes that exhibited statistically significant differential expression in the analysis of DGE data, we used quantitative real time PCR analysis. The RNA samples used for the qRT-PCR assays were the same as for the DGE experiments from 10 biological replicates. First, 1 μg of RNA was treated with RNase-free DNase (Promega, Madison, WI, USA), and cDNA was synthesized with PrimeScript RT reagent kit (TaKaRa, Tokyo, Japan). Then, qRT-PCR of 30 differentially expressed genes (Table S16), which were involved in arginine and proline metabolism, pyruvate metabolism or other genes, were performed using the SYBR PremixExTaq™ protocol (TaKaRa, Tokyo, Japan) on an Applied Biosystems 7500 Real-Time PCR System (Applied Biosystems, Foster City, CA, USA). For each sample, measurements were performed in triplicate, and the average cycle thresholds (Ct) were used to determine fold-change. 18S rRNA was employed as an endogenous control. The results were calculated using the 2−∆∆Ct method [65].

4.4. Analysis and Mapping of Digital Gene Expression Tags

Raw sequencing image data were transformed by base calling into sequences. These raw data reads were stored in FASTQ format, and their analysis conducted as described by Qin et al. [63]. In brief, prior to mapping to the reference database, all sequences were filtered to trim the 3' adaptor sequence, filter empty tags (reads with only 3' adaptor sequences but no tags) and low-quality tags containing Ns, and remove tags which are too long or too short. A virtual library containing all possible CATG + 17 base-length sequences of the maize genome database (AGPv2, release 5b.60) [43] was utilized. All clean tags were mapped to the reference sequences and a mismatch of only 1 bp was considered. Clean tags that were mapped to the maize genome reference sequences from multiple genes were filtered. The remaining clean tags were designed as unambiguous clean tags. The expression level of each gene was estimated by the frequency of clean tags and then normalized to TPM (number of transcripts per million clean tags) [66], which is a standard method and extensively used in DGE analysis [67]. KOG functional classification, Gene Ontology (GO), pathway annotation and enrichment analyses were based on the NCBI COG (http://www.ncbi.nlm.nih.gov/COG) [68], Gene Ontology Database (http://www.geneontology.org/) [69] and KEGG pathway (http://www.genome.jp/kegg/) [70], respectively. When we investigate pathways in which DGs were involved and enriched, q-value was used for aided identification according to the previous description [47].

4.5. Identification of Differentially Expressed Genes

To examine differential expression across samples (B73, Mo17 and their hybrid), the number of raw clean tags in each library was normalized to TPM to obtain normalized gene expression levels. Detection of different tags across samples were performed as previously described [71]. The false discovery rate (5%) is controlled by the Benjamini and Hochberg’s procedure [72]. After multiple testing between pairwise comparisons, we use “FDR ≤ 0.001 and the absolute value of log2Ratio ≥ 1” as the threshold to judge the significance of gene expression difference. More stringent criteria with smaller FDR and bigger fold-change values were used to identify different genes.
In the present study, the same strategy was performed in a linear-in-genotype contrast when F1 genotype was compared to the two parental lines as described by Zhang et al. [16]. The genes with “FDR ≤ 0.001 and the absolute value of log2Ratio ≥ 1” were regarded as non-additivity, when the genes with “FDR > 0.001 and the absolute value of log2Ratio < 1” were regarded as not statistically significantly different from additivity. To classify the genes further, the high-parent dominant genes and low-parent dominant genes were identified from the non-additive group based on the criterion, that the F1 genotype was significantly different from one parent and not significantly different from another parent. From the non-additive group, the expression of genes was identified as over- or under-dominant, when expression in the F1 genotype was significantly higher or lower than in both inbred parents, respectively.

5. Conclusions

Our analysis revealed 17,128 genes expressed in these three genotypes and 22,789 genes expressed collectively in the present study. Approximately 38% of the genes were differentially expressed in early maize ear inflorescences from heterotic cross, including many transcription factor genes and some presence/absence variations (PAVs) genes, and exhibited multiple modes of gene action. Additionally, a significant number of genes were expressed in only one inbred line or absent in both inbred lines. Comparison of the differences of modes of gene action between previous studies and the present study revealed only small number of different genes had the same modes of gene action in both maize seedlings and ear inflorescences, it might of be an indication that, in different tissues or developmental stages, different global expression patterns might prevail, which might nevertheless be related to heterosis. Our results support the hypothesis that multiple molecular mechanisms (dominance and overdominance modes) contribute to heterosis.

Supplementary Files

Supplementary File 1

Acknowledgments

This work was supported by National modern agricultural industry technology system, the Major Project of China on New varieties of GMO Cultivation (2011ZX08003-003), National Natural Science Foundation of China (30201639), and the national Hi-Tec program of China (2012AA10307).

Author Contributions

H.D., G.P., C.Q. and Z.Z. designed the study; C.Q., X.L., L.L., J.G., H.L., Y.S. and M.Z. performed the analyses; C.Q and Z.C. conducted qRT-PCR; H.D., C.Q. and T.L. drafted the manuscript. All of the authors critically revised and provided final approval of this manuscript.

Conflicts of Interest

The authors declare no conflict of interest.

References

  1. Shull, G.H. The composition of a field of maize. J. Hered. 1908, 4, 296–301. [Google Scholar] [CrossRef]
  2. Bruce, A.B. The Mendelian theory of heredity and the augmentation of vigor. Science 1910, 32, 627. [Google Scholar]
  3. Jones, D.F. Dominance of linked factors as a means of accounting for heterosis. Genetics 1917, 6, 466–479. [Google Scholar]
  4. Davenport, C.B. Degeneration, albinism and inbreeding. Science 1908, 28, 454. [Google Scholar]
  5. East, E.M. Heterosis. Genetics 1936, 21, 375–397. [Google Scholar]
  6. Birchler, J.A.; Auger, D.L.; Riddle, N.C. In search of the molecular basis of heterosis. Plant Cell 2003, 15, 2236–2239. [Google Scholar] [CrossRef]
  7. Yu, S.B.; Li, J.X.; Xu, C.G.; Tan, Y.F.; Gao, Y.J.; Li, X.H.; Zhang, Q.F.; Saghai Maroof, M.A. Importance of epistasis as the genetic basis of heterosis in an elite rice hybrid. Proc. Natl. Acad. Sci. USA 1997, 99, 9226–9231. [Google Scholar]
  8. Li, Z.K.; Luo, L.J.; Mei, H.W.; Wang, D.L.; Shu, Q.Y.; Tabien, R.; Zhong, D.B.; Ying, C.S.; Stansel, J.W.; Khush, G.S.; et al. Overdominant epistatic loci are the primary genetic basis of inbreeding depression and heterosis in rice. I. Biomass and grain yield. Genetics 2001, 158, 1737–1753. [Google Scholar]
  9. Xiao, J.; Li, J.; Yuan, L.; Tanksley, S.D. Dominance is the major genetic basis of heterosis in rice as revealed by QTL analysis using molecular markers. Genetics 1995, 140, 745–754. [Google Scholar]
  10. Stuber, C.W.; Lincoln, S.E.; Wolff, D.W.; Helentjaris, T.; Lander, E.S. Identification of genetic factors contributing to heterosis in a hybrid from two elite maize inbred lines using molecular markers. Genetics 1992, 132, 823–839. [Google Scholar]
  11. Auger, D.L.; Gray, A.D.; Ream, T.S.; Kato, A.; Coe, E.H., Jr.; Birchler, J.A. Nonadditive gene expression in diploid and triploid hybrids of maize. Genetics 2005, 169, 389–397. [Google Scholar]
  12. Hoecker, N.; Keller, B.; Muthreich, N.; Chollet, D.; Descombes, P.; Piepho, H.P.; Hochholdinger, F. Comparison of maize (Zea mays L.) F1-hybrid and parental inbred line primary root transcriptomes suggests organ-specific patterns of nonadditive gene expression and conserved expression trends. Genetics 2008, 179, 1275–1283. [Google Scholar]
  13. Song, R.; Messing, J. Gene expression of a gene family in maize based on noncollinear haplotypes. Proc. Natl. Acad. Sci. USA 2003, 100, 9055–9060. [Google Scholar]
  14. Stupar, R.M.; Springer, N.M. cis-Transcriptional variation in maize inbred lines B73 and Mo17 leads to additive expression patterns in the F1 hybrid. Genetics 2006, 173, 2199–2210. [Google Scholar] [CrossRef]
  15. Vuylsteke, M.; van Eeuwijk, F.; van Hummelen, P.; Kuiper, M.; Zabeau, M. Genetic analysis of variation in gene expression in Arabidopsis thaliana. Genetics 2005, 171, 1267–1275. [Google Scholar]
  16. Zhang, H.Y.; He, H.; Chen, L.B.; Li, L.; Liang, M.Z.; Wang, X.F.; Liu, X.G.; He, G.M.; Chen, R.S.; Ma, L.G.; et al. A genome-wide transcription analysis reveals a close correlation of promoter INDEL polymorphism and heterotic gene expression in rice hybrids. Mol. Plant 2008, 1, 720–731. [Google Scholar] [CrossRef]
  17. Guo, M.; Yang, S.; Rupe, M.; Hu, B.; Bickel, D.; Arthur, L.; Smith, O. Genome-wide allele-specific expression analysis using Massively Parallel Signature Sequencing (MPSS) Reveals cis- and trans-effects on gene expression in maize hybrid meristem tissue. Plant Mol. Biol. 2008, 66, 551–563. [Google Scholar]
  18. Chen, X.; Li, M.; Shi, J.; Fu, D.; Qian, W.; Zou, J.; Zhang, C.; Meng, J. Gene expression profiles associated with intersubgenomic heterosis in Brassica napus. Theor. Appl. Genet. 2008, 117, 1031–1040. [Google Scholar] [CrossRef]
  19. Zhuang, Y.; Adams, K.L. Extensive allelic variation in gene expression in populus F1 hybrids. Genetics 2007, 177, 1987–1996. [Google Scholar] [CrossRef]
  20. Jahnke, S.; Sarholz, B.; Thiemann, A.; Kühr, V.; Gutiérrez-Marcos, J.; Geiger, H.; Piepho, H.-P.; Scholten, S. Heterosis in early seed development: A comparative study of F1 embryo and endosperm tissues 6 days after fertilization. Theor. Appl. Genet. 2010, 120, 389–400. [Google Scholar] [CrossRef]
  21. Pea, G.; Ferron, S.; Gianfranceschi, L.; Krajewski, P.; Enrico Pe, M. Gene expression non-additivity in immature ears of a heterotic F1 maize hybrid. Plant Sci. 2008, 174, 17–24. [Google Scholar]
  22. Riddle, N.; Jiang, H.; An, L.; Doerge, R.; Birchler, J. Gene expression analysis at the intersection of ploidy and hybridity in maize. Theor. Appl. Genet. 2010, 120, 341–353. [Google Scholar] [CrossRef]
  23. Guo, M.; Rupe, M.A.; Yang, X.; Crasta, O.; Zinselmeier, C.; Smith, O.S.; Bowen, B. Genome-wide transcript analysis of maize hybrids: Allelic additive gene expression and yield heterosis. Theor. Appl. Genet. 2006, 113, 831–845. [Google Scholar] [CrossRef]
  24. Paschold, A.; Marcon, C.; Hoecker, N.; Hochholdinger, F. Molecular dissection of heterosis manifestation during early maize root development. Theor. Appl. Genet. 2010, 120, 383–388. [Google Scholar] [CrossRef]
  25. Meyer, S.; Pospisil, H.; Scholten, S. Heterosis associated gene expression in maize embryos 6 days after fertilization exhibits additive, dominant and overdominant pattern. Plant Mol. Biol. 2007, 63, 381–391. [Google Scholar] [CrossRef]
  26. Stupar, R.M.; Gardiner, J.M.; Oldre, A.G.; Haun, W.J.; Chandler, V.L.; Springer, N.M. Gene expression analyses in maize inbreds and hybrids with varying levels of heterosis. BMC Plant Biol. 2008, 8, 33. [Google Scholar]
  27. Uzarowska, A.; Keller, B.; Piepho, H.P.; Schwarz, G.; Ingvardsen, C.; Wenzel, G.; Lubberstedt, T. Comparative expression profiling in meristems of inbred-hybrid triplets of maize based on morphological investigations of heterosis for plant height. Plant Mol. Biol. 2007, 63, 21–34. [Google Scholar]
  28. Sun, Q.; Wu, L.; Ni, Z.; Meng, F.; Wang, Z.; Lin, Z. Differential gene expression patterns in leaves between hybrids and their parental inbreds are correlated with heterosis in a wheat diallel cross. Plant Sci. 2004, 166, 651–657. [Google Scholar] [CrossRef]
  29. Swanson-Wagner, R.A.; DeCook, R.; Jia, Y.; Bancroft, T.; Ji, T.; Zhao, X.; Nettleton, D.; Schnable, P.S. Paternal dominance of trans-eQTL influences gene expression patterns in maize hybrids. Science 2009, 326, 1118–1120. [Google Scholar]
  30. Wei, G.; Tao, Y.; Liu, G.; Chen, C.; Luo, R.; Xia, H.; Gan, Q.; Zeng, H.; Lu, Z.; Han, Y.; et al. A transcriptomic analysis of superhybrid rice LYP9 and its parents. Proc. Natl. Acad. Sci. USA 2009, 106, 7695–7701. [Google Scholar]
  31. Swanson-Wagner, R.A.; Jia, Y.; DeCook, R.; Borsuk, L.A.; Nettleton, D.; Schnable, P.S. All possible modes of gene action are observed in a global comparison of gene expression in a maize F1 hybrid and its inbred parents. Proc. Natl. Acad. Sci. USA 2006, 103, 6805–6810. [Google Scholar]
  32. Song, G.S.; Zhai, H.L.; Peng, Y.G.; Zhang, L.; Wei, G.; Chen, X.Y.; Xiao, Y.G.; Wang, L.; Chen, Y.J.; Wu, B.; et al. Comparative transcriptional profiling and preliminary study on heterosis mechanism of super-hybrid rice. Mol. Plant 2010, 3, 1012–1025. [Google Scholar] [CrossRef]
  33. Chen, Z.J. Genetic and epigenetic mechanisms for gene expression and phenotypic variation in plant polyploids. Annu. Rev. Plant Biol. 2007, 58, 377–406. [Google Scholar] [CrossRef]
  34. Ha, M.; Lu, J.; Tian, L.; Ramachandran, V.; Kasschau, K.D.; Chapman, E.J.; Carrington, J.C.; Chen, X.; Wang, X.J.; Chen, Z.J. Small RNAs serve as a genetic buffer against genomic shock in Arabidopsis interspecific hybrids and allopolyploids. Proc. Natl. Acad. Sci. USA 2009, 106, 17835–17840. [Google Scholar]
  35. He, G.; Zhu, X.; Elling, A.A.; Chen, L.; Wang, X.; Guo, L.; Liang, M.; He, H.; Zhang, H.; Chen, F.; et al. Global epigenetic and transcriptional trends among two rice subspecies and their reciprocal hybrids. Plant Cell 2010, 22, 17–33. [Google Scholar]
  36. Liu, H.; Qin, C.; Chen, Z.; Zuo, T.; Yang, X.; Zhou, H.; Xu, M.; Cao, S.; Shen, Y.; Lin, H.; et al. Identification of miRNAs and their target genes in developing maize ears by combined small RNA and degradome sequencing. BMC Genomics 2014, 15, 25. [Google Scholar]
  37. Hollick, J.B.; Chandler, V.L. Epigenetic allelic states of a maize transcriptional regulatory locus exhibit overdominant gene action. Genetics 1998, 150, 891–897. [Google Scholar]
  38. Zhao, X.; Chai, Y.; Liu, B. Epigenetic inheritance and variation of DNA methylation level and pattern in maize intra-specific hybrids. Plant Sci. 2007, 172, 930–938. [Google Scholar] [CrossRef]
  39. Ni, Z.; Kim, E.D.; Ha, M.; Lackey, E.; Liu, J.; Zhang, Y.; Sun, Q.; Chen, Z.J. Altered circadian rhythms regulate growth vigour in hybrids and allopolyploids. Nature 2009, 457, 327–331. [Google Scholar]
  40. Wang, X.; Cao, H.; Zhang, D.; Li, B.; He, Y.; Li, J.; Wang, S. Relationship between differential gene expression and heterosis during ear development in maize (zea mays L.). J. Genet. Genomics 2007, 34, 160–170. [Google Scholar] [CrossRef]
  41. Li, R.; Yu, C.; Li, Y.; Lam, T.W.; Yiu, S.M.; Kristiansen, K.; Wang, J. SOAP2: An improved ultrafast tool for short read alignment. Bioinformatics 2009, 25, 1966–1967. [Google Scholar]
  42. Li, P.; Ponnala, L.; Gandotra, N.; Wang, L.; Si, Y.; Tausta, S.L.; Kebrom, T.H.; Provart, N.; Patel, R.; Myers, C.R.; et al. The developmental dynamics of the maize leaf transcriptome. Nat. Genet. 2010, 42, 1060–1067. [Google Scholar] [CrossRef]
  43. Schnable, P.S.; Ware, D.; Fulton, R.S.; Stein, J.C.; Wei, F.; Pasternak, S.; Liang, C.; Zhang, J.; Fulton, L.; Graves, T.A.; et al. The B73 maize genome: Complexity, diversity, and dynamics. Science 2009, 326, 1112–1115. [Google Scholar] [CrossRef]
  44. Ashburner, M.; Ball, C.A.; Blake, J.A.; Botstein, D.; Butler, H.; Cherry, J.M.; Davis, A.P.; Dolinski, K.; Dwight, S.S.; Eppig, J.T.; et al. Gene ontology: Tool for the unification of biology—The gene ontology consortium. Nat. Genet. 2000, 25, 25–29. [Google Scholar]
  45. Carbon, S.; Ireland, A.; Mungall, C.J.; Shu, S.; Marshall, B.; Lewis, S. AmiGO: Online access to ontology and annotation data. Bioinformatics 2009, 25, 288–289. [Google Scholar] [CrossRef]
  46. Xie, C.; Mao, X.; Huang, J.; Ding, Y.; Wu, J.; Dong, S.; Kong, L.; Gao, G.; Li, C.-Y.; Wei, L. KOBAS 2.0: A web server for annotation and identification of enriched pathways and diseases. Nucleic Acids Res. 2011, 39, W316–W322. [Google Scholar]
  47. Storey, J.D.; Tibshirani, R. Statistical significance for genomewide studies. Proc. Natl. Acad. Sci. USA 2003, 100, 9440–9445. [Google Scholar] [CrossRef]
  48. Mao, X.; Cai, T.; Olyarchuk, J.G.; Wei, L. Automated genome annotation and pathway identification using the KEGG Orthology (KO) as a controlled vocabulary. Bioinformatics 2005, 21, 3787–3793. [Google Scholar] [CrossRef]
  49. Wu, J.; Mao, X.; Cai, T.; Luo, J.; Wei, L. KOBAS server: A web-based platform for automated annotation and pathway identification. Nucleic Acids Res. 2006, 34, W720–W724. [Google Scholar] [CrossRef]
  50. Vilella, A.J.; Severin, J.; Ureta-Vidal, A.; Heng, L.; Durbin, R.; Birney, E. EnsemblCompara GeneTrees: Complete, duplication-aware phylogenetic trees in vertebrates. Genome Res. 2009, 19, 327–335. [Google Scholar]
  51. Liang, C.; Jaiswal, P.; Hebbard, C.; Avraham, S.; Buckler, E.S.; Casstevens, T.; Hurwitz, B.; McCouch, S.; Ni, J.; Pujar, A.; et al. Gramene: A growing plant comparative genomics resource. Nucleic Acids Res. 2008, 36, D947–D953. [Google Scholar]
  52. Eveland, A.L.; Satoh-Nagasawa, N.; Goldshmidt, A.; Meyer, S.; Beatty, M.; Sakai, H.; Ware, D.; Jackson, D. Digital gene expression signatures for maize development. Plant Physiol. 2010, 154, 1024–1039. [Google Scholar] [CrossRef]
  53. Fu, H.; Dooner, H.K. Intraspecific violation of genetic colinearity and its implications in maize. Proc. Natl. Acad. Sci. USA 2002, 99, 9573–9578. [Google Scholar]
  54. Lai, J.; Li, R.; Xu, X.; Jin, W.; Xu, M.; Zhao, H.; Xiang, Z.; Song, W.; Ying, K.; Zhang, M.; et al. Genome-wide patterns of genetic variation among elite maize inbred lines. Nat. Genet. 2010, 42, 1027–1030. [Google Scholar]
  55. Shen, Y.; Zhang, Y.; Chen, J.; Lin, H.; Zhao, M.; Peng, H.; Liu, L.; Yuan, G.; Zhang, S.; Zhang, Z.; et al. Genome expression profile analysis reveals important transcripts in maize roots responding to the stress of heavy metal Pb. Physiol. Plant. 2012, 147, 270–282. [Google Scholar]
  56. Xiao, S.; Jia, J.; Mo, D.; Wang, Q.; Qin, L.; He, Z.; Zhao, X.; Huang, Y.; Li, A.; Yu, J.; et al. Understanding PRRSV infection in porcine lung based on genome-wide transcriptome response identified by deep sequencing. PLoS One 2010, 5, e11377. [Google Scholar]
  57. Gibson, G.; Riley-Berger, R.; Harshman, L.; Kopp, A.; Vacha, S.; Nuzhdin, S.; Wayne, M. Extensive sex-specific nonadditivity of gene expression in Drosophila melanogaster. Genetics 2004, 167, 1791–1799. [Google Scholar] [CrossRef]
  58. Charlesworth, D.; Willis, J.H. The genetics of inbreeding depression. Nat. Rev. Genet. 2009, 10, 783–796. [Google Scholar] [CrossRef]
  59. Guo, M.; Rupe, M.A.; Zinselmeier, C.; Habben, J.; Bowen, B.A.; Smith, O.S. Allelic variation of gene expression in maize hybrids. Plant Cell 2004, 16, 1707–1716. [Google Scholar]
  60. Birchler, J.A.; Riddle, N.C.; Auger, D.L.; Veitia, R.A. Dosage balance in gene regulation: Biological implications. Trends Genet. 2005, 21, 219–226. [Google Scholar] [CrossRef]
  61. Springer, N.M.; Stupar, R.M. Allelic variation and heterosis in maize: How do two halves make more than a whole? Genome Res. 2007, 17, 264–275. [Google Scholar] [CrossRef]
  62. Zhu, Y.; Fu, J.; Zhang, J.; Liu, T.; Jia, Z.; Wang, J.; Jin, Y.; Lian, Y.; Wang, M.; Zheng, J.; et al. Genome-wide analysis of gene expression profiles during ear development of maize. Plant Mol. Biol. 2009, 70, 63–77. [Google Scholar] [CrossRef]
  63. Qin, Y.F.; Fang, H.M.; Tian, Q.N.; Bao, Z.X.; Lu, P.; Zhao, J.M.; Mai, J.; Zhu, Z.Y.; Shu, L.L.; Zhao, L.; et al. Transcriptome profiling and digital gene expression by deep-sequencing in normal/regenerative tissues of planarian Dugesia japonica. Genomics 2011, 97, 364–371. [Google Scholar] [CrossRef]
  64. Mardis, E.R. The impact of next-generation sequencing technology on genetics. Trends Genet. 2008, 24, 133–141. [Google Scholar] [CrossRef]
  65. Livak, K.J.; Schmittgen, T.D. Analysis of relative gene expression data using real-time quantitative PCR and the 2−∆∆Ct method. Methods 2001, 25, 402–408. [Google Scholar]
  66. C’t Hoen, P.A.; Ariyurek, Y.; Thygesen, H.H.; Vreugdenhil, E.; Vossen, R.H.; de Menezes, R.X.; Boer, J.M.; van Ommen, G.J.B.; den Dunnen, J.T. Deep sequencing-based expression analysis shows major advances in robustness, resolution and inter-lab portability over five microarray platforms. Nucleic Acids Res. 2008, 36, e141. [Google Scholar] [CrossRef]
  67. Morrissy, A.S.; Morin, R.D.; Delaney, A.; Zeng, T.; McDonald, H.; Jones, S.; Zhao, Y.; Hirst, M.; Marra, M.A. Next-generation tag sequencing for cancer gene expression profiling. Genome Res. 2009, 19, 1825–1835. [Google Scholar] [CrossRef]
  68. Tatusov, R.L.; Fedorova, N.D.; Jackson, J.D.; Jacobs, A.R.; Kiryutin, B.; Koonin, E.V.; Krylov, D.M.; Mazumder, R.; Mekhedov, S.L.; Nikolskaya, A.N.; et al. The COG database: An updated version includes eukaryotes. BMC Bioinform. 2003, 4, 41. [Google Scholar]
  69. Consortium, T.G.O. The gene ontology project in 2008. Nucleic Acids Res. 2008, 36, D440–D444. [Google Scholar] [CrossRef]
  70. Kanehisa, M. The KEGG Database. In “In Silico”Simulation of Biological Processes; John Wiley & Sons: Manhattan, NY, USA, 2008; pp. 91–103. [Google Scholar]
  71. Marioni, J.C.; Mason, C.E.; Mane, S.M.; Stephens, M.; Gilad, Y. RNA-seq: An assessment of technical reproducibility and comparison with gene expression arrays. Genome Res. 2008, 18, 1509–1517. [Google Scholar] [CrossRef]
  72. Benjamini, Y.; Hochberg, Y. Controlling the false discovery rate: A practical and powerful approach to multiple testing. J. R. Stat. Soc. B 1995, 57, 289–300. [Google Scholar]

