2.1. Confirmation of the Rapidly Activating Delayed Rectifier Potassium Current (IKr) Identity and Stability
When 1 μM dofetilide, a specific
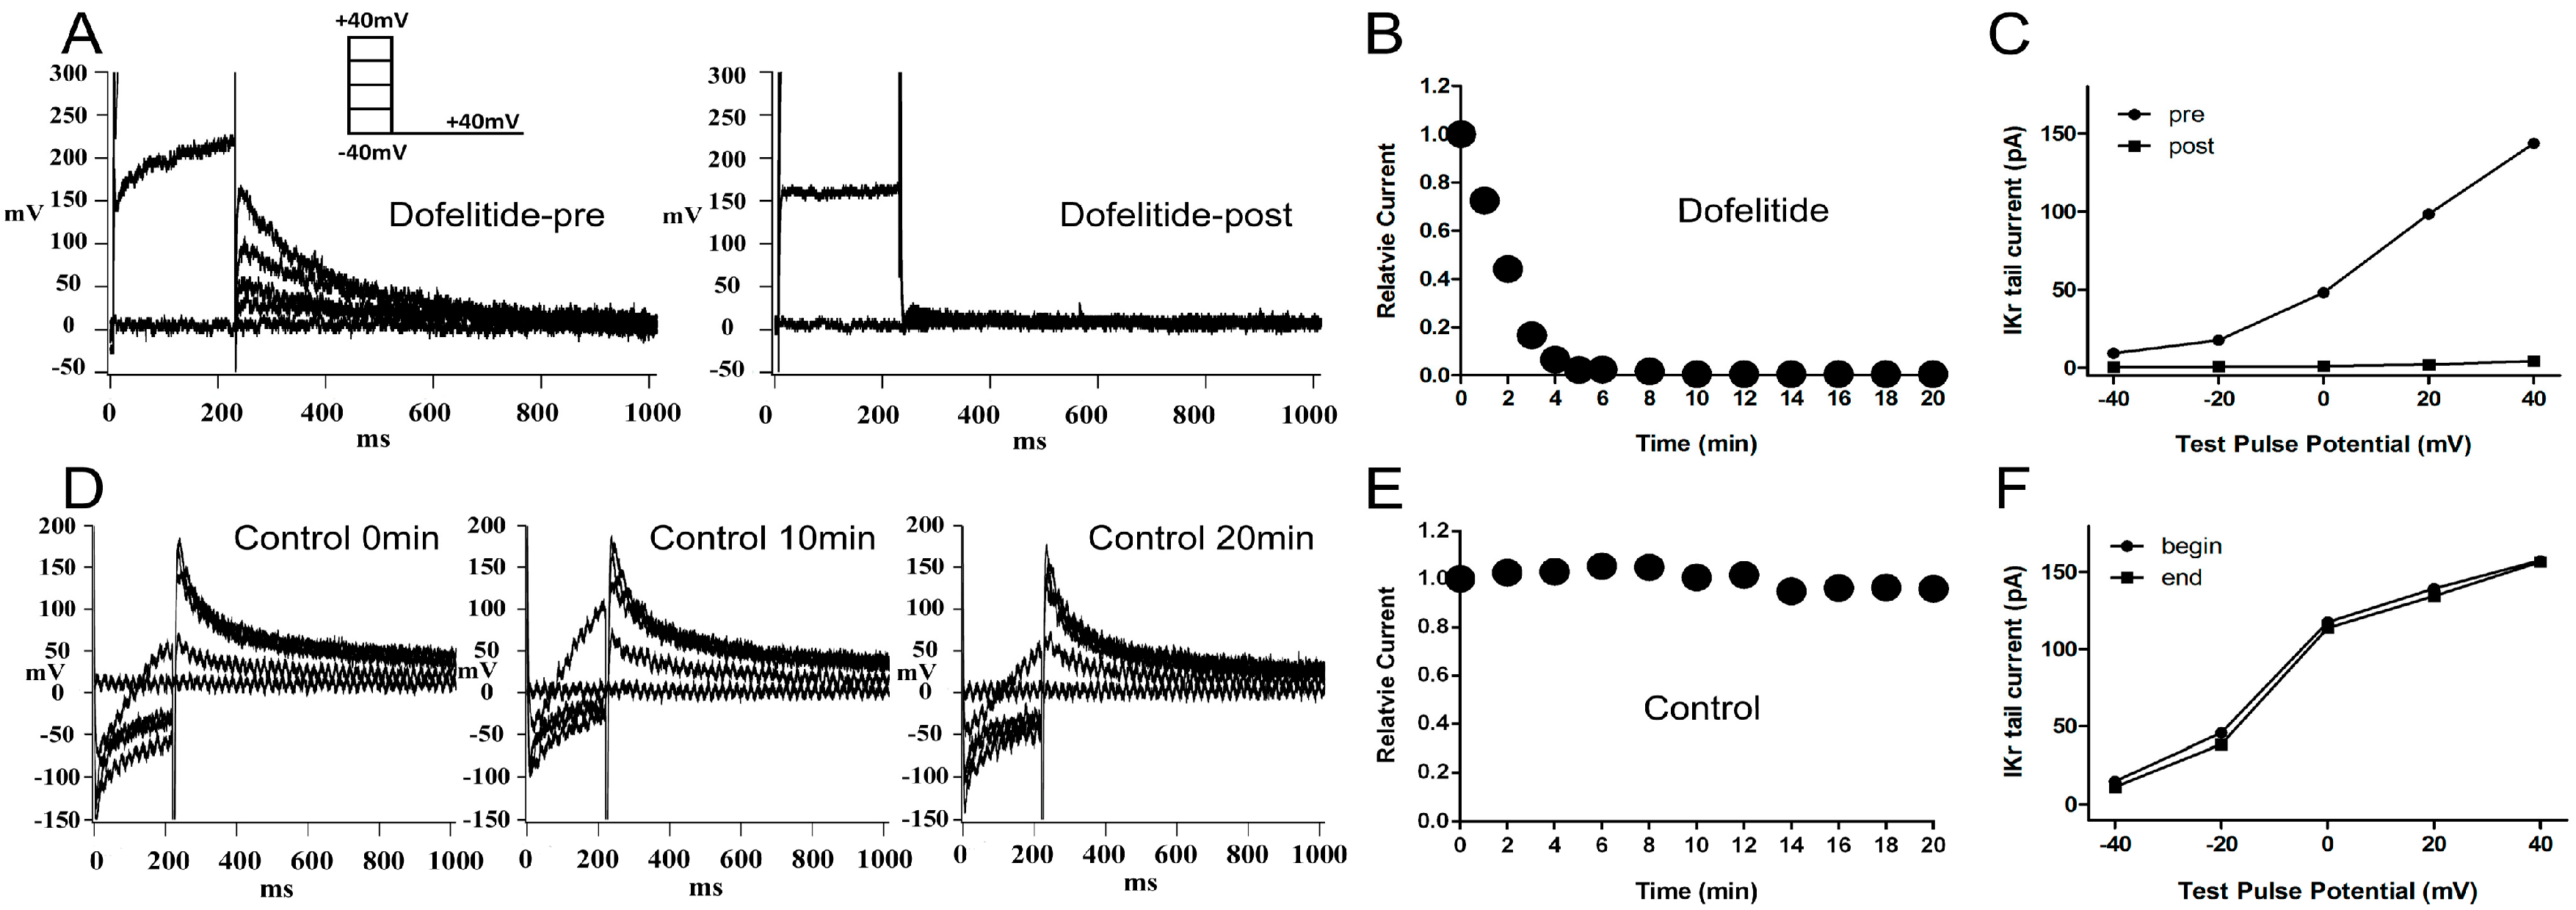
IKr blocker, was applied to the extracellular solution, the
IKr tail current was almost completely eliminated (
Figure 1A). The
IKr tail current at the return pulse of −40 mV after depolarizing to +40 mV, exhibited a marked time-dependent decrease to negligible levels within 10 min (
Figure 1B). We plotted the tail current-voltage relationship at 0 and 20 min during application of dofelitide (
Figure 1C) and found that the
IKr tail current was completely abolished by dofetilide. These data indicated that no other contaminating currents contributed to the
IKr tail current under our experimental conditions.
Figure 1.
Confirmation and stability of IKr current. (A) Representative original IKr tail currents recorded from the same left ventricular guinea pig myocyte before and 20 min after application of dofetilide (1 μM); (B) shows the representative trace of time-dependence of the relative current reduction by dofetilide; (C) The curve of IKr tail currents at different test pulse potential (I–V curve) before and after dofetilide application. (A–C) demonstrate the lack of contamination of the tail current by non-IKr currents under our experimental conditions; (D) Typical original IKr tail currents recorded over a 20-min period from a myocyte; (E,F) show the representative traces of time-dependence of the relative current and the I–V curve during myocyte superperfusion with control extracellular solution. (D–F) demonstrate that the IKr tail currents were stable within a timeframe of 20 min. Protocol I: holding potential −40 mV, test pulses from −40 to +40 mV in 20 mV increments (duration 225 ms), return pulse to −40 mV (duration 775 ms) to measure IKr tail currents. Unless specified otherwise, all IKr tail currents were induced by protocol I.
![Ijms 15 14220 g001]()
The
IKr tail current at the return pulse of −40 mV from a test potential of +40 mV, was stable for at least 20 min of perfusion with control extracellular solution (
Figure 1D,E). The tail current-voltage curves at 0 and 20 min were almost identical (
Figure 1F) indicating presence of minimal tail current rundown under our experimental conditions.
2.3. Cellular Electrophysiology Data of the Ppre + X Group
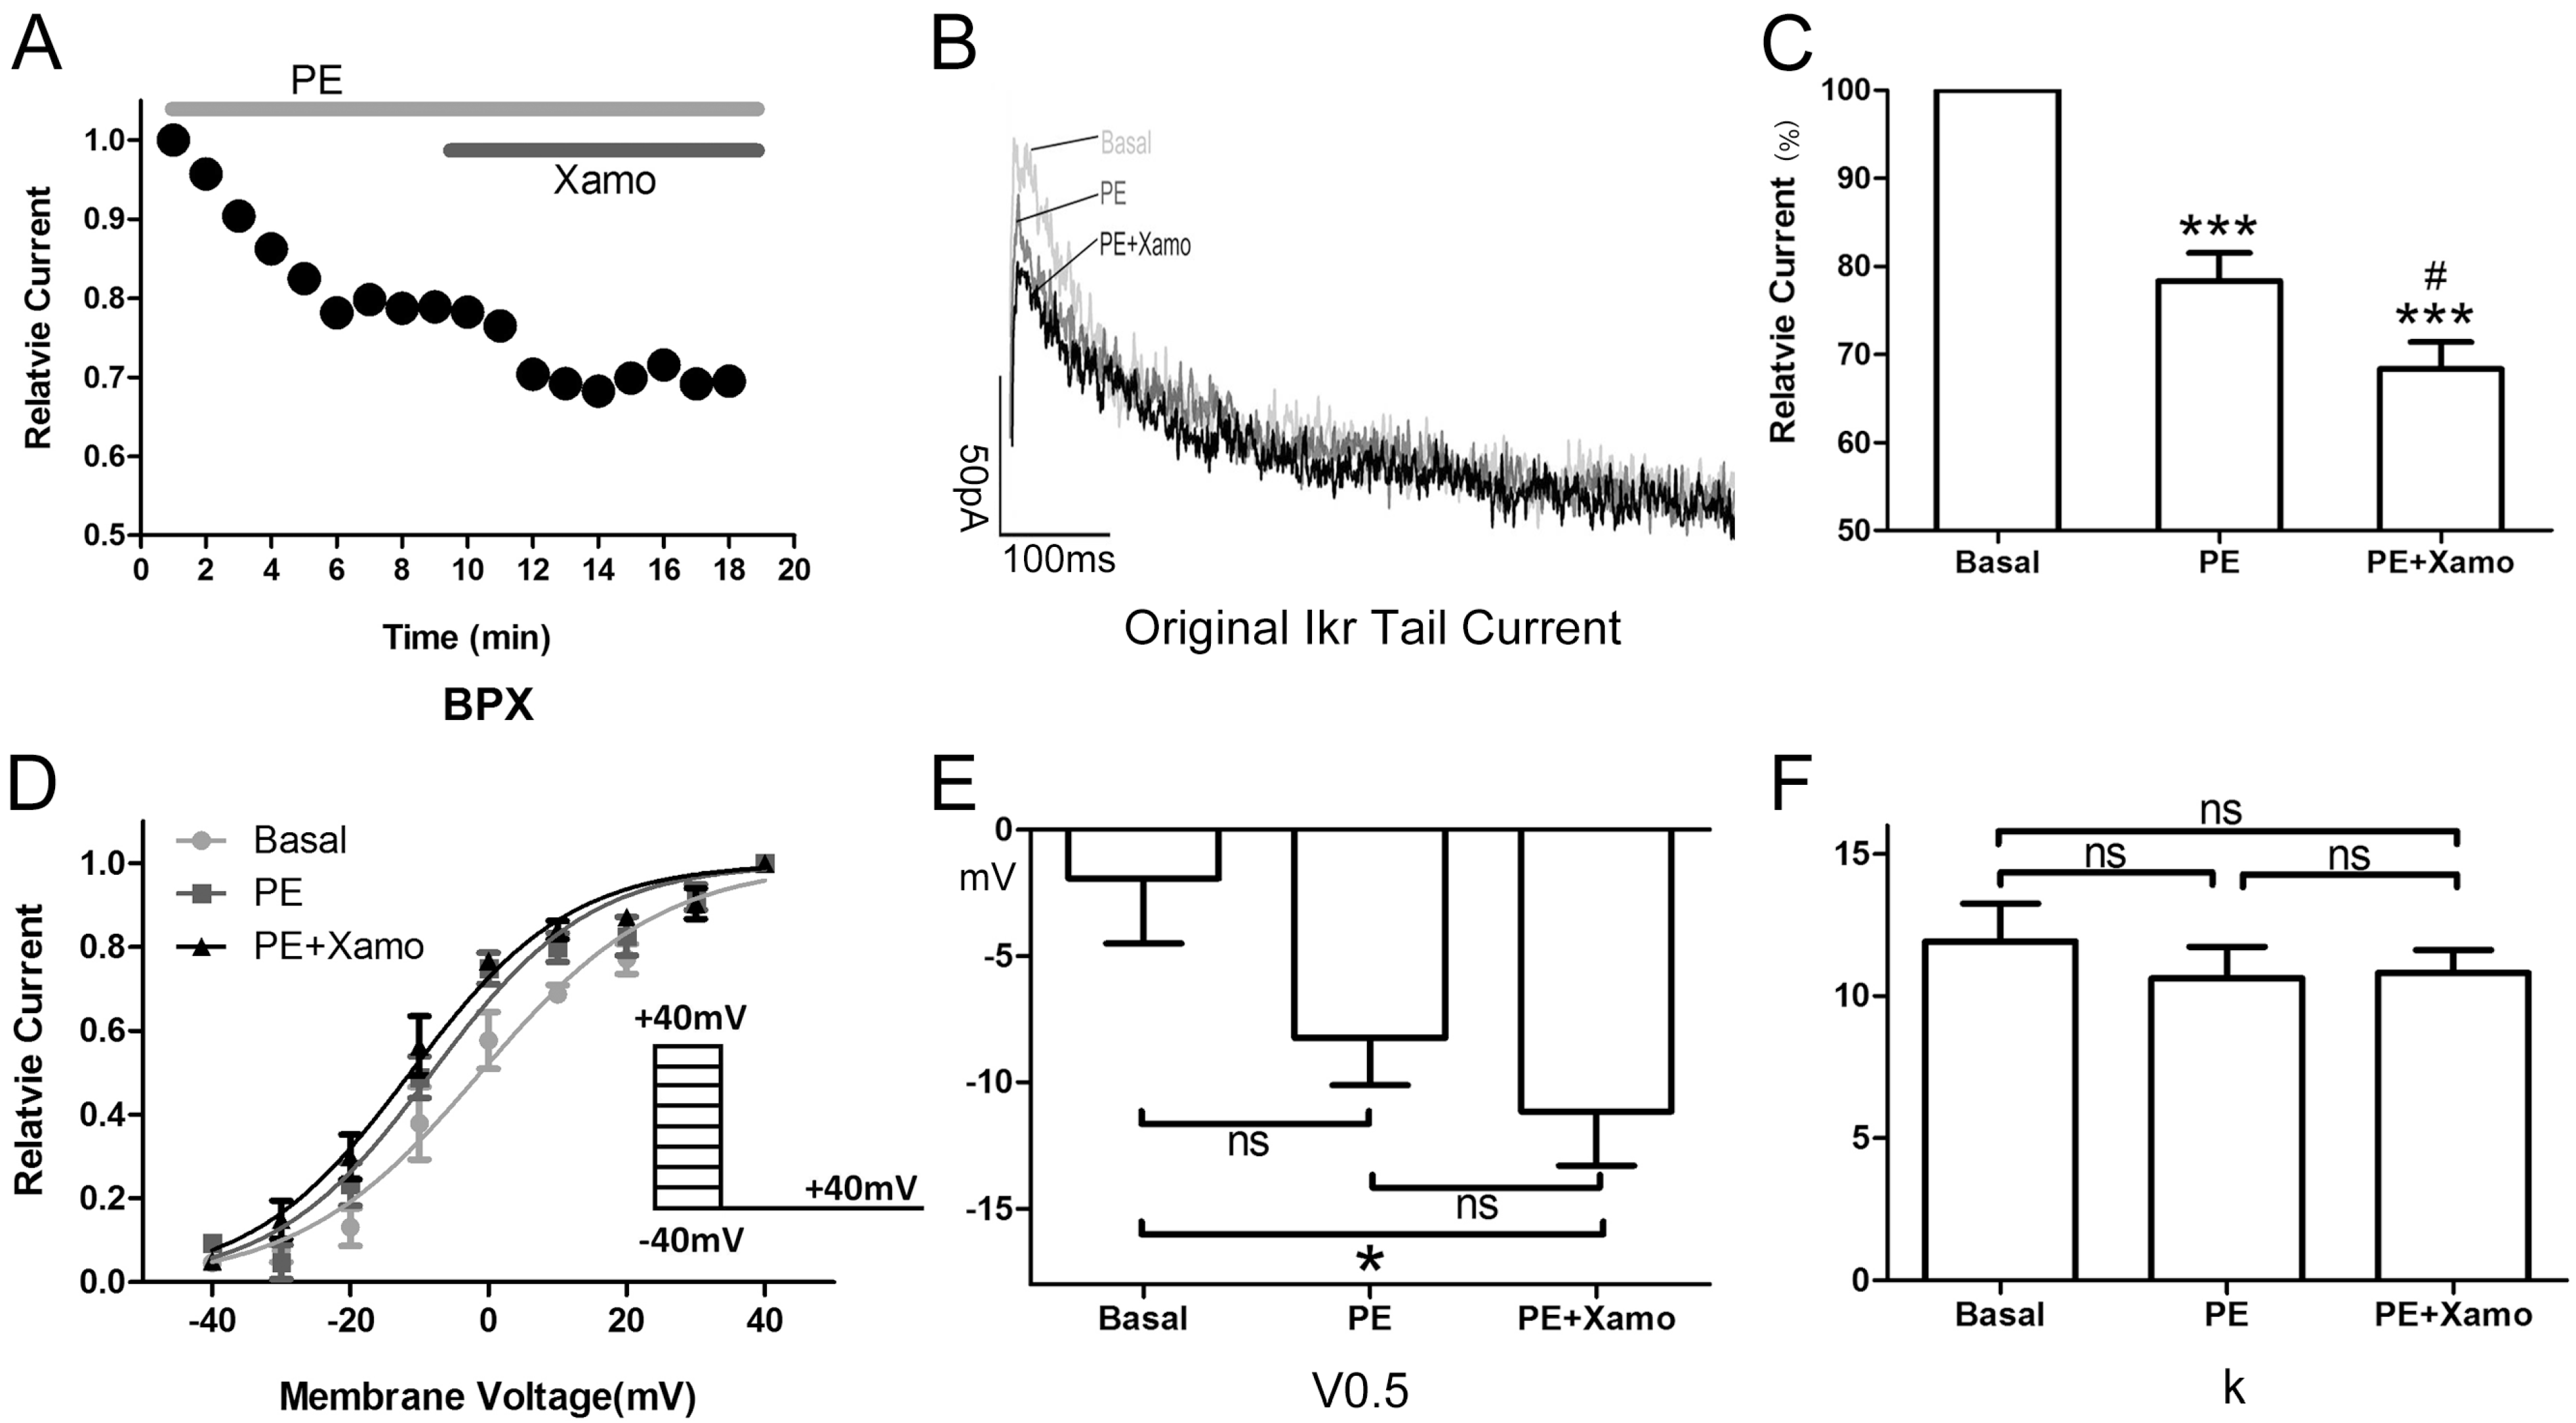
When myocytes were exposed to 1 μM PE alone, the
IKr tail current decreased rapidly, reaching a steady-state nadir within 4–6 min (
Figure 3A,B). After 9 min of PE exposure,
IKr tail current density measured at +40 mV decreased from 0.80 ± 0.04 to 0.62 ± 0.01 pA/pF, which means
IKr tail current decreased to (78.33 ± 3.19)% compaired to the basal
IKr tail current (
n = 7;
p < 0.001;
Figure 3C). Voltage-dependent activation of
IKr exhibited a trend towards a shift in the negative direction (
Figure 3D), with the half-maximal activation voltage (
V0.5) changing from −1.93 ± 2.58 to −8.24 ± 1.88 mV (
n = 7;
p = 0.06;
Figure 3E). Similarly, the change in slope factor (
k) from 11.92 ± 1.33 to 10.63 ± 1.10 (
n = 7;
p = 0.42;
Figure 3F) did not reach statistical significance. Co-application of Xamo decreased
IKr tail current density even further to 0.54 ± 0.01 pA/pF. This additional reduction in current density was significant when compared to baseline control levels (
n = 7;
p < 0.001;
Figure 3C) as well as to those achieved with PE alone (
n = 7;
p < 0.05;
Figure 3C). As such, during α
1-AR activation, the Xamo-mediated decrease was only 0.13 ± 0.01 (
n = 7;
Figure 7). The voltage-dependent activation curve of
IKr remained unchanged compared with PE alone (
n = 7,
Figure 3D), with
V0.5 changing to −11.15 ± 2.15 mV, (
n = 7;
p < 0.05, compared to the basal
V0.5;
Figure 3E), and
k changing to 10.82 ± 0.80 (
n = 7;
p = 0.49, compared to the basal
k;
Figure 3F).
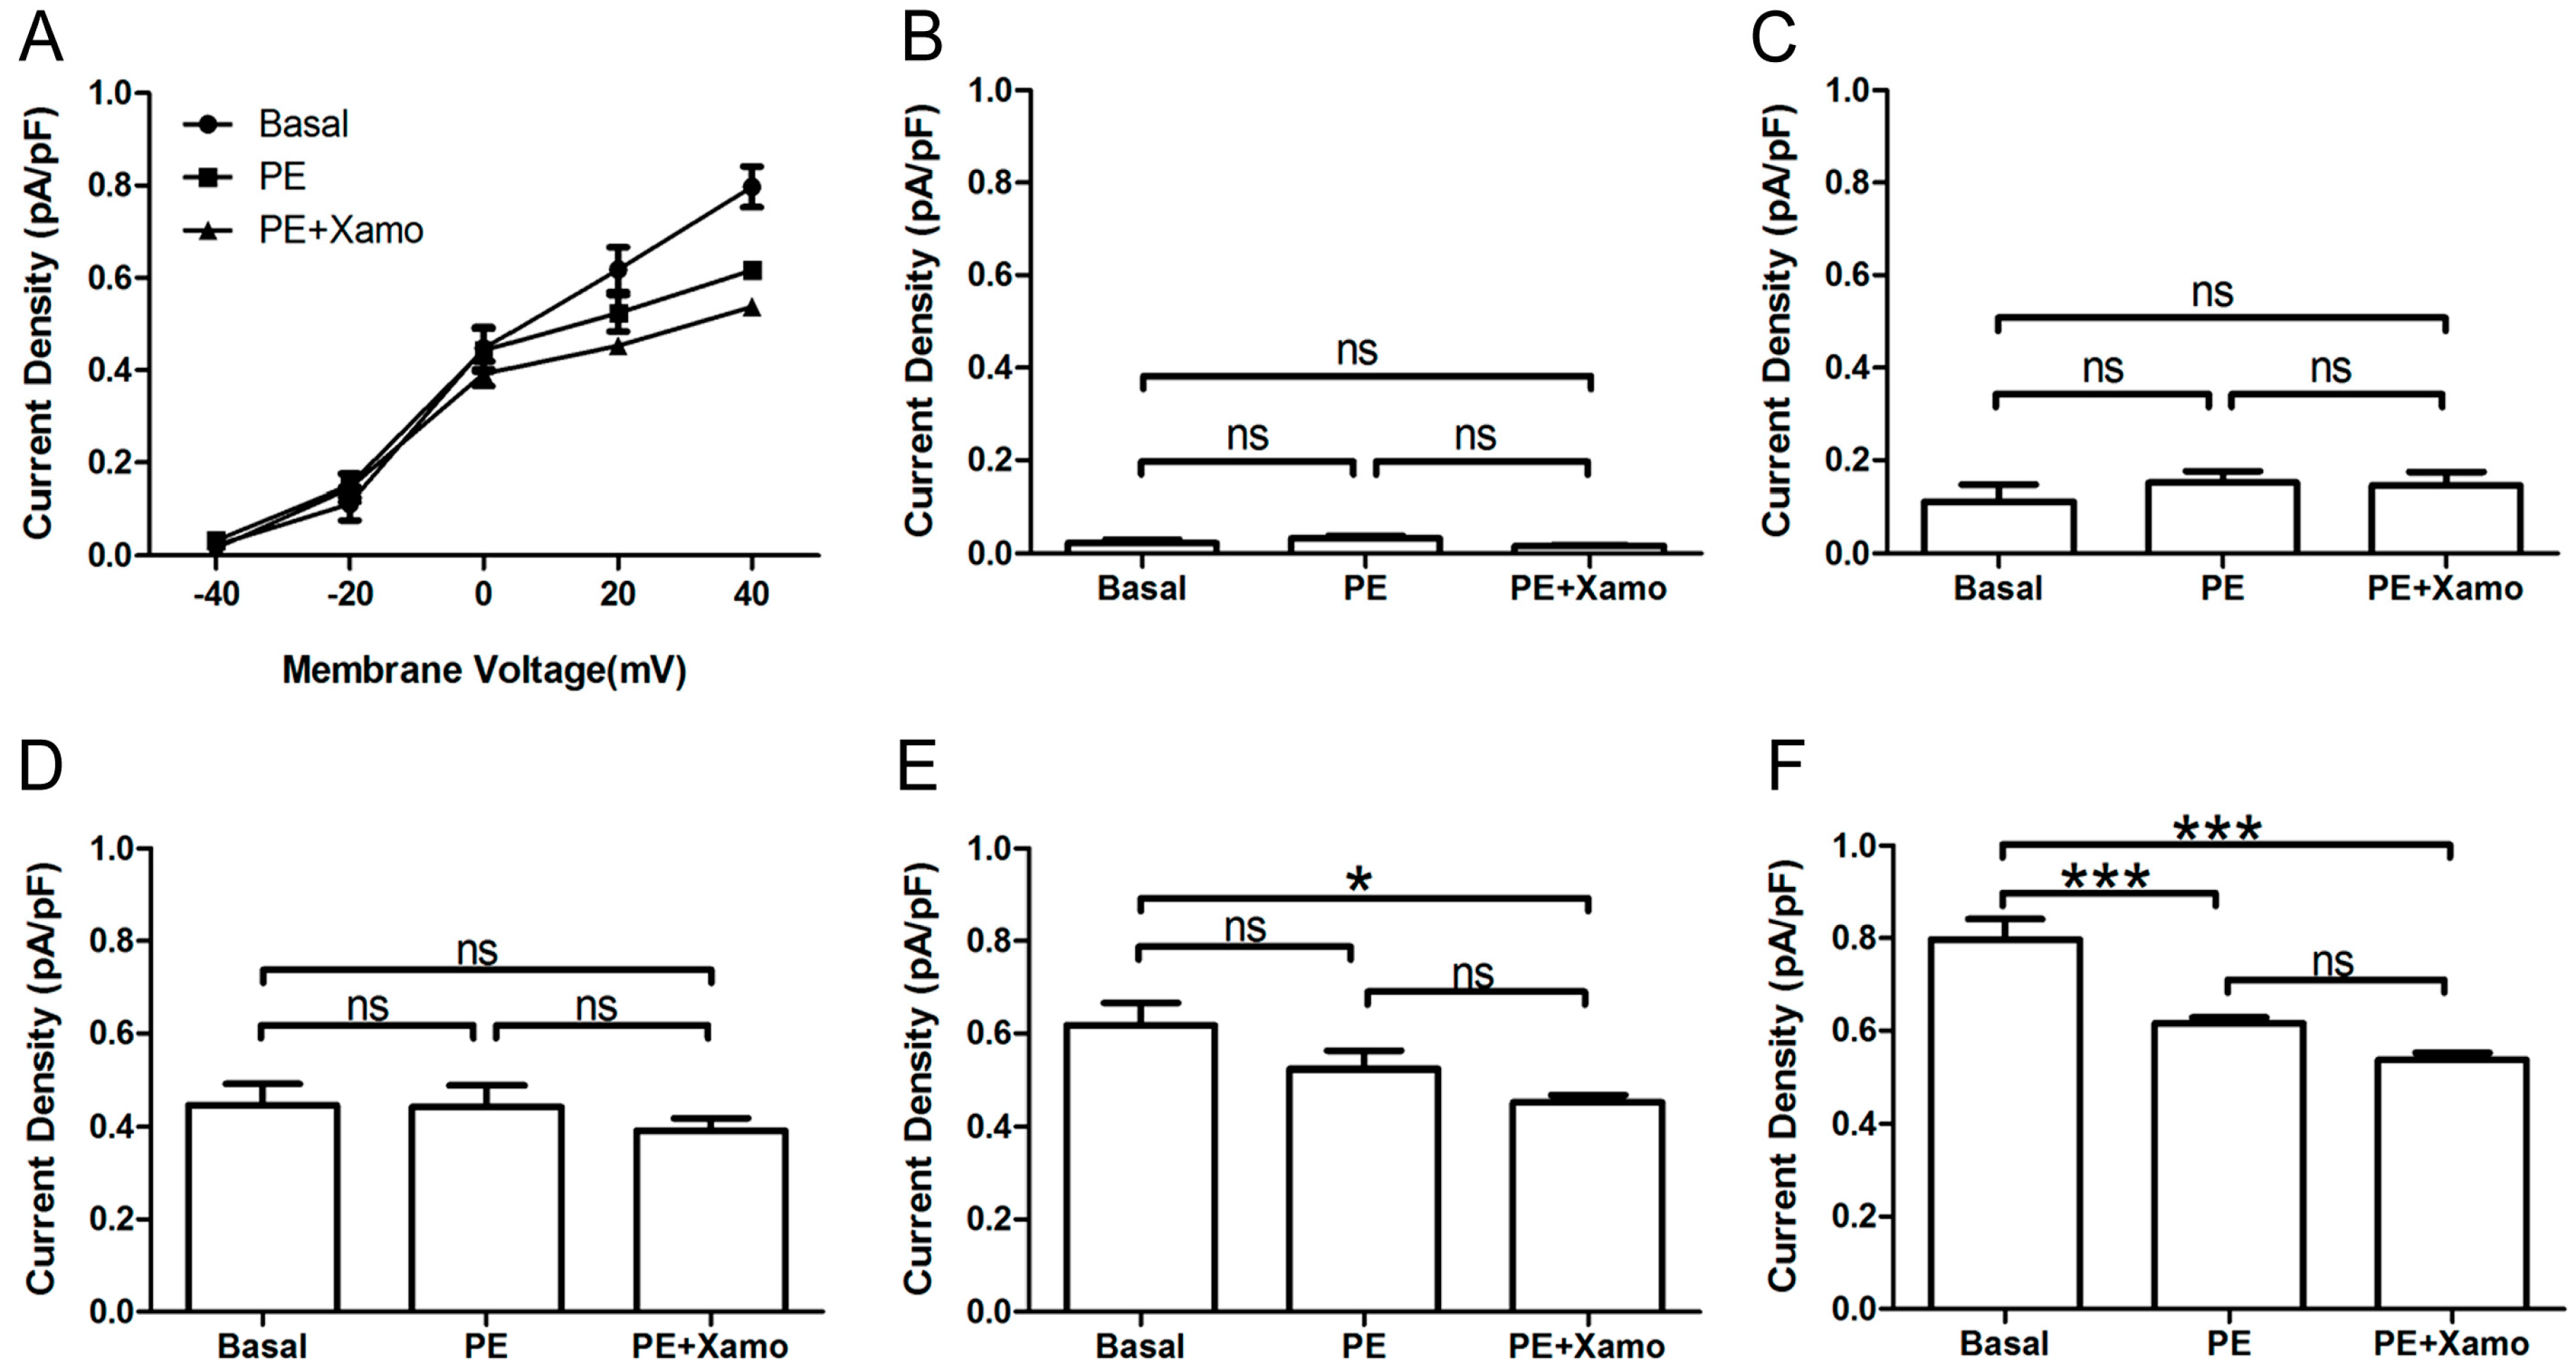
Shown in
Figure 4 are
IKr tail current density measurements obtained over a wide range of test voltages before and after treatment of myocytes with PE alone or combined PE + Xamo. Neither PE alone nor PE + Xamo were sufficient to alter
IKr tail current density compared to pre-treatment levels at −40, −20, and 0 mV. Interestingly, at +20 mV, the combined treatment (PE + Xamo) but not PE alone was associated with a significant reduction in tail current density (
n = 7;
p < 0.05;
Figure 4E). Finally, at +40 mV, both PE alone and PE + Xamo were sufficient to elicit significant reductions in tail current density as compared to basal pre-treatment levels (
n = 7; each
p value was less than 0.001;
Figure 4F).
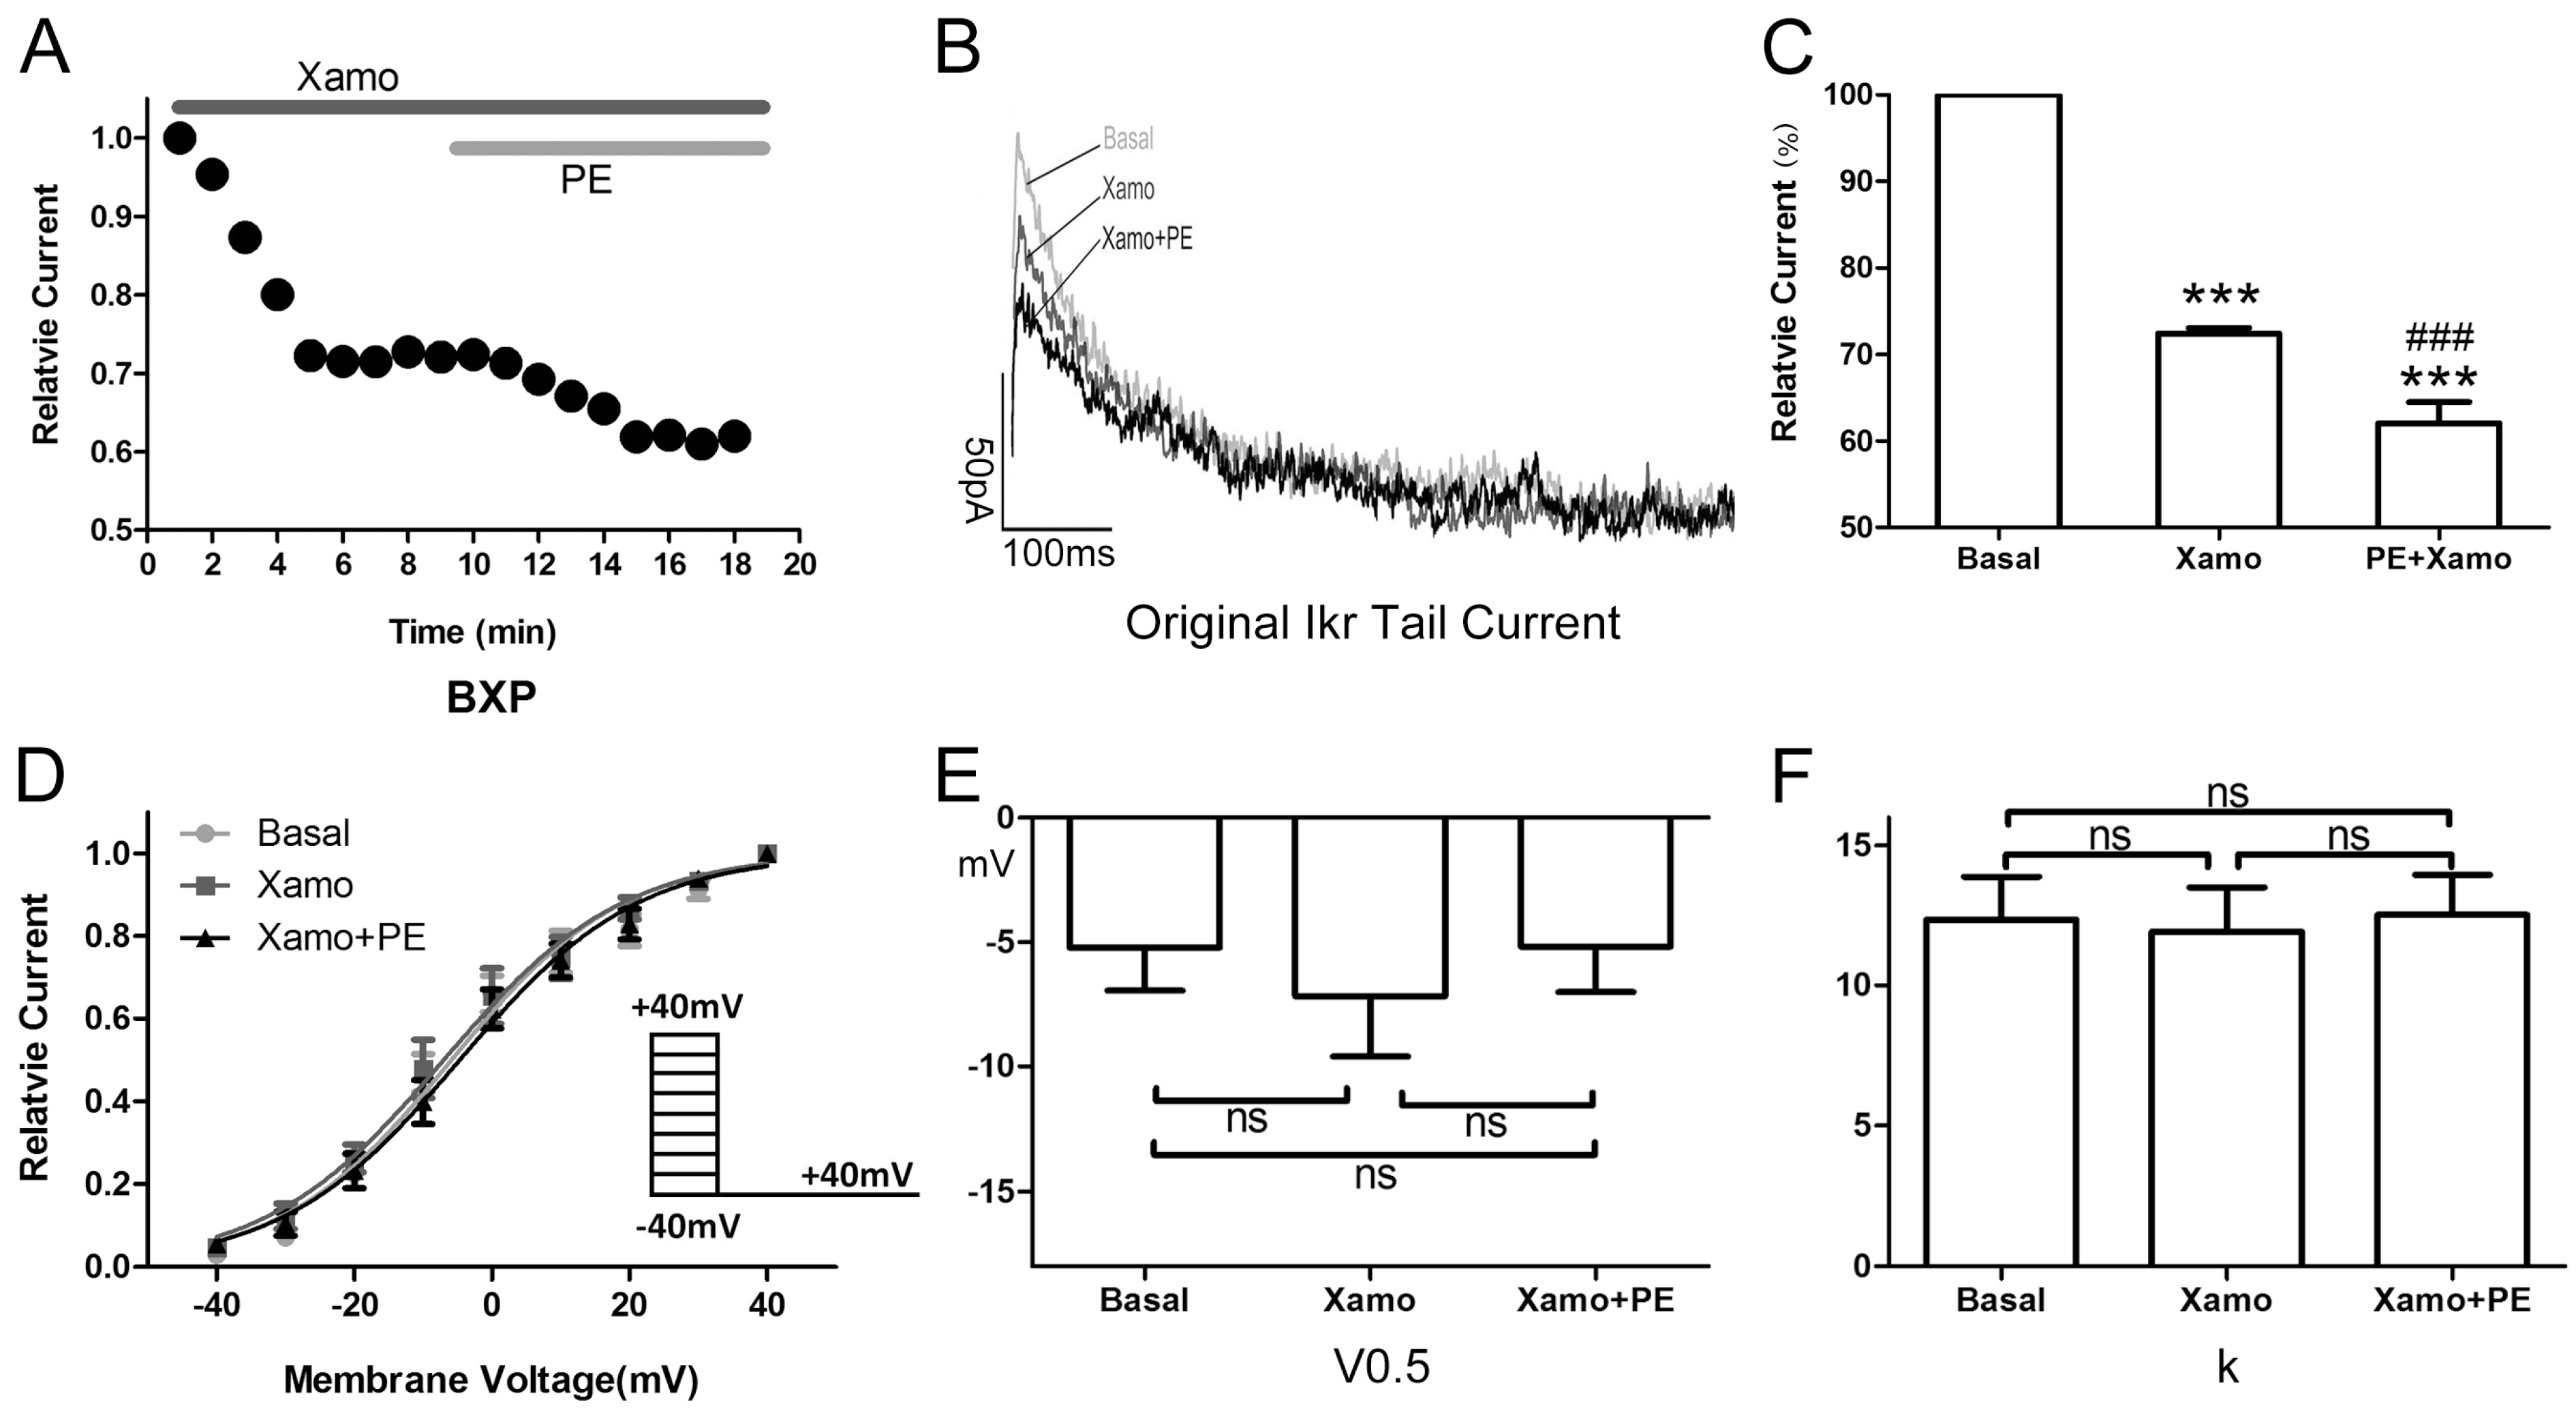
Figure 3.
Cellular electrophysiology data of the Ppre + X group; (A) shows the representative traces of time-dependence of the relative current reduction by phenylephrine (PE, 1 μM) and combined PE plus Xamo (Xamo, 10 μM); (B) Typical original IKr tail currents recorded at return pulse after depolarizing to +40 mV at basal conditions and after application of PE and PE + Xamo; (C) Comparison of the relative current at baseline, following 9-min exposure to PE, and following 9-min exposure to PE + Xamo (n = 7; *** p < 0.001, vs. basal; # p < 0.05, vs. PE); (D) The plots of Itail/Itail.max vs. membrane voltage at three different conditions, fit with the single-power Boltzmann equation: Itail = Itail.max/[1 + exp(V0.5 − V)/k], reflecting the activation kinetics. Here, IKr tail currents were induced by protocol II: holding potential −40 mV, test pulses from −40 to +40 mV in 10 mV increments (duration 225 ms), return pulse to −40 mV (duration 775 ms); (E,F) V0.5 and k of the myocytes measured at three different conditions (n = 7). “ns” indicates “not significant”; * indicates p < 0.05).
![Ijms 15 14220 g003]()
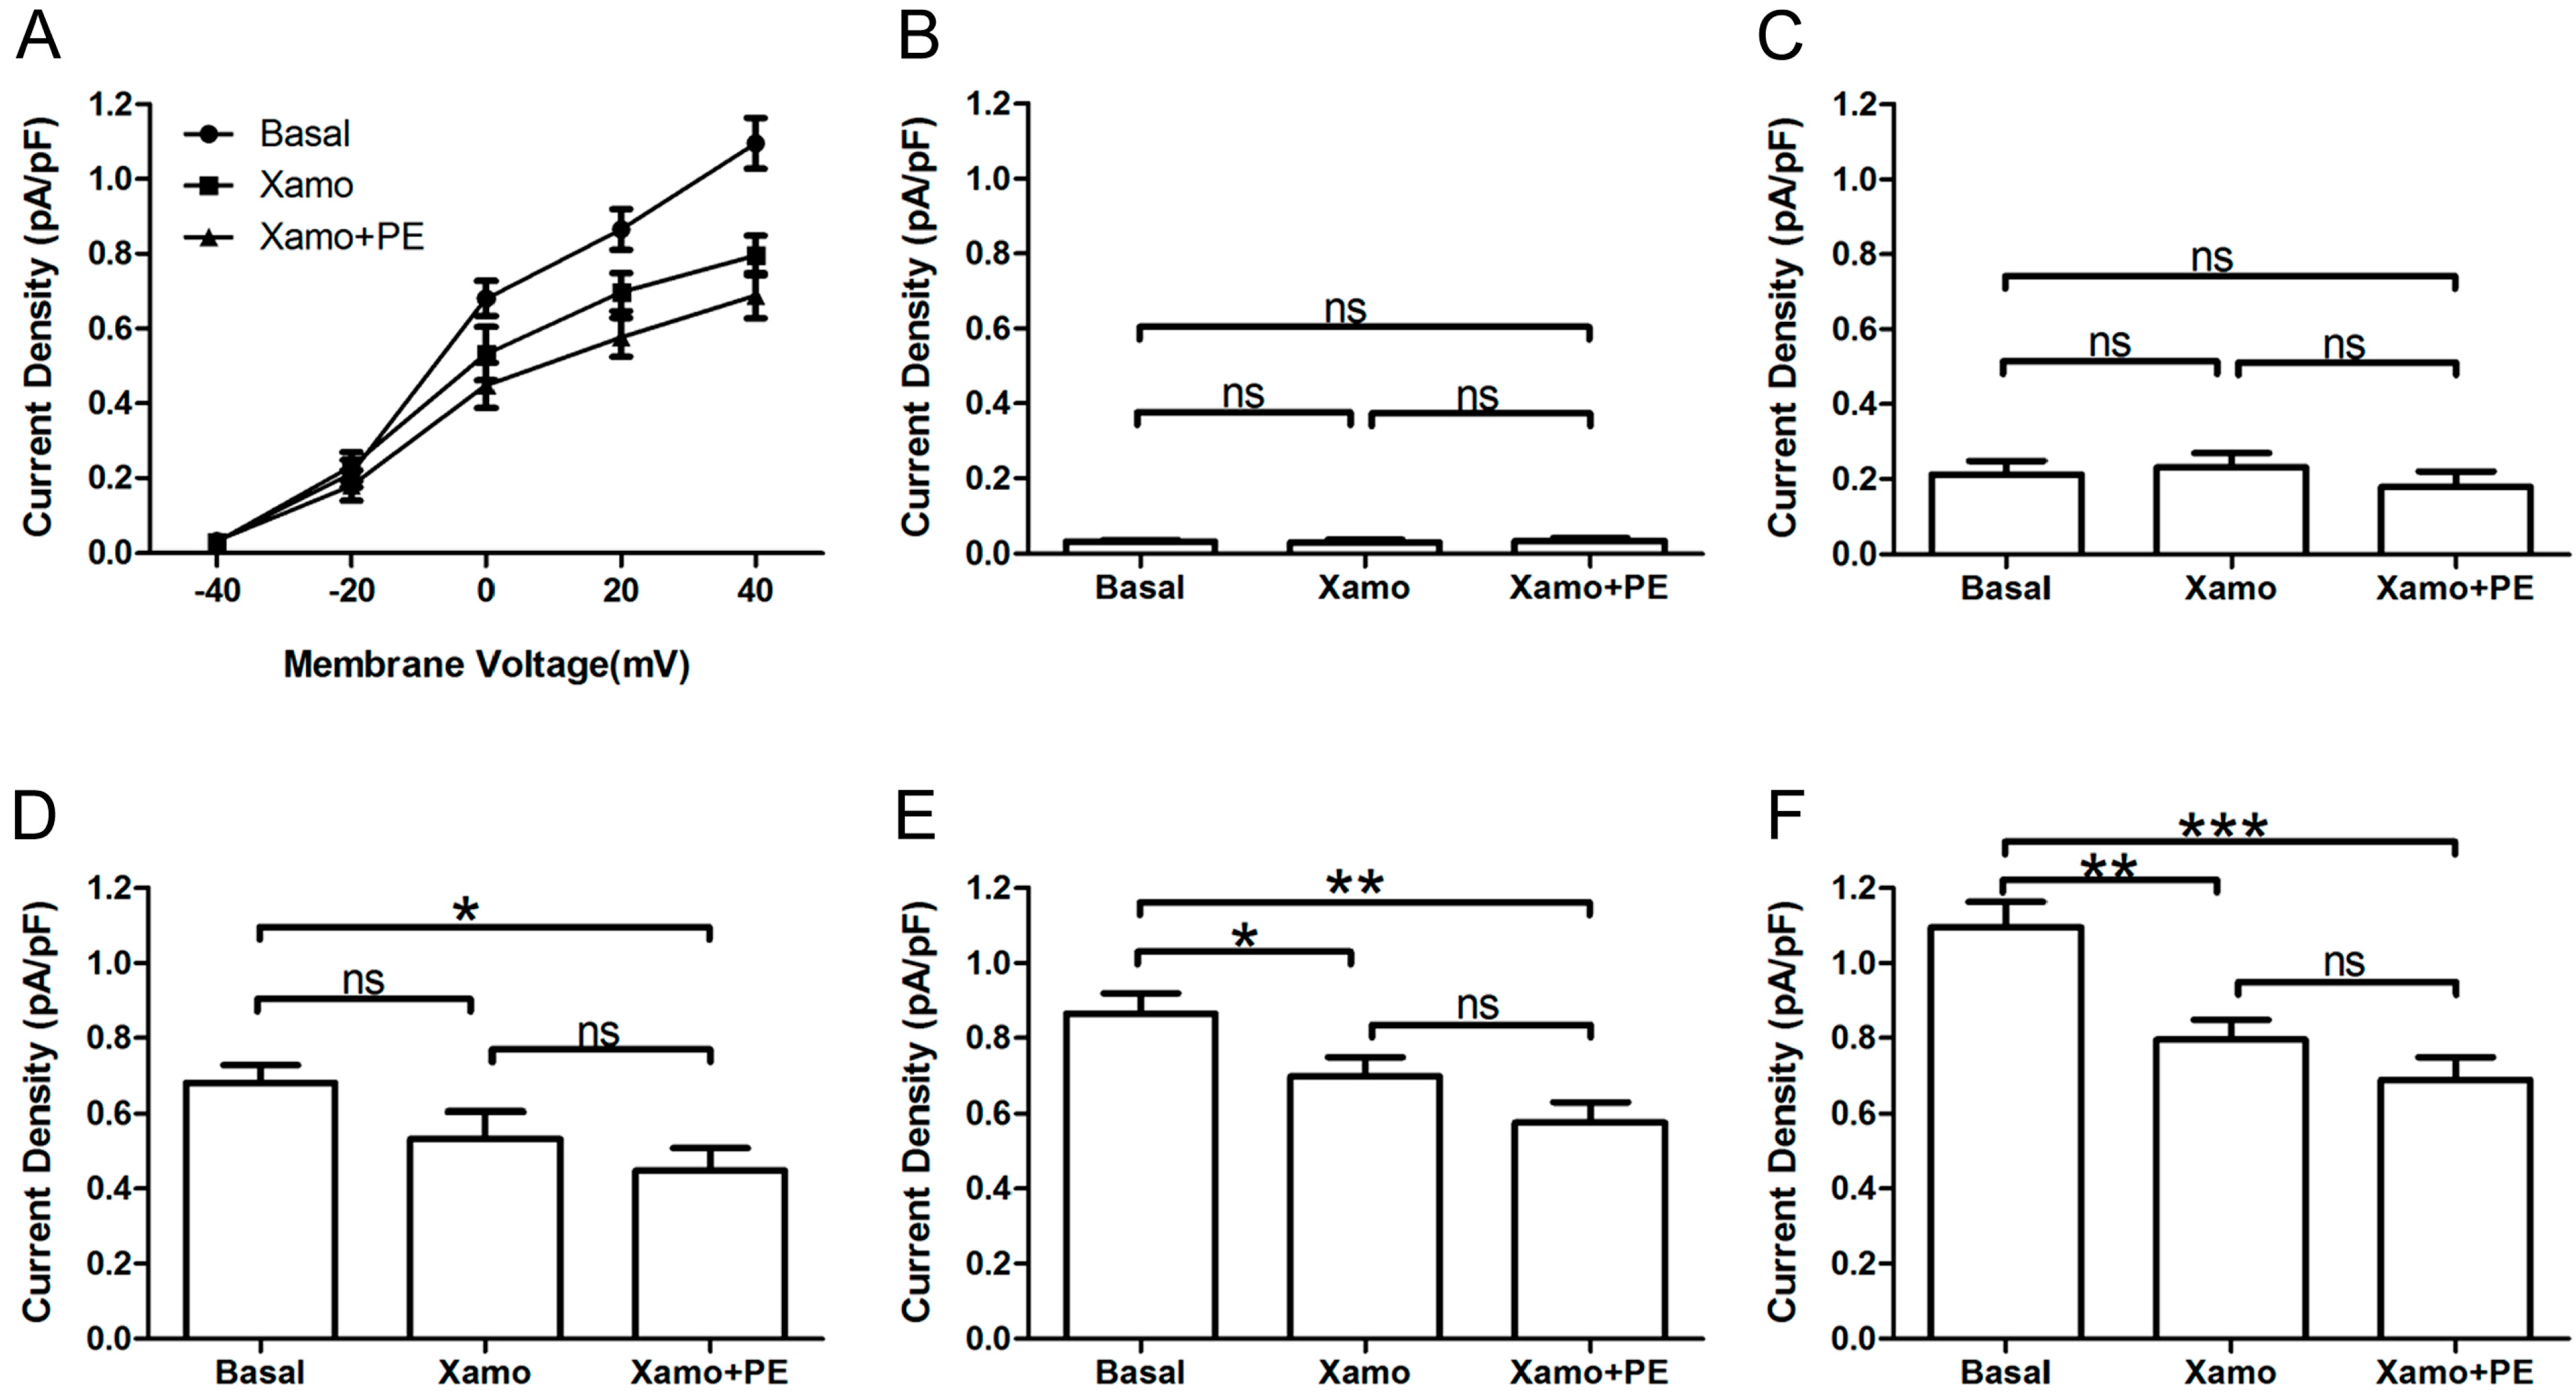
Figure 4.
IKr tail currents at different depolarization levels in group Ppre + X group. (A) IKr tail current densities (pA/pF) measured at different membrane voltages before and after treatment with PE alone or PE + Xamo; (B–F) Comparison of IKr tail current densities at baseline and following PE alone and PE + Xamo treatment. IKr tail currents were seperately measured when the test pulse was at −40, −20, 0, +20, and +40 mV (n = 7). “ns” indicates “not significant”; * p < 0.05; *** p < 0.001.
2.4. Cellular Electrophysiological Data of the Xpre + P Group
When exposed to 10 μM Xamo alone, the
IKr tail current decreased rapidly, reaching steady-state after 4–6 min (
Figure 5A,B). At the end of 9 min of drug exposure,
IKr tail current density was reduced from 1.09 ± 0.07 to 0.80 ± 0.05 pA/pF at +40 mV, which means
IKr tail current decreased to (72.43 ± 0.64)% compaired to the basal
IKr tail current (
n = 7;
p < 0.001;
Figure 5C). In other words, the Xamo-induced decrease was about 0.28 ± 0.01 (
n = 7;
Figure 7). The voltage-dependent curve of
IKr activation exhibited a modest shift in the negative direction (
Figure 5D), with
V0.5 changing from −5.22 ± 1.73 to −7.17 ± 2.43 mV (
n = 7;
p = 0.50;
Figure 5E), while
k shifted from 12.35 ± 1.54 to 11.93 ± 1.57 (
n = 7;
p = 0.85;
Figure 5F). Co-application of 1 μM PE decreased the
IKr tail current further within 5 min (
Figure 5A,B). The
IKr tail current density changed to 0.69 ± 0.06 pA/pF at +40 mV, and was about (62.03 ± 2.43)% of the basal
IKr tail current (
n = 7;
p < 0.001;
Figure 5C), and (85.56 ± 2.94)% of the
IKr tail current measured with 10 μM Xamo alone (
n = 7;
p < 0.001;
Figure 5C). As such, under conditions of β
1-adrenergic activation, the PE-induced decrease in tail current amplitude was only 0.14 ± 0.03 (
n = 7;
Figure 7) of the basal level. The voltage-dependent curve of
IKr activation almost remained unchanged (
n = 7,
Figure 5D), with
V0.5 changing to −5.19 ± 1.83 mV (
n = 7;
p = 0.99
vs. basal group and
p = 0.50
vs. Xamo group;
Figure 5E), and
k changing to 12.52 ± 1.44 (
n = 7;
p = 0.94
vs. basal group and
p = 0.79
vs. Xamo group;
Figure 5F).
Furthermore, the
IKr tail currents at different depolarization levels were tested and compared before and after exposure of myocytes to PE alone or PE + Xamo (
Figure 6A). As shown in
Figure 6B,C, the
IKr tail currents measured at −40 and −20 mV did not exhibit statistical differences across groups (
n = 7). At 0 mV, exposure of myocytes to combined PE + Xamo but not PE alone resulted in a significant reduction in current density compared to basal pretreatment levels (
n = 7;
p < 0.05;
Figure 6D). In contrast, at +20 and the
IKr tail current was statistically different to basal one at +20 and +40 mV, both PE alone as well as PE + Xamo were sufficient to elicit significant decreases in current density as compared to basal pretreatment levels (
n = 7; all
p value was less than 0.05;
Figure 6E,F).
Figure 5.
Cellular electrophysiology data of the Xpre + P group. (A) shows the representative traces of time-dependence of the relative current reduction by xamoterol (Xamo, 10 μM) and combined Xamo plus phenylephrine (PE, 1 μM); (B) Typical original IKr tail currents recorded at return pulse after depolarizing to +40 mV at basal conditions and after application of Xamo and Xamo + PE; (C) Comparison of the relative current at baseline, following 9-min exposure to Xamo, and 9-min exposure to Xamo + PE (n = 7; *** p < 0.001, vs. basal; ### p < 0.001, vs. Xamo); (D,E,F) The plots of Itail/Itail.max vs. membrane voltage under three different conditions, fitting with Blotzmann equation, and V0.5 and k of the myocytes measured under three different conditions (n = 7). “ns” indicates “not significant”.
2.5. Comparison of Effects by Different Adrenergic Activation
As shown in
Figure 7A, α
1-adrenergic activation-induced inhibition of
IKr tail current was less than β
1-adrenergic activation-induced inhibition (0.22 ± 0.03 & 0.28 ± 0.01), but the difference between the two groups did not reach statistical significance (
n = 7;
p = 0.08). Similarly, the minor activation shifts in terms of
V0.5 and
k values were comparable across groups (
n = 7;
Figure 7B,C). However, the α
1-AR induced inhibition of
IKr tail current significantly differed in cells that were pre-incubated with the β
1-AR agonist compared to control (
i.e., otherwise unstimulated myocytes (
n = 7; 0.22 ± 0.03 & 0.14 ± 0.03,
p < 0.05;
Figure 7A). Moreover, while the activation shift in terms of
V0.5 induced by concomitant α
1- and β
1-AR stimulation was significantly different (
n = 7; (−6.35 ± 1.53) & (1.98 ± 1.52) mV,
p < 0.01;
Figure 7B) compared to α
1-AR stimulation alone, the corresponding
k values did not show statistical differences between the two groups (
n = 7; −1.13 ± 1.42 & 0.60 ± 0.73;
Figure 7C). Similarly, the β
1-AR activation-induced inhibition of
IKr tail current significantly differed between unstimulated (control)
vs. α
1-AR stimulated myocytes (
n = 7; 0.28 ± 0.01 & 0.13 ± 0.01,
p < 0.001;
Figure 7A). Finally, the activation shift in terms of
V0.5 and
k values did not show any statistically significant differences (
n = 7; (−1.95 ± 2.22) & (−2.82 ± 1.28) mV, and (−0.42 ± 1.26) & (−0.07 ± 0.54) mV;
Figure 7B,C).
Figure 6.
IKr tail currents at different depolarization level in group Xpre + P group. (A) The IKr tail current densities (pA/pF) at different membrane voltages under three different conditions; (B–F) Comparison of IKr tail current densities under three different conditions, at return pulse after depolarizing to −40, −20, 0, +20, and +40 mV separately (n = 7). “ns” indicates “not significant”; * p < 0.05; ** p < 0.01; *** p < 0.001).
2.6. Discussion
The main findings of the present report are as follows: (1) acute activation of α1-ARs produce comparable effects on IKr tail current density to β1-ARs; (2) acute activation of α1-AR in the presence of β1-AR activation elicits a minor decrease in IKr tail current, which is statistically different from that achieved by α1-AR activation alone; (3) similarly, acute activation of β1-AR in the presence of α1-AR activation induces a very small decrease in IKr tail current, which again is statistically different from that achieved by β1-AR activation alone. The blunted IKr response to concomitant adrenergic activation is suggestive of a protective feedback regulatory mechanism that acts to maintain the IKr tail current density in the wake of excessive catecholamine stress, modeled in vitro in our study as combined PE and Xamo exposure.
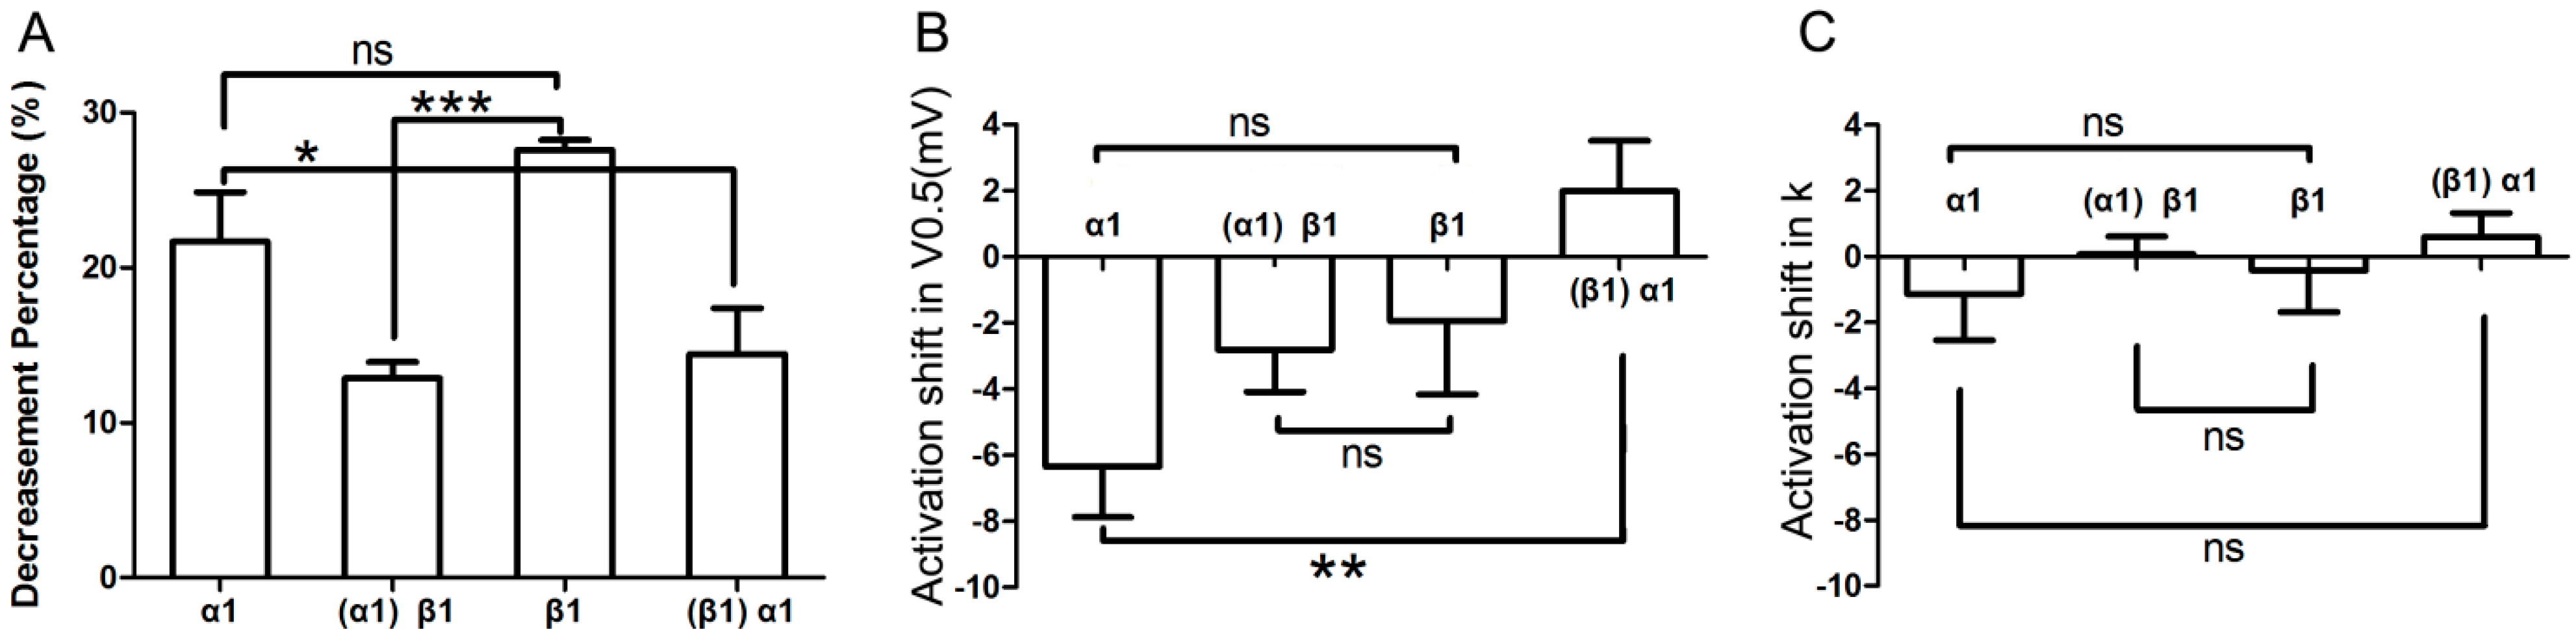
Figure 7.
Comparison of effects by different adrenergic activation. (A) Comparison of the decrease in IKr tail current after application of various AR agonists. Column α1 represents the percent decrease in IKr tail current by application of α1-AR agonist alone; and column (α1)β1 represents the β1-AR mediated percent decrease of IKr after pre-activation of α1-AR; similarly, column β1 stands for β1-AR alone; column (β1)α1 stands for α1-AR mediated percent inhibition of IKr after pre-stimulation of β1-AR (n = 7); (B,C) Comparison of activation shifts in corresponding V0.5 and k under different conditions. The four columns, α1, (α1)β1, β1, and (β1)α1 represent conditions of α1-AR activation alone, β1-AR activation in presence of α1-AR activation, β1-AR activation alone, and α1-AR activation in presence of β1-AR, respectively (n = 7). “ns” indicates “not significant”; * p < 0.05; ** p < 0.01; *** p < 0.001.
In the present study, the finding that PE or Xamo is able to decrease the
IKr tail current via stimulation of α
1-ARs or β
1-ARs is consistent with previous reports [
5,
7,
9,
17,
18,
19,
20], including our own published work [
21] in HEK-293 cells, CHO cells,
Xenopus oocytes, and native ventricular cardiomyocytes. The
IKr tail current exhibits a concentration-dependent decrease after acute stimulation of α
1-ARs or β
1-ARs within 4–6 min, reaching steady-state levels within 7–9 min. Our choice of drug concentrations was guided by previous work, in which we determined the IC
50 values of PE and Xamo to be approximately 0.9 and 6.4 μM, respectively [
22]. The
IKr tail current induced by depolarization to +40 mV was 0.78 ± 0.03 or 0.72 ± 0.01 of the basal
IKr tail current after application of 1 μM PE or 10 μM Xamo, respectively (
p < 0.05). The
IKr tail current activation curve exhibited a minor shift in the repolarizing direction in response to α
1-AR stimulation that was comparable to that achieved by β
1-AR activation (
Figure 5B,C), suggesting that the gating kinetics of the
hERG channel was not markedly affected by acute α
1-AR or β
1-AR stimulation separately. Characterized by slow activation and deactivation kinetics, and rapid voltage-dependent inactivation and recovery from inactivation kinetics,
IKr encoded by
hERG is indeed a critical component of action potential repolarization in both atrial and ventricular myocytes of most species, including humans [
2,
3,
23,
24]. Thus, excessive
IKr inhibition causes marked repolarization delays that result in prolongation of the action potential at the cellular level, and the QT-interval of the electrocardiogram at the body surface level; thereby promoting the incidence of arrhythmogenic early afterdepolarizations, and polymorphic ventricular tachycardia. As such, our
in vitro findings have direct relevance to clinical scenarios, in which patients with inherited or acquired long QT syndrome (LQTS) experience stress-related arrhythmias, in many cases leading to sudden cardiac death.
Of note, co-application of both β1- and α1-AR agonists resulted in a relatively small additional inhibitory effect on IKr tail current compared to the selective activation of either receptor alone. Importantly, however, the decrease in IKr tail current produced by PE in the presence of Xamo was significantly different from that achieved by α1-AR activation alone (0.14 ± 0.03 vs. 0.22 ± 0.03, p < 0.05). Similarly, the decrease in IKr tail current by β1-AR stimulation in the wake of α1-AR activation was significantly different from that produced by β1-AR activation alone (0.13 ± 0.01 vs. 0.28 ± 0.01, p < 0.001). This suggests that pre-activation of β1-ARs markedly suppresses the inhibitory effect of α1-AR activation on IKr tail current, and that pre-activation of α1-ARs produces an even stronger modulatory effect on the inhibition of IKr by β1-AR. Indeed, pre-activation of one adrenoreceptor subclass dramatically restricts the inhibitory effect of the other subclass on IKr tail current. As such, there appears to be significant cross-talk in the regulation of IKr by acute adrenergic stimulation of AR receptors. We propose that this tight regulatory mechanism acts to protect against excessive IKr inhibition, and therefore action potential prolongation, under conditions of extreme stress and associated catecholamine release.
Acute nonselective α
1-AR activation suppresses the positive inotropic effect of β-AR activation and associated cAMP generation [
25]. Under certain conditions, α
1- and β-AR signaling pathways exhibit synergistic effects [
26]. Moreover, α
1- and β-AR interactions modulate the L-type calcium current [
27], and sustained activation of PKC-epsilon leads to a blunted response of the current to α
1- and β-AR signaling [
28]. In addition, PKC activation cross-activates PKA to modulate the cardiac Na
+ current [
12]. Moreover, both PKA and PKC regulate the cardiac
IKs in a mutually exclusive manner [
13], and the channel phosphorylation by PKA cross-activates PLC-dependent regulation, which activates downstream PKC [
14]. Therefore, the linear signaling paradigm has given way to a complex multidimensional “signalome” in which an individual adrenoceptor can dynamically couple to multiple signaling proteins in a temporally and spatially regulated manner resulting in pharmacologically and functionally distinct receptor populations [
29,
30,
31,
32]. Remarkably, mechanistic studies focusing on the regulation of ionic currents by AR signaling have been rapidly translated to the bedside [
33]. We have previously demonstrated that
IKr tail current is inhibited by acute stimulation of α
1-ARs using PE [
21]. Furthermore, PE-mediated inhibition of the current was significantly attenuated by the PKC inhibitor chelerythrine and the PKA inhibitor KT5720, suggesting that activation of PKA and/or PKC may play an important role in mediating the effects of α
1-ARs on native
IKr current in guinea-pig ventricular myocytes. Coincidentally, Thomas and colleagues [
9] reported similar phenomena in
Xenopus laevis oocytes heterologously coexpressing
hERG channels and human α
1A-ARs. In contrast, Bian
et al. [
17] found that pretreatment with chelerythrine augmented the inhibitory effects of α
1-ARs on
IKr current. In β
1-AR regulation of
IKr, Karle
et al. found that inhibiting PKA may attenuate the reduction effect of xamotorol on
IKr [
5], which is consistant with our previous study. Moreover, we also found that PKC inhibition effectively attenuated the effect of Xamo on
IKr [
34]. This suggests that, in addition to PKA, PKC is also activated as part of the β
1-AR signaling pathway in the regulation of
IKr tail current. Despite that, both PKA and PKC are among the most important signal transduction pathways that modulate the
IKr/
hERG current, and they may act in a cross-activation manner, an important issue which will require further investigation.


