Comparative Genomic Analysis of Transgenic Poplar Dwarf Mutant Reveals Numerous Differentially Expressed Genes Involved in Energy Flow

Abstract
:1. Introduction
2. Results
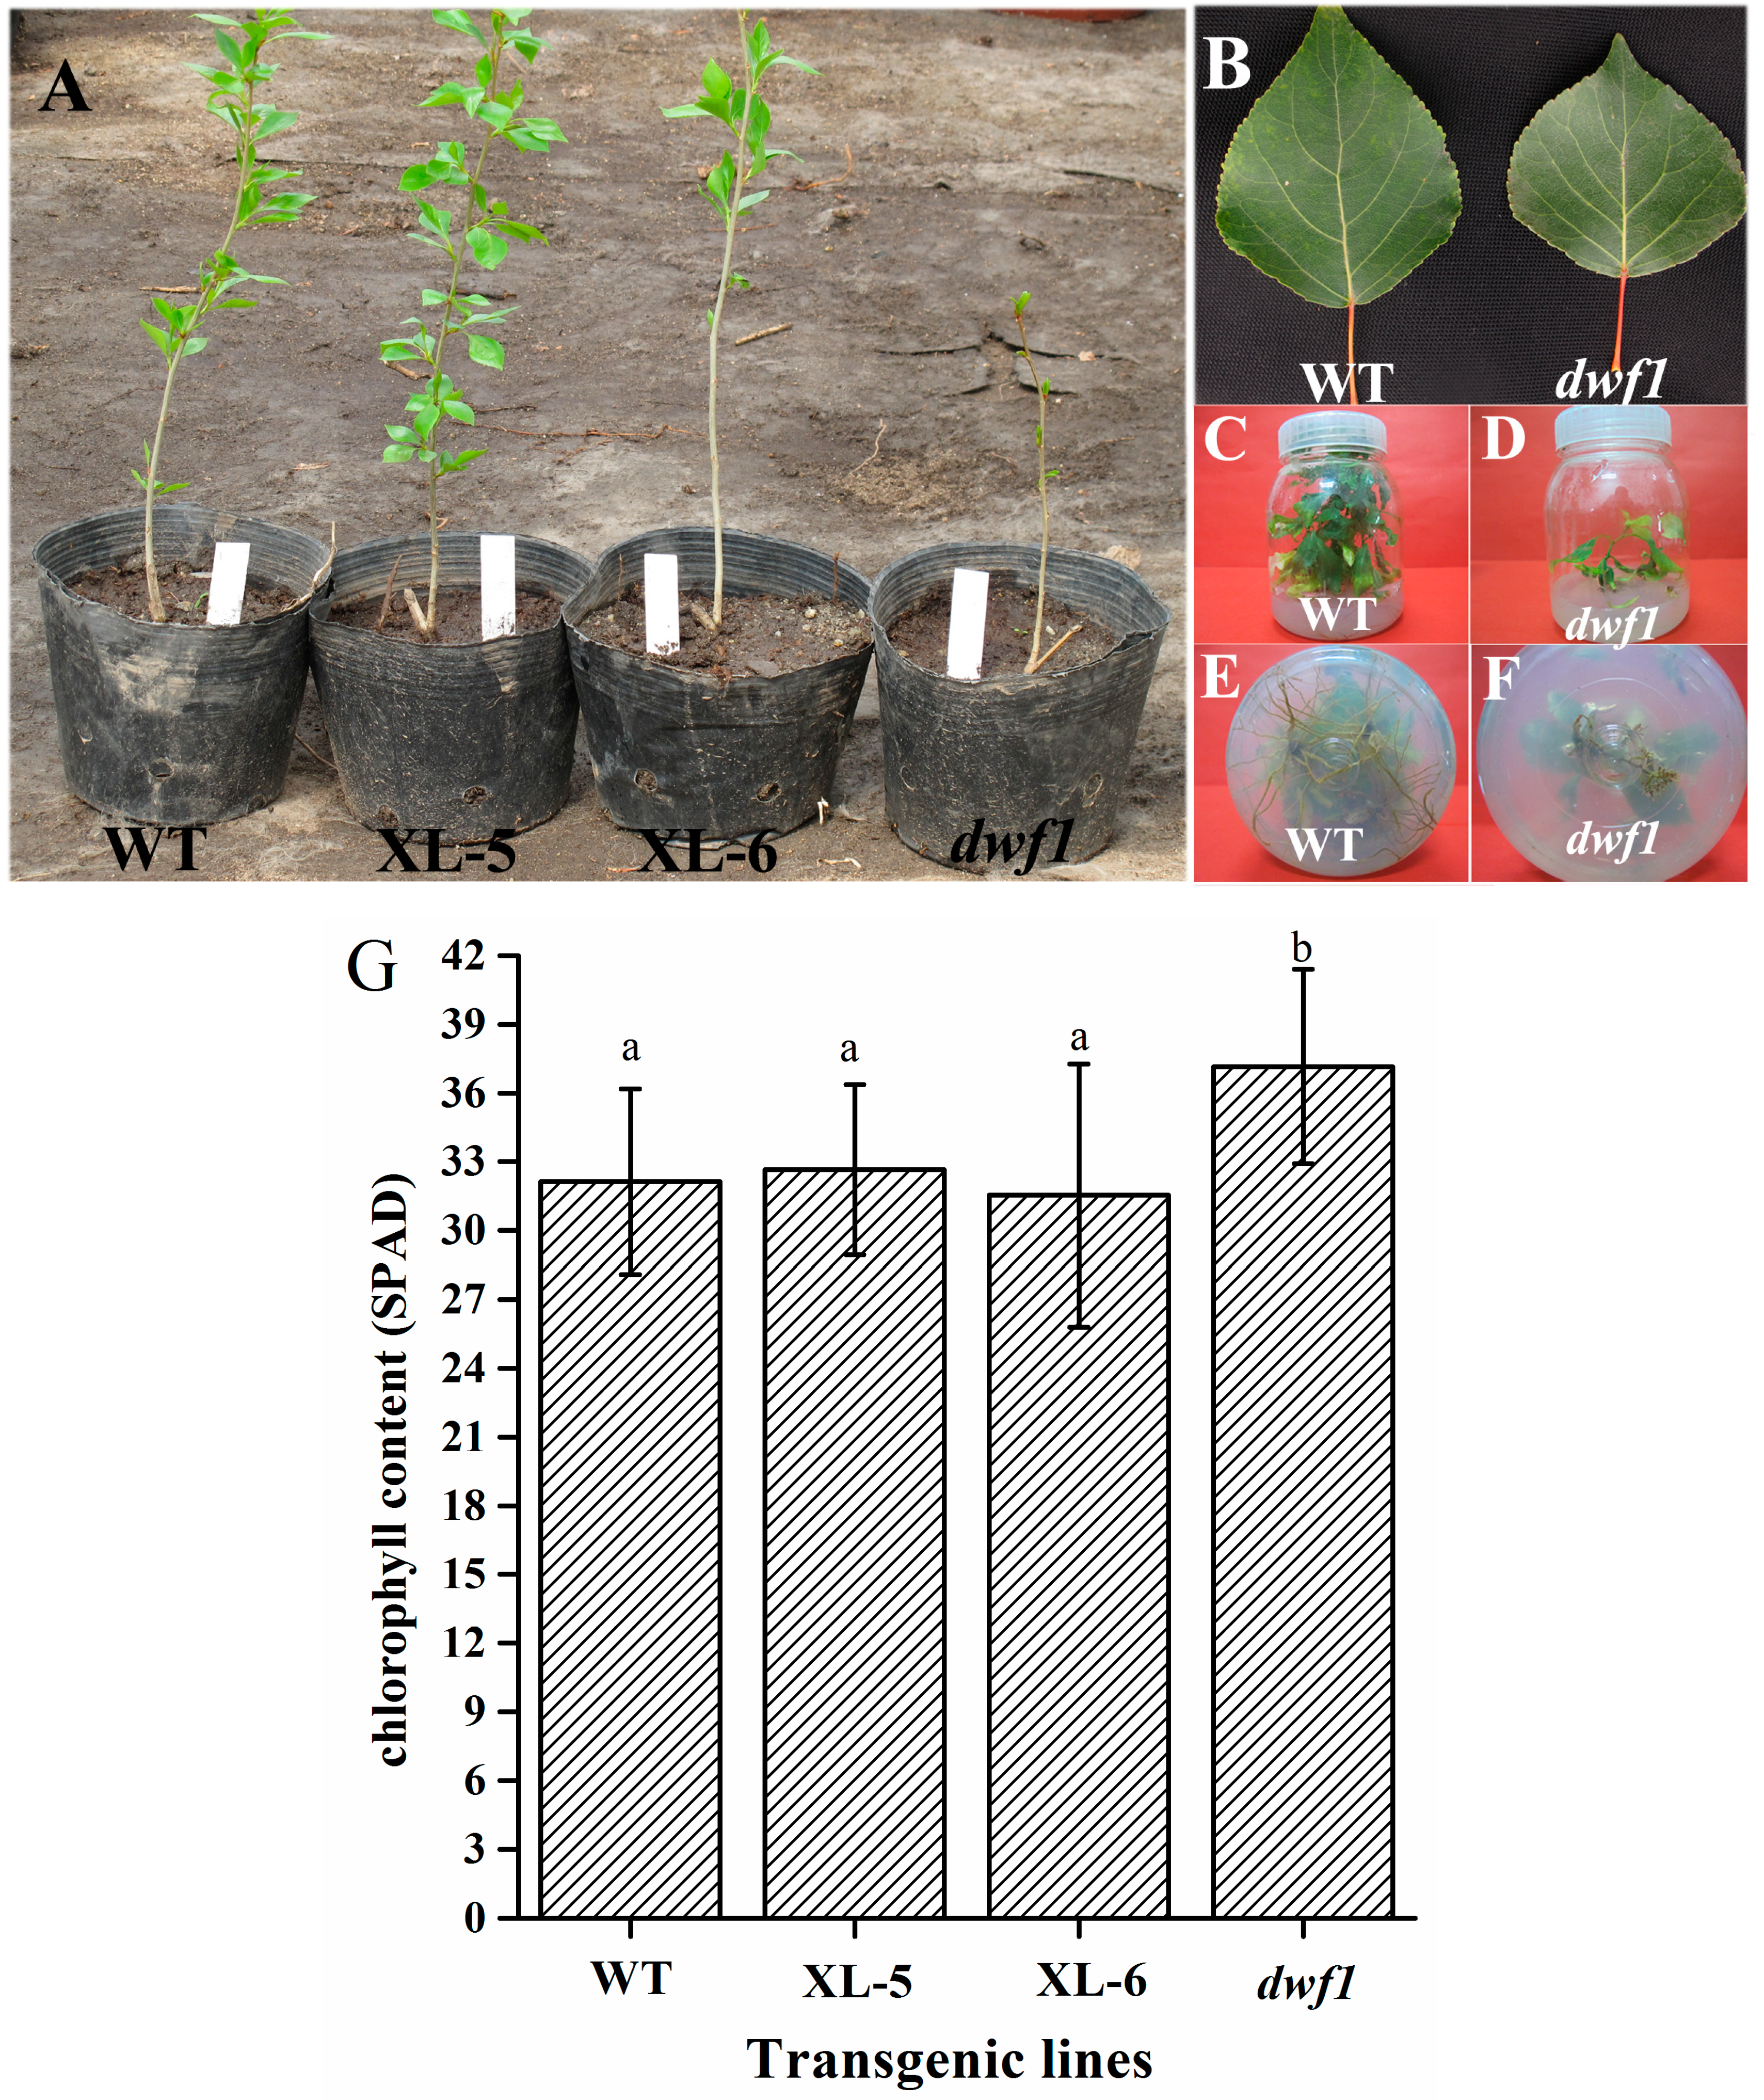
2.1. Isolation and Morphological Characterization of the dwf1 Phenotype

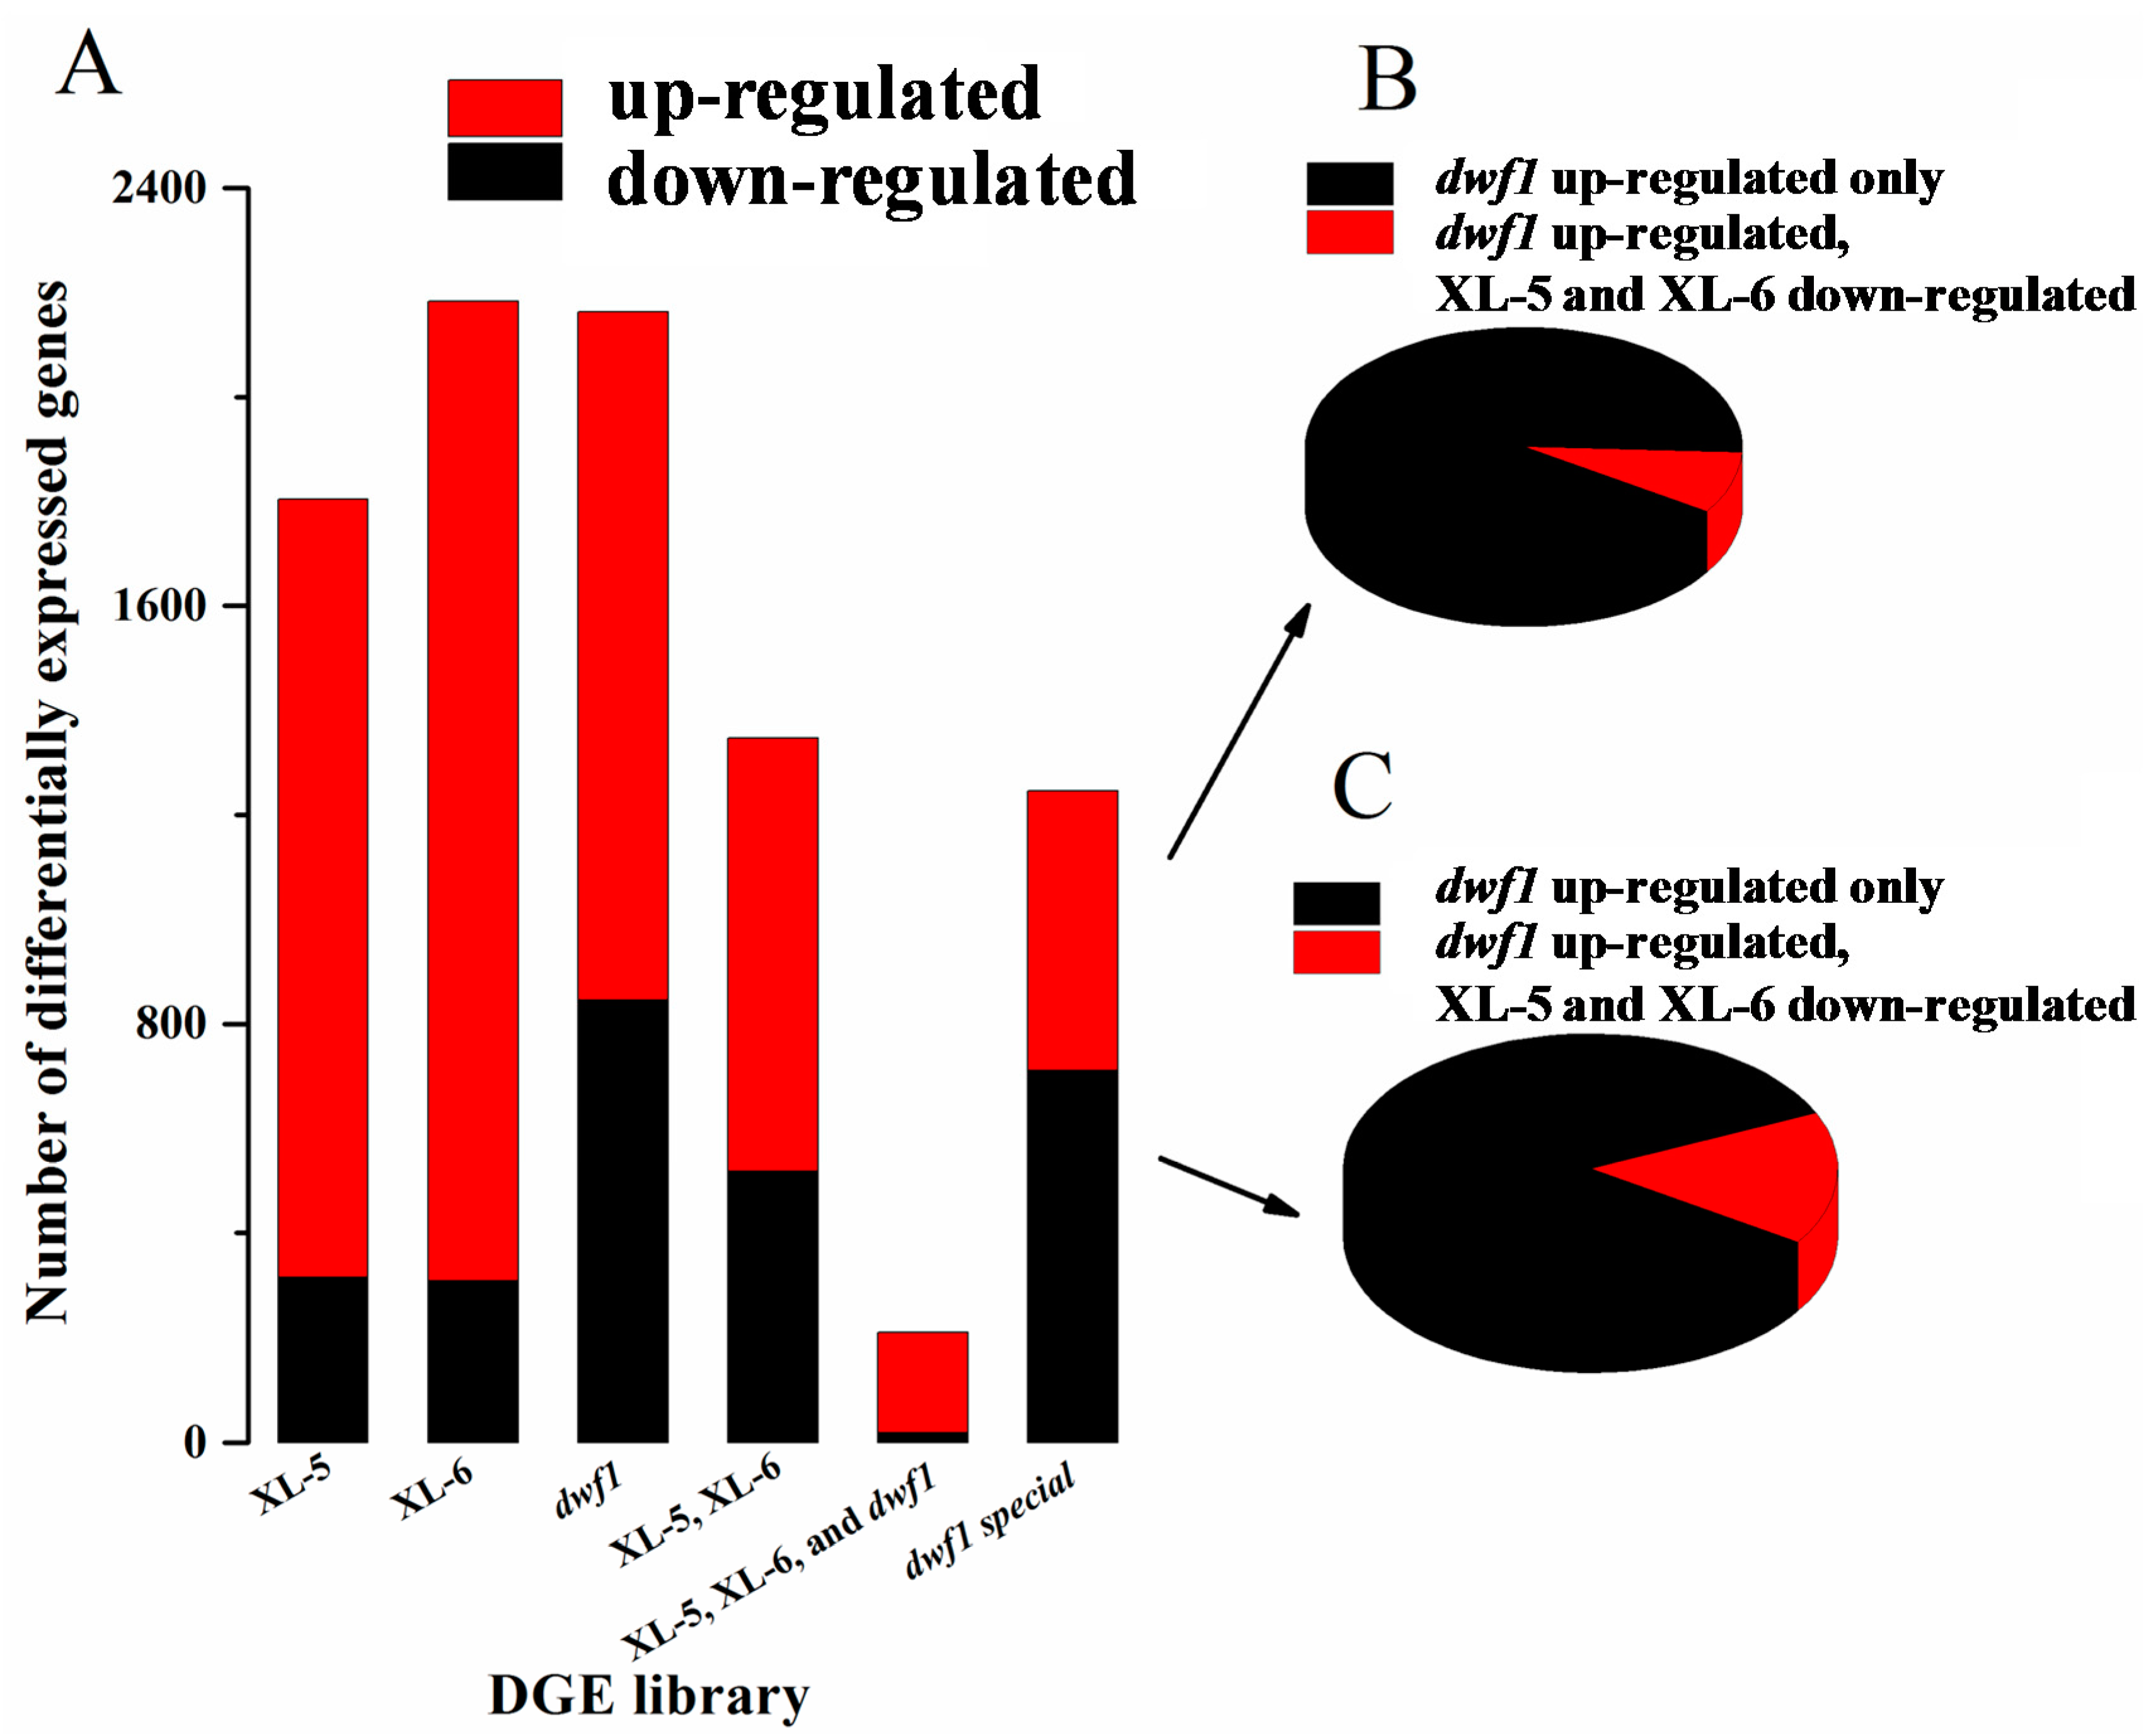
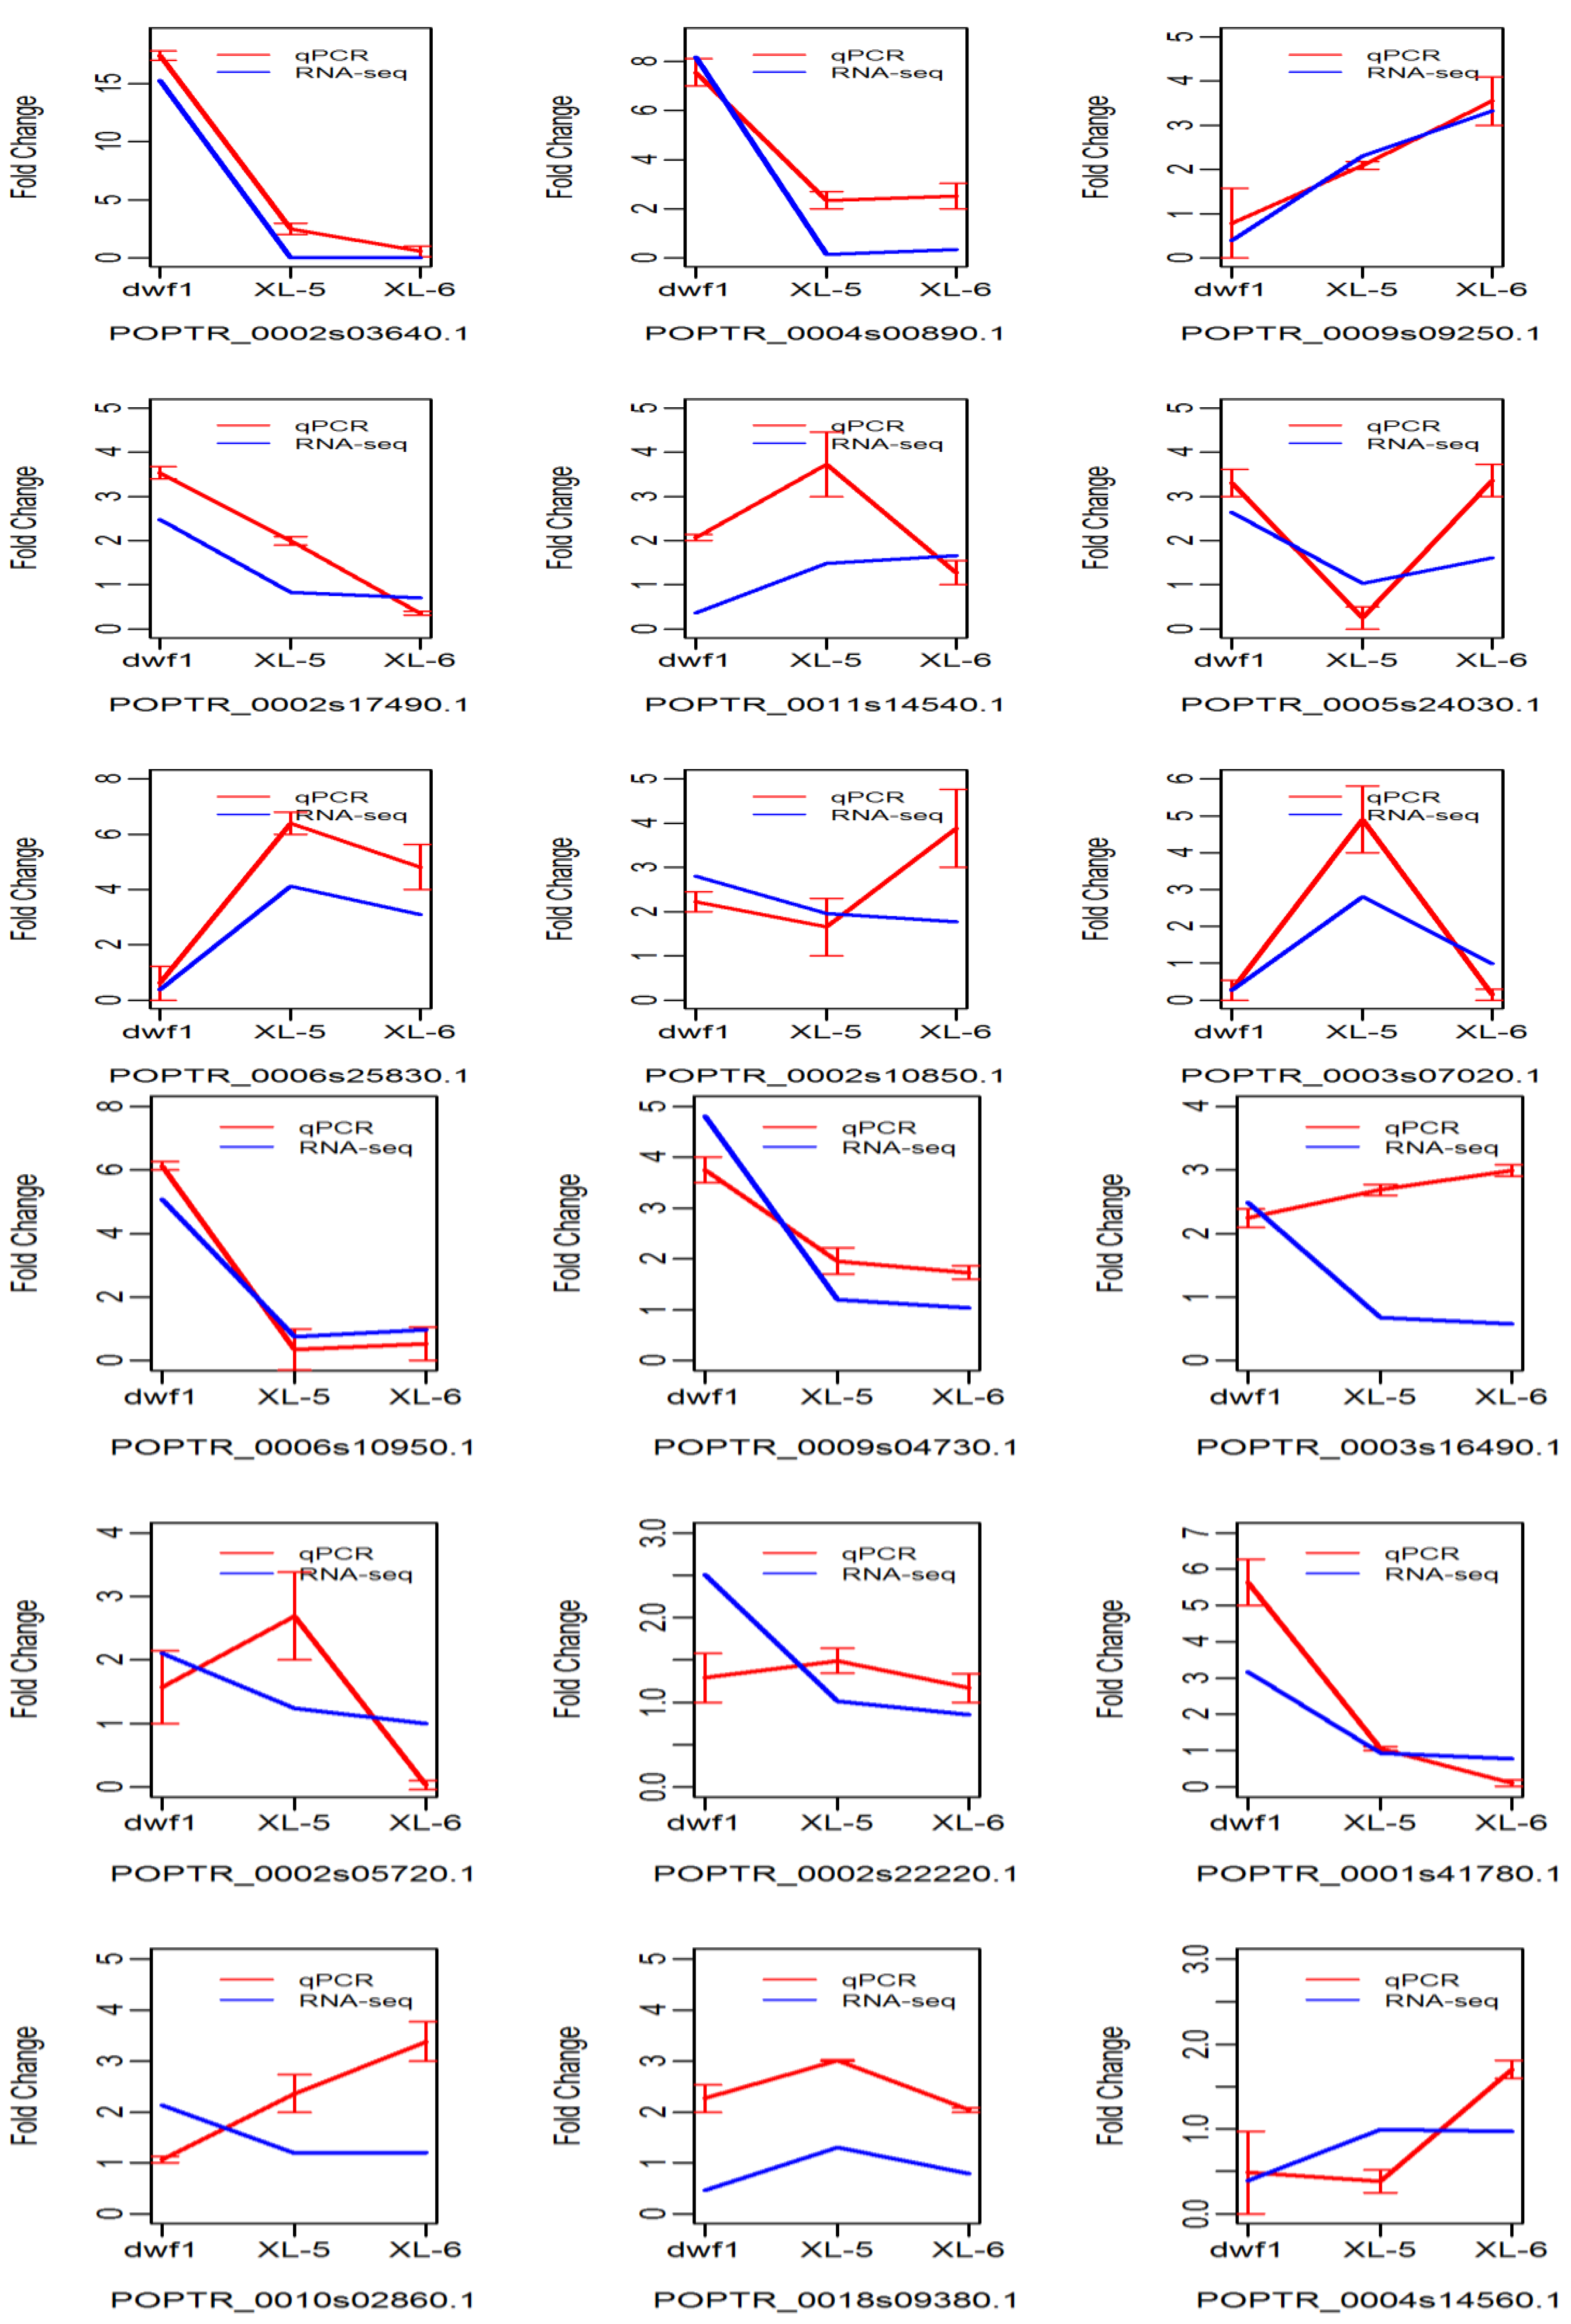
2.2. Identification and Validation of Differentially Expressed Genes


2.3. Gene Ontology Analysis

| GO Term | Ontology | Description | p-Value | FDR |
|---|---|---|---|---|
| GO:0015979 | Biological process | photosynthesis | 3.40 × 10⁻¹⁰ | 2.70 × 10⁻⁷ |
| GO:0009765 | Biological process | photosynthesis, light harvesting | 6.20 × 10⁻⁹ | 2.50 × 10⁻⁶ |
| GO:0019684 | Biological process | photosynthesis, light reaction | 1.10 × 10⁻⁸ | 3.00 × 10⁻⁶ |
| GO:0008152 | Biological process | metabolic process | 1.60 × 10⁻⁷ | 3.20 × 10⁻⁵ |
| GO:0044237 | Biological process | cellular metabolic process | 2.20 × 10⁻⁶ | 3.60 × 10⁻⁴ |
| GO:0006091 | Biological process | generation of precursor metabolites and energy | 3.90 × 10⁻⁶ | 5.20 × 10⁻⁴ |
| GO:0044238 | Biological process | primary metabolic process | 2.10 × 10⁻⁴ | 2.40 × 10⁻² |
| GO:0009987 | Biological process | cellular process | 2.80 × 10⁻⁴ | 2.80 × 10⁻² |
| GO:0044283 | Biological process | small molecule biosynthetic process | 4.90 × 10⁻⁴ | 4.30 × 10⁻² |
| GO:0003824 | Molecular function | catalytic activity | 7.00 × 10⁻⁷ | 4.30 × 10⁻⁴ |
| GO:0048037 | Molecular function | cofactor binding | 4.70 × 10⁻⁵ | 0.014 |
| GO:0016020 | Cellular component | membrane | 1.20 × 10⁻⁵ | 0.0015 |
| GO:0009521 | Cellular component | photosystem | 0.00034 | 0.012 |
| GO:0044464 | Cellular component | cell part | 0.00039 | 0.012 |
| GO:0005623 | Cellular component | cell | 0.00039 | 0.012 |
| GO:0034357 | Cellular component | photosynthetic membrane | 0.00064 | 0.016 |
| GO:0009579 | Cellular component | thylakoid | 0.00089 | 0.019 |
| GO:0009523 | Cellular component | photosystem II | 0.002 | 0.036 |
2.4. Pathway Analysis
| Transcription ID | Description | Fold Change (dwf1/WT) | Fold Change (XL-5/WT) | Fold Change (XL-6/WT) |
|---|---|---|---|---|
| Photosynthesis | ||||
| POPTR_0004s03160.1 | photosystem II oxygen-evolving enhancer protein 3 | 1.506534 | −0.34166 | 0.307573 |
| POPTR_0001s42970.1 | photosystem II 10 kDa protein | 1.19626 | 0.662679 | 0.540777 |
| POPTR_0011s14540.1 | photosystem II 10 kDa protein | −1.46887 | 0.568004 | 0.730908 |
| POPTR_0005s24030.1 | photosystem II PsbW protein | 1.399979 | 0.036831 | 0.682095 |
| POPTR_0002s05720.1 | photosystem II Psb27 protein | 1.072018 | 0.313421 | −0.00522 |
| POPTR_0002s24070.1 | photosystem I subunit XI | 2.55935 | −0.33126 | 0.369094 |
| POPTR_0007s04160.1 | photosystem I subunit PsaN | 1.029639 | −0.93225 | −0.78795 |
| POPTR_0018s01830.1 | F-type H+-transporting ATPase subunit b | 1.012708 | 0.978216 | 0.799743 |
| Photosynthesis—Antenna proteins | ||||
| POPTR_0014s17070.1 | light-harvesting complex I chlorophyll a/b binding protein 3 | 1.312586 | 0.683911 | 0.509049 |
| POPTR_0002s19010.1 | light-harvesting complex II chlorophyll a/b binding protein 1 | 3.606024 | −5.08746 | 0.640458 |
| POPTR_0002s22220.1 | light-harvesting complex II chlorophyll a/b binding protein 2 | 1.324373 | 0.019659 | −0.22376 |
| POPTR_0001s41780.1 | light-harvesting complex II chlorophyll a/b binding protein 3 | 1.667425 | −0.09416 | −0.37883 |
| POPTR_0016s12260.1 | light-harvesting complex II chlorophyll a/b binding protein 4 | 1.374459 | −0.40942 | 0.666267 |
| POPTR_0006s10040.1 | light-harvesting complex II chlorophyll a/b binding protein 4 | 1.20757 | −0.35232 | 0.004115 |
| POPTR_0001s21740.1 | light-harvesting complex II chlorophyll a/b binding protein 6 | 1.023375 | −0.57046 | 0.268189 |
| Carbon fixation in photosynthetic organisms | ||||
| POPTR_0001s47210.1 | fructose-bisphosphate aldolase, class I | 1.599591 | 0.044778 | 0.18237 |
| POPTR_0006s25830.1 | aspartate aminotransferase, cytoplasmic | −1.42047 | 2.045731 | 1.631069 |
| POPTR_0002s10850.1 | phosphoenolpyruvate carboxykinase (ATP) | 1.489119 | 0.967284 | 0.821559 |
| POPTR_0012s01140.1 | pyruvate kinase | −1.25054 | 0.074697 | −0.16016 |
| POPTR_0001s16300.1 | alanine transaminase | −1.73081 | 1.165809 | 0.928917 |
| POPTR_0003s07020.1 | alanine transaminase | −1.91754 | 1.489279 | −0.01162 |
| POPTR_0010s02860.1 | pyruvate, orthophosphate dikinase | 1.094209 | 0.246454 | 0.270031 |
| POPTR_0018s09380.1 | malate dehydrogenase (oxaloacetate-decarboxylating) (NADP+) | −1.12428 | 0.386745 | −0.34094 |
| Porphyrin and chlorophyll metabolism | ||||
| POPTR_0004s14560.1 | ferrochelatase | −1.35201 | −0.00687 | −0.03942 |
| POPTR_0016s02570.1 | magnesium-protoporphyrin IX monomethyl ester (oxidative) cyclase | 1.057457 | −0.85298 | −0.25922 |
| POPTR_0001s41370.1 | protochlorophyllide reductase | 1.416154 | 0.468741 | 0.329946 |
| POPTR_0004s22680.1 | pheophorbide a oxygenase | −1.54976 | −0.0895 | −0.36422 |
| POPTR_0017s07890.1 | glucuronosyltransferase | 1.10191 | 0.043625 | −0.20886 |
| POPTR_0008s06270.2 | glucuronosyltransferase | −2.35411 | 0.088461 | 0.088461 |
| POPTR_0008s07270.2 | ferritin heavy chain | −1.17819 | 0.509709 | −0.74149 |
| POPTR_0016s13270.3 | ferritin heavy chain | −2.23599 | 2.993992 | 2.518902 |
2.5. Transcription Factors
| Transcription ID | Description | Fold Change (dwf1/WT) | Fold Change (XL-5/WT) | Fold Change (XL-6/WT) |
|---|---|---|---|---|
| POPTR_0002s03640.1 | MYB_related | 3.933054 | −5.67243 | −5.67243 |
| POPTR_0002s26160.1 | MYB_related | 5.425953 | −3.24793 | −8.33539 |
| POPTR_0004s00890.1 | WRKY | 3.033553 | −2.90689 | −1.53492 |
| POPTR_0007s13000.1 | MYB_related | 1.605582 | −2.71364 | −1.86127 |
| POPTR_0004s16320.1 | MYB_related | 2.125699 | −2.05352 | −3.3505 |
| POPTR_0002s17460.1 | MYB | 1.117078 | −1.29248 | −1.32193 |
| POPTR_0010s19400.1 | bHLH | −1.56508 | 1.026258 | 1.111576 |
| POPTR_0009s09250.1 | C2H2 | −1.35628 | 1.20679 | 1.732205 |
| POPTR_0011s00390.1 | MYB_related | −1.81444 | 1.290471 | 1.053793 |
| POPTR_0014s09860.1 | HD-ZIP | −4.14738 | 1.394444 | 1.900261 |
| POPTR_0001s11380.1 | HD-ZIP | −8.40939 | 1.803713 | 1.459432 |
| POPTR_0001s41460.1 | NAC | −4.2076 | 1.984222 | 1.11448 |
| POPTR_0011s12400.1 | NAC | −1.32851 | 1.996113 | 1.94709 |
| POPTR_0018s00700.1 | ERF | −2.9611 | 2.247418 | 2.369786 |
| POPTR_0005s14120.1 | G2-like | −1.03684 | 2.406678 | 1.683869 |
| POPTR_0014s10190.4 | bHLH | −6.08746 | 3.146157 | 3.697172 |
| POPTR_0010s15280.1 | bZIP | −5.67243 | 5.432828 | 5.434792 |
| POPTR_0003s15060.1 | ERF | 4.18026 | 0.016874 | 0.31853 |
| POPTR_0001s02650.2 | LSD | 3.752791 | −0.97199 | 0.055495 |
| POPTR_0009s11930.1 | MYB_related | 3.10598 | 0.016874 | 0.874469 |
| POPTR_0005s25240.1 | bHLH | 2.614957 | 0.667425 | 0.244734 |
| POPTR_0006s10950.1 | WRKY | 2.345377 | −0.39896 | −0.05247 |
| POPTR_0009s04730.1 | MYB | 2.266787 | 0.265684 | 0.052089 |
| POPTR_0001s27680.1 | bHLH | 2.185556 | −0.56914 | 0.469682 |
| POPTR_0003s19470.1 | Trihelix | 2.175913 | 0.556393 | 0.401473 |
| POPTR_0009s04850.1 | C2H2 | 2.04182 | −0.3505 | 0.202044 |
| POPTR_0014s10750.1 | WRKY | 1.96299 | 0.603699 | 0.342525 |
| POPTR_0001s02450.1 | bHLH | 1.74573 | 0.094188 | 0.545172 |
| POPTR_0005s22870.1 | bHLH | 1.739993 | −0.20133 | −0.43539 |
| POPTR_0005s08510.1 | NF-YB | 1.712849 | −0.9371 | −0.46652 |
| POPTR_0007s13020.1 | bHLH | 1.687038 | −0.41627 | −0.22301 |
| POPTR_0007s12520.1 | C2H2 | 1.684149 | 0.391269 | 0.468262 |
| POPTR_0002s18290.1 | NAC | 1.56945 | −0.63401 | −0.81897 |
| POPTR_0004s14510.1 | MYB | 1.558658 | 0.563823 | −0.58928 |
| POPTR_0015s05430.1 | MYB_related | 1.543734 | 0.579224 | 0.903746 |
| POPTR_0003s05010.1 | bHLH | 1.502954 | 0.365995 | 0.91663 |
| POPTR_0008s23260.1 | ERF | 1.487078 | 0.257027 | −0.46781 |
| POPTR_0014s10700.1 | bHLH | 1.390702 | 0.163825 | 0.219781 |
| POPTR_0001s13380.1 | NAC | 1.340465 | 0.601475 | 0.417288 |
| POPTR_0019s04820.1 | G2-like | 1.337559 | −0.92946 | −0.24244 |
| POPTR_0008s13980.1 | C2H2 | 1.322666 | 0.078973 | 0.660438 |
| POPTR_0020s00320.1 | CO-like | 1.31853 | 0.694946 | 0.934017 |
| POPTR_0003s16490.1 | NAC | 1.315454 | −0.56824 | −0.79463 |
| POPTR_0002s17490.1 | Dof | 1.307035 | −0.27635 | −0.50763 |
| POPTR_0003s03670.1 | NAC | 1.295921 | 0.583914 | 0.757562 |
| POPTR_0018s12990.1 | YABBY | 1.295671 | 0.696682 | 0.971257 |
| POPTR_0019s14460.1 | WRKY | 1.270407 | 0.876839 | 0.972344 |
| POPTR_0002s00980.1 | WOX | 1.257934 | 0.452272 | 0.193424 |
| POPTR_0013s03800.1 | bZIP | 1.256512 | −0.6204 | 0.741133 |
| POPTR_0017s02990.1 | MYB | 1.253047 | 0.263558 | 0.822986 |
| POPTR_0013s05670.1 | G2-like | 1.206943 | −0.29725 | 0.336728 |
| POPTR_0007s07480.1 | TCP | 1.186807 | 0.725161 | 0.680275 |
| POPTR_0001s44230.1 | bHLH | 1.170218 | 0.713709 | 0.237438 |
| POPTR_0003s20320.1 | bZIP | 1.161617 | 0.485959 | 0.893658 |
| POPTR_0008s11600.1 | RAV | 1.143492 | 0.865699 | 0.846949 |
| POPTR_0016s00780.1 | NF-YB | 1.13943 | 0.700983 | 0.789505 |
| POPTR_0013s15280.1 | bZIP | 1.132915 | 0.541894 | 0.886952 |
| POPTR_0004s16660.1 | TALE | 1.1283 | 0.562619 | 0.236414 |
| POPTR_0002s25960.4 | G2-like | 1.117078 | 0.431306 | 0.101913 |
| POPTR_0007s01230.1 | G2-like | 1.110973 | −0.85528 | 0.640587 |
| POPTR_0010s19520.1 | C3H | 1.108934 | 0.950292 | −0.08473 |
| POPTR_0003s13120.1 | TALE | 1.088253 | −0.3639 | −0.2824 |
| POPTR_0016s11980.1 | MYB | 1.037428 | 0.245169 | −0.25188 |
| POPTR_0003s12990.1 | MYB_related | 1.014075 | 0.018072 | 0.946484 |
| POPTR_0016s08470.2 | MYB_related | 1.01281 | 0.124458 | 0.919683 |
| POPTR_0012s07270.1 | HD-ZIP | 1.000161 | 0.522719 | 0.909557 |
| POPTR_0018s13860.1 | bHLH | −1.02003 | 0.086354 | −0.70214 |
| POPTR_0009s06540.2 | NF-YA | −1.03937 | 0.522171 | 0.527314 |
| POPTR_0013s11300.1 | C2H2 | −1.05068 | -0.54184 | −0.86987 |
| POPTR_0014s08520.1 | MYB_related | −1.10493 | −0.16666 | 0.093567 |
| POPTR_0002s17680.1 | HD-ZIP | −1.18914 | 0.815691 | 0.971304 |
| POPTR_0007s10490.1 | MYB | −1.20875 | 0.415756 | 0.183596 |
| POPTR_0014s02260.1 | MYB | −1.22876 | −0.67693 | −0.58973 |
| POPTR_0002s09480.1 | ERF | −1.26701 | 0.071166 | −0.84495 |
| POPTR_0004s14900.1 | B3 | −1.35861 | −0.27417 | −0.5989 |
| POPTR_0002s12710.1 | bZIP | −1.39873 | 0.697847 | 0.76797 |
| POPTR_0001s08990.1 | HSF | −1.41814 | 0.198258 | 0.129962 |
| POPTR_0008s04490.1 | AP2 | −1.42131 | −0.31532 | −0.2299 |
| POPTR_0005s05330.1 | Trihelix | −1.43381 | 0.303158 | −0.03779 |
| POPTR_0008s11120.2 | bHLH | −1.4783 | −0.16036 | −0.73637 |
| POPTR_0001s38120.1 | HD-ZIP | −1.5621 | −0.50735 | 0.562355 |
| POPTR_0002s16870.1 | bZIP | −1.65421 | 0.202417 | −0.16211 |
| POPTR_0005s19580.1 | GATA | −1.70355 | 0.247976 | −0.30077 |
| POPTR_0009s10400.1 | bZIP | −1.81729 | −0.26219 | −0.56068 |
| POPTR_0014s08990.1 | bZIP | −1.83325 | 0.040062 | −0.14179 |
| POPTR_0002s15360.1 | TCP | −2.15325 | −0.22441 | −0.04544 |
| POPTR_0011s11620.1 | ERF | −2.35326 | 0.870376 | −0.53229 |
| POPTR_0014s00780.1 | GRF | −2.83592 | 0.910389 | 0.983744 |
| POPTR_0002s08150.1 | NAC | −3.0591 | −0.10704 | −0.05318 |
| POPTR_0004s03310.1 | MYB | −4.32769 | 0.526308 | −0.6206 |
3. Discussion
3.1. Dwf1 Showed a Unique Gene Expression Profile Compared to the Other Transgenic Lines
3.2. T-DNA-Affected Genes Might Play a Role in Dwarfism Formation
3.3. Genes Involved in Photosynthesis and Photosynthesis-Antenna Proteins

3.4. Genes Involved in Carbohydrate Metabolism
3.5. Transcription Factors
4. Experimental Section
4.1. Plant Growth Conditions and Transgenic Plants
4.2. Chlorophyll Content
4.3. RNA Isolation and RNA-seq Library Preparation
4.4. Data Analysis
4.5. Real-Time RT-PCR
5. Conclusions
Supplementary Materials
Supplementary Files
Supplementary File 1Acknowledgments
Author Contributions
Conflicts of Interest
References
- Yadav, R.K.; Baeg, J.O.; Oh, G.H.; Park, N.J.; Kong, K.J.; Kim, J.; Hwang, D.W.; Biswas, S.K. A photocatalyst-enzyme coupled artificial photosynthesis system for solar energy in production of formic acid from CO2. J. Am. Chem. Soc. 2012, 134, 11455–11461. [Google Scholar]
- Urban, O.; Hrstka, M.; Zitova, M.; Holisova, P.; Sprtova, M.; Klem, K.; Calfapietra, C.; de Angelis, P.; Marek, M.V. Effect of season, needle age and elevated CO2 concentration on photosynthesis and Rubisco acclimation in Picea abies. Plant Phys. Biochem. 2012, 58, 135–141. [Google Scholar] [CrossRef]
- Alberte, R.S.; McClure, P.R.; Thornber, J.P. Photosynthesis in trees: Organization of chlorophyll and photosynthetic unit size in isolated gymnosperm chloroplasts. Plant Phys. 1976, 58, 341–344. [Google Scholar] [CrossRef]
- Chapman, D.J.; Leech, R.M. Phosphoserine as an early product of photosynthesis in isolated chloroplasts and in leaves of Zea mays seedlings. FEBS Lett. 1976, 68, 160–164. [Google Scholar] [CrossRef]
- Chollet, R. Effect of glycidate on glycolate formation and photosynthesis in isolated spinach chloroplasts. Plant Phys. 1976, 57, 237–240. [Google Scholar] [CrossRef]
- Pfundel, E.; Pfeffer, M. Modification of photosystem I light harvesting of bundle-sheath chloroplasts occurred during the evolution of NADP-malic enzyme C4 photosynthesis. Plant Phys. 1997, 114, 145–152. [Google Scholar]
- Giuliano, G.; Scolnik, P.A. Transcription of two photosynthesis-associated nuclear gene families correlates with the presence of chloroplasts in leaves of the variegated tomato ghost mutant. Plant Phys. 1988, 86, 7–9. [Google Scholar] [CrossRef]
- Gantt, E. Oxygenic photosynthesis and the distribution of chloroplasts. Photosynth. Res. 2012, 107, 1–6. [Google Scholar] [CrossRef]
- Ze, Y.; Liu, C.; Wang, L.; Hong, M.; Hong, F. The regulation of TiO2 nanoparticles on the expression of light-harvesting complex II and photosynthesis of chloroplasts of Arabidopsis thaliana. Biol. Trace Elem. Res. 2011, 143, 1131–1141. [Google Scholar] [CrossRef]
- Bahatyrova, S.; Frese, R.N.; van der Werf, K.O.; Otto, C.; Hunter, C.N.; Olsen, J.D. Flexibility and size heterogeneity of the LH1 light harvesting complex revealed by atomic force microscopy: Functional significance for bacterial photosynthesis. J. Biol. Chem. 2004, 279, 21327–21333. [Google Scholar]
- Andersson, J.; Wentworth, M.; Walters, R.G.; Howard, C.A.; Ruban, A.V.; Horton, P.; Jansson, S. Absence of the Lhcb1 and Lhcb2 proteins of the light-harvesting complex of photosystem II—Effects on photosynthesis, grana stacking and fitness. Plant J. 2003, 35, 350–361. [Google Scholar] [CrossRef]
- Goltsev, V.; Zaharieva, I.; Chernev, P.; Strasser, R.J. Delayed fluorescence in photosynthesis. Photosynth. Res. 2009, 101, 217–232. [Google Scholar] [CrossRef]
- Forti, G. The role of respiration in the activation of photosynthesis upon illumination of dark adapted Chlamydomonas reinhardtii. Biochim. Biophys. Acta 2008, 1777, 1449–1454. [Google Scholar]
- Suzuki, Y.; Fujimori, T.; Kanno, K.; Sasaki, A.; Ohashi, Y.; Makino, A. Metabolome analysis of photosynthesis and the related primary metabolites in the leaves of transgenic rice plants with increased or decreased Rubisco content. Plant Cell Environ. 2012, 35, 1369–1379. [Google Scholar] [CrossRef]
- Marcus, Y.; Altman-Gueta, H.; Wolff, Y.; Gurevitz, M. Rubisco mutagenesis provides new insight into limitations on photosynthesis and growth in Synechocystis PCC6803. J. Exp. Bot. 2011, 62, 4173–4182. [Google Scholar] [CrossRef]
- Bonhomme, L.; Monclus, R.; Vincent, D.; Carpin, S.; Lomenech, A.M.; Plomion, C.; Brignolas, F.; Morabito, D. Leaf proteome analysis of eight Populus xeuramericana genotypes: Genetic variation in drought response and in water-use efficiency involves photosynthesis-related proteins. Proteomics 2009, 9, 4121–4142. [Google Scholar] [CrossRef]
- Katny, M.A.; Hoffmann-Thoma, G.; Schrier, A.A.; Fangmeier, A.; Jager, H.J.; van Bel, A.J. Increase of photosynthesis and starch in potato under elevated CO2 is dependent on leaf age. J. Plant Physiol. 2005, 162, 429–438. [Google Scholar] [CrossRef]
- Yuan, H.M.; Chen, S.; Lin, L.; Wei, R.; Li, H.Y.; Liu, G.F.; Jiang, J. Genome-wide analysis of a TaLEA-introduced transgenic Populus simonii × Populus nigra dwarf mutant. Int. J. Mol. Sci. 2012, 13, 2744–2762. [Google Scholar] [CrossRef]
- Chen, S.; Yuan, H.M.; Liu, G.F.; Li, H.Y.; Jiang, J. A label-free differential quantitative proteomics analysis of a TaLEA-introduced transgenic Populus simonii × Populus nigra dwarf mutant. Mol. Biol. Rep. 2012, 39, 7657–7664. [Google Scholar] [CrossRef]
- Yang, H.; Tao, Y.; Zheng, Z.; Li, C.; Sweetingham, M.W.; Howieson, J.G. Application of next-generation sequencing for rapid marker development in molecular plant breeding: A case study on anthracnose disease resistance in Lupinus angustifolius L. BMC Genomics 2012, 13, 318. [Google Scholar]
- Bus, A.; Hecht, J.; Huettel, B.; Reinhardt, R.; Stich, B. High-throughput polymorphism detection and genotyping in Brassica napus using next-generation RAD sequencing. BMC Genomics 2012, 13, 281. [Google Scholar] [CrossRef]
- Bokulich, N.A.; Joseph, C.M.; Allen, G.; Benson, A.K.; Mills, D.A. Next-generation sequencing reveals significant bacterial diversity of botrytized wine. PLoS One 2012, 7, e36357. [Google Scholar]
- Varshney, R.K.; May, G.D. Next-generation sequencing technologies: Opportunities and obligations in plant genomics. Br. Funct. Genomics 2012, 11, 1–2. [Google Scholar] [CrossRef]
- Robinson, M.D.; McCarthy, D.J.; Smyth, G.K. edgeR: A Bioconductor package for differential expression analysis of digital gene expression data. Bioinformatics 2010, 26, 139–140. [Google Scholar] [CrossRef]
- Moriya, Y.; Itoh, M.; Okuda, S.; Yoshizawa, A.C.; Kanehisa, M. KAAS: An automatic genome annotation and pathway reconstruction server. Nucleic. Acids Res. 2007, 35, W182–W185. [Google Scholar] [CrossRef]
- Yin, L.; Fristedt, R.; Herdean, A.; Solymosi, K.; Bertrand, M.; Andersson, M.X.; Mamedov, F.; Vener, A.V.; Schoefs, B.; Spetea, C. Photosystem II function and dynamics in three widely used Arabidopsis thaliana accessions. PLoS One 2012, 7, e46206. [Google Scholar] [CrossRef]
- Dwyer, S.A.; Chow, W.S.; Yamori, W.; Evans, J.R.; Kaines, S.; Badger, M.R.; von Caemmerer, S. Antisense reductions in the PsbO protein of photosystem II leads to decreased quantum yield but similar maximal photosynthetic rates. J. Exp. Bot. 2012, 63, 4781–4795. [Google Scholar] [CrossRef]
- Rengstl, B.; Knoppova, J.; Komenda, J.; Nickelsen, J. Characterization of a Synechocystis double mutant lacking the photosystem II assembly factors YCF48 and Sll0933. Planta 2013, 237, 471–480. [Google Scholar] [CrossRef]
- Wu, H.; Roy, S.; Alami, M.; Green, B.R.; Campbell, D.A. Photosystem II photoinactivation, repair, and protection in marine centric diatoms. Plant Phys. 2012, 160, 464–476. [Google Scholar] [CrossRef]
- Daum, B.; Nicastro, D.; Austin, J., 2nd; McIntosh, J.R.; Kuhlbrandt, W. Arrangement of photosystem II and ATP synthase in chloroplast membranes of spinach and pea. Plant Cell 2010, 22, 1299–1312. [Google Scholar] [CrossRef]
- Oguchi, R.; Jia, H.; Barber, J.; Chow, W.S. Recovery of photoinactivated photosystem II in leaves: Retardation due to restricted mobility of photosystem II in the thylakoid membrane. Photosynth. Res. 2008, 98, 621–629. [Google Scholar] [CrossRef]
- Panitchayangkoon, G.; Voronine, D.V.; Abramavicius, D.; Caram, J.R.; Lewis, N.H.; Mukamel, S.; Engel, G.S. Direct evidence of quantum transport in photosynthetic light-harvesting complexes. Proc. Natl. Acad. Sci. USA 2011, 108, 20908–20912. [Google Scholar] [CrossRef]
- Kruger, T.P.; Wientjes, E.; Croce, R.; van Grondelle, R. Conformational switching explains the intrinsic multifunctionality of plant light-harvesting complexes. Proc. Natl. Acad. Sci. USA 2011, 108, 13516–13521. [Google Scholar]
- Lejay, L.; Wirth, J.; Pervent, M.; Cross, J.M.; Tillard, P.; Gojon, A. Oxidative pentose phosphate pathway-dependent sugar sensing as a mechanism for regulation of root ion transporters by photosynthesis. Plant Physiol. 2008, 146, 2036–2053. [Google Scholar] [CrossRef]
- Hutchings, D.; Rawsthorne, S.; Emes, M.J. Fatty acid synthesis and the oxidative pentose phosphate pathway in developing embryos of oilseed rape (Brassica napus L.). J. Exp. Bot. 2005, 56, 577–585. [Google Scholar] [CrossRef]
- Arora, K.K.; Cortis, P.; Bleakley, P.A.; Williams, J.F. Identification and measurement of d-glycero-d-ido-octulose 1,8-bisphosphate: d-Aaltro-heptulose 7-phosphotransferase enzyme in tissues with L-type pentose phosphate pathway activity. Int. J. Biochem. 1985, 17, 1329–1337. [Google Scholar] [CrossRef]
- Caspar, T.; Huber, S.C.; Somerville, C. Alterations in growth, photosynthesis, and respiration in a starchless mutant of Arabidopsis thaliana (L.) deficient in chloroplast phosphoglucomutase activity. Plant Phys. 1985, 79, 11–17. [Google Scholar] [CrossRef]
- Streb, S.; Egli, B.; Eicke, S.; Zeeman, S.C. The debate on the pathway of starch synthesis: A closer look at low-starch mutants lacking plastidial phosphoglucomutase supports the chloroplast-localized pathway. Plant Phys. 2009, 151, 1769–1772. [Google Scholar] [CrossRef]
- Lytovchenko, A.; Hajirezaei, M.; Eickmeier, I.; Mittendorf, V.; Sonnewald, U.; Willmitzer, L.; Fernie, A.R. Expression of an Escherichia coli phosphoglucomutase in potato (Solanum tuberosum L.) results in minor changes in tuber metabolism and a considerable delay in tuber sprouting. Planta 2005, 221, 915–927. [Google Scholar] [CrossRef]
- Li, L.; Ban, Z.J.; Li, X.H.; Wu, M.Y.; Wang, A.L.; Jiang, Y.Q.; Jiang, Y.H. Differential expression of anthocyanin biosynthetic genes and transcription factor PcMYB10 in pears (Pyrus communis L.). PLoS One 2012, 7, e46070. [Google Scholar]
- Ganesan, G.; Sankararamasubramanian, H.M.; Harikrishnan, M.; Ashwin, G.; Parida, A. A MYB transcription factor from the grey mangrove is induced by stress and confers NaCl tolerance in tobacco. J. Exp. Bot. 2012, 63, 4549–4561. [Google Scholar] [CrossRef]
- Yu, F.; Huaxia, Y.; Lu, W.; Wu, C.; Cao, X.; Guo, X. GhWRKY15, a member of the WRKY transcription factor family identified from cotton (Gossypium hirsutum L.), is involved in disease resistance and plant development. BMC Plant Biol. 2012, 12, 144. [Google Scholar]
- Jiang, Y.; Zeng, B.; Zhao, H.; Zhang, M.; Xie, S.; Lai, J. Genome-wide transcription factor gene prediction and their expressional tissue-specificities in maizeF. J. Integr. Plant Biol. 2012, 54, 616–630. [Google Scholar] [CrossRef]
- Dong, W.; Ai, X.; Xu, F.; Quan, T.; Liu, S.; Xia, G. Isolation and characterization of a bread wheat salinity responsive ERF transcription factor. Gene 2012, 511, 38–45. [Google Scholar] [CrossRef]
- Li, X.; Chen, L.; Hong, M.; Zhang, Y.; Zu, F.; Wen, J.; Yi, B.; Ma, C.; Shen, J.; Tu, J.; et al. A large insertion in bHLH transcription factor BrTT8 resulting in yellow seed coat in Brassica rapa. PLoS One 2012, 7, e44145. [Google Scholar]
- Hu, L.; Lu, H.; Liu, Q.; Chen, X.; Jiang, X. Overexpression of mtlD gene in transgenic Populus tomentosa improves salt tolerance through accumulation of mannitol. Tree Phys. 2005, 25, 1273–1281. [Google Scholar] [CrossRef]
- Chang, S.; Puryear, J.; Cairney, J. A simple and efficient method for isolating RNA from pine trees. Plant Mol. Biol. Rep. 1993, 11, 113–116. [Google Scholar] [CrossRef]
- Tuskan, G.A.; Difazio, S.; Jansson, S.; Bohlmann, J.; Grigoriev, I.; Hellsten, U.; Putnam, N.; Ralph, S.; Rombauts, S.; Salamov, A.; et al. The genome of black cottonwood, Populus trichocarpa (Torr. & Gray). Science 2006, 313, 1596–1604. [Google Scholar] [CrossRef]
- Li, R.; Yu, C.; Li, Y.; Lam, T.W.; Yiu, S.M.; Kristiansen, K.; Wang, J. SOAP2: An improved ultrafast tool for short read alignment. Bioinformatics 2009, 25, 1966–1967. [Google Scholar] [CrossRef]
- ’t Hoen, P.A.; Ariyurek, Y.; Thygesen, H.H.; Vreugdenhil, E.; Vossen, R.H.; de Menezes, R.X.; Boer, J.M.; van Ommen, G.J.; den Dunnen, J.T. Deep sequencing-based expression analysis shows major advances in robustness, resolution and inter-lab portability over five microarray platforms. Nucleic Acids Res. 2008, 36, e141. [Google Scholar] [CrossRef]
- Audic, S.; Claverie, J.M. The significance of digital gene expression profiles. Genome Res. 1997, 7, 986–995. [Google Scholar]
- Du, Z.; Zhou, X.; Ling, Y.; Zhang, Z.H.; Su, Z. agriGO: A GO analysis toolkit for the agricultural community. Nucleic Acids Res. 2010, 38, W64–W70. [Google Scholar] [CrossRef]
- Livak, K.J.; Schmittgen, T.D. Analysis of relative gene expression data using real-time quantitative PCR and the 2−ΔΔCt method. Methods 2001, 25, 402–408. [Google Scholar] [CrossRef]
© 2014 by the authors; licensee MDPI, Basel, Switzerland. This article is an open access article distributed under the terms and conditions of the Creative Commons Attribution license (http://creativecommons.org/licenses/by/3.0/).
Share and Cite
Chen, S.; Bai, S.; Liu, G.; Li, H.; Jiang, J. Comparative Genomic Analysis of Transgenic Poplar Dwarf Mutant Reveals Numerous Differentially Expressed Genes Involved in Energy Flow. Int. J. Mol. Sci. 2014, 15, 15603-15621. https://doi.org/10.3390/ijms150915603
Chen S, Bai S, Liu G, Li H, Jiang J. Comparative Genomic Analysis of Transgenic Poplar Dwarf Mutant Reveals Numerous Differentially Expressed Genes Involved in Energy Flow. International Journal of Molecular Sciences. 2014; 15(9):15603-15621. https://doi.org/10.3390/ijms150915603
Chicago/Turabian StyleChen, Su, Shuang Bai, Guifeng Liu, Huiyu Li, and Jing Jiang. 2014. "Comparative Genomic Analysis of Transgenic Poplar Dwarf Mutant Reveals Numerous Differentially Expressed Genes Involved in Energy Flow" International Journal of Molecular Sciences 15, no. 9: 15603-15621. https://doi.org/10.3390/ijms150915603