Prediction of Multi-Target Networks of Neuroprotective Compounds with Entropy Indices and Synthesis, Assay, and Theoretical Study of New Asymmetric 1,2-Rasagiline Carbamates


Abstract
:1. Introduction
2. Results and Discussion
2.1. Development of New Model for Prediction of Drug–Target Networks
2.1.1. Model Training and Validation

| Descriptor | Sub-Set | Stat. a | % | Groups | Ci(mj)pred = 1 | Ci(mj)pred = 0 | Reference |
|---|---|---|---|---|---|---|---|
| MI-Entropy | Train | Sp | 79.0 | Lij(Cq)obs = 1 | 1092 | 290 | This work |
| Sn | 91.5 | Lij(Cq)obs = 0 | 412 | 4438 | |||
| Ac | 88.7 | Total | |||||
| CV | Sp | 81.3 | Lij(Cq)obs = 1 | 379 | 87 | ||
| Sn | 92.6 | Lij(Cq)obs = 0 | 119 | 1492 | |||
| Ac | 90.1 | Total | |||||
| MI spectral moments | Train | Sp | 84.6 | Lij(Cq)obs = 1 | 1172 | 214 | [52] |
| Sn | 82.4 | Lij(Cq)obs = 0 | 224 | 1051 | |||
| Ac | 83.5 | Total | |||||
| CV | Sp | 83.3 | Lij(Cq)obs = 1 | 385 | 77 | ||
| Sn | 81.6 | Lij(Cq)obs = 0 | 78 | 347 | |||
| Ac | 82.5 | Total | |||||
| TM spectral moments | Train | Sp | 81.3 | Lij(Cq)obs = 1 | 1533 | 352 | [51] |
| Sn | 98.0 | Lij(Cq)obs = 0 | 36 | 1762 | |||
| Ac | 89.5 | Total | |||||
| CV | Sp | 81.0 | Lij(Cq)obs = 1 | 513 | 120 | ||
| Sn | 97.7 | Lij(Cq)obs = 0 | 14 | 585 | |||
| Ac | 89.1 | Total |
| Compound (i) | pij(cq) | Assay ID | Measure (Units) | Organism | Target Protein |
|---|---|---|---|---|---|
| Arecoline | 0.94 | 796814 | Efficiency (%) | rno | Muscarinic acetylcholine receptor |
| Bipinnatin-A | 1.00 | 751272 | Inhibition (%) | mmu | Acetylcholine receptor protein β chain |
| Carachol | 0.99 | 796814 | Efficiency (%) | rno | Muscarinic acetylcholine receptor |
| Caulophylline | 0.96 | 838016 | EC50 (nM) | hsa | Neuronal acetylcholine receptor; α4/β2 |
| Citalopram | 0.99 | 740208 | Ki (nM) | mmu | Dopamine transporter |
| Condelphine | 1.00 | 748943 | −Log(IC50) (nM) | rno | Neuronal acetylcholine receptor protein α-7 subunit |
| Delcorine | 1.00 | 748943 | −Log(IC50) (nM) | rno | Neuronal acetylcholine receptor protein α-7 subunit |
| Delsoline | 1.00 | 748943 | −Log(IC50) (nM) | rno | Neuronal acetylcholine receptor protein α-7 subunit |
| Desipramine | 0.99 | 797692 | −Log(IC50) (nM) | rno | Norepinephrine transporter |
| Elatine | 1.00 | 748943 | −Log(IC50) (nM) | rno | Neuronal acetylcholine receptor protein α-7 subunit |
| Emopamil | 1.00 | 817225 | −Log(IC50) (nM) | rno | Voltage-gated R-type calcium channel α-1E subunit |
| Epibatidine | 0.94 | 838016 | EC50 (nM) | hsa | Neuronal acetylcholine receptor; α4/β2 |
| Epibatidine | 0.19 | 825420 | Efficacy (%) | hsa | Neuronal acetylcholine receptor; α4/β2 |
| Femoxetine | 0.99 | 740206 | Ki (nM) | mmu | Dopamine transporter |
| Femoxetine | 0.99 | 740207 | Ki (nM) | mmu | Norepinephrine transporter |
| Femoxetine | 0.99 | 740208 | Ki (nM) | mmu | Dopamine transporter |
| Fisetin | 0.05 | 1027709 | %max (%) | mmu | HT22 cells |
| Fluoxetine | 0.99 | 740207 | Ki (nM) | mmu | Norepinephrine transporter |
| Fluoxetine | 0.99 | 740208 | Ki (nM) | mmu | Dopamine transporter |
| Imipramine | 0.99 | 740206 | Ki (nM) | mmu | Dopamine transporter |
| Imipramine | 0.99 | 740207 | Ki (nM) | mmu | Norepinephrine transporter |
| Imipramine | 0.99 | 740208 | Ki (nM) | mmu | Dopamine transporter |
| Inuline | 1.00 | 748943 | −Log(IC50) (nM) | rno | Neuronal acetylcholine receptor protein α-7 subunit |
| Karacoline | 1.00 | 748943 | −Log(IC50) (nM) | rno | Neuronal acetylcholine receptor protein α-7 subunit |
| l-Arginine | 0.99 | 755144 | Activity (nM) | hsa | Nitric-oxide synthase, brain |
| l-NIL | 0.59 | 752266 | −Log(IC50) (nM) | hsa | Nitric-oxide synthase, brain |
| l-NMMA | 0.99 | 876477 | −Log(IC50) (nM) | hsa | Nitric-oxide synthase, brain |
| l-NNA | 0.98 | 752385 | −Log(IC50) (nM) | hsa | Nitric-oxide synthase, brain |
| l-NNA | 0.86 | 752276 | Ki (nM) | hsa | Nitric-oxide synthase, brain |
| LY-379268 | 0.99 | 714803 | Activity (nM) | hsa | Metabotropic glutamate receptor 4 |
| LY-379268 | 0.99 | 877752 | Activity (nM) | hsa | Metabotropic glutamate receptor 2 |
| LY-379268 | 0.99 | 718128 | Activity (nM) | hsa | Metabotropic glutamate receptor 6 |
| LY-389795 | 0.99 | 718128 | Activity (nM) | hsa | Metabotropic glutamate receptor 6 |
| LY-389795 | 0.98 | 715721 | Activity (nM) | hsa | Metabotropic glutamate receptor 5 |
| LY-389795 | 0.97 | 714446 | Activity (nM) | hsa | Metabotropic glutamate receptor 3 |
| Lycoctonine | 1.00 | 748943 | −Log(IC50) (nM) | rno | Neuronal acetylcholine receptor protein α-7 subunit |
| M826 | 1.00 | 841780 | Ki (nM) | hsa | Caspase-3 |
| M827 | 1.00 | 841780 | Ki (nM) | hsa | Caspase-3 |
| Methyllycaconitine | 1.00 | 750084 | Ki (nM) | rno | Neuronal acetylcholine receptor protein α-10 subunit |
| NBQX | 0.99 | 641893 | −Log(IC50) (nM) | rno | Glutamate receptor ionotropic, AMPA 2 |
| NBQX | 0.99 | 641893 | −Log(IC50) (nM) | rno | Glutamate receptor ionotropic, AMPA 4 |
| NBQX | 0.99 | 641893 | −Log(IC50) (nM) | rno | Glutamate receptor ionotropic, AMPA 3 |
| NBQX | 0.99 | 641893 | −Log(IC50) (nM) | mmu | Glutamate receptor ionotropic, AMPA 1 |
| Nipecotic acid | 0.28 | 785010 | −Log(IC50) (nM) | rno | GABA transporter 1 |
| Nipecotic acid | 0.28 | 785010 | −Log(IC50) (nM) | rno | GABA transporter 2 |
| Nipecotic acid | 0.28 | 785010 | −Log(IC50) (nM) | rno | GABA transporter 3 |
| Nipecotic acid | 0.28 | 785010 | −Log(IC50) (nM) | rno | Betaine transporter |
| NOHA | 0.04 | 755137 | NO formation (%) | rno | Nitric-oxide synthase, brain |
| Norepinephrine | 0.98 | 780755 | Concentration (% dose·g−1) | rno | |
| Nudicauline | 1.00 | 748943 | −Log(IC50) (nM) | rno | Neuronal acetylcholine receptor protein α-7 subunit |
| Omega nitro-arginine | 0.99 | 752258 | Ki (nM) | hsa | Nitric-oxide synthase, brain |
| Oxotremorine | 0.84 | 798083 | pD2 | rno | Muscarinic acetylcholine receptor M1 |
| Paroxetine | 1.00 | 740206 | Ki (nM) | mmu | Dopamine transporter |
| RedAm-Ethyl | 0.33 | 840782 | Selectivity | hsa | Nitric-oxide synthase, endothelial |
| RedAm-Ethyl | 0.28 | 840782 | Selectivity | hsa | Nitric-oxide synthase, brain |
| Resveratrol | 0.99 | 1613870 | EC50 (nM) | hsa | Nuclear factor NF-κB p105 subunit |
| Resveratrol | 0.99 | 1613870 | EC50 (nM) | hsa | Nuclear factor NF-κB p65 subunit |
| Stemofoline | 1.00 | 936299 | EC50 (nM) | hvi | Nicotinic acetylcholine receptor α1 subunit |
| Thiocytisine | 0.51 | 857972 | Log Ki | rno | Neuronal acetylcholine receptor; α4/β2 |
2.1.2. Comparison with Other ALMA Models
| Statistics | p1(cj)·<θk(cq)> | Experimental Measure (units) | Statistics | ||||||||||||
|---|---|---|---|---|---|---|---|---|---|---|---|---|---|---|---|
| n(sx) | n1(sx) | p1(sx) | 1 | 2 | 3 | 4 | 5 | n(sx) | n1(sx) | p1(sx) | 1 | 2 | 3 | 4 | |
| 2438 | 2148 | 0.88 | 2.03 | 2.08 | 2.04 | 2.04 | 2.03 | ED50 (μg·kg−1) | 19 | 14 | 0.74 | 1.58 | 1.6 | 1.59 | 1.59 |
| 2149 | 1975 | 0.92 | 1.87 | 1.91 | 1.89 | 1.89 | 1.88 | ED50 (nM) | 18 | 14 | 0.78 | 2.14 | 2.17 | 2.14 | 2.14 |
| 1501 | 1418 | 0.94 | 2.01 | 2.06 | 2.03 | 2.02 | 2.01 | NO formation (%) | 18 | 6 | 0.33 | 0.63 | 0.64 | 0.63 | 0.63 |
| 486 | 102 | 0.21 | 0.5 | 0.51 | 0.51 | 0.51 | 0.51 | Efficiency (%) | 14 | 11 | 0.79 | 1.58 | 1.61 | 1.6 | 1.6 |
| 299 | 130 | 0.43 | 0.89 | 0.91 | 0.89 | 0.89 | 0.88 | Kup (mL·min−1·g−1) | 13 | 5 | 0.38 | 0.75 | 0.76 | 0.76 | 0.76 |
| 222 | 105 | 0.47 | 1.22 | 1.24 | 1.23 | 1.23 | 1.22 | Conc. (%·dose·g−1) | 12 | 7 | 0.58 | 1.14 | 1.15 | 1.14 | 1.14 |
| 193 | 93 | 0.48 | 0.99 | 1 | 0.99 | 0.99 | 0.98 | Efficacy (%) | 12 | 6 | 0.5 | 0.58 | 0.58 | 0.58 | 0.59 |
| 166 | 61 | 0.37 | 0.94 | 0.95 | 0.93 | 0.93 | 0.92 | Ratio Ki | 12 | 2 | 0.17 | 0.38 | 0.39 | 0.39 | 0.39 |
| 124 | 72 | 0.58 | 0.96 | 0.97 | 0.96 | 0.96 | 0.96 | MTT reduction (%) | 11 | 4 | 0.36 | 0.58 | 0.57 | 0.57 | 0.56 |
| 108 | 31 | 0.29 | 0.66 | 0.67 | 0.66 | 0.66 | 0.65 | Relative potency | 11 | 4 | 0.36 | 0.93 | 0.94 | 0.92 | 0.92 |
| 98 | 93 | 0.95 | 1.74 | 1.77 | 1.75 | 1.75 | 1.74 | ED50 (μg·mL−1) | 10 | 4 | 0.4 | 0.99 | 1.02 | 0.99 | 0.99 |
| 84 | 26 | 0.31 | 0.51 | 0.51 | 0.51 | 0.52 | 0.52 | Activity | 8 | 5 | 0.63 | 1.98 | 2.01 | 1.99 | 1.99 |
| 56 | 17 | 0.3 | 0.56 | 0.58 | 0.57 | 0.57 | 0.57 | Damage score | 8 | 2 | 0.25 | 0.5 | 0.51 | 0.5 | 0.49 |
| 56 | 32 | 0.57 | 1.1 | 1.12 | 1.11 | 1.1 | 1.1 | Mean response | 8 | 5 | 0.63 | 1.44 | 1.48 | 1.46 | 1.46 |
| 36 | 25 | 0.69 | 1.69 | 1.73 | 1.7 | 1.69 | 1.68 | Survived (%) | 8 | 5 | 0.63 | 1.04 | 1.04 | 1.04 | 1.04 |
| 20 | 4 | 0.2 | 0.55 | 0.56 | 0.55 | 0.55 | 0.54 | Rescued neurons (%) | 5 | 2 | 0.4 | 0.59 | 0.6 | 0.61 | 0.62 |
| n(oj) | n1(oj) | p1(oj) | 1 | 2 | 3 | 4 | 5 | Organism | n(oj) | n1(oj) | p1(oj) | 1 | 2 | 3 | 4 |
| 2852 | 1998 | 0.7 | 1.51 | 1.54 | 1.52 | 1.52 | 1.51 | B. taurus | 77 | 21 | 0.27 | 0.63 | 0.63 | 0.63 | 0.63 |
| 4854 | 4090 | 0.84 | 1.82 | 1.86 | 1.83 | 1.83 | 1.82 | C. porcellus | 20 | 16 | 0.8 | 1.35 | 1.36 | 1.35 | 1.35 |
| 10 | 7 | 0.7 | 1.66 | 1.7 | 1.68 | 1.67 | 1.66 | H. virescens | 5 | 5 | 1 | 2.78 | 2.83 | 2.78 | 2.78 |
| 241 | 173 | 0.72 | 1.5 | 1.53 | 1.51 | 1.51 | 1.51 | M. domestica | 15 | 15 | 1 | 1.62 | 1.66 | 1.67 | 1.68 |
| 19 | 11 | 0.58 | 1.34 | 1.37 | 1.35 | 1.35 | 1.34 | C. elegans | 2 | 1 | 0.5 | 1.28 | 1.31 | 1.28 | 1.27 |
| 8 | 2 | 0.25 | 0.5 | 0.51 | 0.5 | 0.49 | 0.49 | D. melanogaster | 2 | 1 | 0.5 | 1.28 | 1.31 | 1.28 | 1.27 |
| n(tj) | n1(tj) | p1(tj) | 1 | 2 | 3 | 4 | 5 | ||||||||
| 403 | 254 | 0.63 | 1.34 | 1.36 | 1.34 | 1.34 | 1.34 | ||||||||
| 77 | 21 | 0.27 | 0.63 | 0.63 | 0.63 | 0.63 | 0.63 | ||||||||
| 128 | 32 | 0.25 | 0.53 | 0.54 | 0.53 | 0.53 | 0.53 | ||||||||
| 859 | 562 | 0.65 | 1.30 | 1.32 | 1.30 | 1.30 | 1.30 | ||||||||
| 88 | 18 | 0.20 | 0.50 | 0.51 | 0.50 | 0.50 | 0.50 | ||||||||
| 1000 | 923 | 0.92 | 1.88 | 1.91 | 1.89 | 1.89 | 1.88 | ||||||||
| 104 | 90 | 0.87 | 1.82 | 1.87 | 1.84 | 1.84 | 1.82 | ||||||||
| 79 | 66 | 0.84 | 1.78 | 1.83 | 1.80 | 1.80 | 1.79 | ||||||||
| 37 | 31 | 0.84 | 1.97 | 2.04 | 2.01 | 2.01 | 2.00 | ||||||||
| 29 | 28 | 0.97 | 1.98 | 2.02 | 2.00 | 1.99 | 1.98 | ||||||||
| n(cj) | n1(cj) | p1(cj)j | 1 | 2 | 3 | 4 | 5 | ||||||||
| 2000 | 1846 | 0.92 | 1.88 | 1.91 | 1.89 | 1.89 | 1.88 | ||||||||
| 646 | 646 | 1.00 | 2.31 | 2.37 | 2.32 | 2.30 | 2.28 | ||||||||
| 390 | 390 | 1.00 | 2.12 | 2.16 | 2.13 | 2.12 | 2.11 | ||||||||
| 299 | 130 | 0.43 | 0.89 | 0.91 | 0.89 | 0.89 | 0.88 | ||||||||
| 114 | 99 | 0.87 | 1.46 | 1.48 | 1.46 | 1.46 | 1.45 | ||||||||
| 74 | 17 | 0.22 | 0.56 | 0.57 | 0.56 | 0.56 | 0.56 | ||||||||
| 50 | 50 | 1.00 | 2.93 | 2.97 | 2.93 | 2.91 | 2.89 | ||||||||
| 50 | 50 | 1.00 | 2.93 | 2.97 | 2.93 | 2.91 | 2.89 | ||||||||
| 50 | 50 | 1.00 | 2.93 | 2.97 | 2.93 | 2.91 | 2.89 | ||||||||
| 11 | 11 | 1.00 | 2.95 | 3.00 | 2.96 | 2.94 | 2.92 | ||||||||
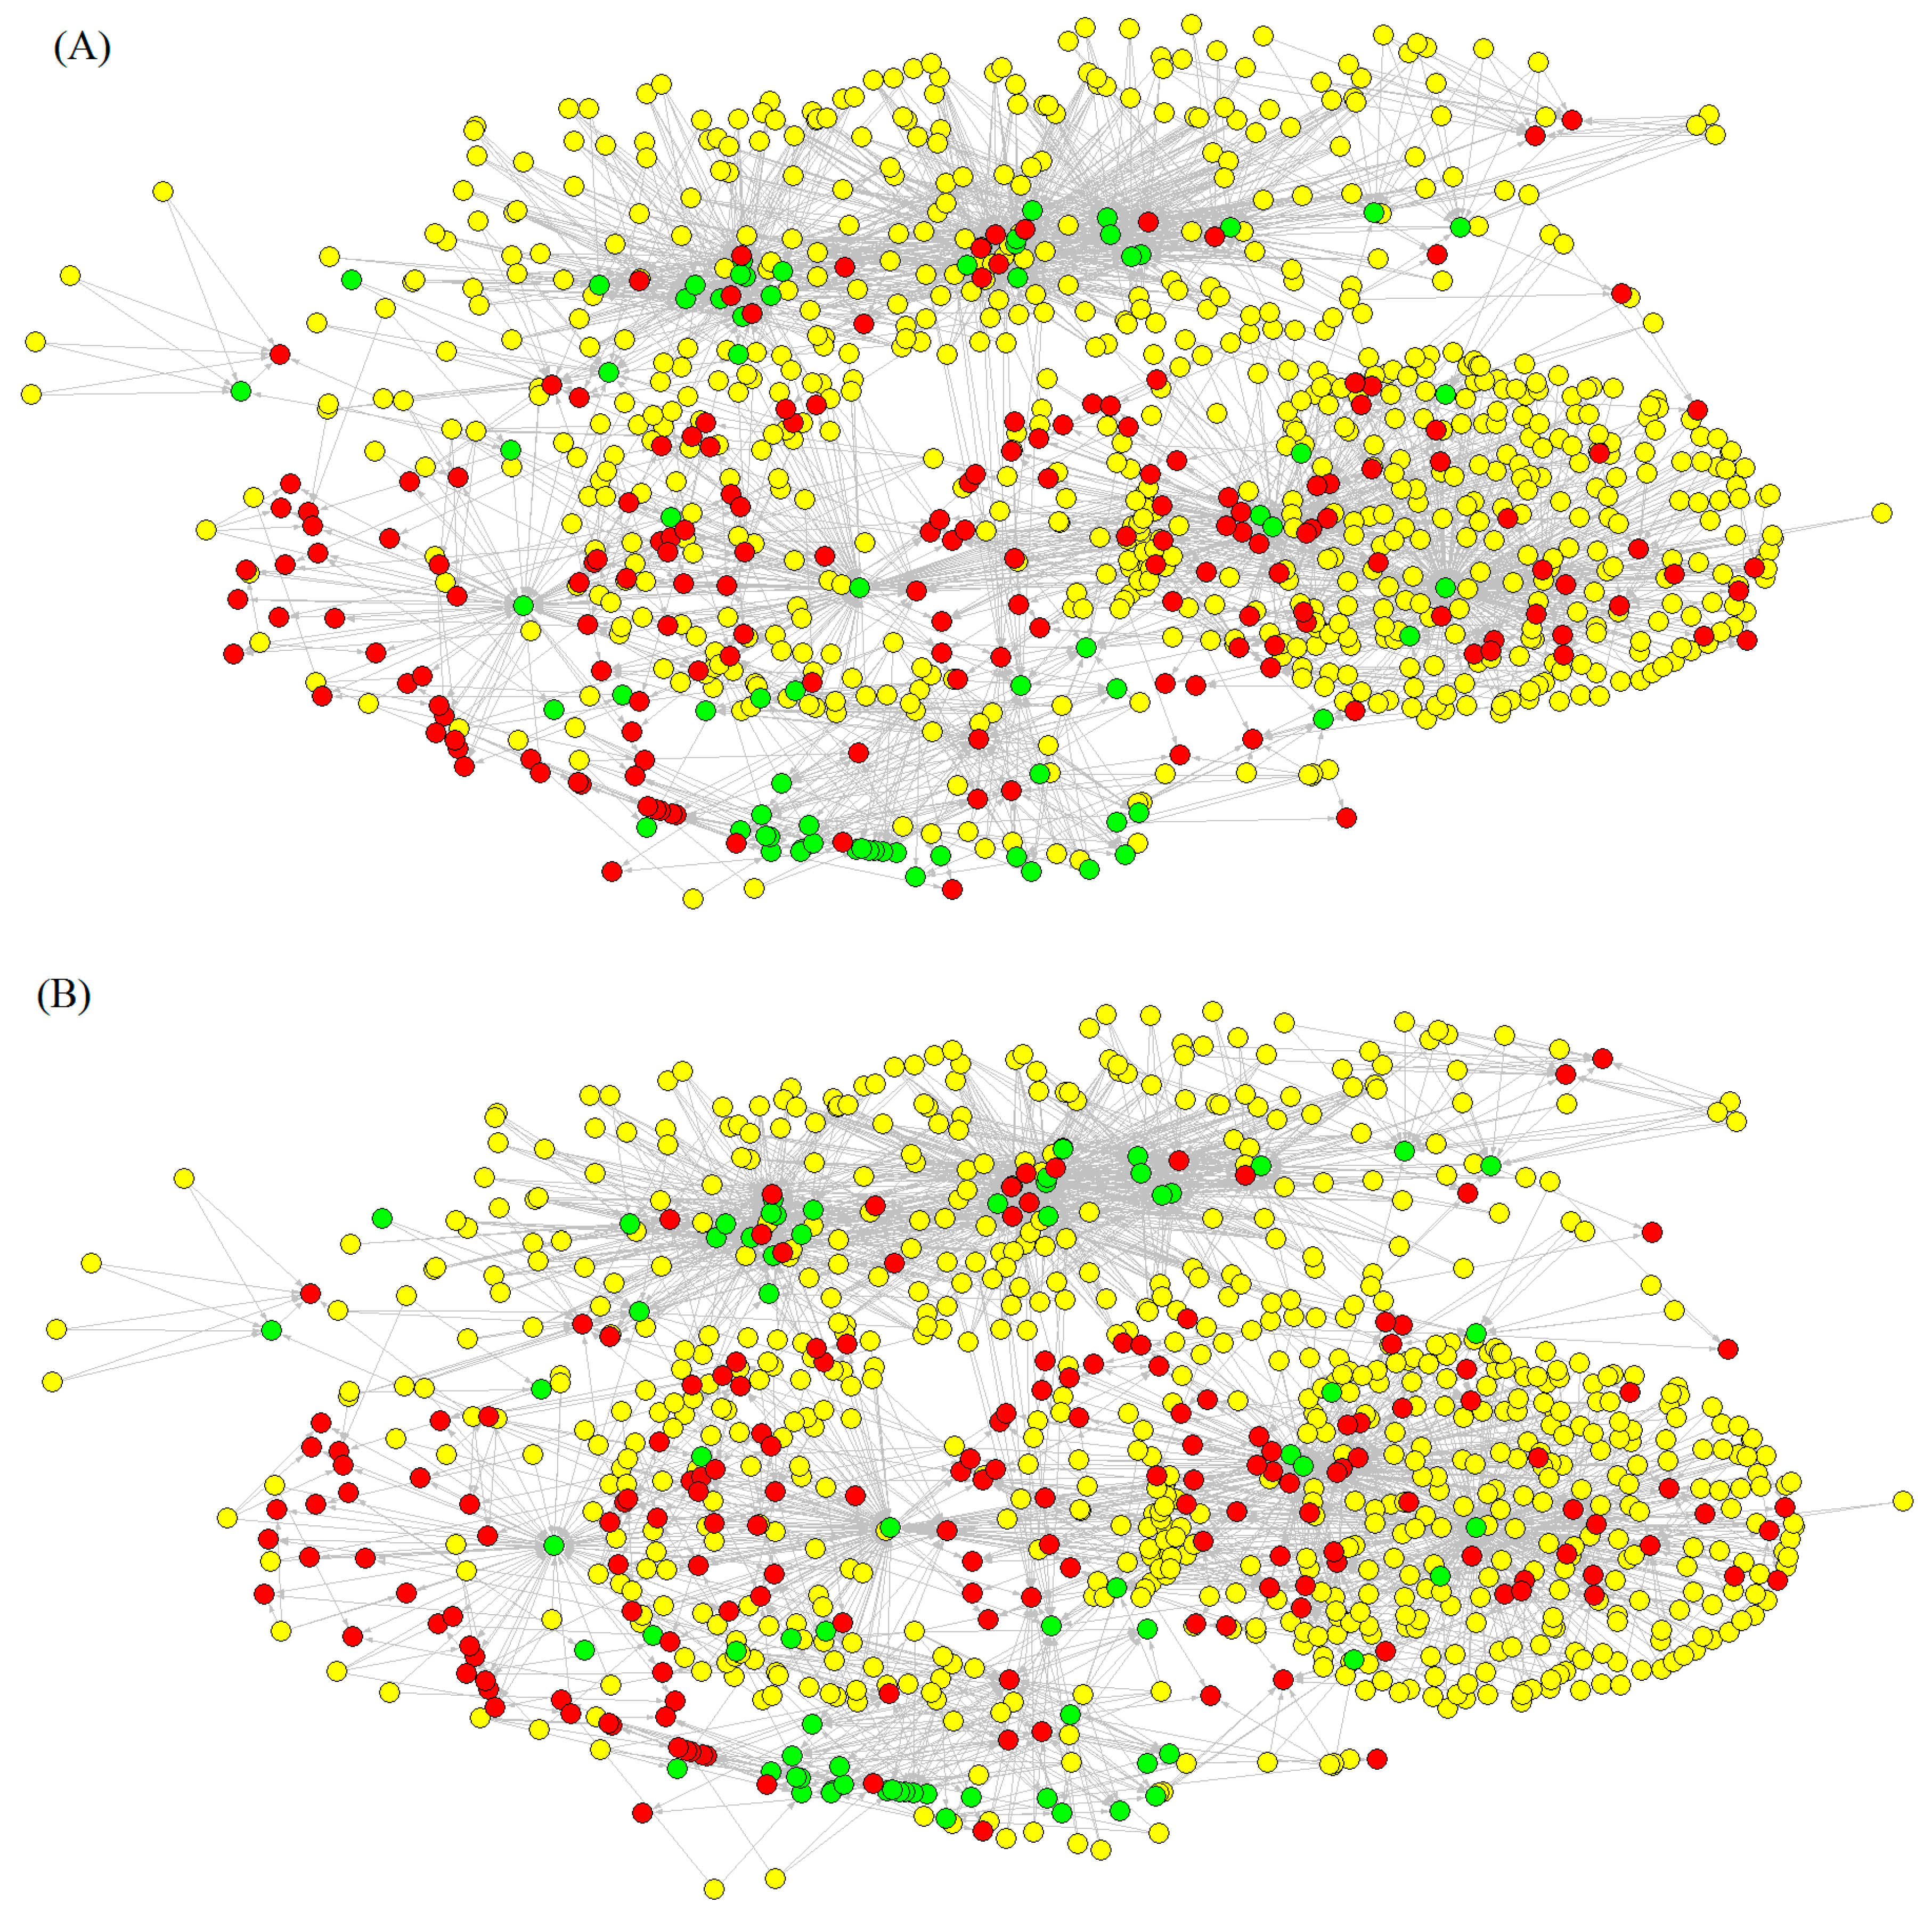
2.1.3. Construction of Drug–Target Networks with ALMA Models
| Network | Node Type | n | Sh1 a | δ | δin | δout |
|---|---|---|---|---|---|---|
| Observed | Total | 2450 | 0.00428 | 7 | 3 | 3 |
| Compounds | 2103 | 0.00413 | 6 | 3 | 3 | |
| Assays | 211 | 0.00575 | 6 | 3 | 3 | |
| Rat proteins | 54 | 0.00291 | 7 | 4 | 3 | |
| Human proteins | 70 | 0.00568 | 21 | 18 | 3 | |
| 1 | Total | 2508 | 0.00438 | 7 | 3 | 3 |
| Compounds | 2208 | 0.00446 | 6 | 3 | 3 | |
| Assays | 183 | 0.00468 | 15 | 11 | 4 | |
| Rat proteins | 40 | 0.00279 | 6 | 3 | 3 | |
| Human proteins | 67 | 0.00210 | 5 | 1 | 3 | |
| 2 | Total | 2511 | 0.00428 | 7 | 3 | 3 |
| Compounds | 2209 | 0.00445 | 6 | 3 | 3 | |
| Assays | 184 | 0.00464 | 15 | 11 | 4 | |
| Rat proteins | 40 | 0.00266 | 6 | 3 | 3 | |
| Human proteins | 68 | 0.00209 | 4 | 1 | 3 | |
| 3 | Total | 2511 | 0.0044 | 7 | 3 | 3 |
| Compounds | 2209 | 0.00445 | 6 | 3 | 3 | |
| Assays | 184 | 0.00464 | 15 | 11 | 4 | |
| Rat proteins | 40 | 0.00266 | 6 | 3 | 3 | |
| Human proteins | 68 | 0.00209 | 4 | 1 | 3 | |
| 4 | Total | 2491 | 0.0046 | 7 | 3 | 3 |
| Compounds | 2209 | 0.00471 | 6 | 3 | 3 | |
| Assays | 184 | 0.00449 | 14 | 11 | 4 | |
| Rat proteins | 40 | 0.00251 | 6 | 2 | 3 | |
| Human proteins | 68 | 0.00209 | 4 | 1 | 3 | |
| 5 | Total | 2491 | 0.0046 | 7 | 3 | 3 |
| Compounds | 2209 | 0.00471 | 6 | 3 | 3 | |
| Assays | 184 | 0.00449 | 14 | 11 | 4 | |
| Rat proteins | 40 | 0.00251 | 6 | 2 | 3 | |
| Human proteins | 68 | 0.00209 | 4 | 1 | 3 |

2.2. Experimental and Theoretical Study of New Compounds
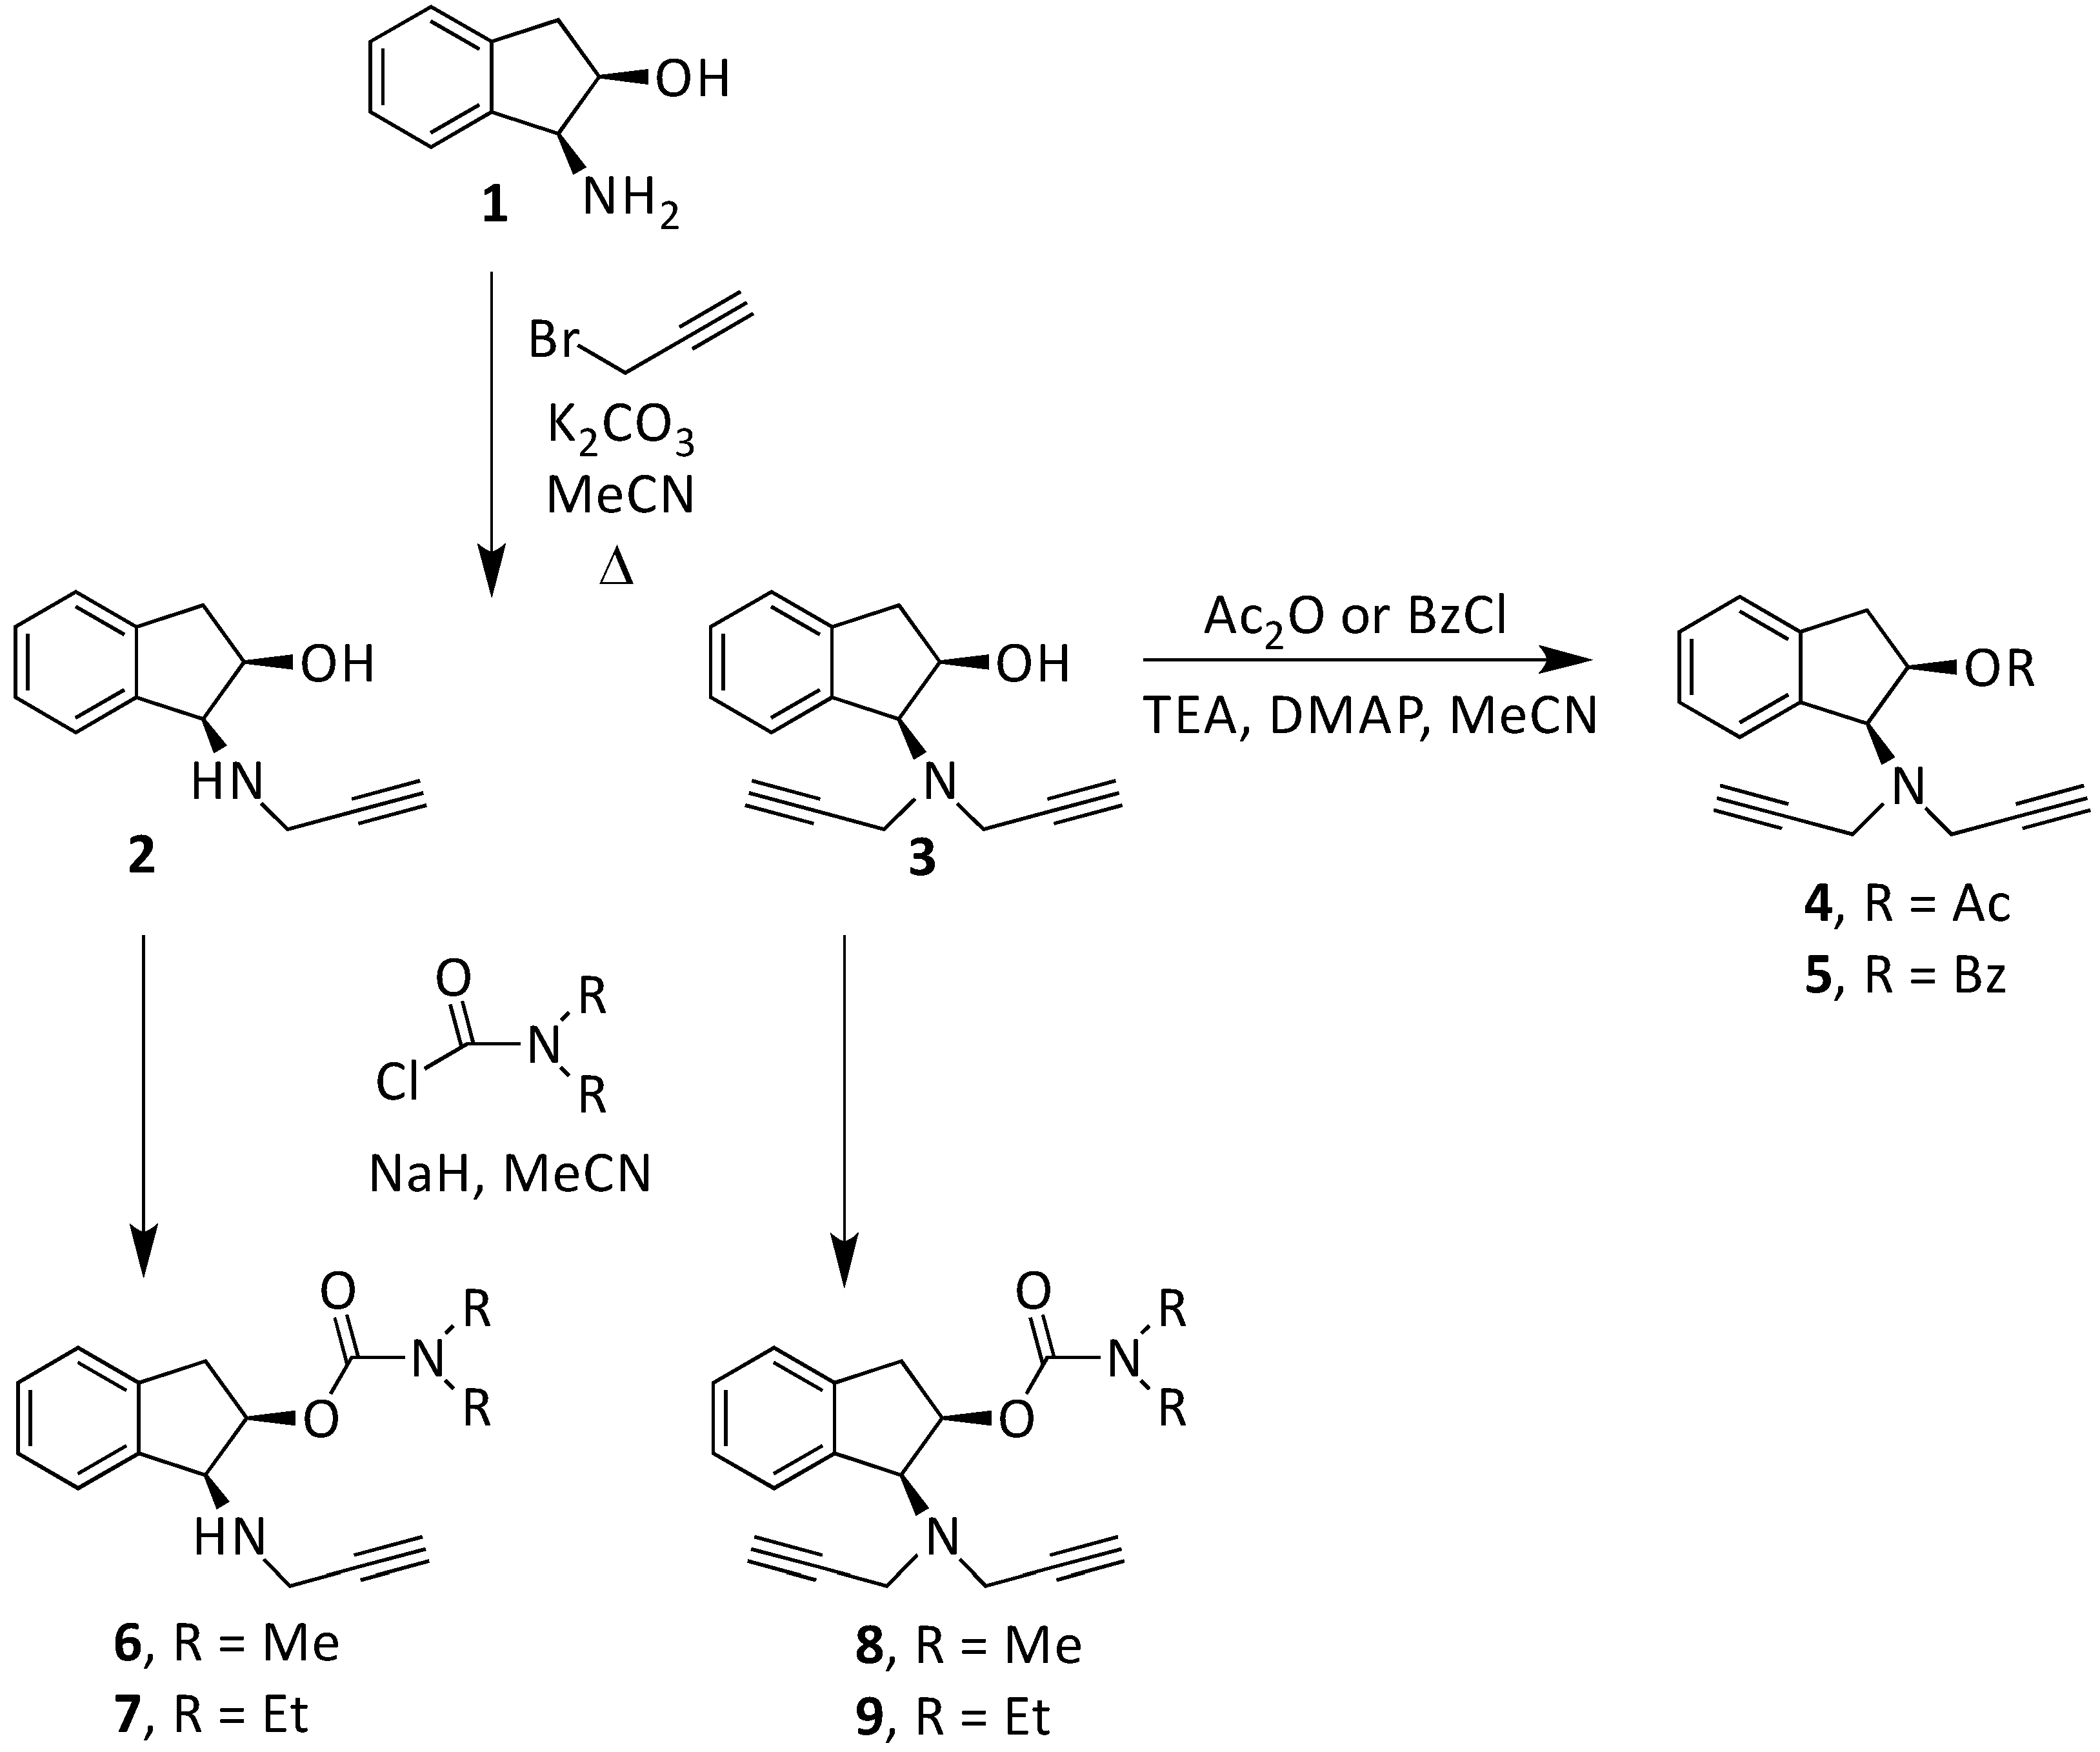
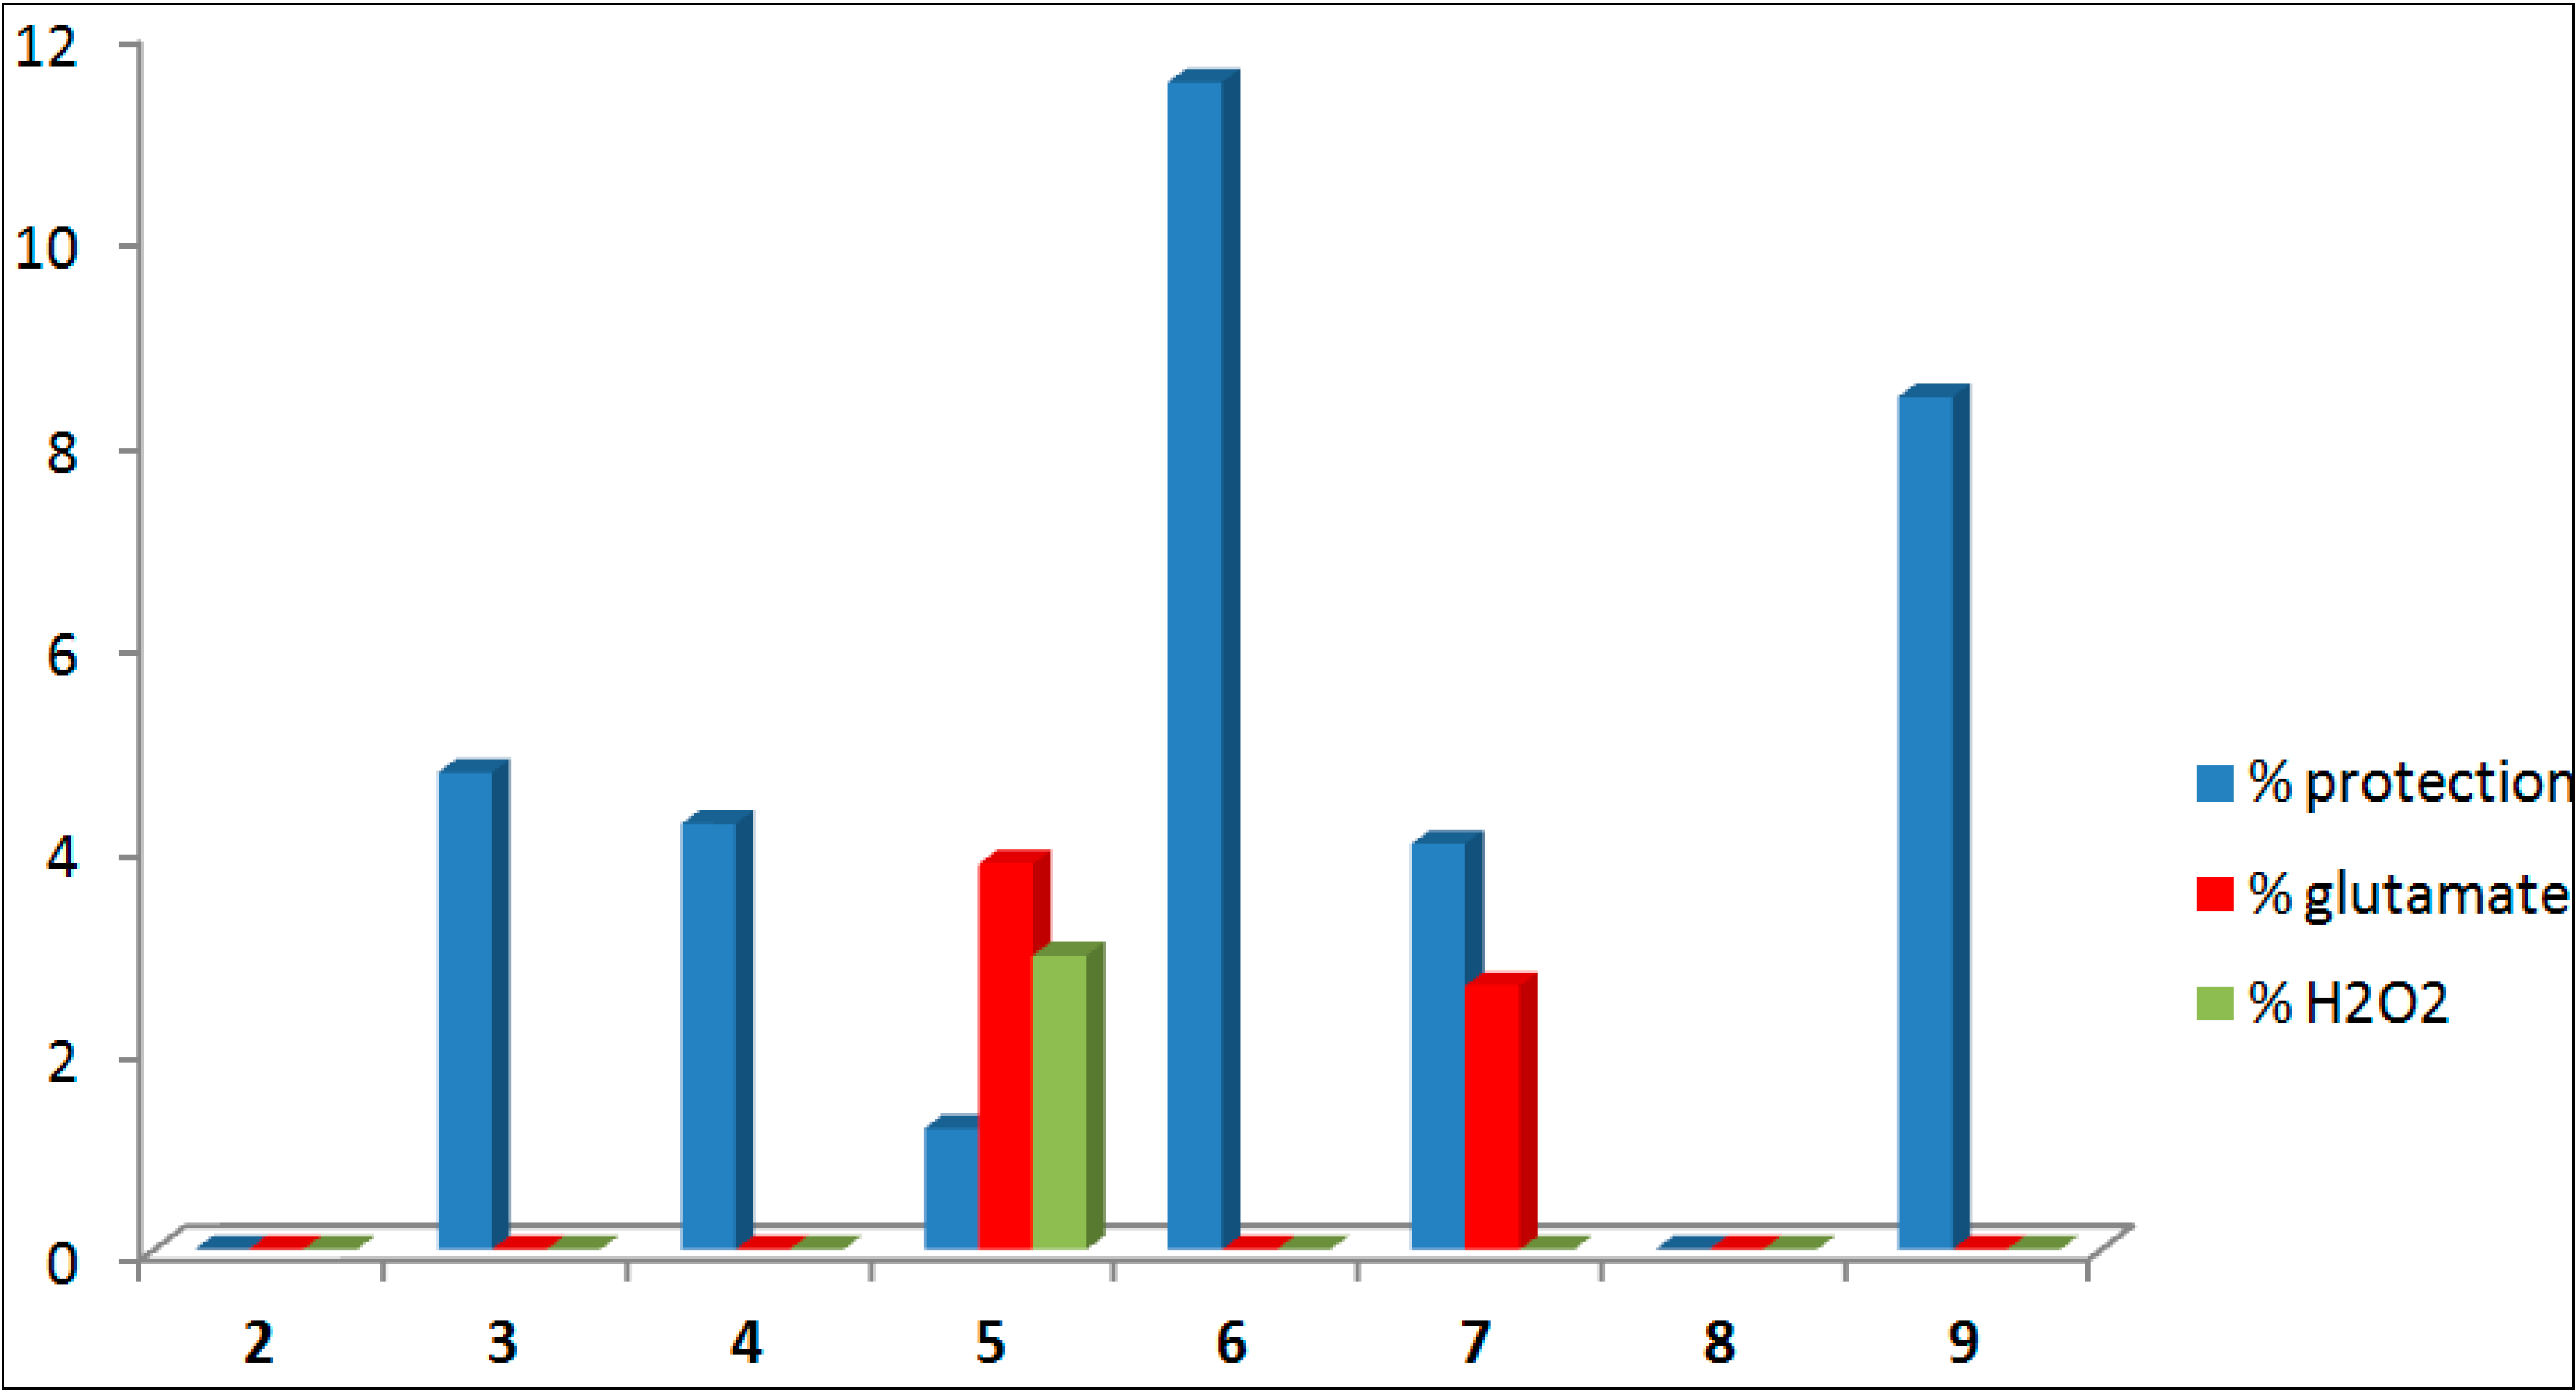
2.2.1. Synthesis and Experimental Assay of New 1,2-Rasagiline Derivatives

| Compound | Formula | % Neuro-Protection | |||||
|---|---|---|---|---|---|---|---|
| % ANA a | e.s.m. | Glutamate b | e.s.m. | H2O2c | e.s.m. | ||
| 2 | 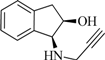 | 0.0 | 2.8 | 0.0 | 6.5 | −2.8 | 1.2 |
| 3 | 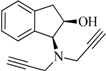 | 4.7 | 6.0 | −0.2 | 1.6 | −12.3 | 2.1 |
| 4 | 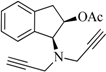 | 4.2 | 6.5 | −8.1 | 4.9 | −14.2 | 2.1 |
| 5 |  | 1.2 | 5.0 | 3.8 | 5.0 | 2.9 | 1.0 |
| 6 | 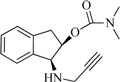 | 11.5 | 8.8 | −4.0 | 5.5 | −9.1 | 2.4 |
| 7 | 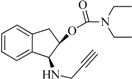 | 4.0 | 4.5 | 2.6 | 3.9 | -6.1 | 1.1 |
| 8 | 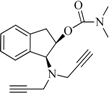 | −1.7 | 6.9 | −5.2 | 5.9 | −8.9 | 1.9 |
| 9 | 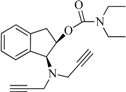 | 8.4 | 10.7 | −5.2 | 2.3 | −14.0 | 2.0 |

2.2.2. Using ALMA-Entropy Model to Predicting New Drugs in Other Assays
| Si(cj) | Meassure | Assay ID | Target ID | Target a | Neurotoxic Agent |
|---|---|---|---|---|---|
| 2.097 | pA2 | 617971 | 1899 | 5HT3aR | ANA |
| 2.097 | pA2 | 617969 | 1899 | 5HT3aR | ANA |
| 2.097 | pA2 | 617971 | 3895 | 5HT3bR | ANA |
| 2.097 | pA2 | 617969 | 3895 | 5HT3bR | ANA |
| 1.78 | Selectivity | 848737 | 3568 | bNOS | H2O2 |
| 1.78 | Selectivity | 840777 | 3568 | bNOS | H2O2 |
| 1.78 | Selectivity | 755901 | 3568 | bNOS | H2O2 |
| 1.17 | Activity (%) | 866501 | 2586 | nAChRβ-3 | H2O2 |
| 0.42 | pIC50 (nM) | 710048 | 3772 | mGluR1 | Glu |
3. Materials and Methods
3.1. Computational Methods
3.1.1. ALMA-Entropy Models
3.1.2. CHEMBL Dataset
3.2. Experimental Methods: Chemistry
3.2.1. Synthesis of 1,2-Rasagiline Derivatives
3.2.2. Reaction of Carbamylation
3.3. Experimental Methods: Biology
3.3.1. Culture of Rat Cortical Neurons
3.3.2. Measurement of Neuronal Viability
4. Conclusions
Acknowledgments
Author Contributions
Supplementary Information
Conflict of Interest
References
- Mekenyan, O.; Bonchev, D.; Trinajstic, N. Chemical graph theory modeling the thermodynamic properties of molecules. Intern. J. Quantum Chem. Symp. 1980, 18, 369–380. [Google Scholar] [CrossRef]
- Bonchev, D.; Trinajstic, N. Information theory, distance matrix, and molecular branching. J. Chem. Phys. 1977, 67, 4517–4533. [Google Scholar] [CrossRef]
- Bonchev, D.; Kamenski, D.; Kamenska, V. Symmetry and information content of chemical structures. Bull. Math. Biol. 1976, 38, 119–133. [Google Scholar] [CrossRef]
- Kier, L.B. Use of molecular negentropy to encode structure governing biological activity. J. Pharm. Sci. 1980, 69, 807–810. [Google Scholar] [CrossRef] [PubMed]
- Stahura, F.L.; Godden, J.W.; Bajorath, J. Differential Shannon entropy analysis identifies molecular property descriptors that predict aqueous solubility of synthetic compounds with high accuracy in binary QSAR calculations. J. Chem. Inf. Comput. Sci. 2002, 42, 550–558. [Google Scholar] [CrossRef] [PubMed]
- Stahura, F.L.; Godden, J.W.; Xue, L.; Bajorath, J. Distinguishing between natural products and synthetic molecules by descriptor Shannon entropy analysis and binary QSAR calculations. J. Chem. Inf. Comput. Sci. 2000, 40, 1245–1252. [Google Scholar] [CrossRef] [PubMed]
- Roy, K.; Saha, A. Comparative QSPR studies with molecular connectivity, molecular negentropy and tau indicespart I: Molecular thermochemical properties of diverse functional acyclic compounds. J. Mol. Model. 2003, 9, 259–270. [Google Scholar] [CrossRef] [PubMed]
- Agrawal, V.K.; Khadikar, P.V. Modelling of carbonic anhydrase inhibitory activity of sulfonamides using molecular negentropy. Bioorg. Med. Chem. Lett. 2003, 13, 447–453. [Google Scholar] [CrossRef] [PubMed]
- Katritzky, A.R.; Lomaka, A.; Petrukhin, R.; Jain, R.; Karelson, M.; Visser, A.E.; Rogers, R.D. QSPR correlation of the melting point for pyridinium bromides, potential ionic liquids. J. Chem. Inf. Comput. Sci. 2002, 42, 71–74. [Google Scholar] [CrossRef] [PubMed]
- Katritzky, A.R.; Perumal, S.; Petrukhin, R.; Kleinpeter, E. Codessa-based theoretical QSPR model for hydantoin HPLC-RT lipophilicities. J. Chem. Inf. Comput. Sci. 2001, 41, 569–574. [Google Scholar] [CrossRef] [PubMed]
- Graham, D.J.; Schacht, D. Base information content in organic molecular formulae. J. Chem. Inf. Comput. Sci. 2000, 40, 942. [Google Scholar] [CrossRef] [PubMed]
- Graham, D.J. Information content in organic molecules: Structure considerations based on integer statistics. J. Chem. Inf. Comput. Sci. 2002, 42, 215. [Google Scholar] [CrossRef] [PubMed]
- Graham, D.J.; Malarkey, C.; Schulmerich, M.V. Information content in organic molecules: Quantification and statistical structure via brownian processing. J. Chem. Inf. Comput. Sci. 2004, 44, 1601–1611. [Google Scholar] [CrossRef] [PubMed]
- Graham, D.J.; Schulmerich, M.V. Information content in organic molecules: Reaction pathway analysis via brownian processing. J Chem. Inf. Comput Sci. 2004, 44, 1612–1622. [Google Scholar] [CrossRef] [PubMed]
- Graham, D.J. Information content and organic molecules: Aggregation states and solvent effects. J. Chem. Inf. Model. 2005, 45, 1223–1236. [Google Scholar] [CrossRef] [PubMed]
- Graham, D.J. Information content in organic molecules: Brownian processing at low levels. J. Chem. Inf. Model. 2007, 47, 376–389. [Google Scholar] [CrossRef] [PubMed]
- Strait, B.J.; Dewey, T.G. The Shannon information entropy of protein sequences. Biophys. J. 1996, 71, 148–155. [Google Scholar] [CrossRef] [PubMed]
- Dima, R.I.; Thirumalai, D. Proteins associated with diseases show enhanced sequence correlation between charged residues. Bioinformatics 2004, 20, 2345–2354. [Google Scholar] [CrossRef] [PubMed]
- Loewenstern, D.; Yianilos, P.N. Significantly lower entropy estimates for natural dna sequences. J. Comput. Biol. 1999, 6, 125–142. [Google Scholar] [CrossRef] [PubMed]
- Manke, T.; Demetrius, L.; Vingron, M. Lethality and entropy of protein interaction networks. Genome Inform. Ser. 2005, 16, 159–163. [Google Scholar]
- Mikolas, P.; Vyhnanek, J.; Skoch, A.; Horacek, J. Analysis of FMRI time-series by entropy measures. Neuro Endocrinol. Lett. 2012, 33, 471–476. [Google Scholar] [PubMed]
- Gonzalez-Diaz, H.; Duardo-Sanchez, A.; Ubeira, F.M.; Prado-Prado, F.; Perez-Montoto, L.G.; Concu, R.; Podda, G.; Shen, B. Review of march-inside & complex networks prediction of drugs: ADMET, anti-parasite activity, metabolizing enzymes and cardiotoxicity proteome biomarkers. Curr. Drug Metab. 2010, 11, 379–406. [Google Scholar] [CrossRef] [PubMed]
- González-Díaz, H.; Molina, R.; Uriarte, E. Markov entropy backbone electrostatic descriptors for predicting proteins biological activity. Bioorg. Med. Chem. Lett. 2004, 14, 4691–4695. [Google Scholar] [CrossRef] [PubMed]
- González-Díaz, H.; de Armas, R.R.; Molina, R. Markovian negentropies in bioinformatics. 1. A picture of footprints after the interaction of the HIV-1 psi-RNA packaging region with drugs. Bioinformatics 2003, 19, 2079–2087. [Google Scholar]
- Riera-Fernandez, P.; Munteanu, C.R.; Escobar, M.; Prado-Prado, F.; Martin-Romalde, R.; Pereira, D.; Villalba, K.; Duardo-Sanchez, A.; Gonzalez-Diaz, H. New Markov–Shannon entropy models to assess connectivity quality in complex networks: From molecular to cellular pathway, parasite-host, neural, industry, and legal-social networks. J. Theor. Biol. 2012, 293, 174–188. [Google Scholar] [CrossRef] [PubMed]
- Allegri, R.F.; Guekht, A. Cerebrolysin improves symptoms and delays progression in patients with Alzheimer’s disease and vascular dementia. In Drugs Today; 2012 Prous Science,S.A.U. or Its Licensors: Riva, MD, USA, 2012; Volume 48; pp. 25–41. [Google Scholar]
- Park, N.H. Parkinson disease. JAAPA 2012, 25, 73–74. [Google Scholar] [PubMed]
- Morris, H.R.; Waite, A.J.; Williams, N.M.; Neal, J.W.; Blake, D.J. Recent advances in the genetics of the ALS–FTLD complex. Curr. Neurol. Neurosci. Rep. 2012, 12, 243–250. [Google Scholar] [CrossRef] [PubMed]
- Trushina, E.; McMurray, C.T. Oxidative stress and mitochondrial dysfunction in neurodegenerative diseases. Neuroscience 2007, 145, 1233–1248. [Google Scholar] [CrossRef] [PubMed]
- Martin, L.J. Biology of mitochondria in neurodegenerative diseases. In Progress in Molecular Biology and Translational Science; Elsevier Inc.: Amsterdam, The Netherlands, 2012; Volume 107; pp. 355–415. [Google Scholar]
- Howells, D.W.; Sena, E.S.; O’Collins, V.; Macleod, M.R. Improving the efficiency of the development of drugs for stroke. Int. J. Stroke 2012, 7, 371–377. [Google Scholar] [CrossRef] [PubMed]
- Nurisso, A.; Simoes-Pires, C.; Martel, S.; Cressend, D.; Guillot, A.; Carrupt, P.A. How to increase the safety and efficacy of compounds against neurodegeneration? A multifunctional approach. Chimia 2012, 66, 286–290. [Google Scholar] [CrossRef] [PubMed]
- Heikamp, K.; Bajorath, J. Large-scale similarity search profiling of CHEMBL compound data sets. J. Chem. Inf. Model. 2011, 51, 1831–1839. [Google Scholar] [CrossRef] [PubMed]
- Gaulton, A.; Bellis, L.J.; Bento, A.P.; Chambers, J.; Davies, M.; Hersey, A.; Light, Y.; McGlinchey, S.; Michalovich, D.; Al-Lazikani, B.; et al. Chembl: A large-scale bioactivity database for drug discovery. Nucleic Acids Res. 2012, 40, D1100–D1107. [Google Scholar] [CrossRef] [PubMed]
- Mok, N.Y.; Brenk, R. Mining the chembl database: An efficient chemoinformatics workflow for assembling an ion channel-focused screening library. J. Chem. Inf. Model. 2011, 51, 2449–2454. [Google Scholar] [CrossRef] [PubMed]
- Hu, Y.; Bajorath, J. Molecular scaffolds with high propensity to form multi-target activity cliffs. J. Chem. Inf. Model. 2010, 50, 500–510. [Google Scholar] [CrossRef] [PubMed]
- Erhan, D.; L’Heureux P, J.; Yue, S.Y.; Bengio, Y. Collaborative filtering on a family of biological targets. J. Chem. Inf. Model. 2006, 46, 626–635. [Google Scholar] [CrossRef] [PubMed]
- Namasivayam, V.; Hu, Y.; Balfer, J.; Bajorath, J. Classification of compounds with distinct or overlapping multi-target activities and diverse molecular mechanisms using emerging chemical patterns. J. Chem. Inf. Model. 2013, 53, 1272–1281. [Google Scholar] [CrossRef] [PubMed]
- Yildirim, M.A.; Goh, K.I.; Cusick, M.E.; Barabasi, A.L.; Vidal, M. Drug–target network. Nat. Biotechnol. 2007, 25, 1119–1126. [Google Scholar] [CrossRef] [PubMed]
- Csermely, P.; Korcsmaros, T.; Kiss, H.J.; London, G.; Nussinov, R. Structure and dynamics of molecular networks: A novel paradigm of drug discovery: A comprehensive review. Pharmacol. Ther. 2013, 138, 333–408. [Google Scholar] [CrossRef] [PubMed]
- Tenorio-Borroto, E.; Garcia-Mera, X.; Penuelas-Rivas, C.G.; Vasquez-Chagoyan, J.C.; Prado-Prado, F.J.; Castanedo, N.; Gonzalez-Diaz, H. Entropy model for multiplex drug–target interaction endpoints of drug immunotoxicity. Curr. Top. Med. Chem. 2013, 13, 1636–1649. [Google Scholar] [CrossRef] [PubMed]
- Box, G.E.P.; Jenkins, G.M. Time Series Analysis; Holden-Day: San Francisco, CA, USA, 1970; p. 553. [Google Scholar]
- Botella-Rocamora, P.; Lopez-Quilez, A.; Martinez-Beneito, M.A. Spatial moving average risk smoothing. Stat. Med. 2013, 32, 2595–2612. [Google Scholar] [CrossRef] [PubMed]
- Speck-Planche, A.; Kleandrova, V.V.; Cordeiro, M.N. Chemoinformatics for rational discovery of safe antibacterial drugs: Simultaneous predictions of biological activity against streptococci and toxicological profiles in laboratory animals. Bioorg. Med. Chem. 2013, 21, 2727–2732. [Google Scholar] [CrossRef] [PubMed]
- Speck-Planche, A.; Kleandrova, V.V.; Luan, F.; Cordeiro, M.N. Chemoinformatics in multi-target drug discovery for anti-cancer therapy: In silico design of potent and versatile anti-brain tumor agents. Anticancer Agents Med. Chem. 2012, 12, 678–685. [Google Scholar] [CrossRef] [PubMed]
- Speck-Planche, A.; Kleandrova, V.V.; Luan, F.; Cordeiro, M.N. Chemoinformatics in anticancer chemotherapy: Multi-target QSAR model for the in silico discovery of anti-breast cancer agents. Eur. J. Pharm. Sci. 2012, 47, 273–279. [Google Scholar] [CrossRef] [PubMed]
- Vasaikar, S.V.; Padhi, A.K.; Jayaram, B.; Gomes, J. Neurodnet—An open source platform for constructing and analyzing neurodegenerative disease networks. BMC NeuroSci. 2013, 14, 3. [Google Scholar] [CrossRef] [PubMed]
- Speck-Planche, A.; Kleandrova, V.V.; Luan, F.; Cordeiro, M.N. Multi-target inhibitors for proteins associated with Alzheimer: In silico discovery using fragment-based descriptors. Curr. Alzheimer Res. 2013, 10, 117–124. [Google Scholar] [CrossRef] [PubMed]
- Speck-Planche, A.; Luan, F.; Cordeiro, M.N. Role of ligand-based drug design methodologies toward the discovery of new anti-Alzheimer agents: Futures perspectives in fragment-based ligand design. Curr. Med. Chem. 2012, 19, 1635–1645. [Google Scholar] [CrossRef] [PubMed]
- Marzaro, G.; Chilin, A.; Guiotto, A.; Uriarte, E.; Brun, P.; Castagliuolo, I.; Tonus, F.; Gonzalez-Diaz, H. Using the tops-mode approach to fit multi-target QSAR models for tyrosine kinases inhibitors. Eur. J. Med. Chem. 2011, 46, 2185–2192. [Google Scholar] [CrossRef] [PubMed]
- Luan, F.; Cordeiro, M.N.; Alonso, N.; Garcia-Mera, X.; Caamano, O.; Romero-Duran, F.J.; Yanez, M.; Gonzalez-Diaz, H. Tops-mode model of multiplexing neuroprotective effects of drugs and experimental-theoretic study of new 1,3-rasagiline derivatives potentially useful in neurodegenerative diseases. Bioorg. Med. Chem. 2013, 21, 1870–1879. [Google Scholar] [CrossRef] [PubMed]
- Alonso, N.; Caamano, O.; Romero-Duran, F.J.; Luan, F.; Dias Soeiro Cordeiro, M.N.; Yanez, M.; Gonzalez-Diaz, H.; Garcia-Mera, X. Model for high-throughput screening of multi-target drugs in chemical neurosciences; synthesis, assay and theoretic study of rasagiline carbamates. ACS Chem. NeuroSci. 2013, 4, 1393–1403. [Google Scholar] [CrossRef] [PubMed]
- Gerets, H.H.; Dhalluin, S.; Atienzar, F.A. Multiplexing cell viability assays. Methods Mol. Biol. 2011, 740, 91–101. [Google Scholar] [PubMed]
- Hill, T.; Lewicki, P. Statistics Methods and Applications. A Comprehensive Reference for Science,Industry and Data Mining; StatSoft: Tulsa, OK, USA, 2006; Volume 1; p. 813. [Google Scholar]
- Patankar, S.J.; Jurs, P.C. Classification of inhibitors of protein tyrosine phosphatase 1b using molecular structure based descriptors. J. Chem. Inf. Comput. Sci. 2003, 43, 885–899. [Google Scholar] [CrossRef] [PubMed]
- Garcia-Garcia, A.; Galvez, J.; de Julian-Ortiz, J.V.; Garcia-Domenech, R.; Munoz, C.; Guna, R.; Borras, R. New agents active against mycobacterium avium complex selected by molecular topology: A virtual screening method. J. Antimicrob. Chemother. 2004, 53, 65–73. [Google Scholar] [CrossRef] [PubMed]
- Marrero-Ponce, Y.; Castillo-Garit, J.A.; Olazabal, E.; Serrano, H.S.; Morales, A.; Castanedo, N.; Ibarra-Velarde, F.; Huesca-Guillen, A.; Sanchez, A.M.; Torrens, F.; et al. Atom, atom-type and total molecular linear indices as a promising approach for bioorganic and medicinal chemistry: Theoretical and experimental assessment of a novel method for virtual screening and rational design of new lead anthelmintic. Bioorg. Med. Chem. 2005, 13, 1005–1020. [Google Scholar] [CrossRef] [PubMed]
- Casanola-Martin, G.M.; Marrero-Ponce, Y.; Khan, M.T.; Ather, A.; Sultan, S.; Torrens, F.; Rotondo, R. Tomocomd-cardd descriptors-based virtual screening of tyrosinase inhibitors: Evaluation of different classification model combinations using bond-based linear indices. Bioorg. Med. Chem. 2007, 15, 1483–1503. [Google Scholar] [CrossRef] [PubMed]
- Casanola-Martin, G.M.; Marrero-Ponce, Y.; Khan, M.T.; Khan, S.B.; Torrens, F.; Perez-Jimenez, F.; Rescigno, A.; Abad, C. Bond-based 2D quadratic fingerprints in QSAR studies: Virtual and in vitro tyrosinase inhibitory activity elucidation. Chem. Biol. Drug Des. 2010, 76, 538–545. [Google Scholar] [CrossRef] [PubMed]
- Csermely, P.; Nussinov, R.; Szilagyi, A. From allosteric drugs to allo-network drugs: State of the art and trends of design, synthesis and computational methods. Cur. Topics Med. Chem. 2013, 13, 2–4. [Google Scholar] [CrossRef]
- Mueller, R.; Rodriguez, A.L.; Dawson, E.S.; Butkiewicz, M.; Nguyen, T.T.; Oleszkiewicz, S.; Bleckmann, A.; Weaver, C.D.; Lindsley, C.W.; Conn, P.J.; et al. Identification of metabotropic glutamate receptor subtype 5 potentiators using virtual high-throughput screening. ACS Chem. NeuroSci. 2010, 1, 288–305. [Google Scholar] [CrossRef] [PubMed]
- Szilagyi, A.; Nussinov, R.; Csermely, P. Allo-network drugs: Extension of the allosteric drug concept to protein–protein interaction and signaling networks. Curr. Top. Med. Chem. 2013, 13, 64–77. [Google Scholar] [CrossRef] [PubMed]
- Junker, B.H.; Koschutzki, D.; Schreiber, F. Exploration of biological network centralities with centibin. BMC Bioinform. 2006, 7, 219. [Google Scholar] [CrossRef]
- Sterling, J.; Herzig, Y.; Goren, T.; Finkelstein, N.; Lerner, D.; Goldenberg, W.; Miskolczi, I.; Molnar, S.; Rantal, F.; Tamas, T.; et al. Novel dual inhibitors of ache and MAO derived from hydroxy aminoindan and phenethylamine as potential treatment for Alzheimer’s disease. J. Med. Chem. 2002, 45, 5260–5279. [Google Scholar] [CrossRef] [PubMed]
- Mosmann, T. Rapid colorimetric assay for cellular growth and survival: Application to proliferation and cytotoxicity assays. J. Immunol. Methods 1983, 65, 55–63. [Google Scholar] [CrossRef] [PubMed]
- Fakhfouri, G.; Rahimian, R.; Ghia, J.E.; Khan, W.I.; Dehpour, A.R. Impact of 5-ht(3) receptor antagonists on peripheral and central diseases. Drug Discov. Today 2012, 17, 741–747. [Google Scholar] [CrossRef] [PubMed]
- Mandel, S.; Weinreb, O.; Amit, T.; Youdim, M.B. Mechanism of neuroprotective action of the anti-parkinson drug rasagiline and its derivatives. Brain Res. Brain Res. Rev 2005, 48, 379–387. [Google Scholar] [CrossRef] [PubMed]
- Naoi, M.; Maruyama, W.; Inaba-Hasegawa, K. Revelation in the neuroprotective functions of rasagiline and selegiline: The induction of distinct genes by different mechanisms. Expert Rev. Neurother. 2013, 13, 671–684. [Google Scholar] [CrossRef] [PubMed]
- Fernandes, C.; Reddy, P.; Kessel, B. Rasagiline-induced serotonin syndrome. Mov. Disord. 2011, 26, 766–767. [Google Scholar] [CrossRef] [PubMed]
- Iwamoto, K.; Mata, D.; Linn, D.M.; Linn, C.L. Neuroprotection of rat retinal ganglion cells mediated through α7 nicotinic acetylcholine receptors. Neuroscience 2013, 237, 184–198. [Google Scholar] [CrossRef] [PubMed]
- Pera, M.; Camps, P.; Munoz-Torrero, D.; Perez, B.; Badia, A.; Clos Guillen, M.V. Undifferentiated and differentiated pc12 cells protected by huprines against injury induced by hydrogen peroxide. PLoS One 2013, 8, e74344. [Google Scholar] [CrossRef] [PubMed] [Green Version]
- Nuritova, F.; Frenguelli, B.G. Putative depolarisation-induced retrograde signalling accelerates the repeated hypoxic depression of excitatory synaptic transmission in area ca1 of rat hippocampus via group i metabotropic glutamate receptors. In Neuroscience, 2012 IBRO; Elsevier Ltd.: Waltham, MA, USA, 2012; Volume 222; pp. 159–172. [Google Scholar]
- Sharma, H.S. A combination of tumor necrosis factor-α and neuronal nitric oxide synthase antibodies applied topically over the traumatized spinal cord enhances neuroprotection and functional recovery in the rat. Ann. N. Y. Acad. Sci. 2010, 1199, 175–185. [Google Scholar] [CrossRef] [PubMed]
- Drury, P.P.; Davidson, J.O.; van den Heuij, L.G.; Tan, S.; Silverman, R.B.; Ji, H.; Blood, A.B.; Fraser, M.; Bennet, L.; Gunn, A.J. Partial neuroprotection by nNOS inhibition during profound asphyxia in preterm fetal sheep. Exp. Neurol. 2013, 250, 282–292. [Google Scholar] [CrossRef] [PubMed]
- Concu, R.; Dea-Ayuela, M.A.; Perez-Montoto, L.G.; Prado-Prado, F.J.; Uriarte, E.; Bolas-Fernandez, F.; Podda, G.; Pazos, A.; Munteanu, C.R.; Ubeira, F.M.; et al. 3D entropy and moments prediction of enzyme classes and experimental–theoretic study of peptide fingerprints in leishmania parasites. Biochim. Biophys. Acta 2009, 1794, 1784–1794. [Google Scholar]
- Speck-Planche, A.; Kleandrova, V.V.; Luan, F.; Cordeiro, M.N. Multi-target drug discovery in anti-cancer therapy: Fragment-based approach toward the design of potent and versatile anti-prostate cancer agents. Bioorg. Med. Chem. 2011, 19, 6239–6244. [Google Scholar] [CrossRef] [PubMed]
- Tenorio-Borroto, E.; Penuelas Rivas, C.G.; Vasquez Chagoyan, J.C.; Castanedo, N.; Prado-Prado, F.J.; Garcia-Mera, X.; Gonzalez-Diaz, H. Ann multiplexing model of drugs effect on macrophages; theoretical and flow cytometry study on the cytotoxicity of the anti-microbial drug G1 in spleen. Bioorg. Med. Chem. 2012, 20, 6181–6194. [Google Scholar] [CrossRef] [PubMed]
- Statistica (Data Analysis Software System), Version 6.0. Available online: http://www.statsoft.com (accessed on 2002).
- Yanez, M.; Galan, L.; Matias-Guiu, J.; Vela, A.; Guerrero, A.; Garcia, A.G. Csf from amyotrophic lateral sclerosis patients produces glutamate independent death of rat motor brain cortical neurons: Protection by resveratrol but not riluzole. In Brain Research; Elsevier B.V: Amsterdam, The Netherlands, 2011; Volume 1423; pp. 77–86. [Google Scholar]
© 2014 by the authors; licensee MDPI, Basel, Switzerland. This article is an open access article distributed under the terms and conditions of the Creative Commons Attribution license (http://creativecommons.org/licenses/by/3.0/).
Share and Cite
Durán, F.J.R.; Alonso, N.; Caamaño, O.; García-Mera, X.; Yañez, M.; Prado-Prado, F.J.; González-Díaz, H. Prediction of Multi-Target Networks of Neuroprotective Compounds with Entropy Indices and Synthesis, Assay, and Theoretical Study of New Asymmetric 1,2-Rasagiline Carbamates. Int. J. Mol. Sci. 2014, 15, 17035-17064. https://doi.org/10.3390/ijms150917035
Durán FJR, Alonso N, Caamaño O, García-Mera X, Yañez M, Prado-Prado FJ, González-Díaz H. Prediction of Multi-Target Networks of Neuroprotective Compounds with Entropy Indices and Synthesis, Assay, and Theoretical Study of New Asymmetric 1,2-Rasagiline Carbamates. International Journal of Molecular Sciences. 2014; 15(9):17035-17064. https://doi.org/10.3390/ijms150917035
Chicago/Turabian StyleDurán, Francisco J. Romero, Nerea Alonso, Olga Caamaño, Xerardo García-Mera, Matilde Yañez, Francisco J. Prado-Prado, and Humberto González-Díaz. 2014. "Prediction of Multi-Target Networks of Neuroprotective Compounds with Entropy Indices and Synthesis, Assay, and Theoretical Study of New Asymmetric 1,2-Rasagiline Carbamates" International Journal of Molecular Sciences 15, no. 9: 17035-17064. https://doi.org/10.3390/ijms150917035