In this study, we used supersaturated aqueous solutions of non-crystalline RALA-αCD as raw materials to prepare a crystalline RALA-αCD complex, which was evaluated using various analytical techniques. The results of previous study indicated that the molar ratio of α-CD to RALA needed to be higher than 1:1 to allow for the formation of a RALA-αCD complex [
9]. With this in mind, we used molar ratio of 1:2 and 2:3 ratio (RALA:α-CD) for the formation of the non-crystalline RALA-αCD complexes.
2.2. Scanning Electron Microscopy (SEM)
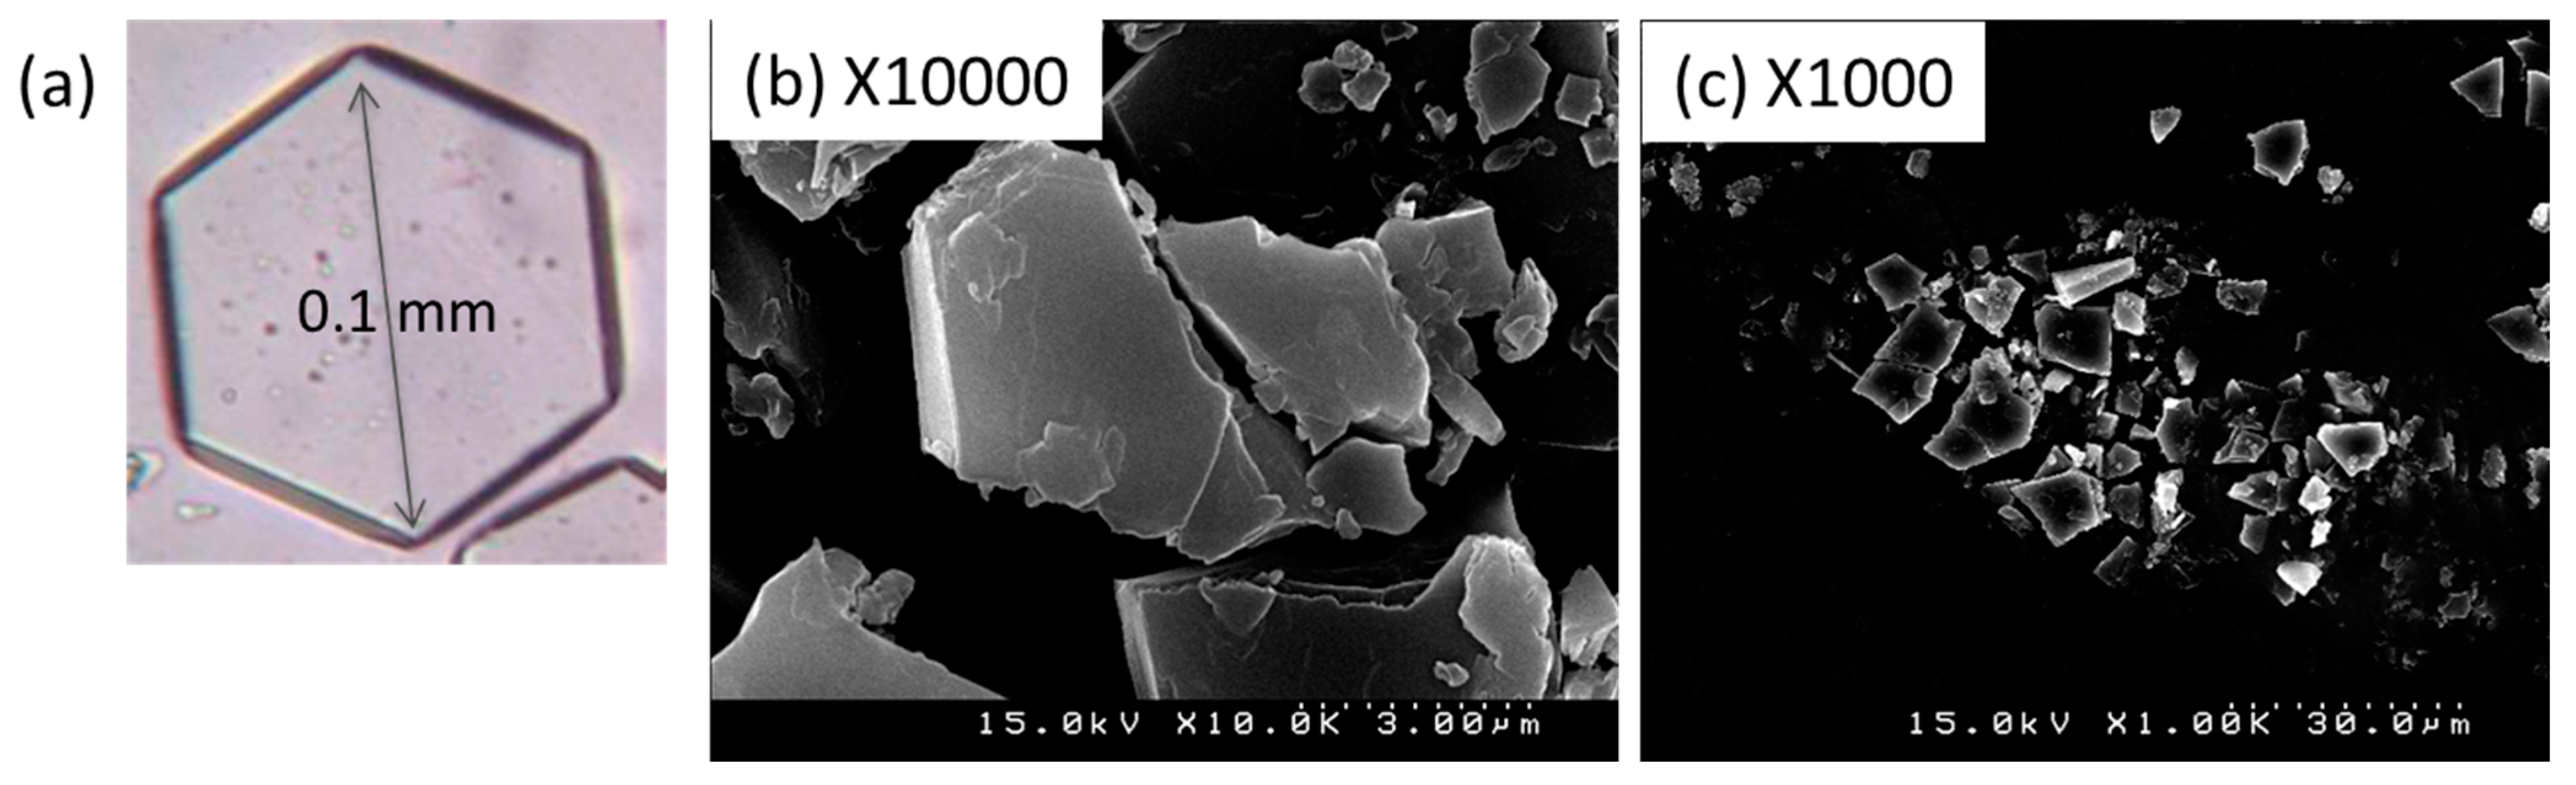
Figure 2 shows an optical micrograph of a single crystal of the crystalline RALA-αCD complex, as well as SEM images of the same material. As shown in
Figure 2a, the single crystal of the crystalline RALA-αCD complex was thin and hexagonal in shape. The SEM images of this material showed that its surface was smoother than that reported previously for the corresponding non-crystalline RALA-αCD complex [
9]. Triplicate observations were carried out in different fields for each sample following the collection of images with magnifications of 500×, 1000×, and 10,000×.
Figure 2b,c shows the images for magnifications of 10,000× and 1000×, respectively.
The particles making up the crystalline RALA-αCD complex were around 3–10 μm in size and appeared to be part of a larger hexagon. These results indicated that the morphological features of the crystalline RALA-αCD complexes were completely different from those of the non-crystalline RALA-αCD complex and that they packed in a hexagonal manner.
Figure 2.
Optical micrograph of a single crystal of the crystalline RALA-αCD complex (a) and SEM images of the crystalline RALA-αCD complex with ×10,000 magnification (b) and ×1000 magnification (c).
Figure 2.
Optical micrograph of a single crystal of the crystalline RALA-αCD complex (a) and SEM images of the crystalline RALA-αCD complex with ×10,000 magnification (b) and ×1000 magnification (c).
2.3. Powder X-ray Diffraction
Powder X-ray diffraction (PXRD) is the commonly used method for the detection of CD complexation either in the powder and microcrystalline states [
12]. The PXRD profiles of the crystalline and non-crystalline RALA-αCD complexes are shown in
Figure 3.
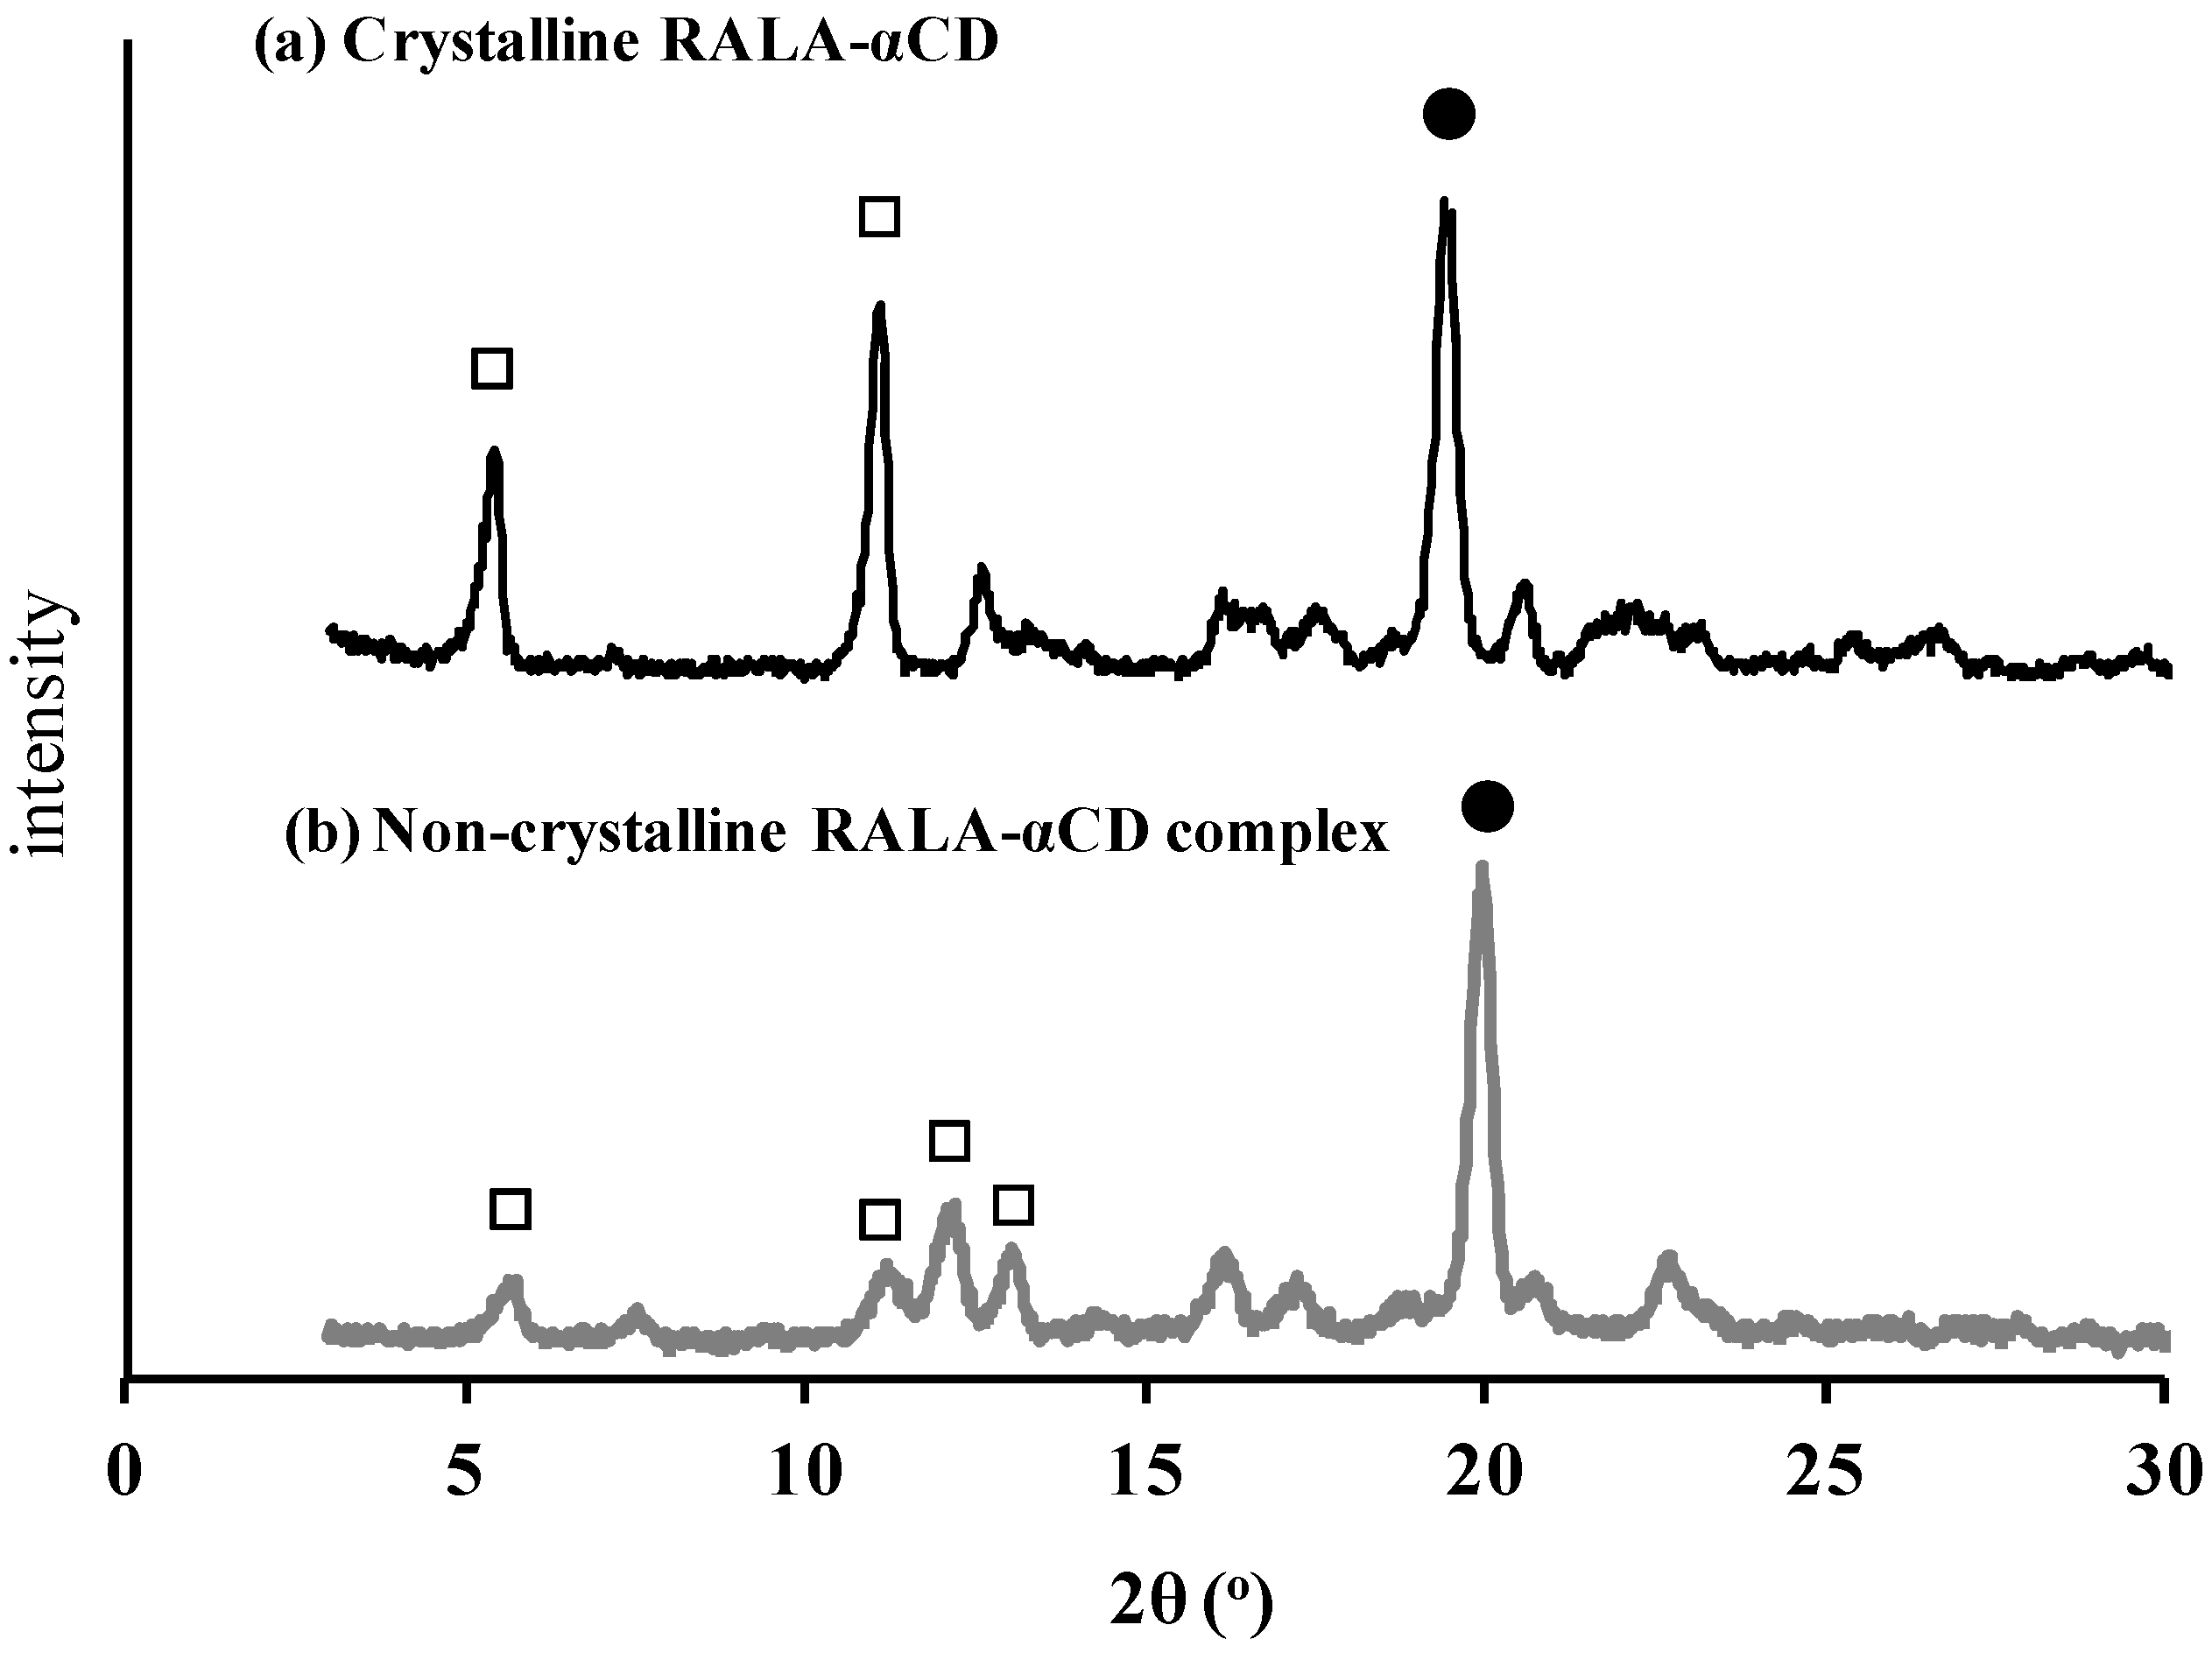
Figure 3.
PXRD patterns of the crystalline (a) and non-crystalline (b) RALA-αCD complexes. Solid circle: peaks that indicate channel type structure. Hollow square: peaks changed through crystallization.
Figure 3.
PXRD patterns of the crystalline (a) and non-crystalline (b) RALA-αCD complexes. Solid circle: peaks that indicate channel type structure. Hollow square: peaks changed through crystallization.
As shown in
Figure 3a, the PXRD pattern of the crystalline RALA-αCD complex gave three characteristic diffraction peaks at 2θ = 5.5°, 11°, and 19°, while that of the non-crystalline material gave one strong peak at 2θ = 20°. The peaks around 2θ = 20° (marked as filled circles in
Figure 3) indicated that these complexes were channel type structure. The relative intensities of the peaks marked as square frame to the peaks around 2θ = 20° (marked as filled circles) in
Figure 3 were got stronger in the crystalline RALA-αCD compared to the non-crystalline RALA-αCD complex and the peak number was reduced from the non-crystalline to the crystalline RALA-αCD complex. This result suggested that the crystalline RALA-αCD complex was purer than the non-crystalline material and that the structures had converged. The basic host structure of the crystalline RALA-αCD complex was similar to that of the typical channel type structure found in CD inclusion compounds [
13,
14,
15].
Figure 3 shows that the PXRD patterns and relative peak intensities of the crystalline and non-crystalline RALA-αCD complexes were different, which therefore suggests that our supersaturation technique successfully facilitated the crystallization of the RALA-αCD complex.
2.4. Fourier Transform Infrared (FT-IR) Spectroscopy
ATR/FT-IR spectroscopy can be used to analyze spectral signals and determine the existence of intermolecular interactions between the RALA and CD molecules. Microscopic FT-IR was used in our previous study to obtain a spectrum of the raw RALA-αCD complex [
10]. In this study, ATR/FT-IR was applied to analyze the purified crystalline RALA-αCD complex, and the resulting spectrum is shown in
Figure 4 for wavelengths in the range of 1300–2000 cm
−1. The ATR/FT-IR spectra of RALA and α-CD are also shown in
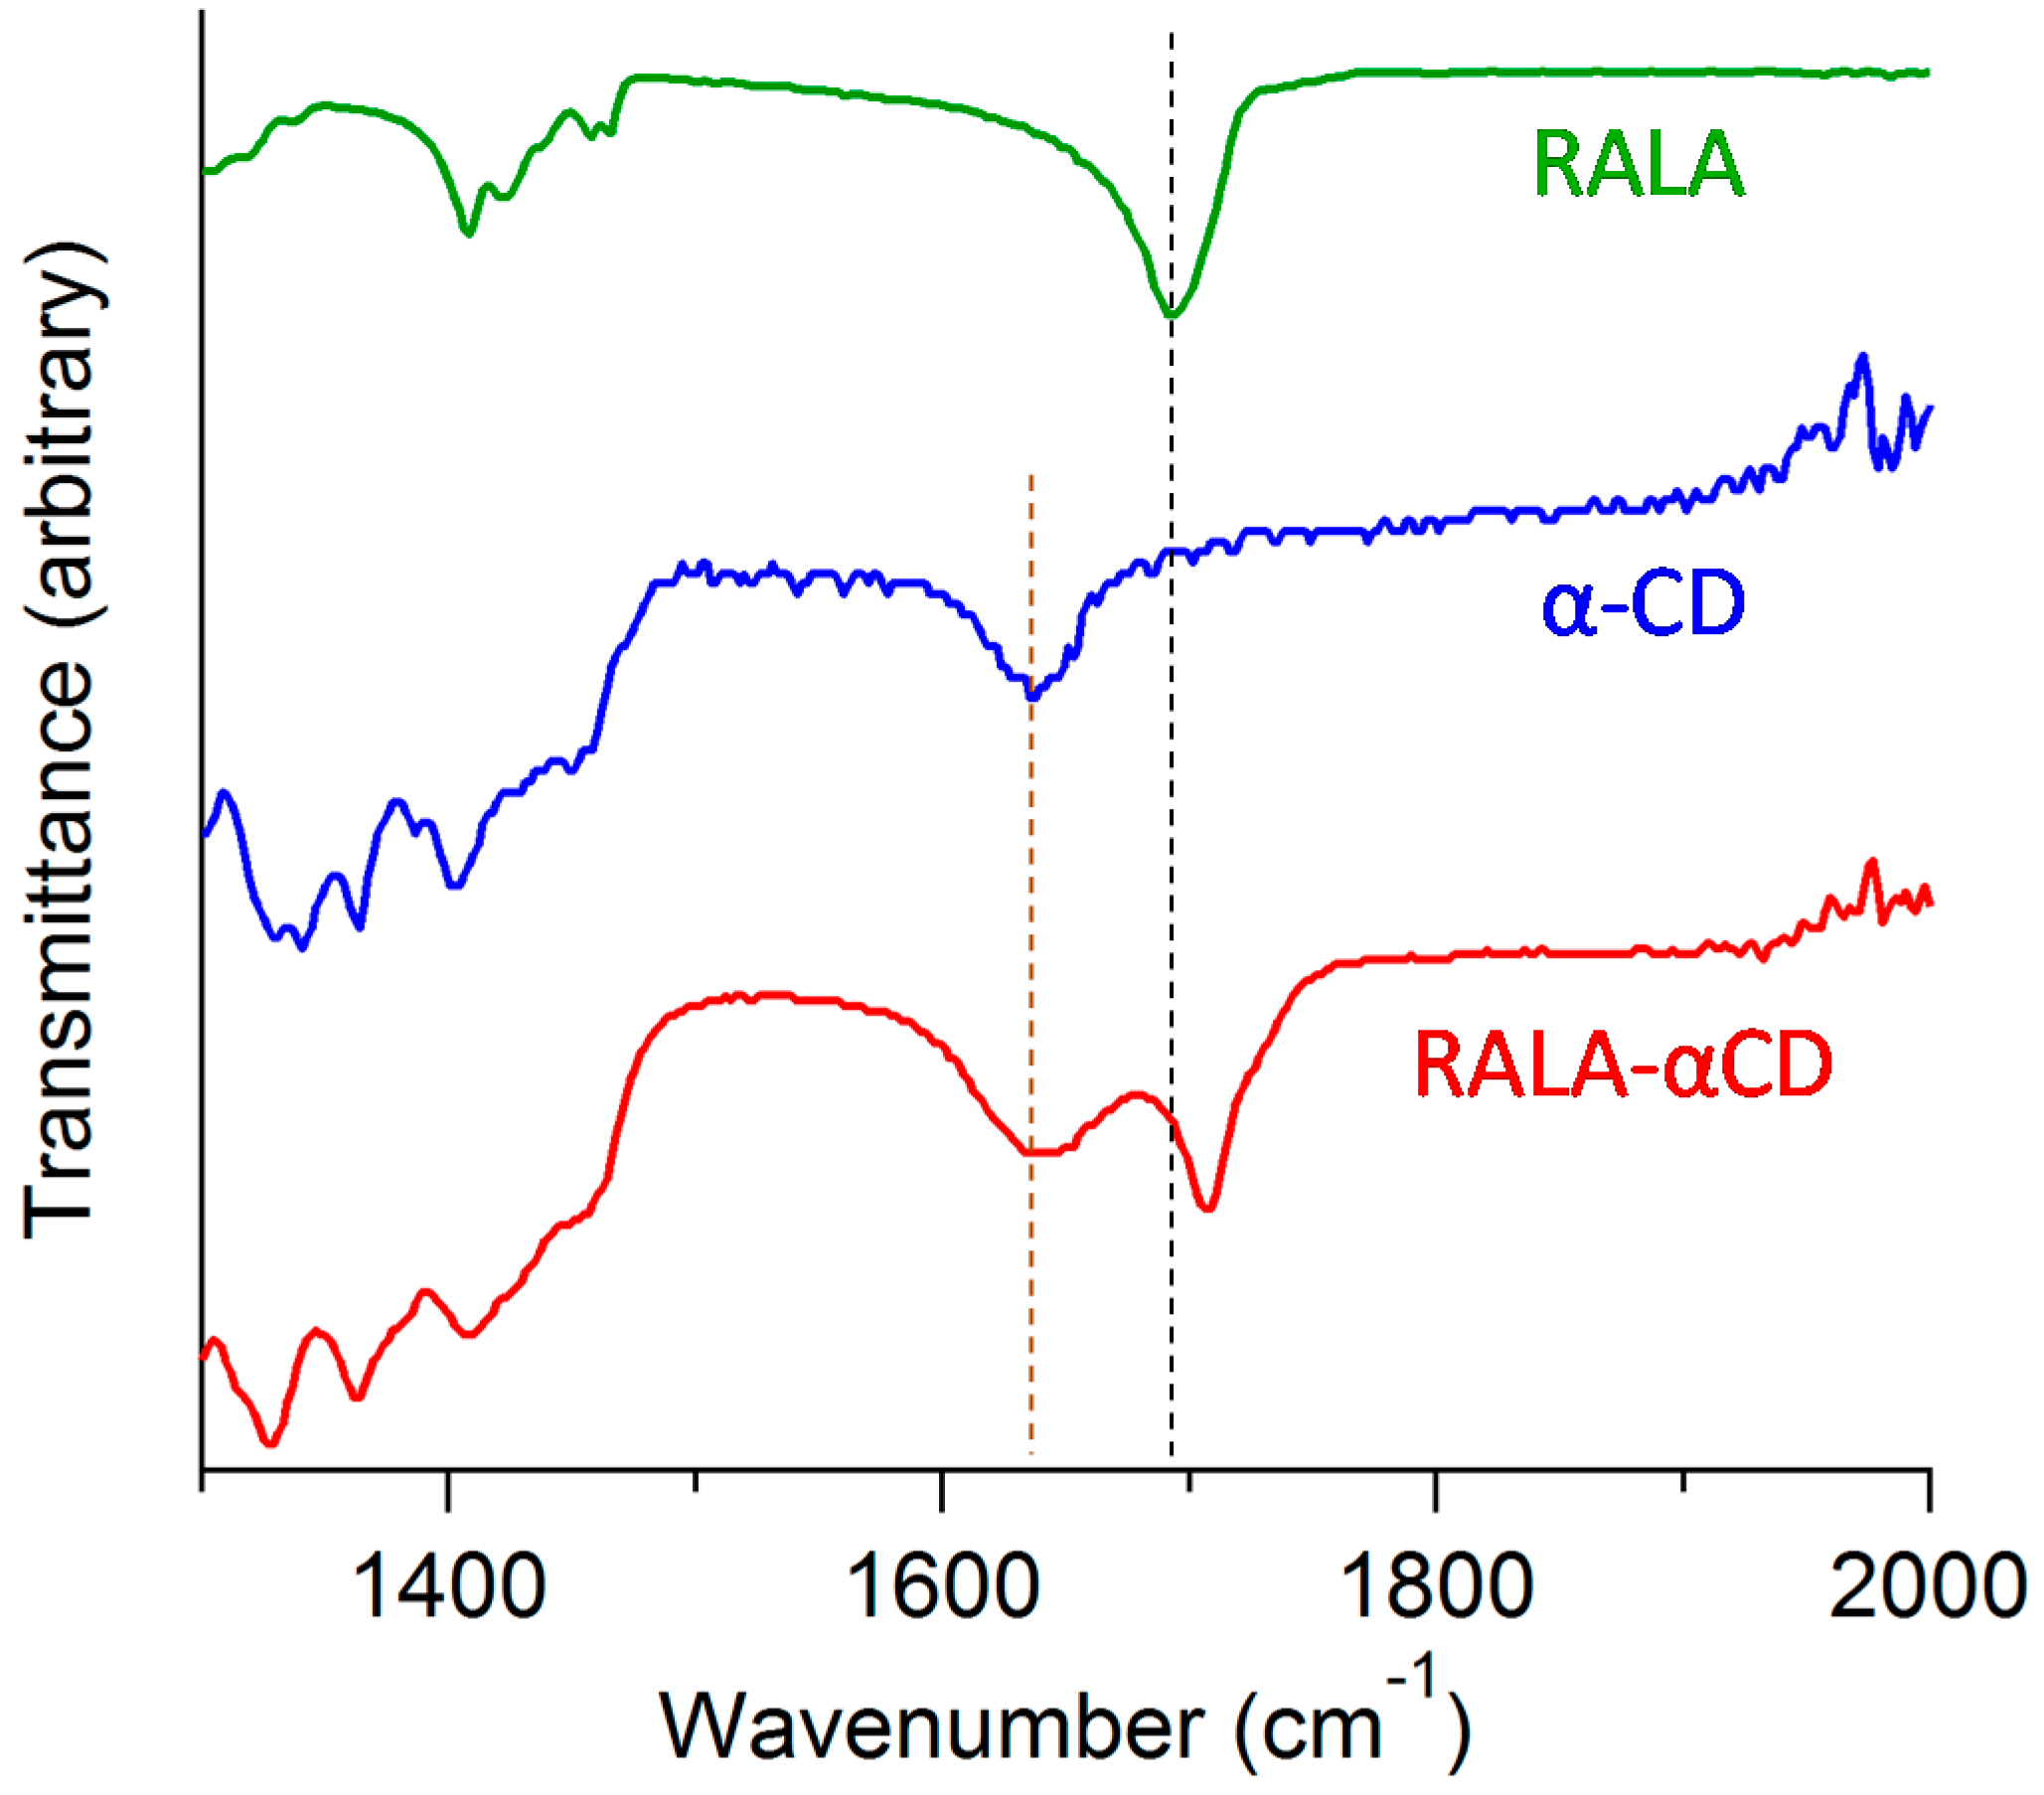
Figure 4 for comparison. The ATR/FT-IR spectra of crystalline RALA showed a peak at 1693 cm
−1 due to the stretching of the carbonyl group in the carboxylic acid, which was in agreement with the results of our previous study [
10]. Following the complexation of the RALA with α-CD, the ν
as (C=O, carbonyl group of carboxylic acid) of RALA shifted from 1693 to 1707 cm
−1. This higher frequency shift of the carbonyl group can be explained considering the interruption of the strong hydrogen bonding existed in RALA following the formation of the RALA-αCD complex. This result indicated that the microscopic environment of the C=O group of RALA in the RALA-αCD complex had changed compared with that of free RALA and that the carbonyl group of the crystalline RALA-αCD complex existed in a more hydrophobic circumstances than that of free RALA itself.
Figure 4.
ATR/FT-IR spectra of the crystalline RALA-αCD complex, α-CD and RALA.
Figure 4.
ATR/FT-IR spectra of the crystalline RALA-αCD complex, α-CD and RALA.
2.5. Microscopic Raman Spectroscopy
The purpose of this study was to explore the small changes in the 1,2-dithiolane ring of RALA using microscopic Raman spectroscopy. In a previous work, microscopic Raman spectroscopy using visible light, 633 nm He–Ne and 514.5 nm Ar
+ laser, excitations successfully detected the effect of CD complexation on the structural properties of RALA in a previous study [
10]. In this work, we used a near-infrared 1064 nm laser to obtain a clearer spectrum of the guest molecule than our previous work using visible light [
10]. The Raman spectra of the crystalline RALA-αCD complex, α-CD and free RALA were recorded in the range of 200–1000 cm
−1 and normalized (
Figure 5). The Raman spectrum of free RALA contained a
ν1 band due to S–S stretching around 510 cm
−1 and
ν2 bands due to two C–S stretching around 630 and 675 cm
−1. The Raman spectra of the crystalline RALA-αCD complex (side and top) showed that the
ν1 or
ν2 mode of RALA was significantly weakened by the complexation process. This result suggested that the all vibrational modes of the S–S and two C–S bonds in RALA had become almost Raman inactive because of conformational changes resulting from the complexation process with α-CD. We previously reported similar spectral changes for non-crystalline RALA-αCD complexes [
10].
In this study, we additionally found that the spectral change due to complex formation is crystallographically anisotropic. As shown in
Figure 2, a single crystal of the RALA-αCD complex forms a thin hexagonal plate in shape. Most crystallographic studies on α-CD complexes have shown that the guest molecules generally exhibit crystallographic disorder [
16] and that it can be difficult to fix the structures of these complexes, especially those of the guest molecules. For this reason, it is important to conduct spectroscopic measurements that focus specifically on the guest molecules in these complexes. In this study, we were aiming to get the spectroscopic information of the guest molecules in the crystalline RALA-αCD complex, which was purified and the molecules would be arranged in a regular pattern, and the Raman spectra of this material would be anisotropic. Based on this working hypothesis, we measured the Raman spectra of the crystalline RALA-αCD complex from different angles,
i.e., on the top and side of the hexagonal crystals (see illustrates in
Figure 5) under a microscope.
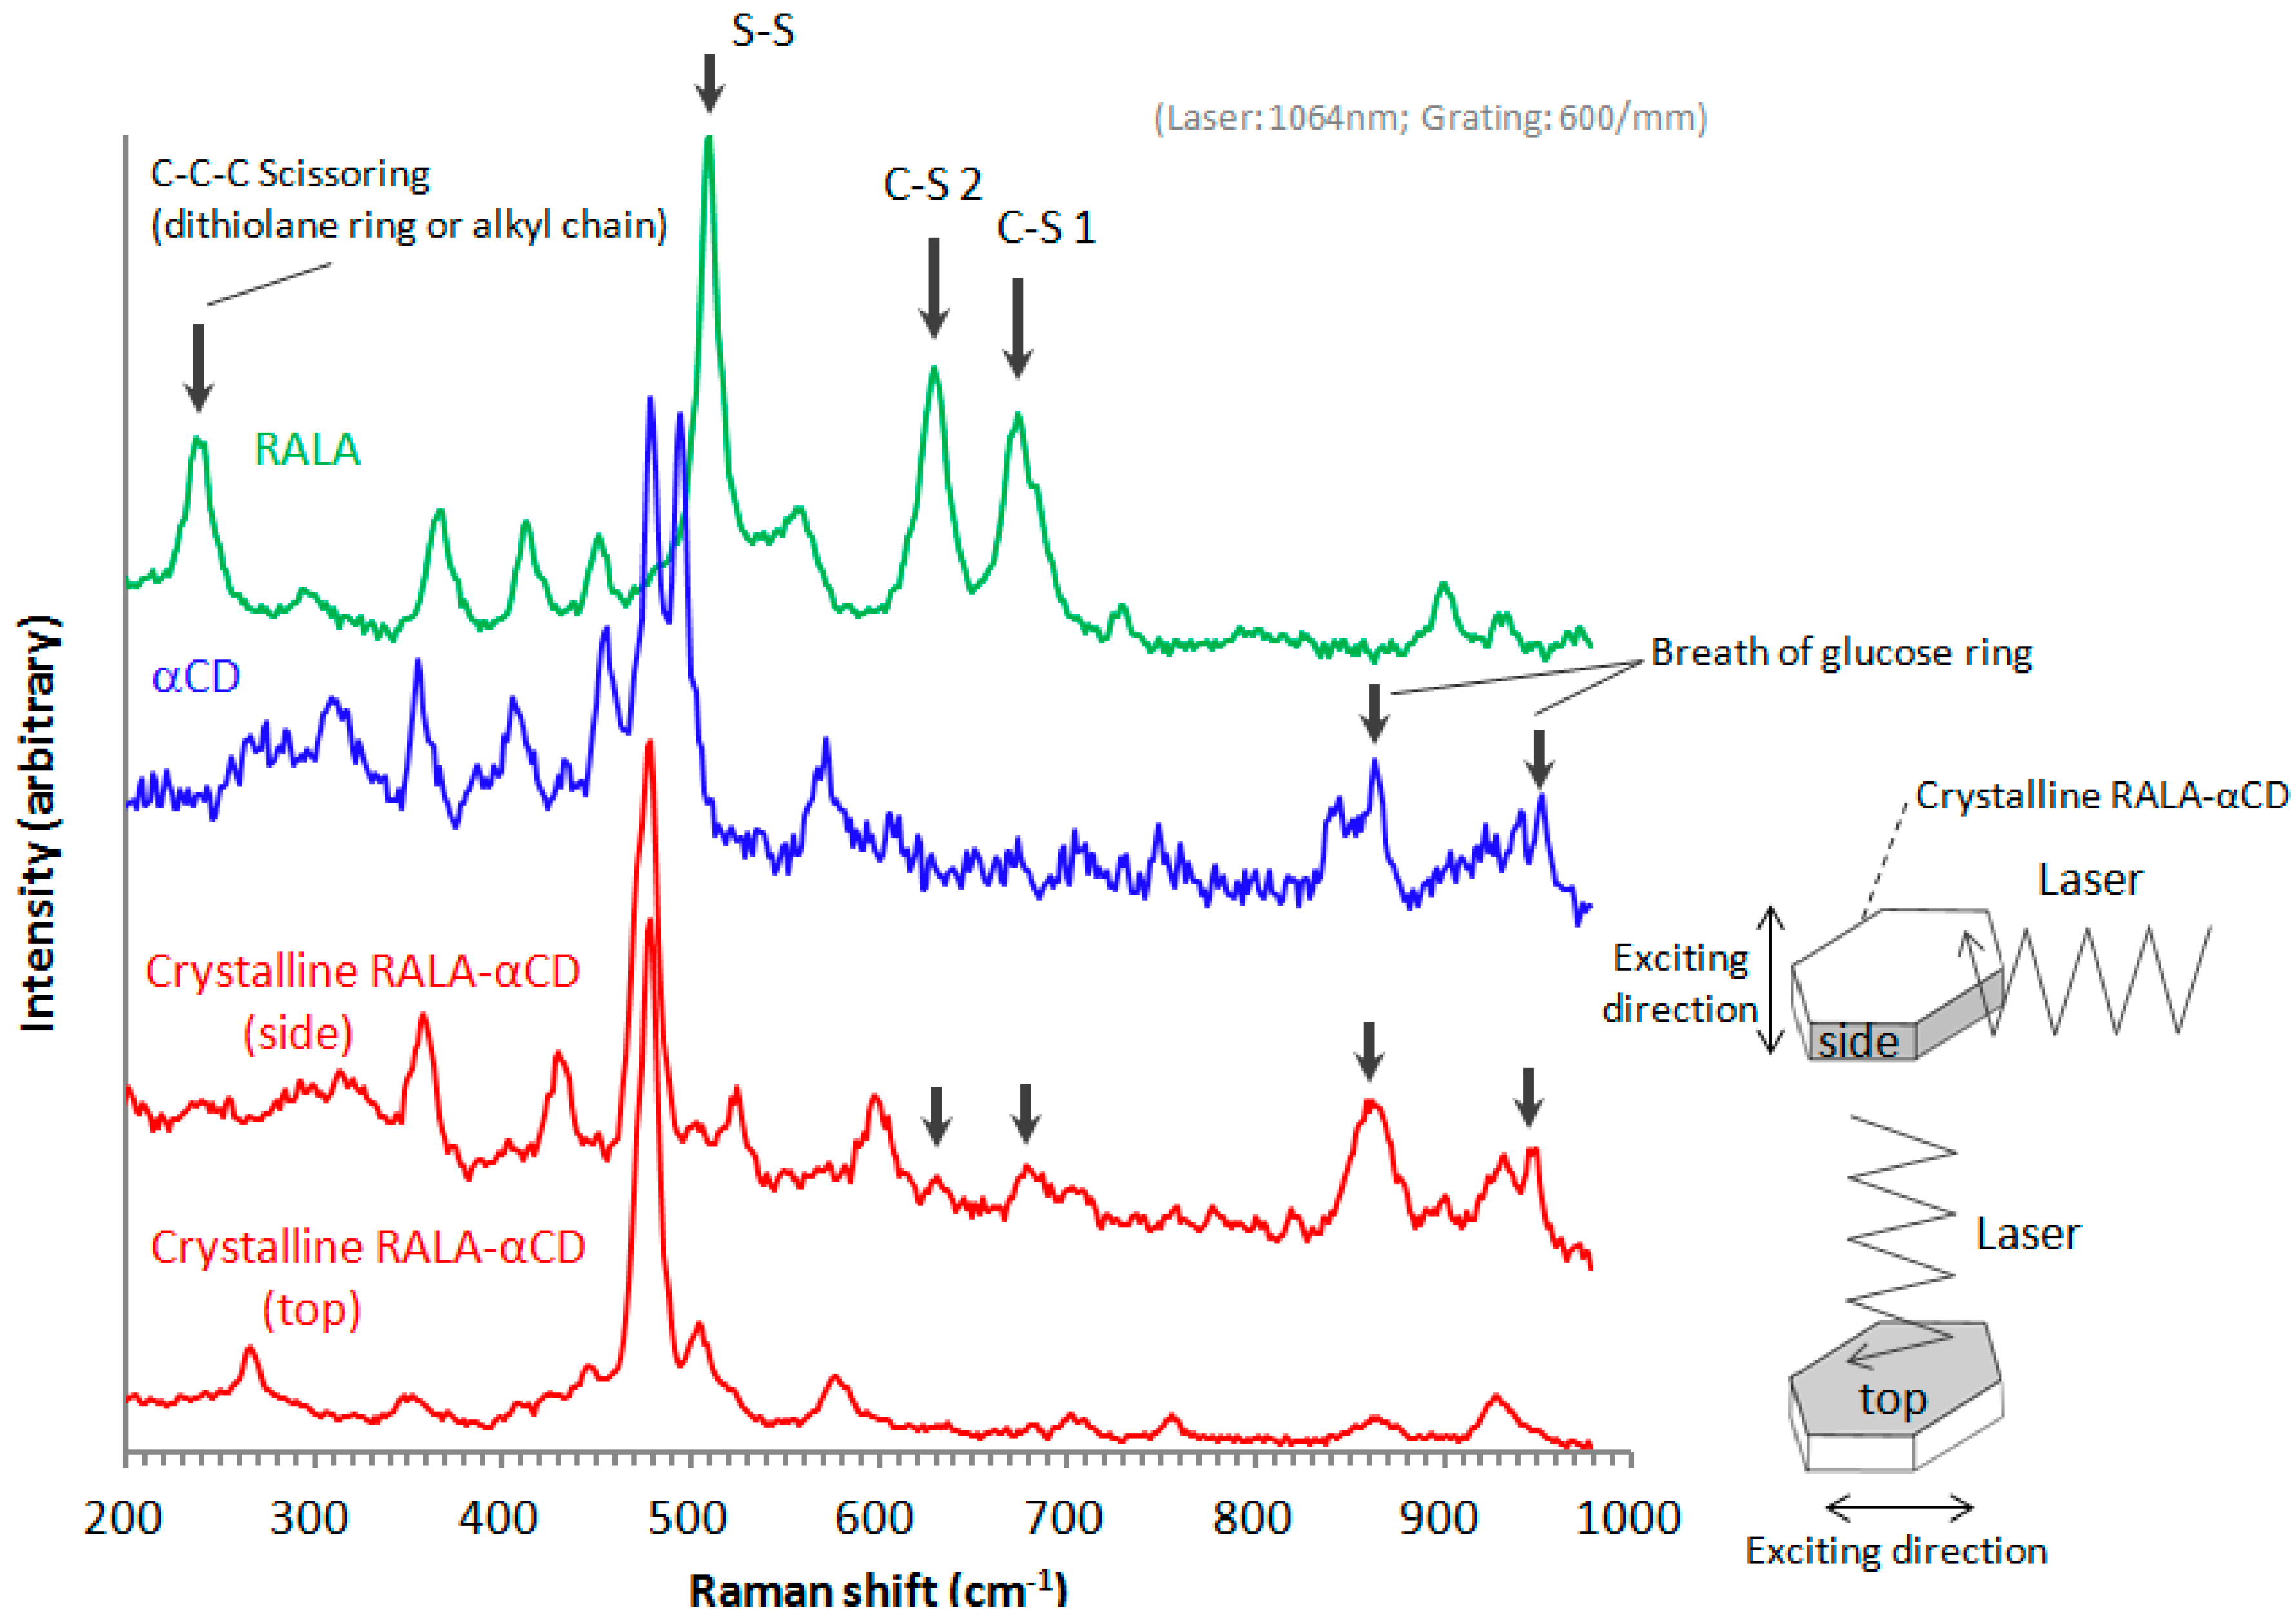
Figure 5.
Raman spectra of the crystalline RALA-αCD complex, RALA and α-CD.
Figure 5.
Raman spectra of the crystalline RALA-αCD complex, RALA and α-CD.
As shown in
Figure 5, the molecules were excited vertically relative to the direction of the laser for these measurements. When the Raman spectrum of the crystalline RALA-α CD complex was measured from the side direction, the breath of the glucose ring of α-CD [
17,
18] appeared around 860 and 950 cm
−1. However, when the Raman spectrum of the complex was measured from the top direction, the breath of the glucose ring was very weak compared with that of the spectrum recorded from the side direction. These results therefore indicated that the α-CD molecules were arranged as a hexagonal thin crystal with its primary or secondary face directed towards the top of the hexagonal crystal and its side face directed towards the side of the crystal. With regard to the main bands of the RALA molecules, the bands belonging to the S–S and C–S stretching vibrations appeared around 510 (S–S), 630 (C–S 2) and 675 (C–S 1) cm
−1 also varied their signal intensities depending on the direction of the laser irradiation. When the laser was irradiated from the side direction of the crystalline RALA-αCD complex, the stretching vibrations of the two C–S bonds were observed nearby 630 and 679 cm
−1 respectively. In contrast, the C–S bonds stretching vibrations were very weak and almost disappeared when the crystals of the complex were irradiated with laser light from the top direction. The peak around 480 cm
−1 is the characteristic out-of plane deformation of the glucose ring of α-CD [
17,
18] and for both of the spectrum excited from the different directions, this band around 480 cm
−1 was Raman active (
Figure 5, red lines). The relative intensities of C–S peaks to the peaks around 480 cm
−1 was clearly weaker when the laser was irradiated from the top compared from the side. These results suggested that the guest RALA molecule had been successfully encapsulated in the α-CD cavity with 1,2-dithiolane ring projecting in a vertical direction relative to the α-CD ring.
Another characteristic band of RALA appeared around 240 cm
−1. This band was attributed to the scissoring or out-of-plane bending vibration of a C–C–C moiety belonging to the 1,2-dithiolane ring or alkyl chain of RALA, using the Gaussian-09 program package [
19]. The C–C–C bending vibration (240 cm
−1) also occurred for free RALA, but it was not detected in the case of the crystalline RALA-αCD complex. From these results, it was envisioned that the α-CD molecules in the crystalline RALA-αCD complex were arranged in a regular pattern, and that the Raman spectra of this material was anisotropic.
Barrientos
et al. [
20] reported the PXRD patterns of several other hexagonal crystal structures, including the complexes of α-CD (host) with 1-octylamine and 1-octanethiol (guests). These results suggested that the PXRD pattern of the crystalline RALA-αCD complex indicated that the RALA-αCD molecules were put the channel structures in order through two dimensional network interactions between the guest and the host (α-CD) molecules, with the α-CD network running parallel to the hexagonal faces. From the Raman spectrum of the RALA-αCD complex, it is clear that the 1,2-dithiolane ring of RALA was captured in the α-CD cavity and positioned perpendicular to the plane of α-CD ring. These results also show that the carboxylic acid group of RALA was exposed to the surface of the (001) hexagonal face but that it did not interact with α-CD, as indicated in the ATR/FT-IR spectra in
Figure 4. These groups could potentially interact with another unit lattice through a self-assembly process.
2.6. Solid-State NMR Study
A variety of different analytical methods have been developed to evaluate the conformational characteristics of compounds in the solid-state, including solid-state fluorescence spectroscopy, FTIR, and solid-state NMR [
21].
13C cross-polarization (CP)/magic angle spinning (MAS) NMR is a powerful analytical tool, which was used in this study for the crystallographic investigation of the RALA-αCD complex. In general, the
13C-CP/MAS NMR spectra of free CDs exhibit multiple resonance carbon atoms in each type. These features are explained to correlate with different torsion angles about the α(1→4) linkages, and the different torsion angles can be used to describe the difference of the orientation of hydroxyl groups [
21]. For the crystalline RALA-αCD complex, the multiplicities of the different carbon atoms were reduced and the resulting spectrum was compared with that of free α-CD. The results revealed that the chemical shifts of the resonance signals of the crystalline complex were almost the same as those of free α-CD (see
Figure 6, 50–110 ppm). The
13C-CP/MAS NMR spectrum of the crystalline RALA-αCD showed different spectral patterns from those of α-CD in the range of CD resonances (50–110 ppm) (
Figure 6). Specifically, the multiplicity of signals for each carbon atom was reduced in the case of RALA-αCD. It is well known that the free CD spectrum exhibits multiple resonances for each type of carbon atom. These features have been responsible for the different torsion angles around the α(1→4) linkages and have been correlated with the torsion angles that described the orientation of the hydroxyl angles [
22]. These results suggested that RALA and α-CD had formed an inclusion complex in the crystalline RALA-αCD complex and that the enhanced symmetry of the α-CD macrocycle had been attained in the crystalline complex compared with the free α-CD. Furthermore, consideration of the NMR spectra of free RALA of the crystalline RALA-αCD complex between 110 and 200 ppm (
Figure 6), revealed that the peak observed around 180 ppm could be assigned to the C=O group of RALA. This peak appeared at 182.9 ppm for free RALA, but was shifted to a higher field (176.9 ppm) for the crystalline RALA-αCD complex. These results indicated that the microscopic environment of the C=O group of the RALA in the crystalline RALA-αCD complex had changed from that of free RALA.
Figure 6.
13C-CP/MAS NMR spectra of the crystalline RALA-αCD complex, free α-CD, and free RALA. The arrows indicate the spinning side bands.
Figure 6.
13C-CP/MAS NMR spectra of the crystalline RALA-αCD complex, free α-CD, and free RALA. The arrows indicate the spinning side bands.
Consideration of a higher magnetic field between 50 and 20 ppm revealed that there were multiple peaks in the range of 20–45 ppm for the RALA-αCD complex, which could be assigned to –CH bonds. Multiple resonance signals were also observed in the same region of the spectrum for free RALA. A single-crystal structure of lipoic acid was reported in the literature, which showed that the material existed as a dimer [
23]. However, the
13C-CP/MAS NMR spectrum of the crystalline RALA-αCD complex prepared in the current study showed that the signal multiplicity was reduced compared with free RALA. For the crystalline RALA-αCD complex, the peaks in the range of 20–45 ppm indicated that structure of RALA had converged, which could also explain the shift in the C=O peak of the crystalline RALA-αCD complex. RALA itself exists as a dimer with the two RALA molecules interacting with each other through the formation of strong hydrogen bonds. In the case of the crystalline RALA-αCD complex, the hydrogen bonding interactions between the two RALA molecules would be broken in favor of the formation new interactions between the RALA and α-CD molecules, which would result in the observed shift in the C=O peak.
The results of the 13C-CP/MAS NMR analysis were in accordance with the ATR/FT-IR results. Taken together, these results show that the microscopic environment of the C=O group of free RALA changed following its complexation with α-CD. These results therefore indicated that the structure of the crystalline RALA-αCD complex prepared in the current study existed as one structure, meaning that it had a low level of disorder in its structure.
The results of PXRD and
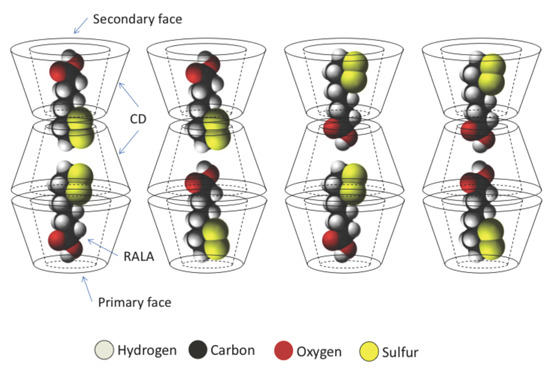
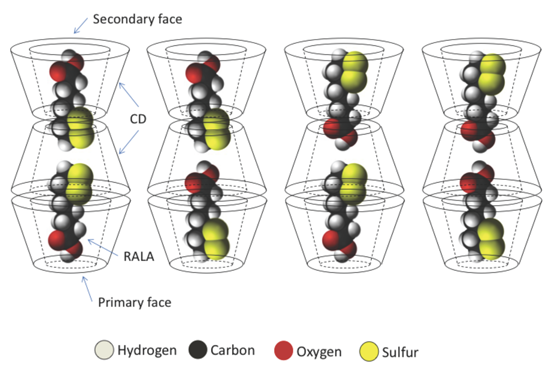
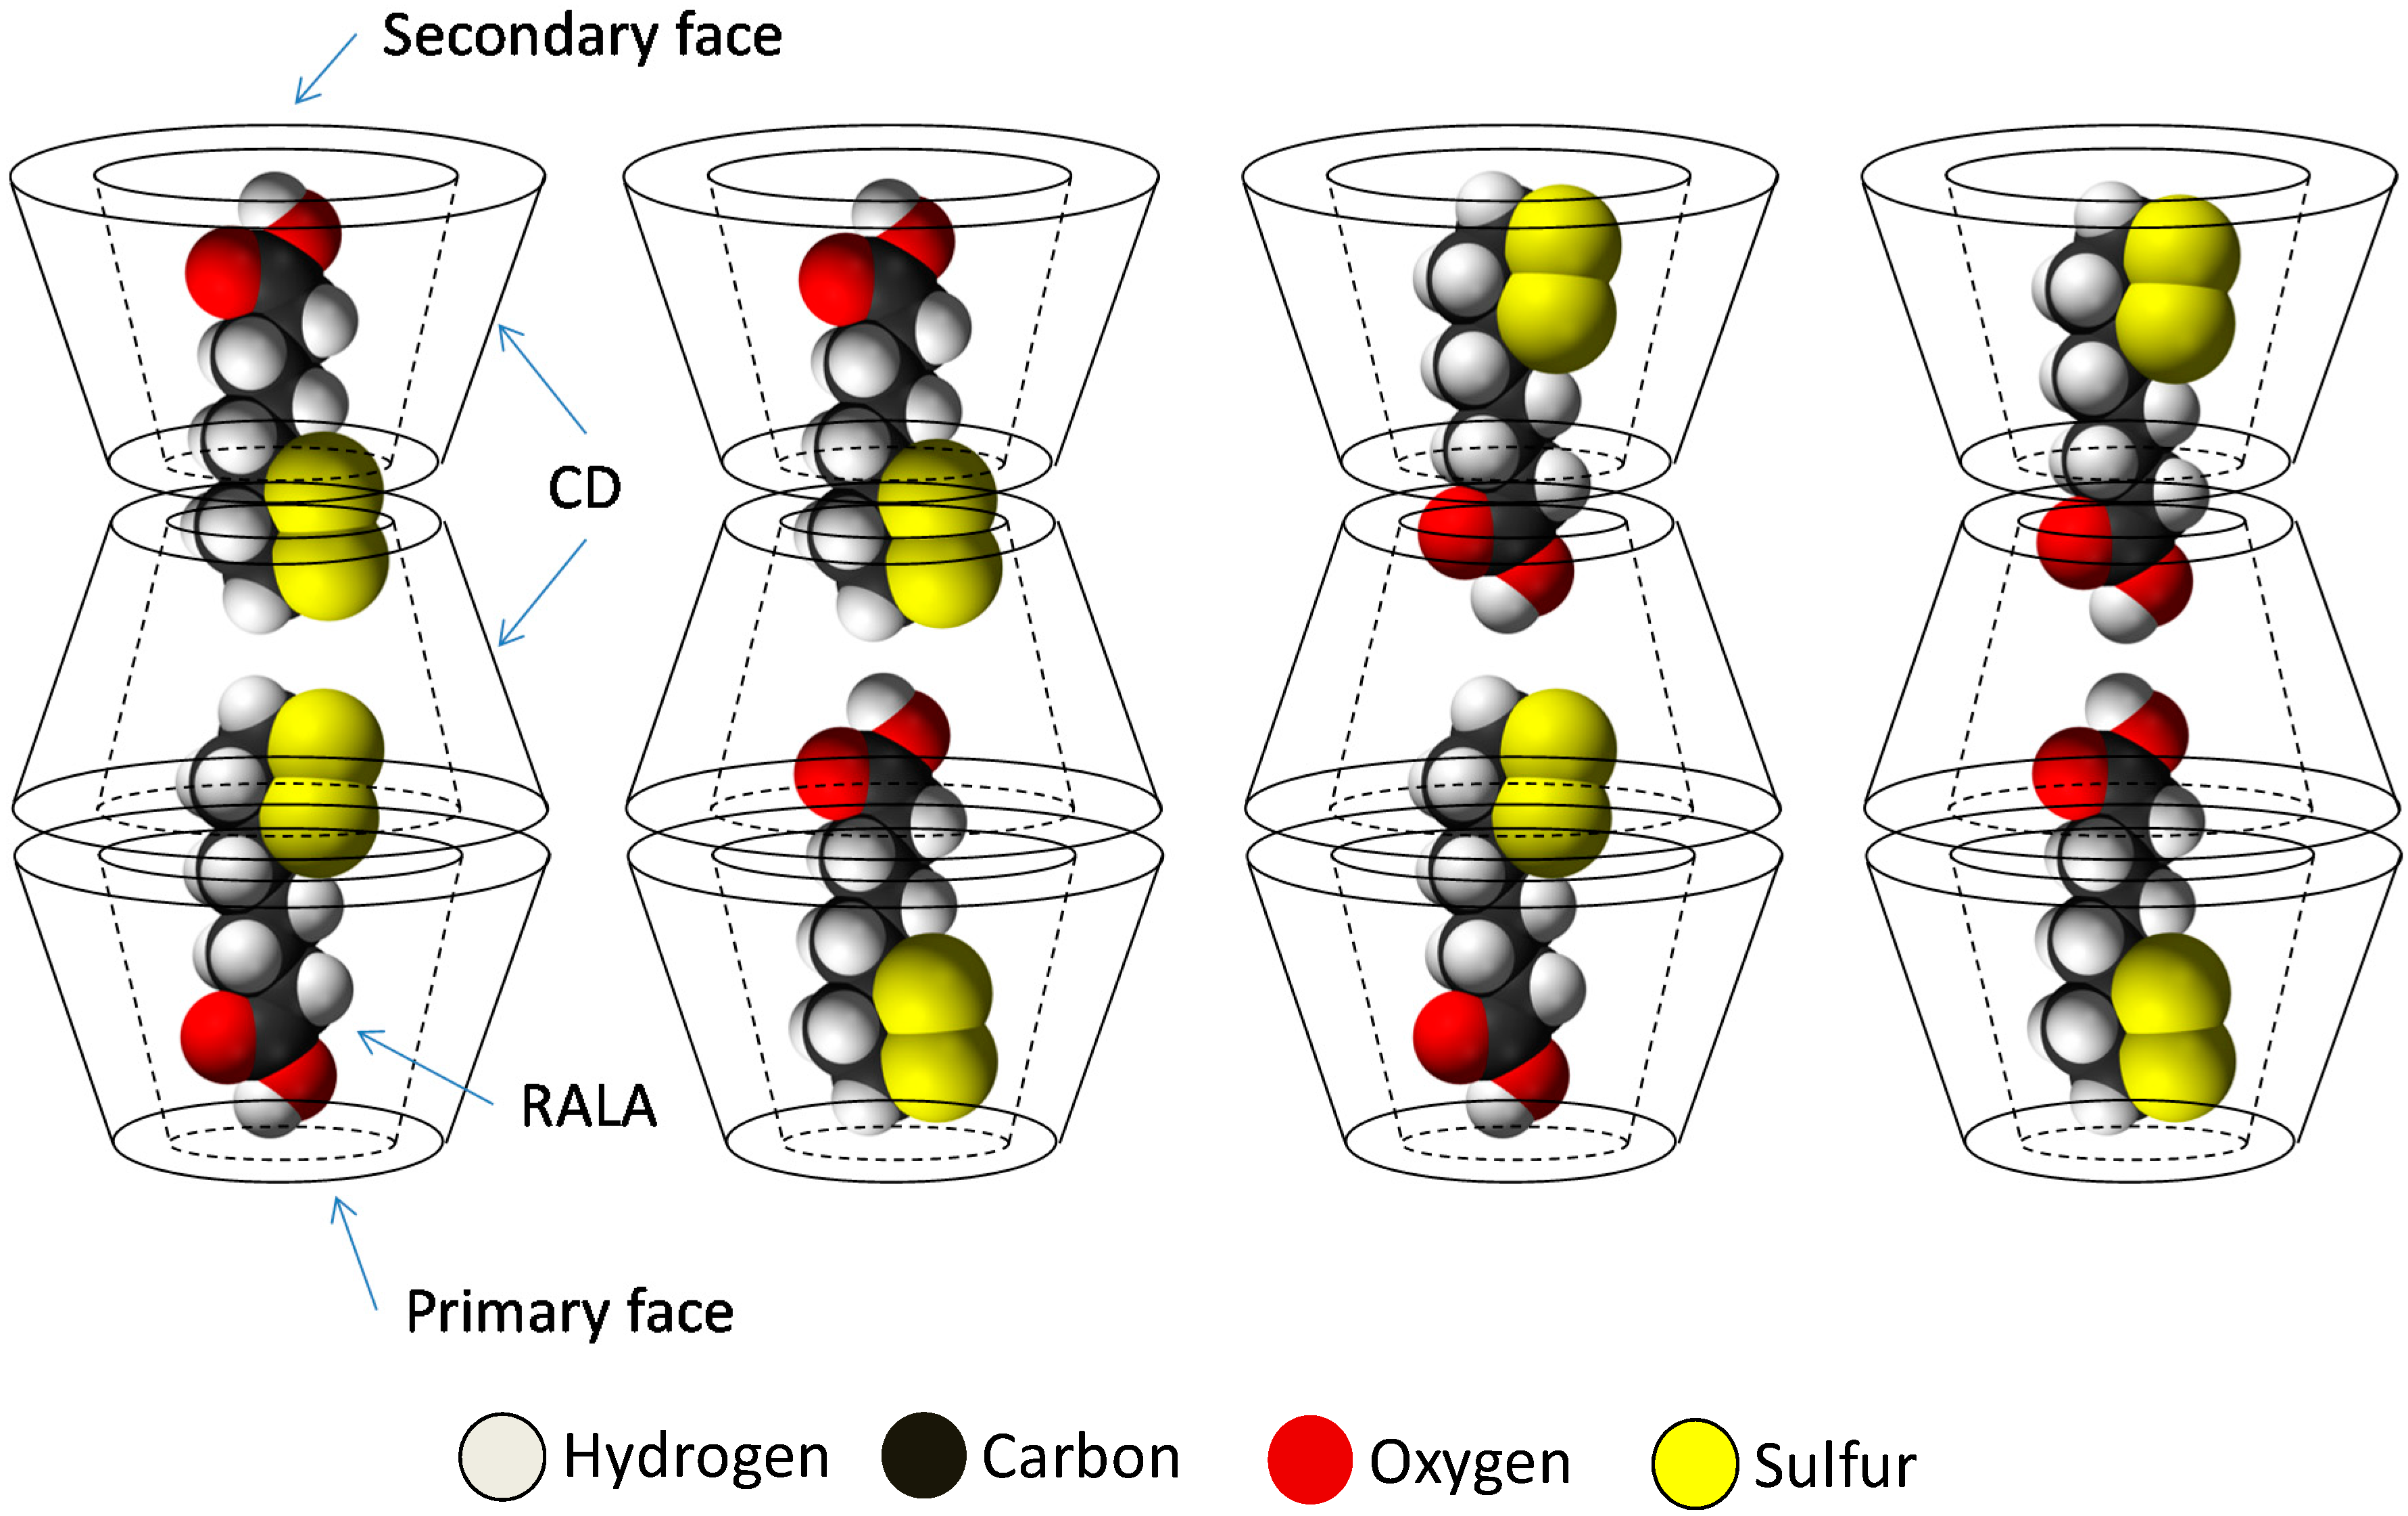
1H-NMR show that the crystalline RALA-αCD complex is a channel type 2:3 (RALA:α-CD) complex and the results of ATR/FT-IR indicated that the carbonyl group of RALA in the crystalline RALA-αCD complex existed in a hydrophobic environment. The result of the microscopic Raman spectroscopy indicated that the α-CD molecules were arranged as a hexagonal thin crystal with its primary or secondary faces directed towards the top of the hexagonal crystal and its side face directed towards the side of the crystal. From the Raman spectrum of the RALA-αCD complex, it is clear that the 1,2-dithiolane ring of RALA was penetrated into the α-CD cavity and positioned perpendicular to the plane of α-CD ring. All these data and the
13C-CP/MAS NMR analysis can provide the possible topological structures for the crystalline RALA-αCD complex (
Figure 7).
Figure 7.
Sketch of the different topologies for the crystalline RALA-CD complex.
Figure 7.
Sketch of the different topologies for the crystalline RALA-CD complex.


 ,
, 


