Article

Human Intervention Study to Assess the Effects of Supplementation with Olive Leaf Extract on Peripheral Blood Mononuclear Cell Gene Expression

1
Discipline of Nutrition and Dietetics, The University of Auckland, Auckland 1142, New Zealand
2
Auckland Cancer Research Society, Faculty of Medical and Health Sciences, The University of Auckland, Auckland 1142, New Zealand
3
Institute of Medical Genetics, UHW Main Building, Cardiff University, Cardiff CF10 3XQ, UK
4
Food Nutrition & Health Team, Food & Bio-Based Products Group, AgResearch Limited, Palmerston North 4442, New Zealand
*
Author to whom correspondence should be addressed.
Int. J. Mol. Sci. 2016, 17(12), 2019; https://doi.org/10.3390/ijms17122019
Submission received: 12 October 2016 / Revised: 21 November 2016 / Accepted: 23 November 2016 / Published: 2 December 2016
(This article belongs to the Special Issue The Mechanism of Action of Food Components in Disease Prevention)

Abstract

:
Olive leaf extract (OLE) has been used for many years for its putative health benefits, but, to date, scientific evidence for the basis of these effects has been weak. Although recent literature has described a link between ailments such as cardiovascular disease, diabetes and cancer and a protective effect of polyphenols in the OLE, the mode of action is still unclear. Here, we describe a double-blinded placebo (PBO)-controlled trial, in which gene expression profiles of peripheral blood mononuclear cells from healthy male volunteers (n = 29) were analysed to identify genes that responded to OLE, following an eight-week intervention with 20 mL daily consumption of either OLE or PBO. Differences between groups were determined using an adjusted linear model. Subsequent analyses indicated downregulation of genes important in inflammatory pathways, lipid metabolism and cancer as a result of OLE consumption. Gene expression was verified by real-time PCR for three genes (EGR1, COX-2 and ID3). The results presented here suggest that OLE consumption may result in health benefits through influencing the expression of genes in inflammatory and metabolic pathways. Future studies with a larger study group, including male and female participants, looking into direct effects of OLE on lipid metabolism and inflammation are warranted.

Graphical Abstract

1. Introduction

Although olive leaf extract (OLE) has been used for many years for its putative health benefits, the mode of action by which these benefits occur is still unclear. In vitro and animal studies suggest that the health benefits of OLE are due, at least in part, to OLE polyphenols influencing gene expression [1,2]. In vitro studies using human cell lines have suggested that OLE has anti-inflammatory [3] and anti-cancer effects [2]. In vivo animal studies suggest that OLE attenuates obesity from a high fat diet [4] and reduces impacts resulting from inflammatory cytokine production and insulin resistance [5]. These studies showed altered expression of genes in relevant pathways. Animal [6] and in vitro [7] models have pointed towards interactions with Nrf2 (Nuclear factor erythroid 2-related factor 2) signalling cascades as one effector for the health benefits of polyphenols. However, this hypothesis has not been substantiated in human trials [8].
Recent research has shown improved blood pressure in hypertensive males with OLE [9] and improved insulin sensitivity in overweight males [10]. These studies have focused on specific outcomes or biomarkers such as improved insulin sensitivity or the expression of specific cytokines; however, a more comprehensive analysis of the changes in gene expression has not been undertaken.
Investigating changes in gene expression profile after OLE consumption in humans will enable a better understanding of the pathways involved. The genetic pathways and relationships uncovered can be used to hypothesise the modes of action. This may help substantiate existing health benefits and lead to the discovery of novel health benefits that may arise from the consumption of OLE.
This intervention study was focussed on identifying the genes and associated pathways that respond to OLE treatment and to determine the underlying mechanisms that correlate to reported health benefits. The tested product is designed for chronic consumption as a nutraceutical to improve health in the long term, as opposed to medicines that are developed for short-term use to create maximum results. A modest change over a long time is likely to manipulate health significantly [11]. Because the participants were healthy men, inflammatory and disease markers were in the healthy range; therefore, reducing these is difficult to achieve. The results are therefore intended to be indicative and to reveal important directions for future research.

2. Results

2.1. Participant Characteristics and Compliance, and Supplement Tolerance

A total of 32 men gave written consent and were enrolled in the study. Two participants were lost to follow-up and one participant withdrew due to an adverse reaction to the supplement. The first participants began the intervention on the 3 May 2015 and the last participants began on the 22 June 2015. The intervention ran for eight weeks.
Characteristics of the final 29 men (15 in the OLE arm and 14 in the placebo (PBO) arm of the intervention) are shown in Appendix Table A1. There were no statistically significant differences between intervention arms, or between the beginning and end of the intervention, for any of the measured characteristics.
On average, participants taking the OLE did not achieve the instructed 20 mL per day, most likely due to its bitter taste. However, the amount they did consume (~17 mL) means that their daily phenolic intake was higher than that approved by European Food Safety Authority (EFSA), which is no less than 5 mg of hydroxytyrosol (HT) per 20 mL of olive oil (OO) to provide protection of blood lipids from oxidative stress. Furthermore, the polyphenol intake in the OLE group was clearly higher than that of the PBO, who consumed slightly more than the instructed 20 mL.
No participants taking the PBO reported any adverse reactions and the OLE supplement was well tolerated in most participants, with the exception of one participant, who reported nausea and dropped out of the study after three days. Volunteers consistently reported that the OLE supplement had an unpleasant, bitter taste and they did not enjoy taking it.
The three-day food diaries confirmed that participant diets did not contain abnormal amounts of either polyphenol-rich foods or fish that could influence or bias the results. No changes in the food intake between groups or time points were detected.

2.2. RNA Quality Control

The measured RNA Integrity Number (RIN) for all samples was above 8.0, demonstrating that the RNA integrity was satisfactory for analysis. The RNA quality was evaluated again within the computer programme Affymetrix Expression Console Software (version 1.4.1, Affymetrix, Santa Clara, CA, USA) [12]. All bacterial control probes were measured in the correct order with increasing intensity, indicating that both labelling and hybridising for the arrays were accurate. A signal boxplot confirmed that the data were normally distributed.

2.3. PBMC Transcription Profiles

Using the Benjamin and Hochberg method of False Discovery Rate (FDR) control [13] and an adjusted p-value of <0.05, no genes would be considered significantly affected by the OLE supplementation in comparison to PBO when assessed using microarrays. However, using the less conservative statistical criterion of an unadjusted p-value <0.05, 2683 probes were differentially expressed. In addition, 1576 were upregulated and 1107 were downregulated. A less conservative p-value has been employed in similar human intervention studies [14,15].
Using a 1.4-fold change (FC) cut-off for expression, 27 genes were shown to be differentially expressed; these genes were used for pathway analysis. This FC cut-off has been used in previous nutrigenomic studies [14,16]. The genes were identified and classified using Gene Ontology (GO) [17,18] and listed with gene names, FC, and p-values.
Genes with the highest FC had large confidence intervals, emphasizing high inter-individual variance in gene expression. Genes such as G0/G1 switch 2 (G0S2) and chemokine (C-X-C motif) ligand 8 (CXCL8, subsequently referred to as IL-8) showed large confidence intervals compared to EGR1, prostaglandin-endoperoxide synthase 2 (prostaglandin G/H synthase and cyclooxygenase) ((PTGS2) referred to as COX-2) and heparin-binding EGF-like growth factor (HBEGF) (Table 1). Changes in participant gene expression tended to show downregulation opposed to upregulation after OLE supplementation compared to PBO.

2.4. Gene Ontology: Gene Annotation Tool to Help Explain Relationships (GATHER) and Protein Analysis through Evolutionary Relationships (PANTHER)

Several physiological and biological processes were identified by GATHER [19] when genes with an FC > 1.4 were analysed GO indicated that OLE was having several effects on gene expression (Appendix Table A4). However, the identified pathways achieved low Bayes factors and encompassed a wide range of functions potentially regulated; therefore, further analysis was required.
Genes with FC > 1.4 were entered into the online tool, PANTHER [20], for functional classification. The top pathway identified was cholecystokinin receptor (CCKR). Pathways related to inflammation were also highlighted, with chemokine and cytokine signalling and interleukin signalling appearing in the top altered pathways (Figure 1a). The biological processes identified by Panther confirmed a change associated with immune function; however, metabolic processes and apoptosis were the strongest relationships identified (Figure 1b).

2.5. Ingenuity Pathway Analysis (IPA)

To identify the biological processes altered by OLE supplementation, the genes with significant changes in expression were entered into the bioinformatics program Ingenuity Pathway Analysis, build version 346717M (QIAGEN, Redwood City, CA, USA) [21]. Using genes at an FC of >1.4 and a p-value of <0.05 indicated an anti-inflammatory effect with the top canonical pathways associated with cancer, inflammatory disease, and arthritis.
Using an FC > 1.4, the cumulative effects of small changes in gene expression are likely to have been overlooked. A further analysis was therefore undertaken including all genes that were significantly altered (p < 0.05. A FC of >1.4 predominantly identified genes involved downstream or at the end of pathways for inflammation. Significantly (p < 0.05) altered genes with a lower FC may play a pivotal role in these downstream changes. For example, the amplification of kinase cascades means that molecules upstream are likely to have a much lower FC than downstream molecules, while still exerting an important biological effect. The analysis regardless of FC identified Phospholipase (PLA; p = 1.89 × 10⁻³) and Cholesterol Biosynthesis (p = 2.89 × 10⁻³) as the top pathways (Figure 2). The top diseases and disorders identified were Cancer and Organismal Injury and Abnormalities, corresponding with the results obtained using the 1.4 FC cut-off.
Phospholipases are a key component of inflammation via their release of arachidonic acid (AA), which interacts with COX-2 to produce prostaglandins (Figure 3). At >1.4 FC, Prostanoid Biosynthesis was highlighted as a key pathway; this is regulated by COX enzymes and produces an inflammatory response when activated. Metabolism of membrane lipid derivatives and cholesterol concentration interconnect and relate to the PLA pathway.
The majority of the pathways altered were downregulated (negative z-score) or had genes changed in both directions (no activity pattern predicted), although the effect of a gene being up or downregulated depends on its function within the pathway. The “Antioxidant Action of Vitamin C” pathway was upregulated (positive z-score) (Figure 2). If OLE was acting as an antioxidant, this pathway would be predicted to act in a similar way to vitamin C.
Another pathway with a predicted downregulation was the Wnt/β-catenin canonical pathway (p = 3.7 × 10⁻³) (Figure 2). This plays an important role in cancer progression, adipogenesis, and lipolysis.
A positive z-score (orange) indicates that gene expression is upregulated, while a negative score (blue) represents downregulated expression. The grey bars contain genes that are up and downregulated; therefore, the activity pattern cannot be determined. Ratio is the number of genes from a pathway that were altered with OLE consumption. The p-value for each pathway is presented on a log scale to allow easier visualisation.

2.5.1. Upstream Regulators

Using the measured changes in gene expression, IPA can be used to elucidate the biological causes and the downstream effects on cellular and organismal biology. This analysis showed that ERK1/2 (extracellular signal–regulated kinases1/2) inhibition, via NF-κB downregulation, could result in the observed expression of several inflammatory and cancer related genes (Figure 4).
Pathways Analysis Network in IPA predicted how changes in the ERK1/2 pathway could result in the observed changes in gene expression due to OLE consumption.

2.5.2. Real-Time PCR Confirmation of Array Expression

The expression levels of three genes (EGR1, COX-2 and ID3) were evaluated with real-time PCR to validate the microarray results. An upregulated gene (EGR1) and a downregulated (ID3) were chosen to validate if the Affymetrix array had measured up and downregulated genes correctly. The expression of COX-2 was also compared because this gene had interesting implications for inflammation. Gene expression was normalised against the housekeeping genes GAPDH and ACTB (β-actin); both of these showed consistent expression across participants, indicating that they are appropriate to use as housekeeping genes. The results measured by real-time PCR for EGR1, COX-2, and ID3 were consistent with the microarray data (Table 2).

3. Discussion

To our knowledge, this is the first study that has used transcriptomics methods to analyse the gene expression changes associated with OLE consumption in humans. It is important to acknowledge that this was a preliminary study to identify where changes in gene expression are occurring. The sample size was small. Thus, the results are indicative rather than conclusive but will help guide the direction of future research. The results suggest that anti-inflammatory and cancer-related gene expression changes are associated with the consumption of OLE and could explain the health benefits claimed with traditional use. Changes in gene expression indicate that the anti-inflammatory profile involves phospholipase and inflammatory pathways. There was very little evidence that changes in gene expression relating to the phase II enzymes and the Nrf2 canonical pathway were altered by OLE consumption, although inhibition of this pathway by olive oil phenolics has been suggested as instrumental in oxidative and inflammatory protection [6,7]. Many of the downregulated genes are pivotal in inflammation and disease (OSM, COX-2 and IL-8). Metabolic processes were also emphasized and an important lipolysis-related gene (G0S2) was altered by OLE consumption.

3.1. Gene Expression in PBMCs

PBMCs were chosen for analysis because they are easily accessible and express many genes believed to be restricted to non-blood tissues that respond to micro and macro alterations to organs, and will reflect effects of diet and nutrients [23,24]. Although mRNA expression profiles do not allow direct determination of protein function (especially those involved in phosphorylation signalling cascades), they do allow investigation of novel signalling pathways that OLE polyphenols may act through in human PBMCs. In a sample of healthy people taking a nutraceutical, changes are likely to be numerous but subtle [25], and thus it was not unexpected that the FC and significance of gene expression was not very strong. It is acknowledged that in this study, using an adjusted p-value cut off at 0.05, no changes in gene expressions would be deemed statistically significant. Therefore, an unadjusted p-value cut off at 0.05 was used. Three genes differentially expressed in response to supplementation were selected for validation with real-time PCR. One gene was significantly downregulated (EGR1) and one gene was significantly upregulated (ID3) when assessed by microarray. The third gene (COX-2) was selected because it plays an important role in inflammatory and cancer pathways. The expression levels between microarrays and real-time PCR for all three genes were similar, giving credibility to the use of unadjusted p-values for microarray analysis. All three genes used for validation play a role in cancer.
Many of the top genes downregulated in response to OLE were relevant to chronic and acute inflammation. Pathway analysis correlated the expression to inflammation and metabolic processes and identified cancer, arthritis, and adipogenesis as relevant. A recent study identified potential target genes for therapy for inflammation (COX-2), immune imbalance (IL-8), and active atherosclerosis (OSM) [26]. These genes were all downregulated with OLE.

3.2. COX-2 Expression in PBMCs

Research around the inflammatory enzyme COX-2 is extensive. This gene encoding this enzyme (COX-2) was downregulated in response to OLE consumption. At the time this study was completed, there were no existing studies that had demonstrated that olive polyphenols were able to regulate COX-2 beyond post-prandial consumption in healthy humans.
Interest in the anti-inflammatory properties of oleocanthal (an olive phenolic) was motivated by a study that demonstrated its ability to decrease the COX-2 enzyme levels in vitro [27]. Expression of the gene was not investigated. It was hypothesized that oleocanthal was acting in a similar manner to ibuprofen (IB) (inhibiting the enzyme) but to gain the same effects that the recommended dose of IB has on COX-2, it has been estimated that approximately 500 g of extra virgin OO (EVOO) would need to be consumed each day [27]. This is clearly not a realistic daily dose. COX-2 inhibition has been definitively demonstrated in cell models [28,29] and mice [30,31] treated with olive polyphenols. Cell models used polyphenol extract while the animal models have distributed it in their food with OO or refined oil, respectively.

3.3. IL-8 Expression in PBMCs

In this study, IL-8 was downregulated with OLE. This corresponds to the most recent in vivo work with the same OLE supplement in humans in which reduced levels of IL-8 were observed in blood taken from participants after a six-week intervention [9]. Ex vivo work by this group has also shown that OLE is able to downregulate IL-8 [32]. Another study looking at overweight males found no changes to IL-8 with OLE IL-8 is a pro-inflammatory chemokine involved in cellular response to inflammation, tumour proliferation, and has been acknowledged to play an important role in cancer [33]. IL-8 is a target gene of NF-κB [34], and, as mentioned above, has been identified as a potential target therapy for immune imbalance.

3.4. Other Genes with Inflammatory Relevance

This study measured a downregulation of transcription factor jun-B (JUNB) with OLE. JUNB is an AP1 transcription factor correlated to immune function, and recent experimental work has demonstrated its pivotal role in macrophage activation [22,35]. JUNB can be directly activated by NF-κB in dendritic cells with LPS stimulation [36] and is required for the full activation of IL1β and tumor necrosis factor (TNF) in macrophages stimulated by LPS [22].
Heparin binding EGF-like growth factor (HBEGF) was also downregulated with OLE. This growth factor is activated by the transcription factors AP1 and NF-κB and plays a role in cancer and other chronic diseases [37]. Upregulation of HBEGF has been observed in several cancer cells including breast (MDA-MB-231) and prostate (PC3), and it has been suggested as a potential target for treatment [38]. Its upregulation has also been correlated to NF-κB activation of inflammatory cytokines [39].
OSM was downregulated with OLE consumption in this study. This gene encodes the pro-inflammatory cytokine OSM, expression of which has been correlated with metastasis of cancer tumours [40,41]. In endometrial cancer, OSM was shown to activate STAT3, enhance cell migration and invasion in vitro and promote cell proliferation, growth and angiogenesis in vivo [42]. OSM receptor knock-out (KO) mice with cardiac disease have demonstrated improved survival and cardiac performance [43]; therefore, OSM could be a target for protection from cardiovascular complications.

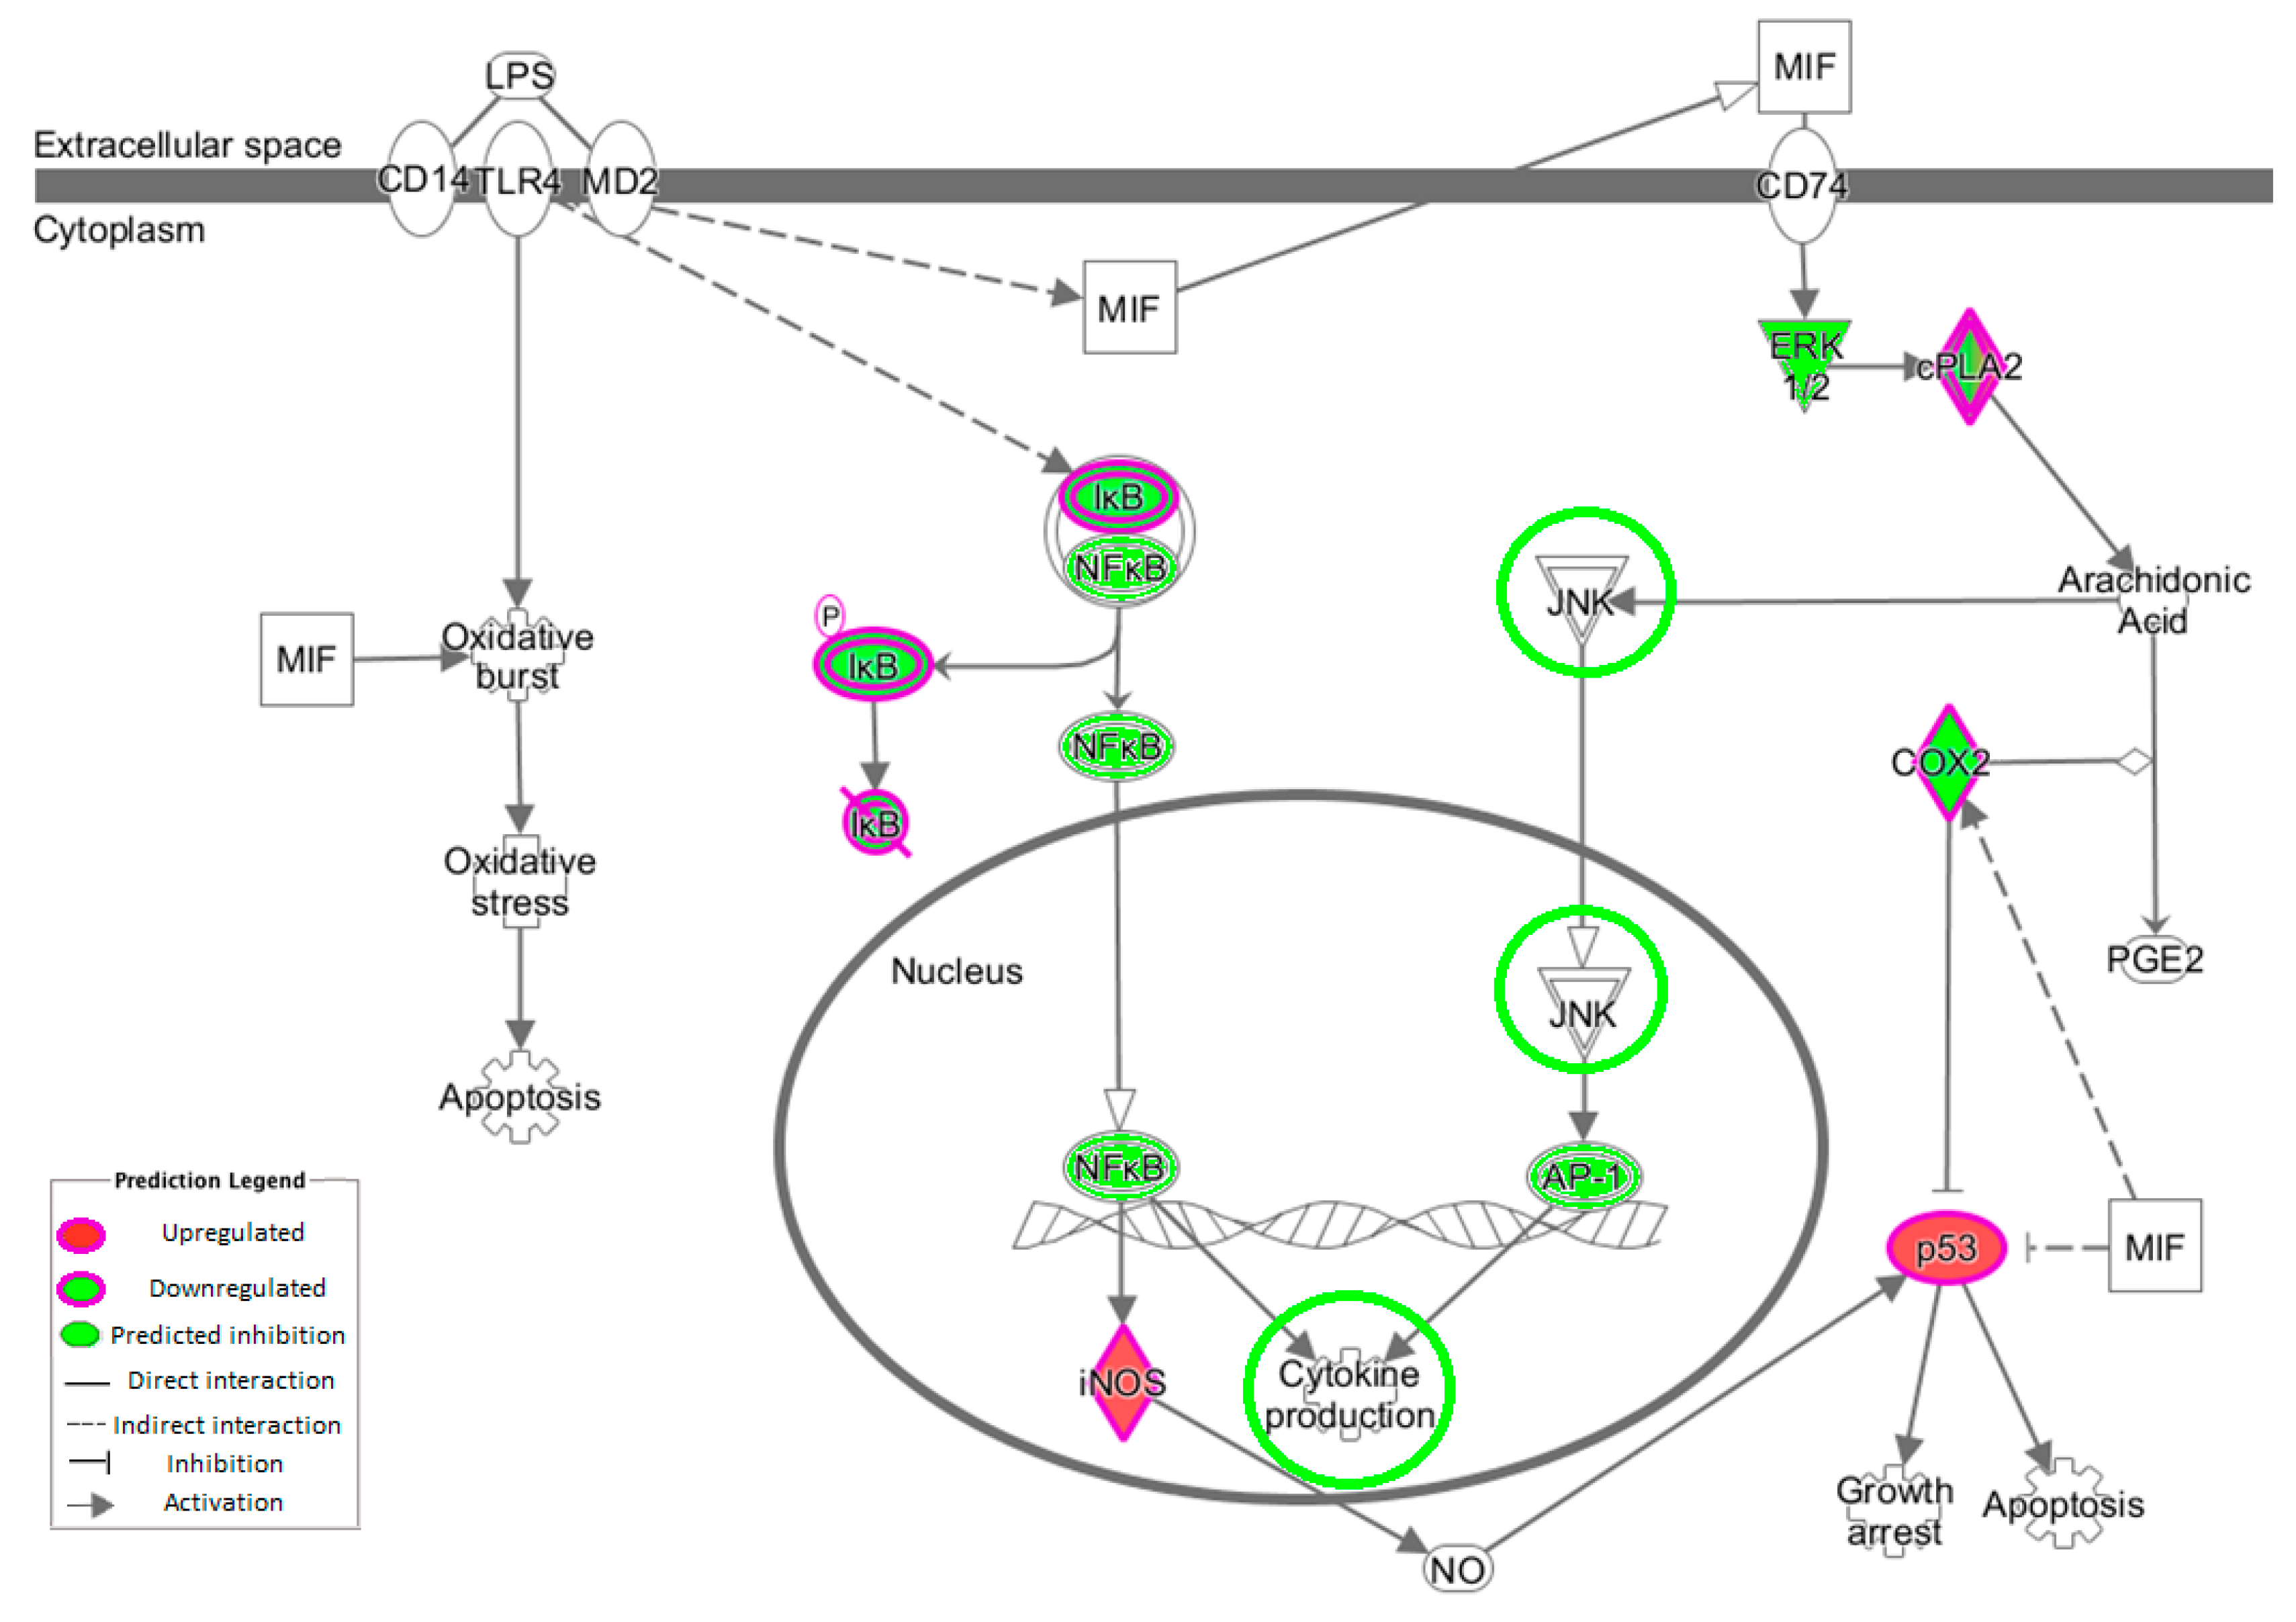
3.5. NF-κB Inflammatory Pathway

The transcription factor NF-κB activates >150 genes in response to stress [44]. The NF-κB complex resides inactively within the cytoplasm due to the presence of the inhibitor molecule IκB [45]. Measuring changes in the gene expression of NF-κB is largely ineffective because it is already present and therefore does not require further protein synthesis, merely activation. The kinases inhibitor of nuclear factor κB kinase subunit (IKK)α and IKKβ phosphorylate IκB proteins, allowing NF-κB to enter the nucleus, bind to promoter regions of target genes and enhance transcription of genes [46]. The intervention work revealed no measurable change in expression of IκB or NF-κB, although there was a modest decrease in the expression of IKKβ. This would result in decreased phosphorylation of IκB and therefore decreased release of NF-κB. IKK can be triggered by pro-inflammatory cytokines [47]. MyD88 was also downregulated and plays an important role in the activation of NF-κB triggered by TLRs. Lastly, NKAPL was downregulated with OLE. An in vivo model has demonstrated that its suppression leads to downregulation of NF-κB via inhibiting TNF and IL1β [48].
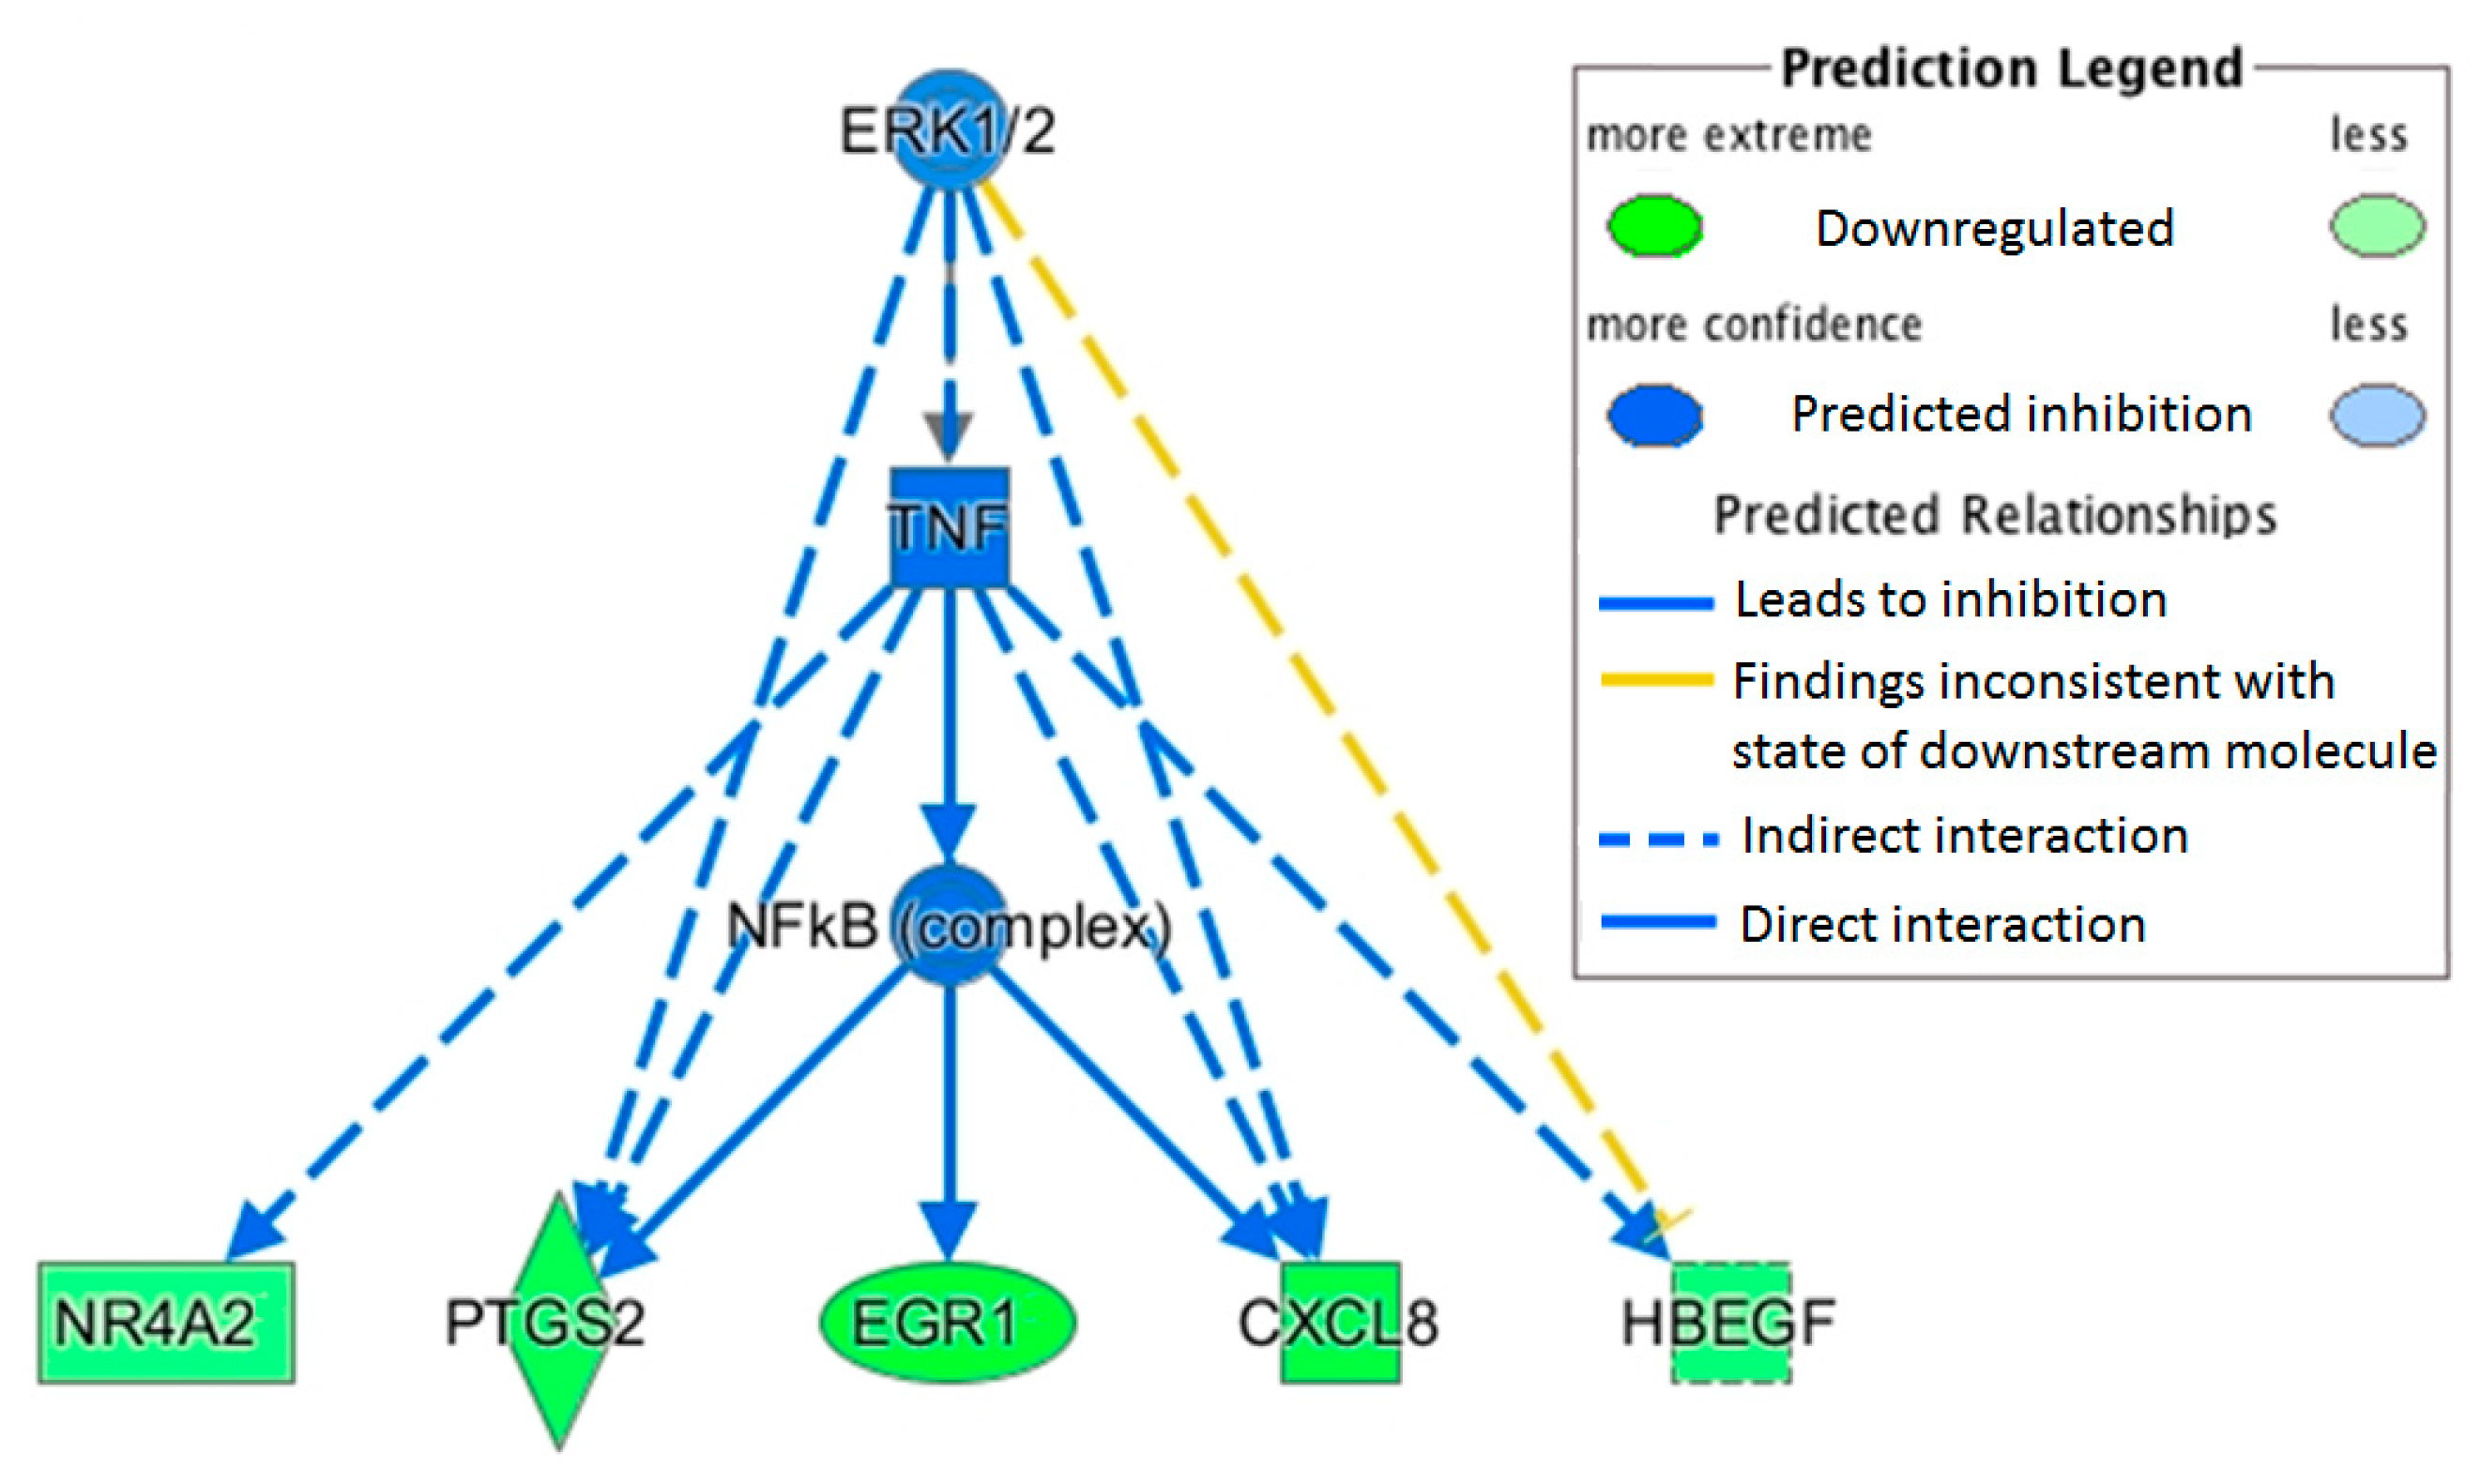
MAPK/AP1 may also play a role in OLE inflammatory changes. In this study, JUNB expression was downregulated, and this plays a role in the MAPK pathway (Figure 3).

3.6. Lipid Metabolism and Anti-Inflammatory Gene Expression

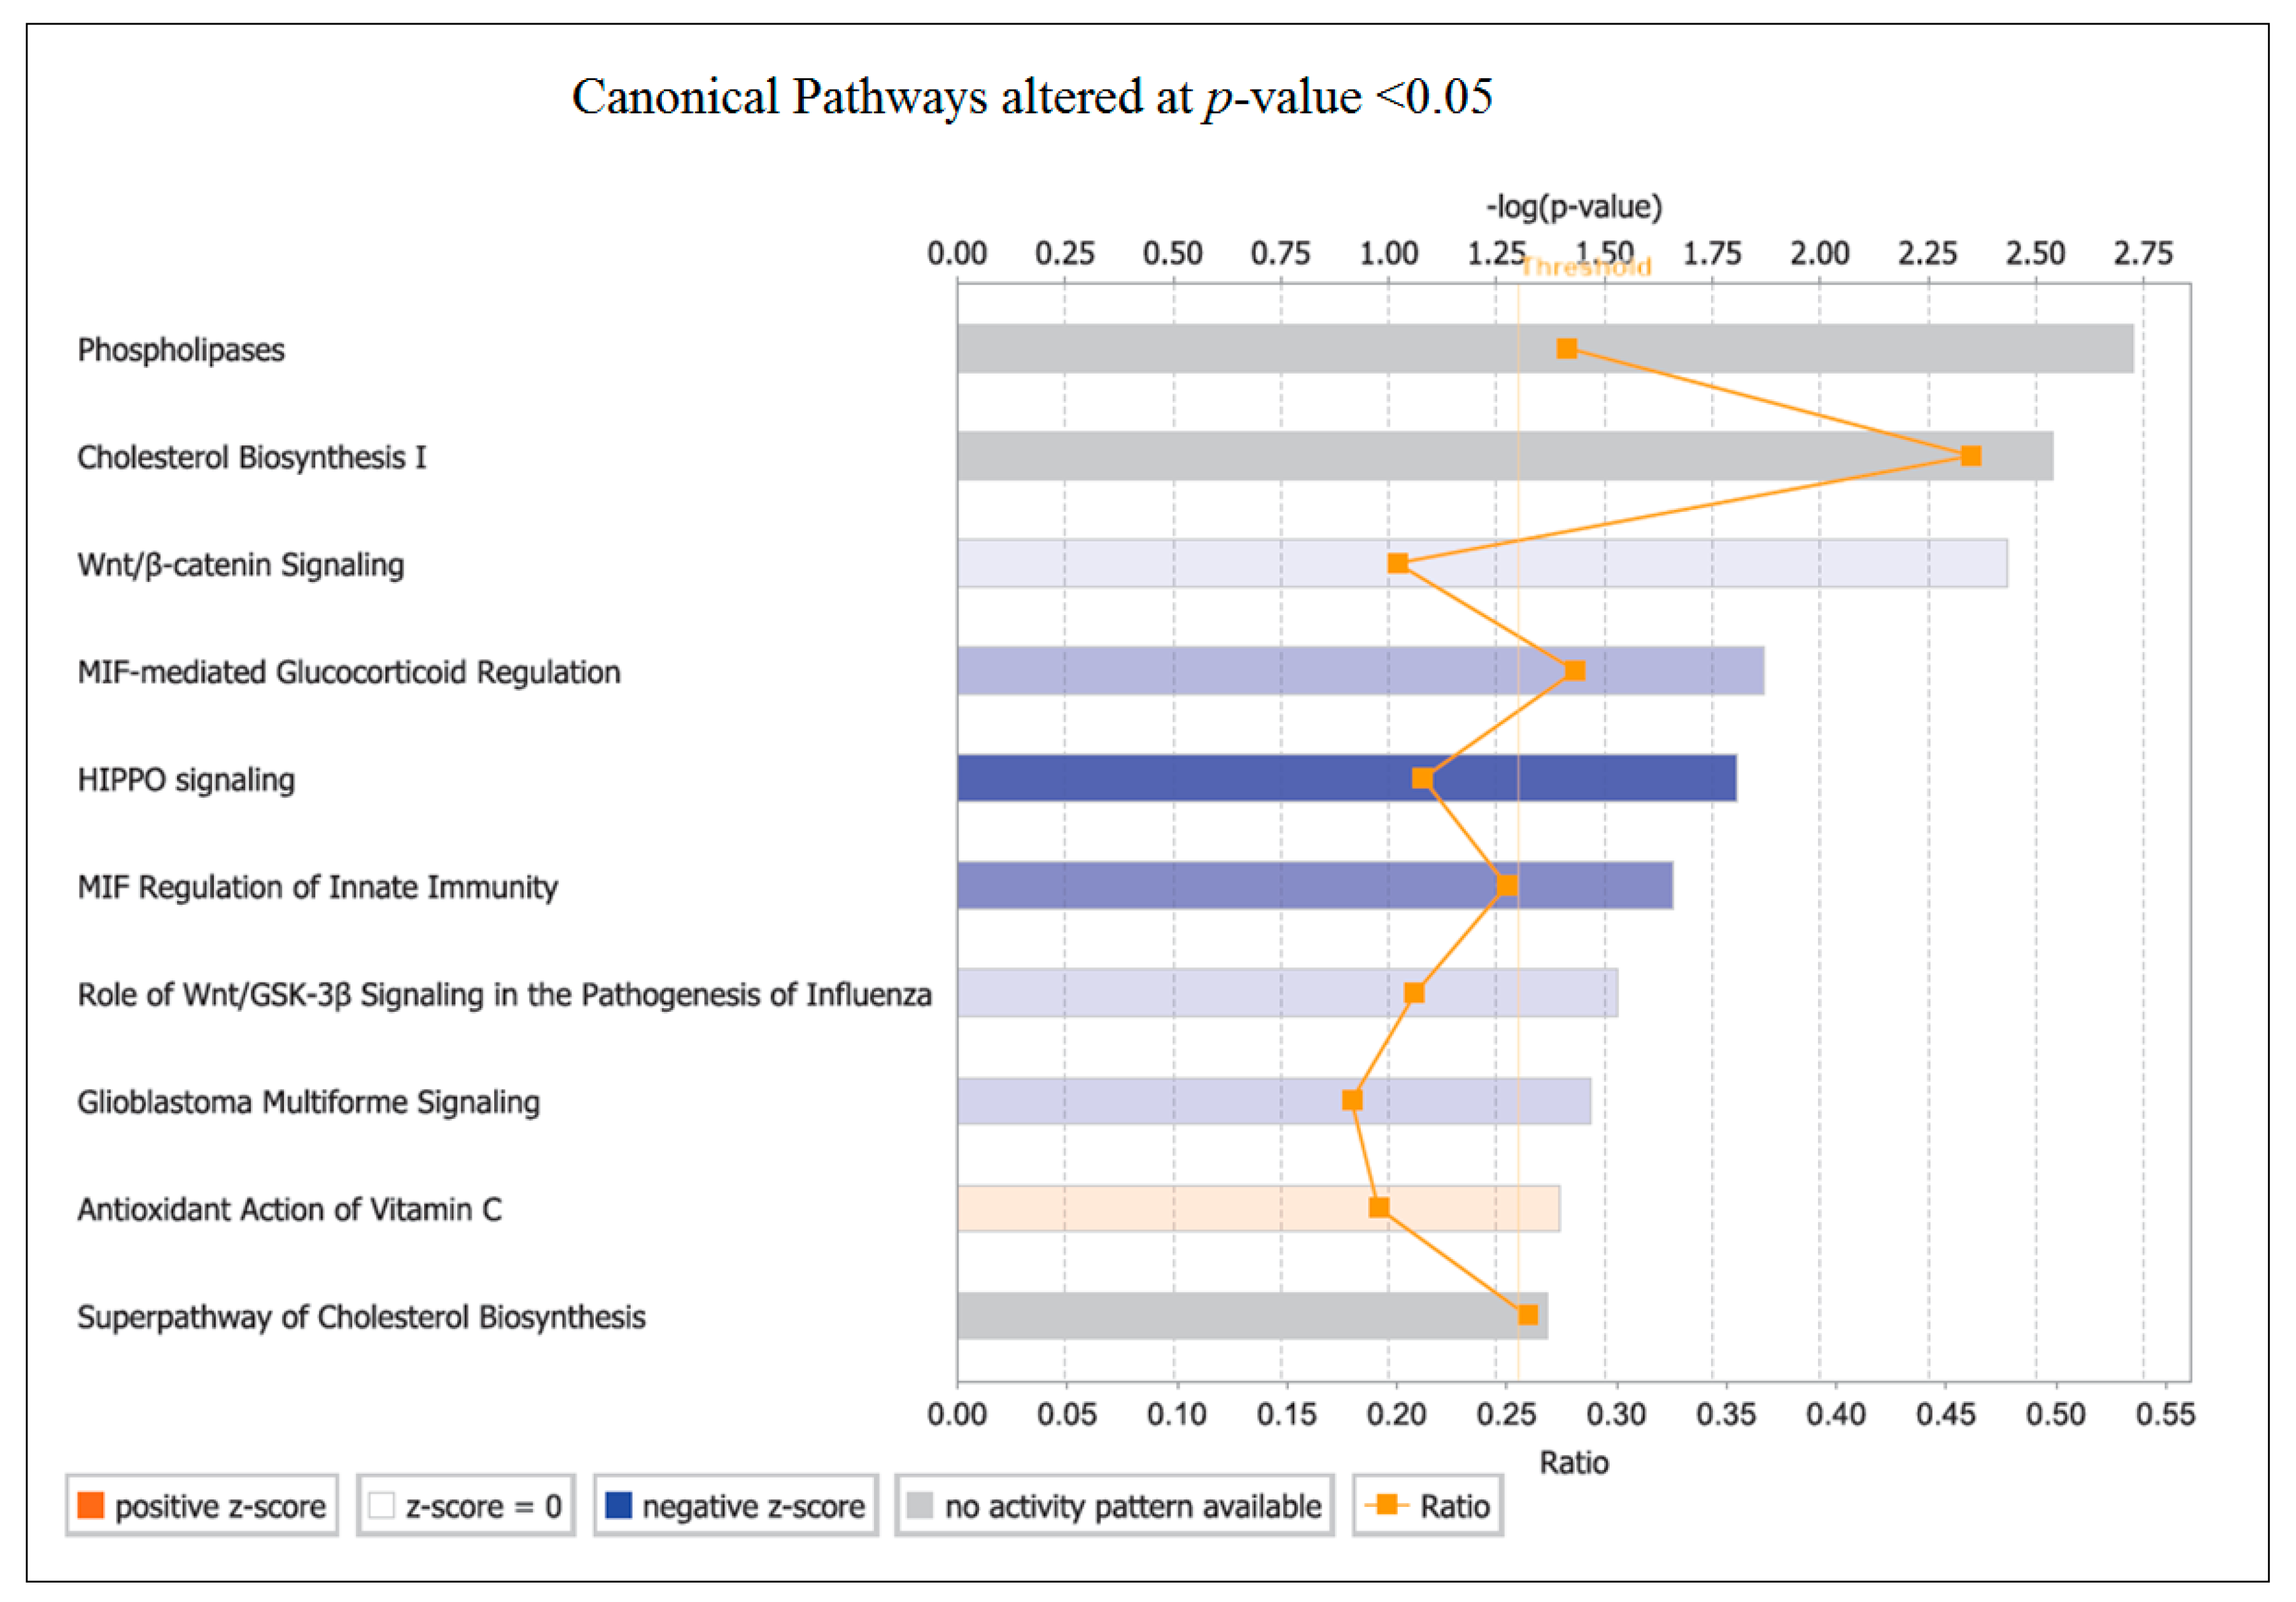
The top canonical pathway identified by pathway analysis was PLA. Phospholipases are enzymes that hydrolyse phospholipids into fatty acids and are categorized by the type of reaction they catalyse [49]. The genes involved in changes with OLE were predominantly associated with phospholipase A2 (PLA2) and then from within Phospholipase C (PLC). The PLC enzymes play an important role in cell signalling, proliferation and differentiation [50].
PLA2 plays an important role in inflammation via the release of arachidonic acid (AA) from the phospholipid membrane [51]. AA is transformed into prostaglandin (PGE2), which is converted by COXs to eicosanoids (including prostaglandins and leukotrienes), which influence both innate and adaptive immunity [52,53]. The downregulation of COX-2 observed in this study could restrict prostanoid (prostaglandin, thromboxane and prostacyclin) production from AA. Many diseases and their related complications have been correlated to PLA2 upregulation, including cardiovascular complications, atherosclerosis, vascular inflammation, cancer and obesity [53,54,55,56]. Inhibition of this pathway would partially explain the downregulation of inflammatory genes in this study.
G0S2 showed the strongest FC in expression after OLE consumption compared to all the other regulated genes, which is a novel finding. This gene has recently been highlighted for its ability to inhibit adipose triglyceride lipase (ATGL) which is key for the mobilization of triacylglycerol stores [57]. We are not aware of any studies that have reported or investigated changes in G0S2 with polyphenols. G0S2 KO in high fat diet-fed mice protects from obesity and insulin resistance, and increases thermogenesis [58,59,60]. Zhang et al. [59] measured an increase in ketogenesis (measured by plasma ketones). Silencing of G0S2 prevented adipocytes from differentiation, while overexpression activated progression from pre-adipocytes to mature adipocytes in vitro and in vivo. G0S2 KO reduced fat mass, lipid droplet size and the adipogenesis pathway in mice [57]. This suggests that G0S2 is a key regulator of energy homeostasis, mediating lipolysis and fatty acid oxidation, and a downregulation of this gene could be beneficial in the treatment of both obesity and obesity-related diseases.

3.7. Gene Expression Change and Health Outcomes

The anti-inflammatory gene expression demonstrates that changes are not merely due to anti-oxidising capacity as was historically hypothesised. Downregulating the AA and NF-κB pathways could explain many of the health benefits attributed to OLE with traditional use. These include pain, inflammatory related diseases such as cancer, diabetes, cardiovascular disease, and an improved acute immune response.
Chronic inflammation is linked to many diseases including cancer and cardiovascular disease. COX-2 is a strong driver of inflammation, and, therefore, has been an important area of focus [61]. The AA pathway and PGE2 production have been correlated with cancer and are also known as the “inflammogenesis of cancer” [53]. Regular intake of COX-2 inhibitors such as aspirin has been associated with a reduced risk of death due to cancers including prostate and breast [61,62,63]. Upregulation of COX-2 is found in skin, breast, prostate, bladder and pancreatic carcinomas [64].
Inhibiting COX-2 and thereby reducing prostaglandins could also explain improvements in Blood Pressure (BP) measured in humans after OLE consumption [9]. HT administered to rats was able to reduce thromboxane B2 and platelet aggregation in blood [65]. In a model using hypertensive rats, COX-2 inhibitors reduced Prostaglandin F2α (PGF2α) expression, improved endothelial relaxation and reduced BP [66]. In humans, intake of high phenolic enriched OO has also shown improved BP with reduced chemokine (C-X-C motif) receptor 2 (IL8RA) and other genes related to BP [67]. This study explained that the reduction in IL8RA could influence the renin–angiotensin–aldosterone system II, which plays an important role in blood pressure and thereby hypertension. Although IL8RA was not identified in our study, it is a specific receptor for IL-8. In studies investigating postprandial effects of olive oil phenolic consumption in humans, the anti-inflammatory profile was evident but an upregulation in cholesterol efflux was also demonstrated [68,69]. Cholesterol accumulation in immune cells leads to inflammatory responses, which, in turn, can lead to decreased cholesterol efflux and further inflammation [70]. A reduction in oxidised cholesterol could help explain the anti-inflammatory profile measured with OLE in our study.
In downregulating acute inflammation, OLE would be hypothesized to compromise the immune system and conceivably facilitate infection. More recently, it has been suggested that bacteria may benefit from and further stimulate PGE2 synthesis in order to compromise the gut and lung linings of the host [71]. In human macrophages, an inhibition of COX-2 reduced H5N1 infected pro-inflammatory response and virus replication, the work indicated the virus required COX-2 pathway activation in order to replicate [72]. IL-8 production is also activated by influenza [73]. A downregulation of inflammatory related genes as observed in this study with OLE could improve immune function and defence against pathogen attack.
This study demonstrated downregulation in G0S2 with OLE supplementation. If G0S2 was able to downregulate free fatty acid (FFA) or adipogenesis, this could contribute to the reduced inflammatory profile measured in participants taking OLE in this study.

4. Materials and Methods

4.1. Study Design

The study was a parallel double-blind randomised controlled trial conducted according to the ethical guidelines laid down by the Declaration of Helsinki 1975, and approved by the New Zealand Health and Disability Ethics Committees (15/NTB/27). The study was registered with the Australian New Zealand Clinical Trials Registry (ACTRN12615001021561). An 8-week intervention time was based on a previous 6-week intervention study measuring changes in BP after supplementation with the same OLE product [9]. A more recent study looking at polyphenols in the diet using a parallel design also used 8 weeks to successfully detect changes in inflammation [74]. OLE and Mediterranean Diet benefits to health are correlated to long-term exposure; therefore, this study was looking for an alteration in gene expression that was not merely a post-prandial effect. Thirty-three male subjects were given either a liquid OLE supplement or PBO (Appendix Table A2). Exclusion criteria included the consumption of anti-inflammatories (such as low dose aspirin), antioxidant supplements, cholesterol or blood pressure medicine, and antibiotics in the past month (Appendix Figure A1). Participants were instructed to take 10 mL of their supplement twice a day with meals for 8 weeks. Measuring spoons were provided. Participants attended a clinical visit at the beginning of the trial where they gave a fasted blood sample and completed their initial Food diary. After the 8-week intervention, participants returned for their second visit where they gave a fasted blood sample. A second food diary was handed in at this appointment. An 8–10 mL blood sample was collected in ethylenediaminetetraacetic acid (EDTA) tubes at the Faculty of Medical and Health Sciences, Grafton campus, The University of Auckland by a registered nurse.

4.2. Test Product

“Olive Leaf Extract Extra Strength” is a commercially available OLE liquid concentrate manufactured and bottled by Comvita New Zealand Limited (Paengaroa, Te Puke, New Zealand) (Appendix Table A2). Both OLE and PBO were analysed by high performance liquid chromatography (HPLC), which allowed the type and concentrations of polyphenols to be determined. This showed that the PBO contained no polyphenols (Appendix Table A3). A 10 mL dose twice a day provided 121.8 mg of Oleuropein and 6.4 mg of HT daily. Tests have shown that even at high concentrations, OLE is not genotoxic [75].

4.3. Statistical Analysis and Sample Size

There was no published literature on OLE and transcriptomic outcomes in humans at the time this research was undertaken; therefore, OO phenolic studies in humans were utilized to inform statistical decisions.
Standard deviation and differential expression of the JUN gene in healthy volunteers was taken from a previous study looking at changes with OO phenolics [76]. This standard deviation was used to calculate a total sample of 32 participants allowing >80% power to detect a significant difference in JUN gene expression between intervention groups assuming a dropout rate of 10% and a 2-sided type error of 0.05. The linear models for microarray analysis (Limma) model [77] was used for analysing gene expression pre and post intervention, paired by participant.

4.4. Dietary Assessment

All volunteers were asked to complete a diet and activity profile, using the University of Auckland standard 3-day food and activity diary.
The food intake diaries collected pre and post-supplementation were analysed using Foodworks Professional 2012 (Xyris Software (Australia) Pty Ltd., Brisbane, Autralia) and the New Zealand food composition tables. These were used to estimate changes that could impact the gene expression measured in PBMCs, such as high alcohol or polyphenol consumption over the days before the clinical visit. The diary was also used to measure any changes in the diet that may have occurred after taking the supplement.

4.5. Compliance

Volunteers from both intervention arms were contacted fortnightly by the coordinating investigator to confirm that the supplement was being taken and there were no problems. The instructions were to take 20 mL per day of the cardiovascular strength OLE, delivering 121.8 mg of oleuropein and 6.4 mg HT. Remaining supplement was returned at the end of the study, and this was used to estimate the amount of supplement taken.

4.6. Gene Expression Arrays

PBMCs were extracted from the blood samples by Ficoll–Paque density gradient centrifugation (Ficoll–PaqueTM Premium, Global Science and Technology, Auckland, New Zealand) and stored until RNA extraction.
All RNA samples were extracted from PBMCs in batches using the RNeasy Plus Mini Kit (QIAGEN, Victoria, Australia) following the manufacturer’s recommended protocol.
RNA was quantified using the NanoDrop® ND-1000 spectrophotometer (Thermo Fisher Scientific, Wilmington, DE, USA) and quality tested using the Bioanalyzer (2100 Bioanalyzer, Aligent, Santa Clara, CA, USA) analysis. The RNA was then diluted to a concentration of 100 ng/µL.
The data discussed in this publication have been deposited in NCBI’s Gene Expression Omnibus [78] and are accessible through GEO Series accession number GSE87300 (https://www.ncbi.nlm.nih.gov/geo/query/acc.cgi?acc=GSExxx).

4.7. Microarray Analysis

The RNA samples were sent to the Ramaciotti Centre, Randwick, Australia for analysis. An Affymetrix PrimeView™ gene array was used to quantify gene expression, analysed by the GeneChip Scanner 3000 7G (Affymetrix).

4.8. Quality Control of Arrays

Quality assessment of the microarrays was completed using Affymetrix Expression Console (Thermo Fisher Scientific) and the BioConductor package “affy” [79] in R, version 3.1.3 [80].

4.9. Differential Gene Expression

To detect changes after OLE intervention, the full set of OLE volunteer arrays were compared to the paired baseline array. The arrays from the PBO volunteer group were also compared to their baseline array. Changes in the PBO arm arrays were used to control for the natural fluctuation in gene expression that would also be expected within the OLE arm. A mathematical linear model was used to calculate differences between the intervention groups and timepoints. The age variation was also accounted for in the linear model.
The package “ggplot” in R was used to visualize the expression of specific probe sets or genes of interest pre and post-supplementation and between treatment groups.

4.10. Gene Ontology

Gene Ontology (GO) analysis was carried out with PANTHER to elucidate biological process, molecular function and the protein class [17]. The Gene Ontology project is a bioinformatics initiative encompassing knowledge of how genes encode biological functions at the molecular, cellular and tissue system levels.
Significantly altered genes were also entered into GATHER [19], which creates a Bayes factor. This is a measure of the strength of the evidence supporting an association of an annotation with the gene list submitted [19]. Higher Bayes factors indicate stronger evidence that the annotation is relevant to the genes of interest [81]. A positive Bayes factor indicates that the evidence supports the hypothesis that the annotation is more related to the genes of interest than other genes in the genome. This can create bias when looking for pathway and gene group changes because the strength of the Bayes factor is based upon the ratio of genes altered from a pathway to the genes altered. GATHER gene expression analysis is a preliminary analysis specialising in identifying the potential pathways of interest based on the genes found to be significantly affected.

4.11. Ingenuity Pathway Analysis (IPA)

Pathway analysis of the differentially expressed genes was performed using IPA software (2000–2016, QIAGEN, Redwood City, CA, USA). This program constructs gene interactions based on the regularly updated Ingenuity Knowledge Base (http://www.ingenuity.com). This program is also able to predict in which direction these changes are likely to impact: inhibitory or activating. The statistical modelling behind IPA uses the Fisher exact test [82] to determine significant pathways from the input gene list.

4.12. Gene Expression Validation with Real-Time PCR

To confirm the microarray results, TaqMan real-time PCR analysis was performed for EGR1, ID3 and COX-2 following the manufacturer’s protocol. Two housekeeping genes (GAPDH and β-actin) were used to control for expression.

4.13. Statistical Analysis of Real-Time PCR

Gene expression levels were calculated with the equation: 2ΔΔCt [83]. The gene expression results for housekeeping genes were combined allowing for greater accuracy [84]. An absolute FC was calculated to allow ease of analysis, and this was calculated with the equation: −2^Log2(FC). An FC greater than 1 was classified as an upregulation of gene expression and less than 1 was classified as downregulation of gene expression. As with the statistical analysis of the microarray data, the PBO was used to adjust for the FC in OLE participants. In order to calculate the FC differences between OLE and PBO, data for the participants treated with OLE was adjusted with participants treated with PBO following calibration, using a modified formula from Section 4.9.
(OLE_T2 calibrated with OLE_T1) − (PBO_T2 calibrated with PBO_T1)
If the range of standard error of the mean intersected with 1 or −1, then the expression was considered non-significant.
A Students t-test was used to calculate the differences in gene expression between the OLE treatment and PBO treatment. Two tailed p-values were calculated EGR1 p = 0.025, COX-2 p = 0.016 and ID3 p = 0.023.

5. Conclusions

To conclude, the gene expression profile observed in this study with OLE may explain health benefits described in previous studies. Improvements in BP [9] and insulin sensitivity [10] measured in humans after the consumption of OLE relate to regulation of phospholipase metabolic and inflammatory pathways. Anti-inflammatory gene expression in humans could explain the claimed health outcomes for cold and influenzas, and chronic anti-inflammatory alterations to gene expression could explain reduced prevalence of cardiovascular disease and cancers.
Literature supports olive polyphenol ability to improve health outcomes related to inflammation. What bioactive components of the OLE are interacting with the inflammatory pathways deserves further analysis. The anti-inflammatory expression induced with OLE could be a result of manipulation of lipid metabolism or vice versa, but further investigation is required.

Acknowledgments

Funding was provided to Anna Boss from Comvita, New Zealand Limited, 234 Wilson Road, South, Paengaroa, Te Puke 3189.

Author Contributions

Anna Boss and Lynnette R. Ferguson conceived and designed the experiments, with input from Matthew P. G. Barnett; Anna Boss Pamela M. Murray and Chi Hsiu-Juei Kao performed the experiments; Anna Boss analyzed the data with input from Matthew P. G. Barnett and Gareth Marlow; Anna Boss wrote the initial draft of the paper, with input from Lynnette R. Ferguson, Gareth Marlow, Chi Hsiu-Juei Kao and Matthew P. G. Barnett.

Conflicts of Interest

The authors declare no conflict of interest. The funding sponsors had no role in the design of the study; in the collection, analyses, or interpretation of data; in the writing of the manuscript, and in the decision to publish the results.

Abbreviations

AAArachidonic acid
AP1Activator protein 1
COX-2Prostaglandin-endoperoxide synthase 2 or cyclooxygenase 2
EGR1Early growth response 1
ERKExtracellular signal-regulated kinase
FCFold change
FFAFree fatty acid
GOGene ontology
G0S2G0/G2 switch gene 2
HBEGFHeparin-binding EGF-like growth factor
HTHydroxytyrosol
ID3Inhibitor of DNA binding 3, dominant negative helix-loop-helix protein
KOKnock out
MIFMacrophage migration inhibitory factor
NF-κBNuclear factor kappa-light-chain-enhancer of activated B cells
OLEOlive leaf extract
OO, VOO, EVOOOlive oil, virgin olive oil, extra virgin olive oil
OSMOncostatin M
PGE2prostaglandin
PBOPlacebo
PLA, PLA2, PLC, sPLA, cPLAPhospholipase, phospholipase A2, phospholipase C, secreted phospholipase, cystolic phospholipase

Appendix A

Table A1. Characteristics of study participants pre- and post-supplementation.
MeasurementOlive Leaf Extract GroupnPlacebo Groupn
Age32 years (mean) 34.5 years (mean)
20–29920–297
30–39330–392
40–49140–492
>502>502
Smoking Status
Never12Never9
Former3Former4
Current0Current0
BMI Pre-supplement24.93 kg/m2 (mean) 24.21 kg/m2 (mean)
<200<200
≥20–≤2510≥20–≤259
>25–≤303>25–≤304
>302>301
BMI Post-supplement24.26 kg/m2 (mean) 24.07 kg/m2 (mean)
<200<200
≥20–≤2510≥20–≤259
>25–≤304>25–≤304
>301>301
Table A2. Ingredients for placebo and OLE supplement.
Placebo-RecipeOlive Leaf Extract
30 L Glycerol15 L Vegetable glycerol (bulking agent)
15 g Sucrose octa acetate added to 30 L water15 L Olea europaeo (Olive) Leaf extract (water, olive leaf solids) equivalent to 15 g fresh leaf (5 g fresh leaf per 5 mL dose)
98 g Caramel colour
0.9 g Damascenone
0.075 g Guaiacol
0.075 g Eugenol
Table A3. Phenolic content in Comvita OLE (HPLC performed by Alistair Binney from the Comvita team. The placebo was also run for quality control and no polyphenols were detected).
Phenolic Contentmg/mLDose (mg) 20 mL
Oleuropein6.09121.8
Oleoside0.8116.2
Hydroxytyrosol0.326.4
Luteolin 7-O-glucoside0.12
Tyrosol0.071.4
Vanillin Acid0.030.6
Apigenin-7-O-glucoside0.020.4
Caffeic Acid0.020.4
Verbascoside0.010.2
Vanillin0.010.2
Rutin0.010.2
Diosmetin0.010.2
Table A4. Results generated in Gene Annotation Tool to Help Explain Relationships (GATHER) using the Gene ontology (GO) database.
Gene Ontology at >1.4 FCNumber of Genesp-ValueBayes Factor
Regulation of physiological process13<0.000110
Regulation of biological process13<0.00018
Development90.00025
Regulation of metabolism90.00044
Cyclooxygenase pathway10.00084
Regulation of transcription, DNA-dependent80.0013
Transcription, DNA-dependent80.0013
Regulation of transcription80.0023
Figure A1. Eligibility question used to determine selection of the healthy study participants.
Ijms 17 02019 g005

References

  1. Tunca, B.; Tezcan, G.; Cecener, G.; Egeli, U.; Ak, S.; Malyer, H.; Tumen, G.; Bilir, A. Olea europaea leaf extract alters microRNA expression in human glioblastoma cells. J. Cancer Res. Clin. Oncol. 2012, 138, 1831–1844. [Google Scholar] [CrossRef] [PubMed]
  2. Samet, I.; Han, J.; Jlaiel, L.; Sayadi, S.; Isoda, H. Olive (Olea europaea) Leaf Extract Induces Apoptosis and Monocyte/Macrophage Differentiation in Human Chronic Myelogenous Leukemia K562 Cells: Insight into the Underlying Mechanism. Oxid. Med. Cell. Longev. 2014, 2014, 927619. [Google Scholar] [CrossRef] [PubMed]
  3. Ryu, S.-J.; Choi, H.-S.; Yoon, K.-Y.; Lee, O.-H.; Kim, K.-J.; Lee, B.-Y. Oleuropein suppresses LPS-induced inflammatory responses in RAW 264.7 cell and zebrafish. J. Agric. Food Chem. 2015, 63, 2098–2105. [Google Scholar] [CrossRef] [PubMed]
  4. Shen, Y.; Song, S.J.; Keum, N.; Park, T. Olive Leaf Extract Attenuates Obesity in High-Fat Diet-Fed Mice by Modulating the Expression of Molecules Involved in Adipogenesis and Thermogenesis. Evid. Based Complement. Altern. Med. 2014, 2014, 971890. [Google Scholar] [CrossRef] [PubMed]
  5. Liu, Y.-N.; Jung, J.-H.; Park, H.; Kim, H. Olive leaf extract suppresses messenger RNA expression of proinflammatory cytokines and enhances insulin receptor substrate 1 expression in the rats with streptozotocin and high-fat diet-Induced diabetes. Nutr. Res. 2014. [Google Scholar] [CrossRef] [PubMed]
  6. Bayram, B.; Ozcelik, B.; Grimm, S.; Roeder, T.; Schrader, C.; Ernst, I.M.A.; Wagner, A.E.; Grune, T.; Frank, J.; Rimbach, G. A diet rich in olive oil phenolics reduces oxidative stress in the heart of SAMP8 mice by induction of Nrf2-dependent gene expression. Rejuvenation Res. 2012, 15, 71–81. [Google Scholar] [CrossRef] [PubMed]
  7. Paredes-Gonzalez, X.; Fuentes, F.; Jeffery, S.; Saw, C.L.-L.; Shu, L.; Su, Z.-Y.; Kong, A.-N.T. Induction of NRF2-mediated gene expression by dietary phytochemical flavones apigenin and luteolin. Biopharm. Drug Dispos. 2015, 36, 440–451. [Google Scholar] [CrossRef] [PubMed]
  8. Crespo, M.C.; Tomé-Carneiro, J.; Burgos-Ramos, E.; Loria Kohen, V.; Espinosa, M.I.; Herranz, J.; Visioli, F. One-week administration of hydroxytyrosol to humans does not activate Phase II enzymes. Pharmacol. Res. 2015, 95–96, 132–137. [Google Scholar] [CrossRef] [PubMed]
  9. Lockyer, S.; Rowland, I.; Spencer, J.P.E.; Yaqoob, P.; Stonehouse, W. Impact of phenolic-rich olive leaf extract on blood pressure, plasma lipids and inflammatory markers: A randomised controlled trial. Eur. J. Nutr. 2016. [Google Scholar] [CrossRef] [PubMed]
  10. De Bock, M.; Derraik, J.G.B.; Brennan, C.M.; Biggs, J.B.; Morgan, P.E.; Hodgkinson, S.C.; Hofman, P.L.; Cutfield, W.S. Olive (Olea europaea L.) leaf polyphenols improve insulin sensitivity in middle-aged overweight men: A randomized, placebo-controlled, crossover trial. PLoS ONE 2013, 8, e57622. [Google Scholar] [CrossRef] [PubMed]
  11. Visioli, F. Can Experimental Pharmacology Be Always Applied to Human Nutrition? Int. J. Food Sci. Nutr. 2015. Available online: http://www.tandfonline.com/doi/full/10.3109/09637486.2012.665439#abstract (accessed on 12 August 2015). [Google Scholar] [CrossRef] [PubMed]
  12. Affymetrix, Affymetrix® Expression Console™ Software 1.4.1. 2015. Available online: http://www.affymetrix.com/estore/browse/level_seven_software_products_only.jsp?productId=131414#1_1 (accessed on 19 February 2016).
  13. Benjamin, Y.; Hochberg, Y. Controlling the false discovery rate: A practical and powerful approach to multiple testing. J. R. Stat. Soc. Ser. B 1995, 57, 289–300. [Google Scholar]
  14. Elliott, R.M.; de Roos, B.; Duthie, S.J.; Bouwman, F.G.; Rubio-Aliaga, I.; Crosley, L.K.; Mayer, C.; Polley, A.C.; Heim, C.; Coort, S.L.; et al. Transcriptome analysis of peripheral blood mononuclear cells in human subjects following a 36 h fast provides evidence of effects on genes regulating inflammation, apoptosis and energy metabolism. Genes Nutr. 2014, 9, 432. [Google Scholar] [CrossRef] [PubMed] [Green Version]
  15. Bouwens, M.; Afman, L.A.; Müller, M. Fasting Induces Changes in Peripheral Blood Mononuclear Cell Gene Expression Profiles Related to Increases in Fatty Acid Beta-Oxidation: Functional Role of Peroxisome Proliferator Activated Receptor Alpha in Human Peripheral Blood Mononuclear Cells. Am. J. Clin. Nutr. 2007, 86, 1515–1523. [Google Scholar] [PubMed]
  16. Konstantinidou, V.; Khymenets, O.; Covas, M.-I.; de la Torre, R.; Muñoz-Aguayo, D.; Anglada, R.; Farré, M.; Fito, M. Time course of changes in the expression of insulin sensitivity-related genes after an acute load of virgin olive oil. OMICS 2009, 13, 431–438. [Google Scholar] [CrossRef] [PubMed]
  17. Ashburner, M.; Ball, C.A.; Blake, J.A.; Botstein, D.; Butler, H.; Cherry, J.M.; Davis, A.P.; Dolinski, K.; Dwight, S.S.; Eppig, J.T.; et al. Gene ontology: Tool for the unification of biology. The Gene Ontology Consortium. Nat. Genet. 2000, 25, 25–29. [Google Scholar] [CrossRef] [PubMed]
  18. The Gene Ontology Consortium. Gene Ontology Consortium: Going forward. Nucleic Acids Res. 2015, 43, D1049–D1056. [Google Scholar]
  19. Chang, J.T.; Nevins, J.R. GATHER: A systems approach to interpreting genomic signatures. Bioinformatics 2006, 22, 2926–2933. [Google Scholar] [CrossRef] [PubMed]
  20. Mi, H.; Dong, Q.; Muruganujan, A.; Gaudet, P.; Lewis, S.; Thomas, P.D. PANTHER version 7: Improved phylogenetic trees, orthologs and collaboration with the Gene Ontology Consortium. Nucleic Acids Res. 2010, 38, D204–D210. [Google Scholar] [CrossRef] [PubMed]
  21. QIAGEN; Redwood City, U. Ingenuity Pathway Analysis® (2015). Available online: http://www.qiagen.com/ingenuity (accessed on 24 February 2016).
  22. Fontana, M.F.; Baccarella, A.; Pancholi, N.; Pufall, M.A.; Herbert, D.R.; Kim, C.C. JUNB is a key transcriptional modulator of macrophage activation. J. Immunol. 2015, 194, 177–186. [Google Scholar] [CrossRef] [PubMed]
  23. Olsen, K.S.; Skeie, G.; Lund, E. Whole-Blood Gene Expression Profiles in Large-Scale Epidemiological Studies: What Do They Tell? Curr. Nutr. Rep. 2015, 4, 377–386. [Google Scholar] [CrossRef] [PubMed] [Green Version]
  24. Liew, C.-C.; Ma, J.; Tang, H.-C.; Zheng, R.; Dempsey, A.A. The peripheral blood transcriptome dynamically reflects system wide biology: A potential diagnostic tool. J. Lab. Clin. Med. 2006, 147, 126–132. [Google Scholar] [CrossRef] [PubMed]
  25. Hanekamp, J.C.; Bast, A.; Calabrese, E.J. Nutrition and health—Transforming research traditions. Crit. Rev. Food Sci. Nutr. 2015, 55, 1074–1080. [Google Scholar] [CrossRef] [PubMed]
  26. Kapoor, D.; Trikha, D.; Vijayvergiya, R.; Kaul, D.; Dhawan, V. Conventional therapies fail to target inflammation and immune imbalance in subjects with stable coronary artery disease: A system-based approach. Atherosclerosis 2014, 237, 623–631. [Google Scholar] [CrossRef] [PubMed]
  27. Beauchamp, G.K.; Keast, R.S.J.; Morel, D.; Lin, J.; Pika, J.; Han, Q.; Lee, C.-H.; Smith, A.B.; Breslin, P.A.S. Phytochemistry: Ibuprofen-like activity in extra-virgin olive oil. Nature 2005, 437, 45–46. [Google Scholar] [CrossRef] [PubMed]
  28. Rosignoli, P.; Fuccelli, R.; Fabiani, R.; Servili, M.; Morozzi, G. Effect of olive oil phenols on the production of inflammatory mediators in freshly isolated human monocytes. J. Nutr. Biochem. 2013, 24, 1513–1519. [Google Scholar] [CrossRef] [PubMed]
  29. Scoditti, E.; Calabriso, N.; Massaro, M.; Pellegrino, M.; Storelli, C.; Martines, G.; de Caterina, R.; Carluccio, M.A. Mediterranean diet polyphenols reduce inflammatory angiogenesis through MMP-9 and COX-2 inhibition in human vascular endothelial cells: A potentially protective mechanism in atherosclerotic vascular disease and cancer. Arch. Biochem. Biophys. 2012, 527, 81–89. [Google Scholar] [CrossRef] [PubMed]
  30. Sánchez-Fidalgo, S.; Cárdeno, A.; Sánchez-Hidalgo, M.; Aparicio-Soto, M.; de la Lastra, C.A. Dietary extra virgin olive oil polyphenols supplementation modulates DSS-induced chronic colitis in mice. J. Nutr. Biochem. 2013, 24, 1401–1413. [Google Scholar] [CrossRef] [PubMed]
  31. Silva, S.; Sepodes, B.; Rocha, J.; Direito, R.; Fernandes, A.; Brites, D.; Freitas, M.; Fernandes, E.; Bronze, M.R.; Figueira, M.E. Protective effects of hydroxytyrosol-supplemented refined olive oil in animal models of acute inflammation and rheumatoid arthritis. J. Nutr. Biochem. 2015, 26, 360–368. [Google Scholar] [CrossRef] [PubMed]
  32. Lockyer, S.; Corona, G.; Yaqoob, P.; Spencer, J.P.E.; Rowland, I. Secoiridoids delivered as olive leaf extract induce acute improvements in human vascular function and reduction of an inflammatory cytokine: A randomised, double-blind, placebo-controlled, cross-over trial. Br. J. Nutr. 2015, 1–9. [Google Scholar] [CrossRef] [PubMed]
  33. Waugh, D.J.J.; Wilson, C. The interleukin-8 pathway in cancer. Clin. Cancer Res. 2008, 14, 6735–6741. [Google Scholar] [CrossRef] [PubMed]
  34. Kang, H.-B.; Kim, Y.-E.; Kwon, H.-J.; Sok, D.-E.; Lee, Y. Enhancement of NF-κB expression and activity upon differentiation of human embryonic stem cell line SNUhES3. Stem Cells Dev. 2007, 16, 615–623. [Google Scholar] [CrossRef] [PubMed]
  35. Schmid, D.I.; Schwertz, H.; Jiang, H.; Campbell, R.A.; Weyrich, A.S.; McIntyre, T.M.; Zimmerman, G.A.; Kraiss, L.W. Translational control of JunB, an AP-1 transcription factor, in activated human endothelial cells. J. Cell. Biochem. 2013, 114, 1519–1528. [Google Scholar] [CrossRef] [PubMed]
  36. Gomard, T.; Michaud, H.-A.; Tempé, D.; Thiolon, K.; Pelegrin, M.; Piechaczyk, M. An NF-kappaB-dependent role for JunB in the induction of proinflammatory cytokines in LPS-activated bone marrow-derived dendritic cells. PLoS ONE 2010, 5, e9585. [Google Scholar] [CrossRef] [PubMed]
  37. Miyata, K.; Yotsumoto, F.; Nam, S.O.; Kuroki, M.; Miyamoto, S. Regulatory mechanisms of the HB-EGF autocrine loop in inflammation, homeostasis, development and cancer. Anticancer Res. 2012, 32, 2347–2352. [Google Scholar] [PubMed]
  38. Yotsumoto, F.; Yagi, H.; Suzuki, S.O.; Oki, E.; Tsujioka, H.; Hachisuga, T.; Sonoda, K.; Kawarabayashi, T.; Mekada, E.; Miyamoto, S. Validation of HB-EGF and amphiregulin as targets for human cancer therapy. Biochem. Biophys. Res. Commun. 2008, 365, 555–561. [Google Scholar] [CrossRef] [PubMed]
  39. Pan, Z.; Wang, Z.; Yang, H.; Zhang, F.; Reinach, P.S. TRPV1 activation is required for hypertonicity-stimulated inflammatory cytokine release in human corneal epithelial cells. Investig. Ophthalmol. Vis. Sci. 2011, 52, 485–493. [Google Scholar] [CrossRef] [PubMed]
  40. Tawara, K.; Bolin, C.; Koncinsky, J.; Jorcyk, C.L. Abstract 2276: Oncostatin M promotes breast cancer metastasis to lung by affecting initial stages of metastasis. Cancer Res. 2015. [Google Scholar] [CrossRef]
  41. Covert, H.; Mellor, L. Abstract 5198: Contribution of inflammatory cytokines to CD44-mediated breast cancer metastatic potential. Cancer Res. 2015. [Google Scholar] [CrossRef]
  42. Zhu, M.; Che, Q.; Liao, Y.; Wang, H.; Wang, J.; Chen, Z.; Wang, F.; Dai, C.; Wan, X. Oncostatin M Activates STAT3 to Promote Endometrial Cancer Invasion and Angiogenesis. Oncol. Rep. 2015, 34, 129–138. Available online: http://www.spandidos-publications.com/or/34/1/129/abstract (accessed on 19 January 2016). [Google Scholar] [CrossRef] [PubMed]
  43. Pöling, J.; Gajawada, P.; Richter, M.; Lörchner, H.; Polyakova, V.; Kostin, S.; Shin, J.; Boettger, T.; Walther, T.; Rees, W.; et al. Therapeutic targeting of the oncostatin M receptor-β prevents inflammatory heart failure. Basic Res. Cardiol. 2014. [Google Scholar] [CrossRef] [PubMed]
  44. Pahl, H.L. Activators and target genes of Rel/NF-kappaB transcription factors. Oncogene 1999, 18, 6853–6866. [Google Scholar] [CrossRef] [PubMed]
  45. Ghosh, S.; May, M.J.; Kopp, E.B. NF-kappa B and Rel proteins: Evolutionarily conserved mediators of immune responses. Annu. Rev. Immunol. 1998, 16, 225–260. [Google Scholar] [CrossRef] [PubMed]
  46. Israël, A. The IKK complex, a central regulator of NF-κB activation. Cold Spring Harb. Perspect. Biol. 2010, 2, a000158. [Google Scholar] [CrossRef] [PubMed]
  47. Hayden, M.S.; Ghosh, S. Signaling to NF-κB. Genes Dev. 2004, 18, 2195–2224. [Google Scholar] [CrossRef] [PubMed]
  48. Chen, D.; Li, Z.; Yang, Q.; Zhang, J.; Zhai, Z.; Shu, H.-B. Identification of a nuclear protein that promotes NF-κB activation. Biochem. Biophys. Res. Commun. 2003, 310, 720–724. [Google Scholar] [CrossRef] [PubMed]
  49. Rhee, S.G. Regulation of phosphoinositide-specific phospholipase C. Annu. Rev. Biochem. 2001, 70, 281–312. [Google Scholar] [CrossRef] [PubMed]
  50. Follo, M.Y.; Manzoli, L.; Poli, A.; McCubrey, J.A.; Cocco, L. PLC and PI3K/Akt/mTOR signalling in disease and cancer. Adv. Biol. Regul. 2015, 57, 10–16. [Google Scholar] [CrossRef] [PubMed]
  51. Murakami, M.; Kudo, I. Phospholipase A2. J. Biochem. 2002, 131, 285–292. Available online: http://www.ncbi.nlm.nih.gov/pubmed/11872155 (accessed on 29 February 2016). [Google Scholar] [CrossRef] [PubMed]
  52. Niu, L.; He, X.-H.; Wang, Q.-W.; Fu, M.-Y.; Xu, F.; Xue, Y.; Wang, Z.-Z.; An, X.-J. Polyphenols in Regulation of Redox Signaling and Inflammation During Cardiovascular Diseases. Cell Biochem. Biophys. 2015. [Google Scholar] [CrossRef] [PubMed]
  53. Liu, B.; Qu, L.; Yan, S. Cyclooxygenase-2 promotes tumor growth and suppresses tumor immunity. Cancer Cell Int. 2015, 15, 106. [Google Scholar] [CrossRef] [PubMed]
  54. Zhang, M.-S.; Zhang, K.-J.; Zhang, J.; Jiao, X.-L.; Chen, D.; Zhang, D.-L. Phospholipases A-II (PLA2-II) Induces Acute Pancreatitis through Activation of the Transcription Factor NF-κB. Eur. Rev. Med. Pharmacol. Sci. 2014, 18, 1163–1169. [Google Scholar] [PubMed]
  55. Bonnefont-Rousselot, D. Lp-PLA2, a biomarker of vascular inflammation and vulnerability of atherosclerosis plaques. Ann. Pharm. Fr. 2015. [Google Scholar] [CrossRef]
  56. Masoodi, M.; Kuda, O.; Rossmeisl, M.; Flachs, P.; Kopecky, J. Lipid signaling in adipose tissue: Connecting inflammation & metabolism. Biochim. Biophys. Acta 2015, 1851, 503–518. [Google Scholar] [PubMed]
  57. Yang, X.; Lu, X.; Lombès, M.; Rha, G.B.; Chi, Y.-I.; Guerin, T.M.; Smart, E.J.; Liu, J. The G(0)/G(1) switch gene 2 regulates adipose lipolysis through association with adipose triglyceride lipase. Cell Metab. 2010, 11, 194–205. [Google Scholar] [CrossRef] [PubMed]
  58. Ma, T.; Lopez-Aguiar, A.G.N.; Li, A.; Lu, Y.; Sekula, D.; Nattie, E.E.; Freemantle, S.; Dmitrovsky, E. Mice lacking G0S2 are lean and cold-tolerant. Cancer Biol. Ther. 2014, 15, 643–650. [Google Scholar] [CrossRef] [PubMed]
  59. Zhang, X.; Xie, X.; Heckmann, B.L.; Saarinen, A.M.; Czyzyk, T.A.; Liu, J. Targeted disruption of G0/G1 switch gene 2 enhances adipose lipolysis, alters hepatic energy balance, and alleviates high-fat diet-induced liver steatosis. Diabetes 2014, 63, 934–946. [Google Scholar] [CrossRef] [PubMed]
  60. El-Assaad, W.; El-Kouhen, K.; Mohammad, A.H.; Yang, J.; Morita, M.; Gamache, I.; Mamer, O.; Avizonis, D.; Hermance, N.; Kersten, S.; et al. Deletion of the gene encoding G0/G1 switch protein 2 (G0s2) alleviates high-fat-diet-induced weight gain and insulin resistance, and promotes browning of white adipose tissue in mice. Diabetologia 2014, 58, 149–157. [Google Scholar] [CrossRef] [PubMed]
  61. Pasche, B.; Wang, M.; Pennison, M.; Jimenez, H. Prevention and treatment of cancer with aspirin: Where do we stand? Semin. Oncol. 2014, 41, 397–401. [Google Scholar] [CrossRef] [PubMed]
  62. Bosetti, C.; Rosato, V.; Gallus, S.; Cuzick, J.; La Vecchia, C. Aspirin and cancer risk: A quantitative review to 2011. Ann. Oncol. 2012, 23, 1403–1415. [Google Scholar] [CrossRef] [PubMed]
  63. Rothwell, P.M.; Fowkes, F.G.R.; Belch, J.F.F.; Ogawa, H.; Warlow, C.P.; Meade, T.W. Effect of daily aspirin on long-term risk of death due to cancer: Analysis of individual patient data from randomised trials. Lancet 2011, 377, 31–41. [Google Scholar] [CrossRef]
  64. Gupta, R.A.; Dubois, R.N. Colorectal cancer prevention and treatment by inhibition of cyclooxygenase-2. Nat. Rev. Cancer 2001, 1, 11–21. [Google Scholar] [CrossRef] [PubMed]
  65. González-Correa, J.A.; Navas, M.D.; Muñoz-Marín, J.; Trujillo, M.; Fernández-Bolaños, J.; de la Cruz, J.P. Effects of hydroxytyrosol and hydroxytyrosol acetate administration to rats on platelet function compared to acetylsalicylic acid. J. Agric. Food Chem. 2008, 56, 7872–7876. [Google Scholar] [CrossRef] [PubMed]
  66. Tian, X.Y.; Wong, W.T.; Leung, F.P.; Zhang, Y.; Wang, Y.-X.; Lee, H.K.; Ng, C.F.; Chen, Z.Y.; Yao, X.; Au, C.L.; et al. Oxidative stress-dependent cyclooxygenase-2-derived prostaglandin f(2α) impairs endothelial function in renovascular hypertensive rats. Antioxid. Redox Signal. 2012, 16, 363–373. [Google Scholar] [CrossRef] [PubMed] [Green Version]
  67. Martín-Peláez, S.; Castañer, O.; Konstantinidou, V.; Subirana, I.; Muñoz-Aguayo, D.; Blanchart, G.; Gaixas, S.; de la Torre, R.; Farré, M.; Sáez, G.T.; et al. Effect of olive oil phenolic compounds on the expression of blood pressure-related genes in healthy individuals. Eur. J. Nutr. 2015. [Google Scholar] [CrossRef] [PubMed]
  68. Khymenets, O.; Fitó, M.; Covas, M.-I.; Farré, M.; Pujadas, M.-A.; Muñoz, D.; Konstantinidou, V.; de la Torre, R. Mononuclear cell transcriptome response after sustained virgin olive oil consumption in humans: An exploratory nutrigenomics study. OMICS 2009, 13, 7–19. [Google Scholar] [CrossRef] [PubMed]
  69. Farràs, M.; Valls, R.M.; Fernández-Castillejo, S.; Giralt, M.; Solà, R.; Subirana, I.; Motilva, M.-J.; Konstantinidou, V.; Covas, M.-I.; Fitó, M. Olive oil polyphenols enhance the expression of cholesterol efflux related genes in vivo in humans. A randomized controlled trial. J. Nutr. Biochem. 2013, 24, 1334–1339. [Google Scholar] [CrossRef] [PubMed]
  70. Tall, A.R.; Yvan-Charvet, L. Cholesterol, inflammation and innate immunity. Nat. Rev. Immunol. 2015, 15, 104–116. [Google Scholar] [CrossRef] [PubMed]
  71. Agard, M.; Asakrah, S.; Morici, L.A. PGE(2) suppression of innate immunity during mucosal bacterial infection. Front. Cell. Infect. Microbiol. 2013, 3, 45. [Google Scholar] [CrossRef] [PubMed]
  72. Lee, S.M.Y.; Gai, W.W.; Cheung, T.K.W.; Peiris, J.S.M. Antiviral effect of a selective COX-2 inhibitor on H5N1 infection in vitro. Antivir. Res. 2011, 91, 330–334. [Google Scholar] [CrossRef] [PubMed]
  73. Ito, Y.; Correll, K.; Zemans, R.L.; Leslie, C.C.; Murphy, R.C.; Mason, R.J. Influenza induces IL-8 and GM-CSF secretion by human alveolar epithelial cells through HGF/c-Met and TGF-α/EGFR signaling. Am. J. Physiol. Lung Cell. Mol. Physiol. 2015, 308, L1178–L1188. [Google Scholar] [CrossRef] [PubMed]
  74. Vitaglione, P.; Savarese, M.; Paduano, A.; Scalfi, L.; Fogliano, V.; Sacchi, R. Healthy virgin olive oil: A matter of bitterness. Crit. Rev. Food Sci. Nutr. 2015, 55, 1808–1818. [Google Scholar] [CrossRef] [PubMed]
  75. Kirkland, D.; Edwards, J.; Woehrle, T.; Beilstein, P. Investigations into the genotoxic potential of olive extracts. Mutat. Res. Genet. Toxicol. Environ. Mutagen. 2015, 777, 17–28. [Google Scholar] [CrossRef] [PubMed]
  76. Camargo, A.; Ruano, J.; Fernandez, J.M.; Parnell, L.D.; Jimenez, A.; Santos-Gonzalez, M.; Marin, C.; Perez-Martinez, P.; Uceda, M.; Lopez-Miranda, J.; et al. Gene expression changes in mononuclear cells in patients with metabolic syndrome after acute intake of phenol-rich virgin olive oil. BMC Genom. 2010, 11, 253. [Google Scholar] [CrossRef] [PubMed] [Green Version]
  77. Ritchie, M.E.; Phipson, B.; Wu, D.; Hu, Y.; Law, C.W.; Shi, W.; Smyth, G.K. Limma powers differential expression analyses for RNA-sequencing and microarray studies. Nucleic Acids Res. 2015. [Google Scholar] [CrossRef] [PubMed]
  78. Edgar, R.; Domrachev, M.; Lash, A.E. Gene Expression Omnibus: NCBI gene expression and hybridization array data repository. Nucleic Acids Res. 2002, 30, 207–210. [Google Scholar] [CrossRef] [PubMed]
  79. Gautier, L.; Cope, L.; Bolstad, B.M.; Irizarry, R.A. affy–Analysis of Affymetrix GeneChip data at the probe level. Bioinformatics 2004, 20, 307–315. [Google Scholar] [CrossRef] [PubMed]
  80. R Development Core Team. R: A Language and Environment for Statistical Computing. Found. Stat. Comput. 2013. Available online: http://www.r-project.org/ (accessed on 12 July 2016). [Google Scholar]
  81. Wakefield, J. Bayes factors for genome-wide association studies: Comparison with p-values. Genet. Epidemiol. 2009, 33, 79–86. [Google Scholar] [CrossRef] [PubMed]
  82. Krämer, A.; Green, J.; Pollard, J.; Tugendreich, S. Causal analysis approaches in Ingenuity Pathway Analysis. Bioinformatics 2014, 30, 523–530. [Google Scholar] [CrossRef] [PubMed]
  83. Kozera, B.; Rapacz, M. Reference genes in real-time PCR. J. Appl. Genet. 2013, 54, 391–406. [Google Scholar] [CrossRef] [PubMed]
  84. Nicot, N.; Hausman, J.-F.; Hoffmann, L.; Evers, D. Housekeeping gene selection for real-time RT-PCR normalization in potato during biotic and abiotic stress. J. Exp. Bot. 2005, 56, 2907–2914. [Google Scholar] [CrossRef] [PubMed]
Figure 1. Gene classification pie charts created in PANTHER (Protein ANalysis THrough Evolutionary Relationships). (a) pathways; and (b) biological process associated with the >1.4-fold change (FC) gene expression change in response to olive leaf extract (OLE) consumption. The key names the pathways (starting from the top and moving clockwise) that have been regulated with OLE relative to placebo (PBO).
Ijms 17 02019 g001
Figure 2. Canonical pathways affected after OLE supplementation under the criteria p < 0.05.
Ijms 17 02019 g002
Figure 3. Macrophage migration inhibitory factor (MIF) regulation of innate immunity canonical pathway. Cytokine production is circled in green because there are several related cytokines, including IL-8 (−2.4 FC) and oncostatin M (OSM) (−1.43 FC), which were downregulated with OLE consumption. JNK has been circled because of its relevance to JUNB regulation (downregulated in this study with −1.3 FC), which has recently been revealed to play a similar role in activating AP1 and inflammation [22].
Ijms 17 02019 g003
Figure 4. A schematic diagram of the extracellular signal–regulated kinase 1/2(ERK1/2) pathway.
Ijms 17 02019 g004
Table 1. Fold change (FC) in gene expression after olive leaf extract (OLE) supplementation relative to placebo (PBO) with p-values.
Gene SymbolGene NameFCp-Value
G0S2G0/G1 switch 2−3.1219.65 × 10−3
EGR1early growth response 1−2.541.81 × 10−2
CXCL8 (IL-8)chemokine (C-X-C motif) ligand 8−2.3973.93 × 10−2
COX-2 (PTGS2)prostaglandin-endoperoxide synthase 2−2.2417.49 × 10−3
EGR2early growth response 2−1.9782.77 × 10−2
KLF3Kruppel-like factor 3 (basic)−1.8581.08 × 10−2
HBEGFheparin-binding EGF (epidermal growth factor) -like growth factor−1.7861.30 × 10−4
NR4A2nuclear receptor subfamily 4, group A, member 2−1.6253.29 × 10−2
NDC80NDC80 kinetochore complex component−1.5993.48 × 10−4
MXD1MAX (myc-associated factor X) dimerization protein 1−1.5433.36 × 10−2
NCAPGnon-SMC (Structural Maintenance of Chromosomes) condensin I complex, subunit G−1.5262.67 × 10−2
OSMoncostatin M−1.4282.98 × 10−2
NAP1L3nucleosome assembly protein 1-like 31.4638.88 × 10−3
MIER3mesoderm induction early response 1, family member 31.476.14 × 10−4
ID3inhibitor of DNA binding 3, dominant negative helix-loop-helix protein1.4839.27× 10−3
Table 2. Real-time PCR confirmation of the gene expression measured by Affymetrix arrays. Differential expression of EGR1, COX-2 and ID3 following the eight-week supplementation with OLE relative to PBO. Two housekeeping genes were combined (GAPDH and β-actin) for reference. FC is relative to PBO.
Gene Expression FC
EGR1COX-2ID3
Real-time PCR−2.18052−1.732581.801411
Standard deviation0.1415860.1453140.10132
Affymetrix Array−2.54−2.241.48
p-Value1.81 × 10−27.49 × 10−39.27 × 10−3

