Article

Identification of Potential Biomarkers for Rhegmatogenous Retinal Detachment Associated with Choroidal Detachment by Vitreous iTRAQ-Based Proteomic Profiling

1
Eye Hospital, Nanjing Medical University, Nanjing 210000, China
2
Department of Ophthalmology, Wuxi No. 2 People’s Hospital, Nanjing Medical University, Wuxi 214002, China
3
Key Laboratory of Nuclear Medicine, Ministry of Health, Jiangsu Key Laboratory of Molecular Nuclear Medicine, Jiangsu Institute of Nuclear Medicine, Wuxi 214063, China
4
The Fourth School of Clinical Medicine, Nanjing Medical University, Nanjing 210000, China
*
Author to whom correspondence should be addressed.
These authors contributed equally to this work.
Int. J. Mol. Sci. 2016, 17(12), 2052; https://doi.org/10.3390/ijms17122052
Submission received: 19 September 2016 / Revised: 24 November 2016 / Accepted: 30 November 2016 / Published: 7 December 2016
(This article belongs to the Special Issue Retinal Diseases: Bridging Basic and Clinical Research)

Abstract

:
Rhegmatogenous retinal detachment associated with choroidal detachment (RRDCD) is a complicated and serious type of rhegmatogenous retinal detachment (RRD). In this study, we identified differentially expressed proteins in the vitreous humors of RRDCD and RRD using isobaric tags for relative and absolute quantitation (iTRAQ) combined with nano-liquid chromatography-electrospray ion trap-mass spectrometry-mass spectrometry (nano-LC-ESI-MS/MS) and bioinformatic analysis. Our result shows that 103 differentially expressed proteins, including 54 up-regulated and 49 down-regulated proteins were identified in RRDCD. Gene ontology (GO) analysis suggested that most of the differentially expressed proteins were extracellular.The Kyoto encyclopedia of genes and genomes (KEGG) pathway analysis suggested that proteins related to complement and coagulation cascades were significantly enriched. iTRAQ-based proteomic profiling reveals that complement and coagulation cascades and inflammation may play important roles in the pathogenesis of RRDCD. This study may provide novel insights into the pathogenesis of RRDCD and offer potential opportunities for the diagnosis and treatment of RRDCD.

Graphical Abstract

1. Introduction

Rhegmatogenous retinal detachment associated with choroidal detachment (RRDCD) is a complicated and serious type of rhegmatogenous retinal detachment (RRD). Clinical symptoms of RRDCD include severe uveitis, ocular hypotony, deep anterior chamber, concentric folding, and iridophakodonesis [1,2,3]. RRDCD progresses rapidly and has a poor prognosis because it quickly proceeds to severe proliferative vitreoretinopathy (PVR). The reported incidence of RRDCD in primary RRD is 1.5% to 18.1% in China and 2.0% to 4.5% in Western countries [2,4,5]. RRDCD usually occurs in patients with high myopia, pseudophakia, aphakia, and increased age [5,6]. A recent study has shown that retinal detachment associated with macular hole predisposes one to RRDCD [7]. Visual prognosis after pars planavitrectomy, the conventional treatment for RRDCD, is still unfavorable. The high incidence of PVR after surgery may contribute to the low reattachment rate [8]. To date, most studies have mainly focused on clinical problems. However, the etiology and pathogenesis of RRDCD remain elusive. It is generally believed that hypotony is the initial step of RRDCD [5]. Another hypothesis [3] proposes that intraocular inflammation secondary to retinal detachment plays a pivotal role in the development of choroidal detachment. Given the severe uveitis signs of RRDCD, better prognosis obtained through preoperative application of steroids, as well as our previous study showing that inflammation may participate in the process of RRDCD [9,10], we assume that inflammation has a key role in the occurrence and development of RRDCD.
Proteomics is a post-genomic discipline that studies the proteins of a proteome by various techniques. Since biological activity is executed directly by proteins, studying proteomics in disease or different stages of diseases may shed light on etiopathogenesis and deepen our understanding of diseases, and further help develop better treatment strategies for various diseases. Isobaric tags for relative and absolute quantitation (iTRAQ) is a new technique for protein separation consisting of a unique mass reporter, a mass balancer, and an amine-reactive group [11]. Several features of iTRAQ, such as high through-put, wide range of separation, high accuracy, and repeatability, have led to its widespread use in proteomics.
To date, few studies have studied human vitreous samples from RRDCD patients by proteomic profiling. In this study, we investigated protein profiles of vitreous humor and identified protein biomarkers by iTRAQ combined with nano-liquid chromatography-electrospray ion trap-mass spectrometry-mass spectrometry (nano-LC-ESI-MS/MS) in RRDCD. The objective of this study was to discover differentially expressed proteins and analyze biological processes to improve our understanding of the etiopathogenesis and the poor prognosis of RRDCD.

2. Results

2.1. Demographics and Clinical Variables

Table 1 shows the demographic and clinical data of the patients enrolled in the study, including 8 RRDCD and 8 RRD patients. There were no significant differences in sex, age, and duration of detachment in the two groups (p > 0.05). The RRDCD patients had significantly worse PVR compared to the RRD patients (p < 0.001). In addition, the intraocular pressure (IOP) was significantly lower in RRDCD than in RRD patients (p < 0.005).

2.2. Protein Concentration

Protein concentration was 3.31 ± 1.36 µg/µL in the RRDCD group and 2.21 ± 0.35 µg/µL in the RRD group. The results show that protein concentration in RRDCD patients was significantly higher than in RRD patients (p = 0.043).

2.3. Integrated Proteome Information

A total of 2510 unique peptides and 750 proteins were identified by iTRAQ-mass spectrometry. One hundred and three differentially expressed proteins were identified (fold change > 1.2 and p value < 0.05), including 54 up-regulated and 49 down-regulated proteins in the RRDCD group compared to the RRD group (Table A1 and Table A2). The hierarchical clustering heat map of the differentially expressed proteins is shown in Figure 1.

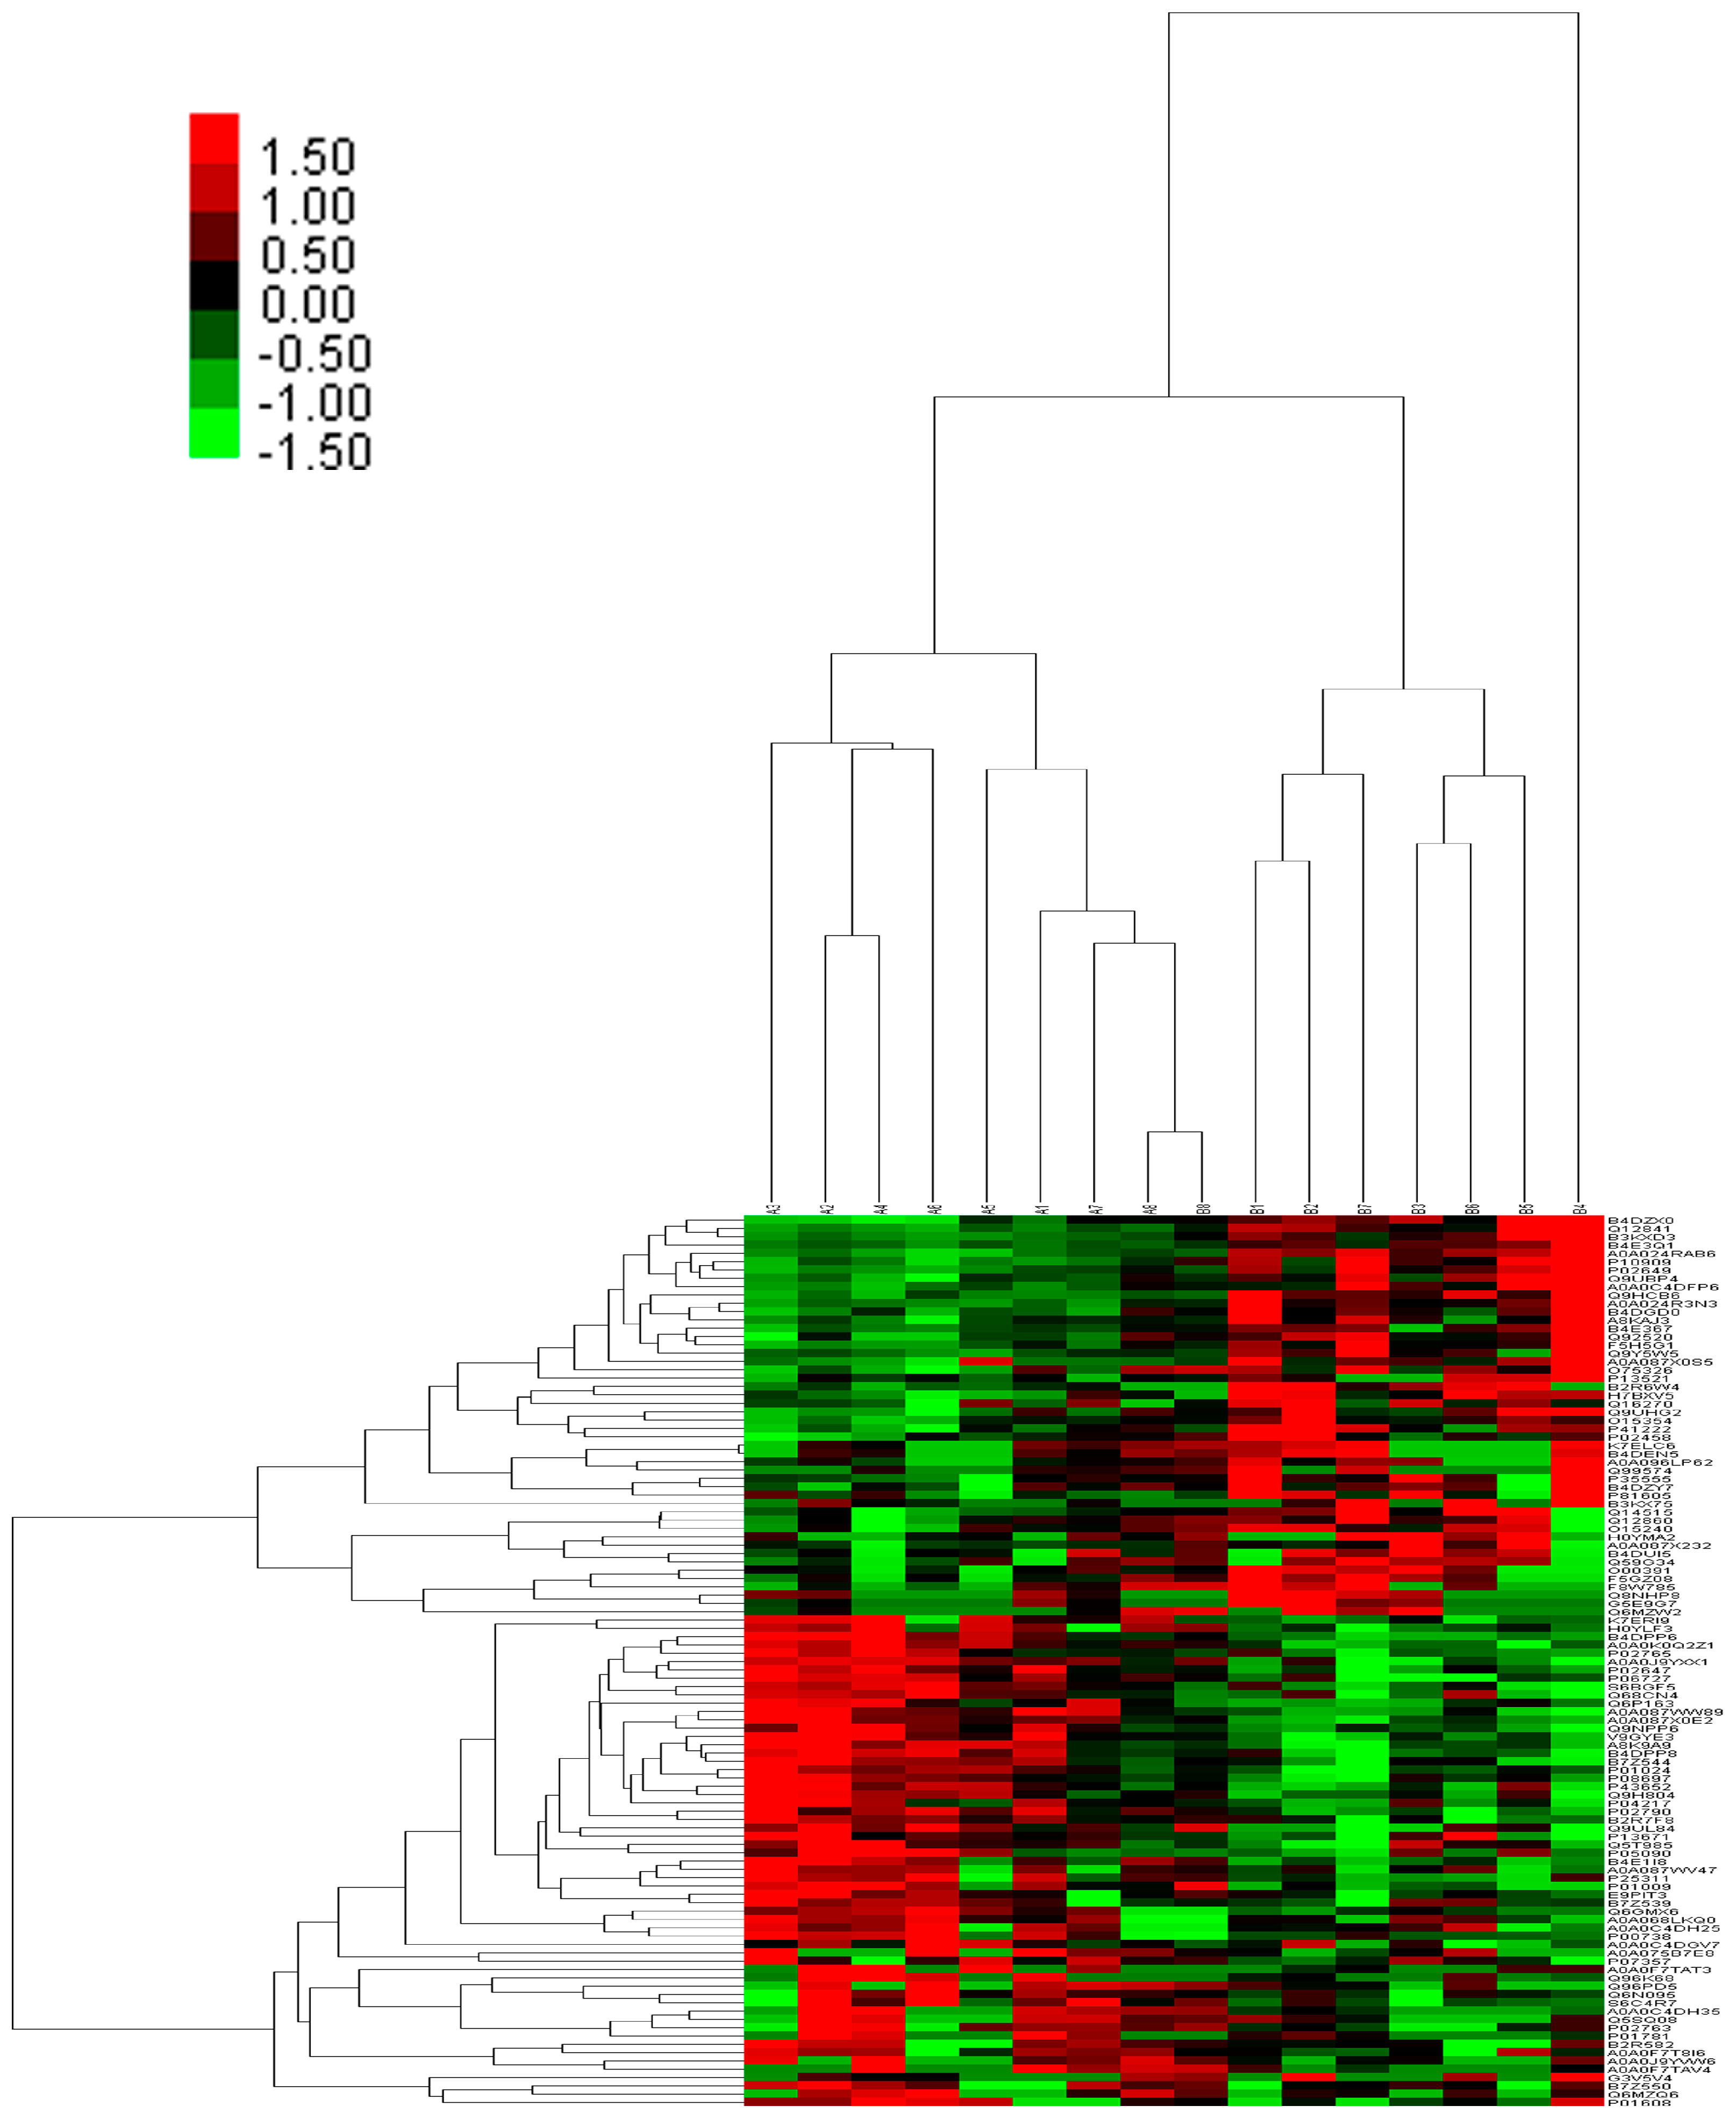
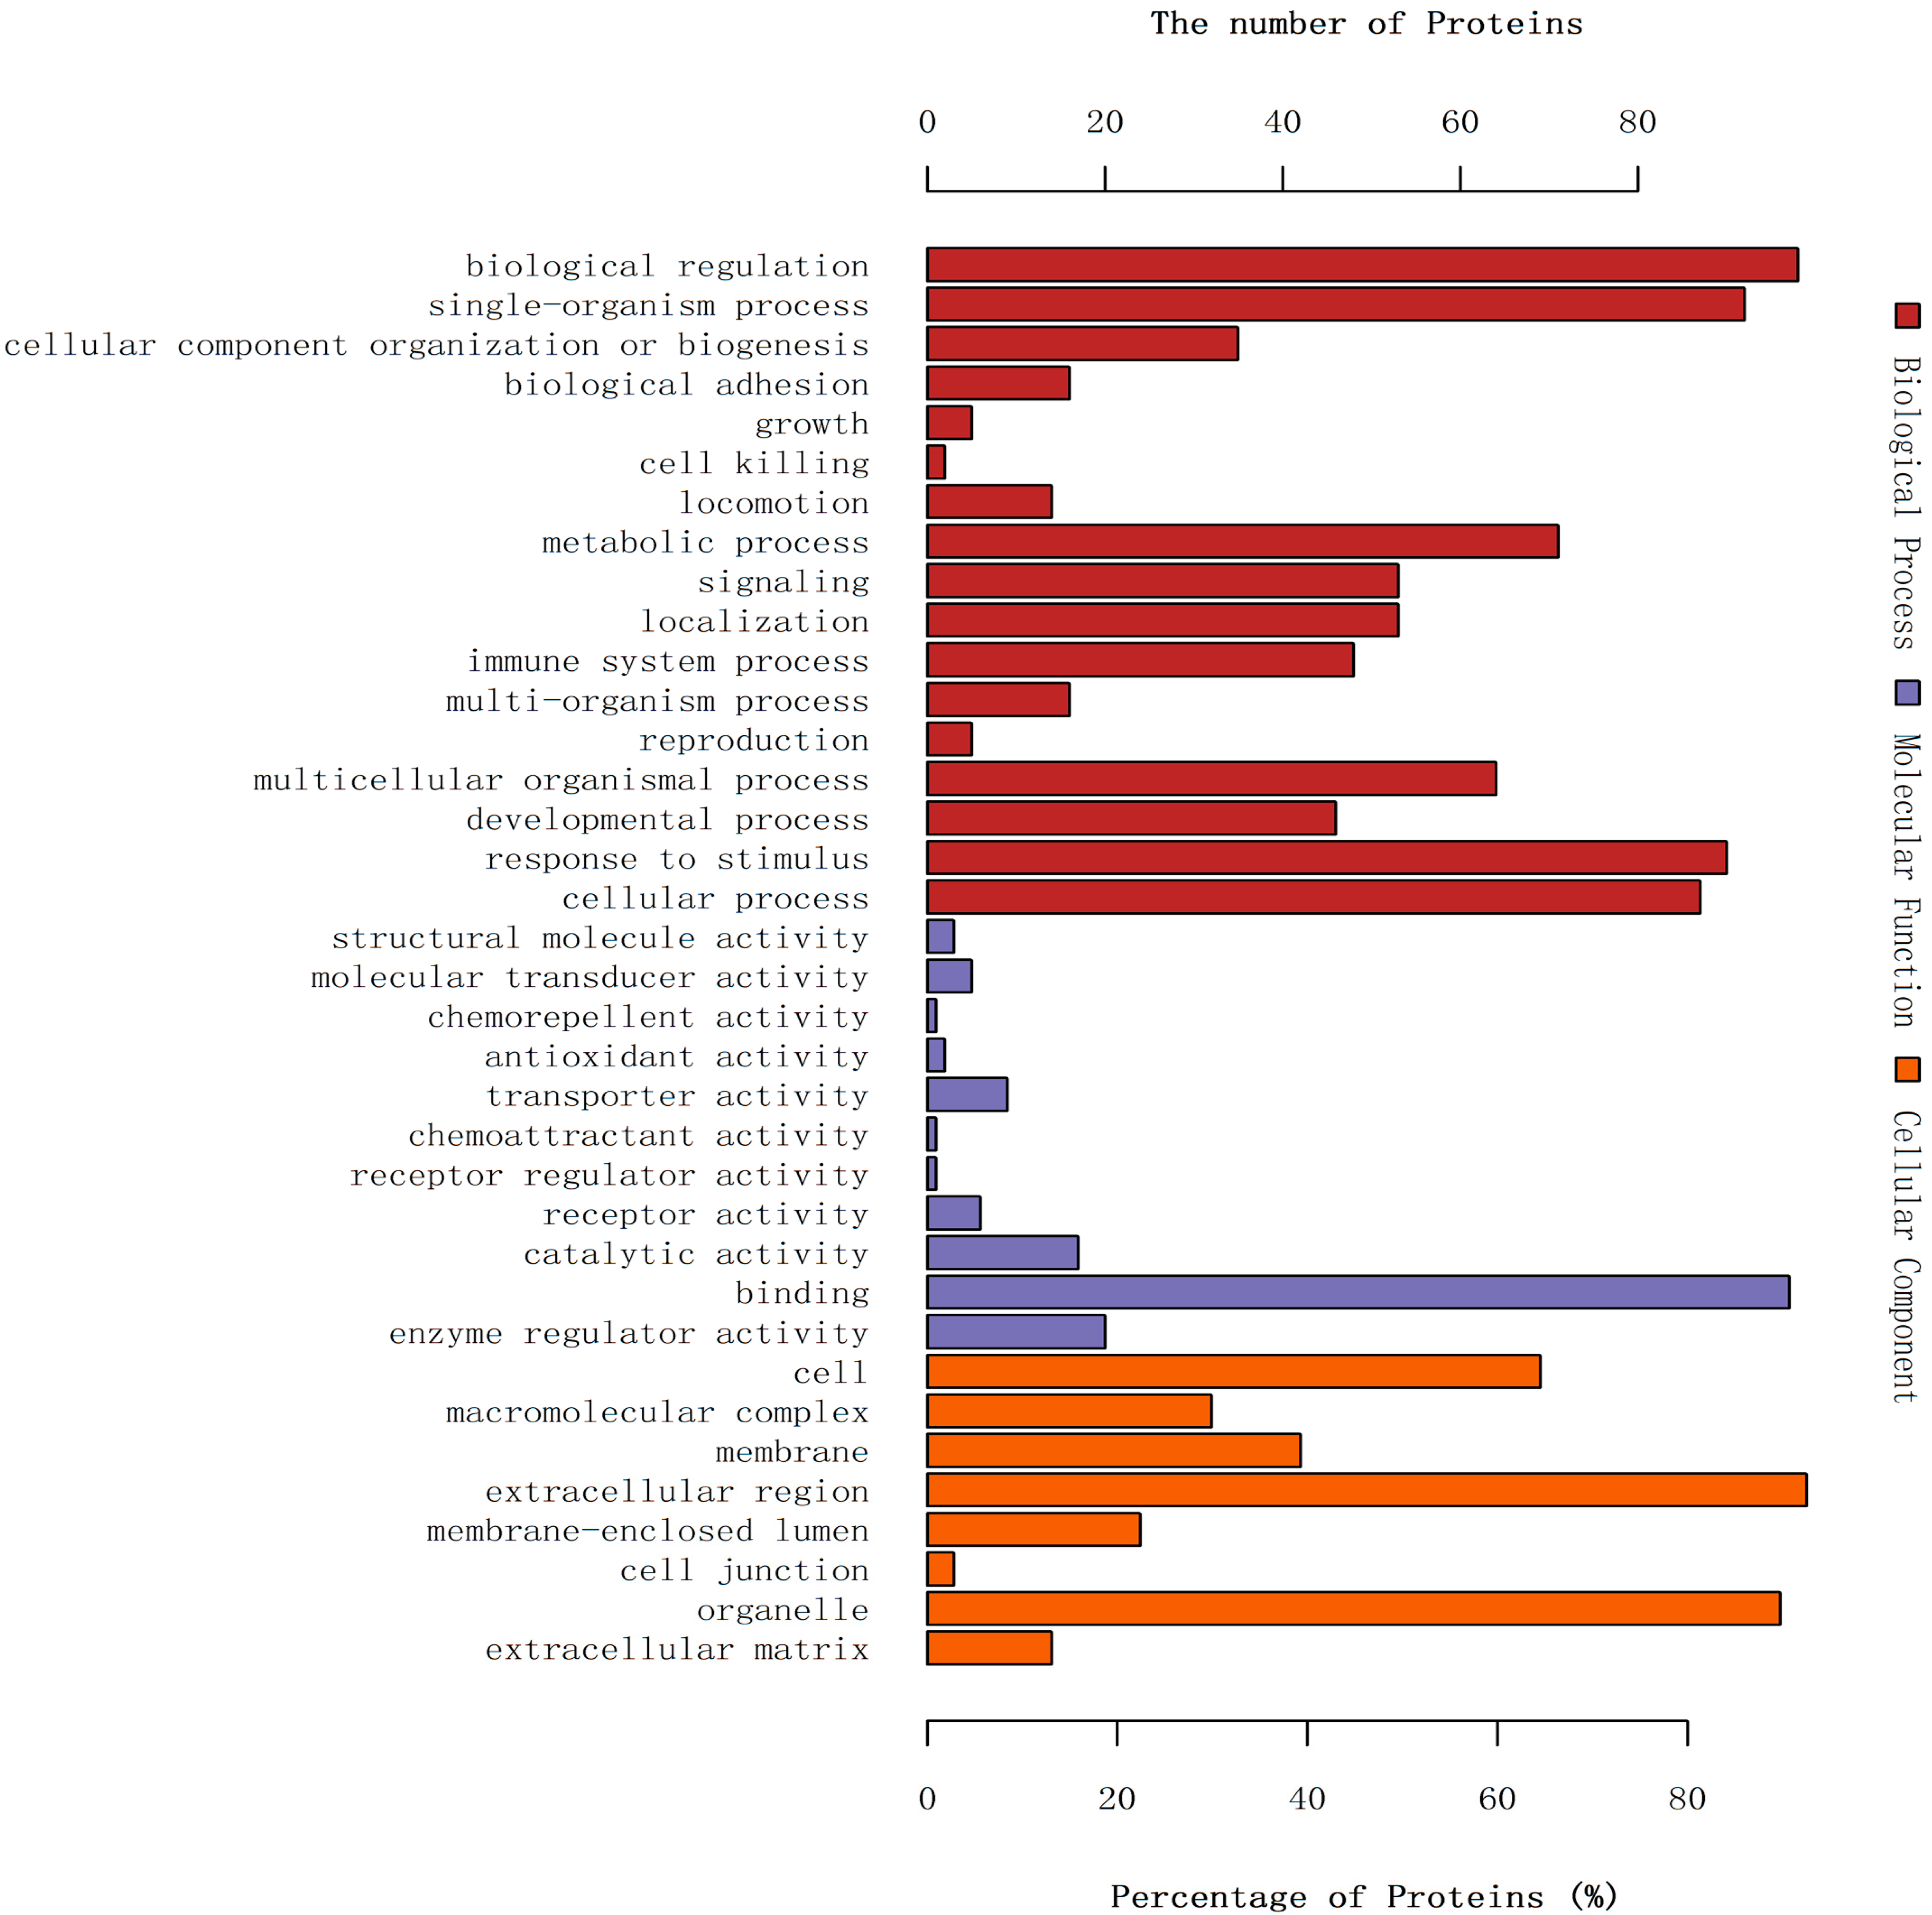
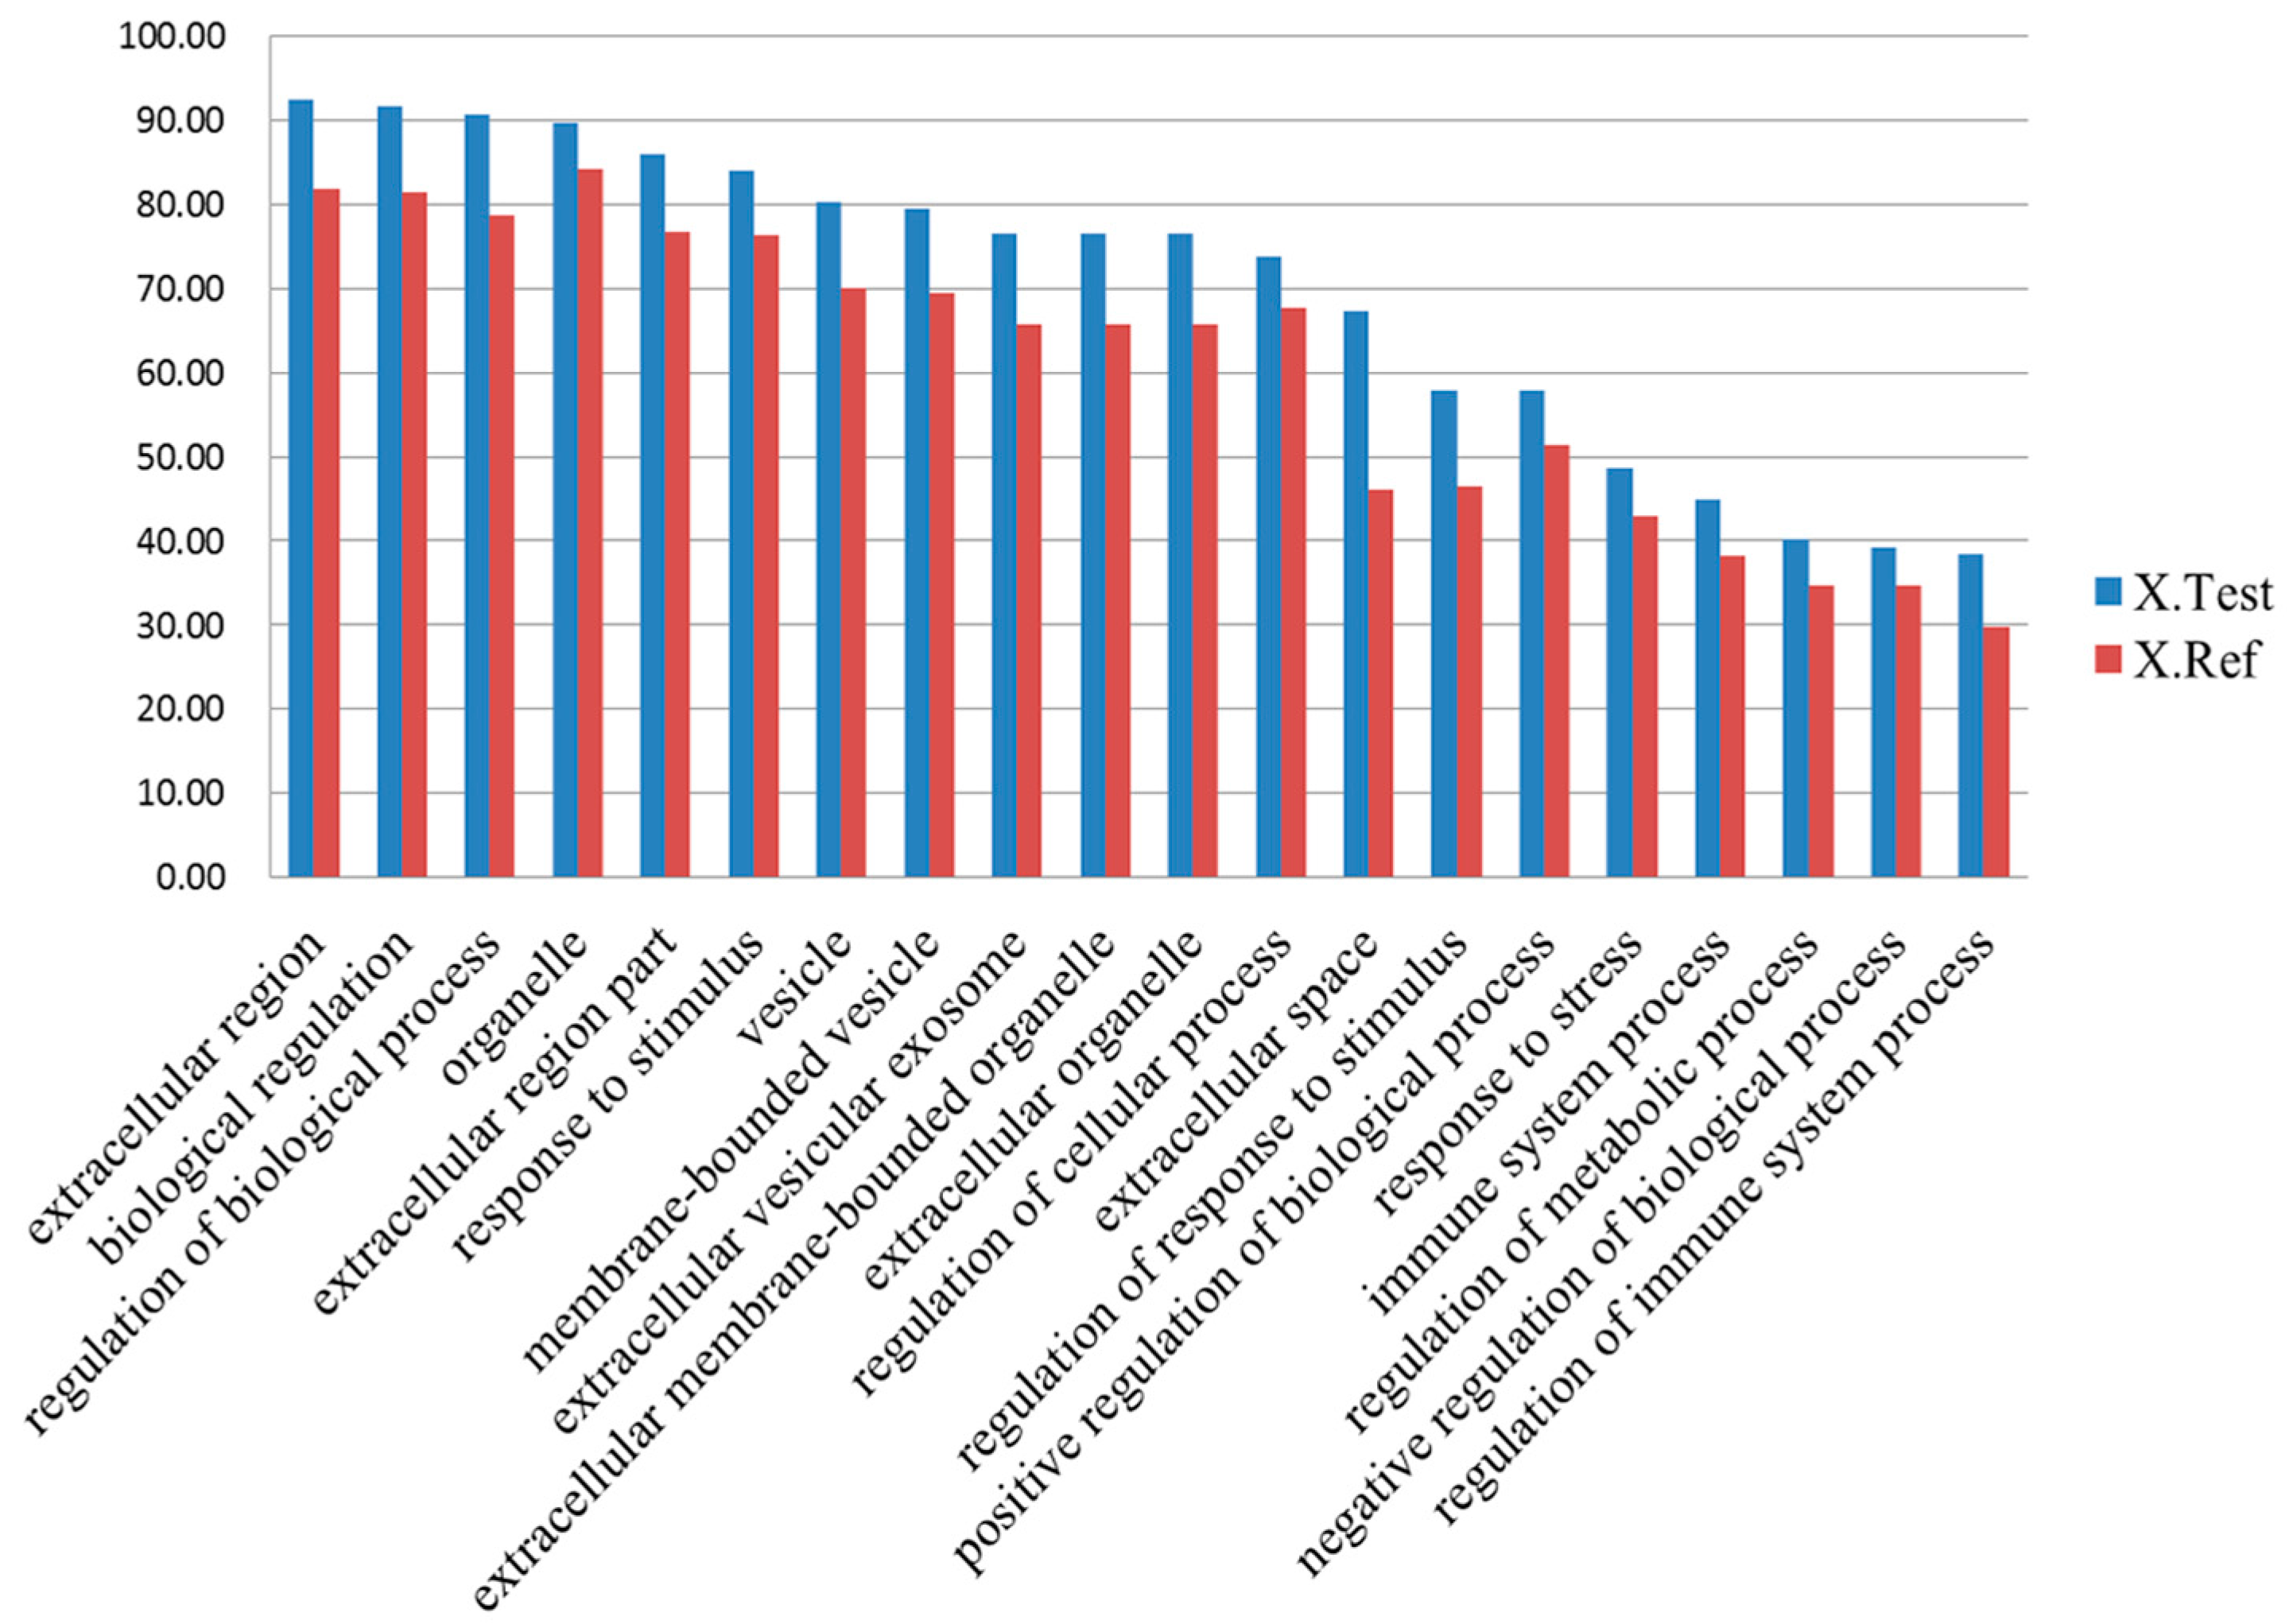
2.4. Gene Ontology Annotation of Differentially Expressed Proteins

Gene ontology (GO) is an international standardized gene function classification system, offering an updated controlled vocabulary to describe the properties of gene and gene products [12]. As shown in Figure 2, when analyzed for biological process (BP) the differentially expressed proteins were primarily involved in biological regulation (98, 12.3%), single-organism process (97, 11.5%), and response to stimulus (90, 11.3%). When analyzed for molecular function (MF) these proteins were mainly involved in binding (97, 59.9%), enzyme regulator activity (20, 12.3%), and catalytic activity (17, 10.5%). When analyzed for cellular component (CC), these proteins were primarily categorized as extracellular space (99, 26.1%), organelle (96, 25.3%) and cell (69, 18.2%).
GO enrichment analysis of the differentially expressed proteins showed that the GO terms of most differentially expressed proteins were enriched in extracellular space (p = 9.29 × 10⁻⁷), followed by biological regulation (p = 0.001) and regulation of biological process (p = 0.0003, Figure 3).

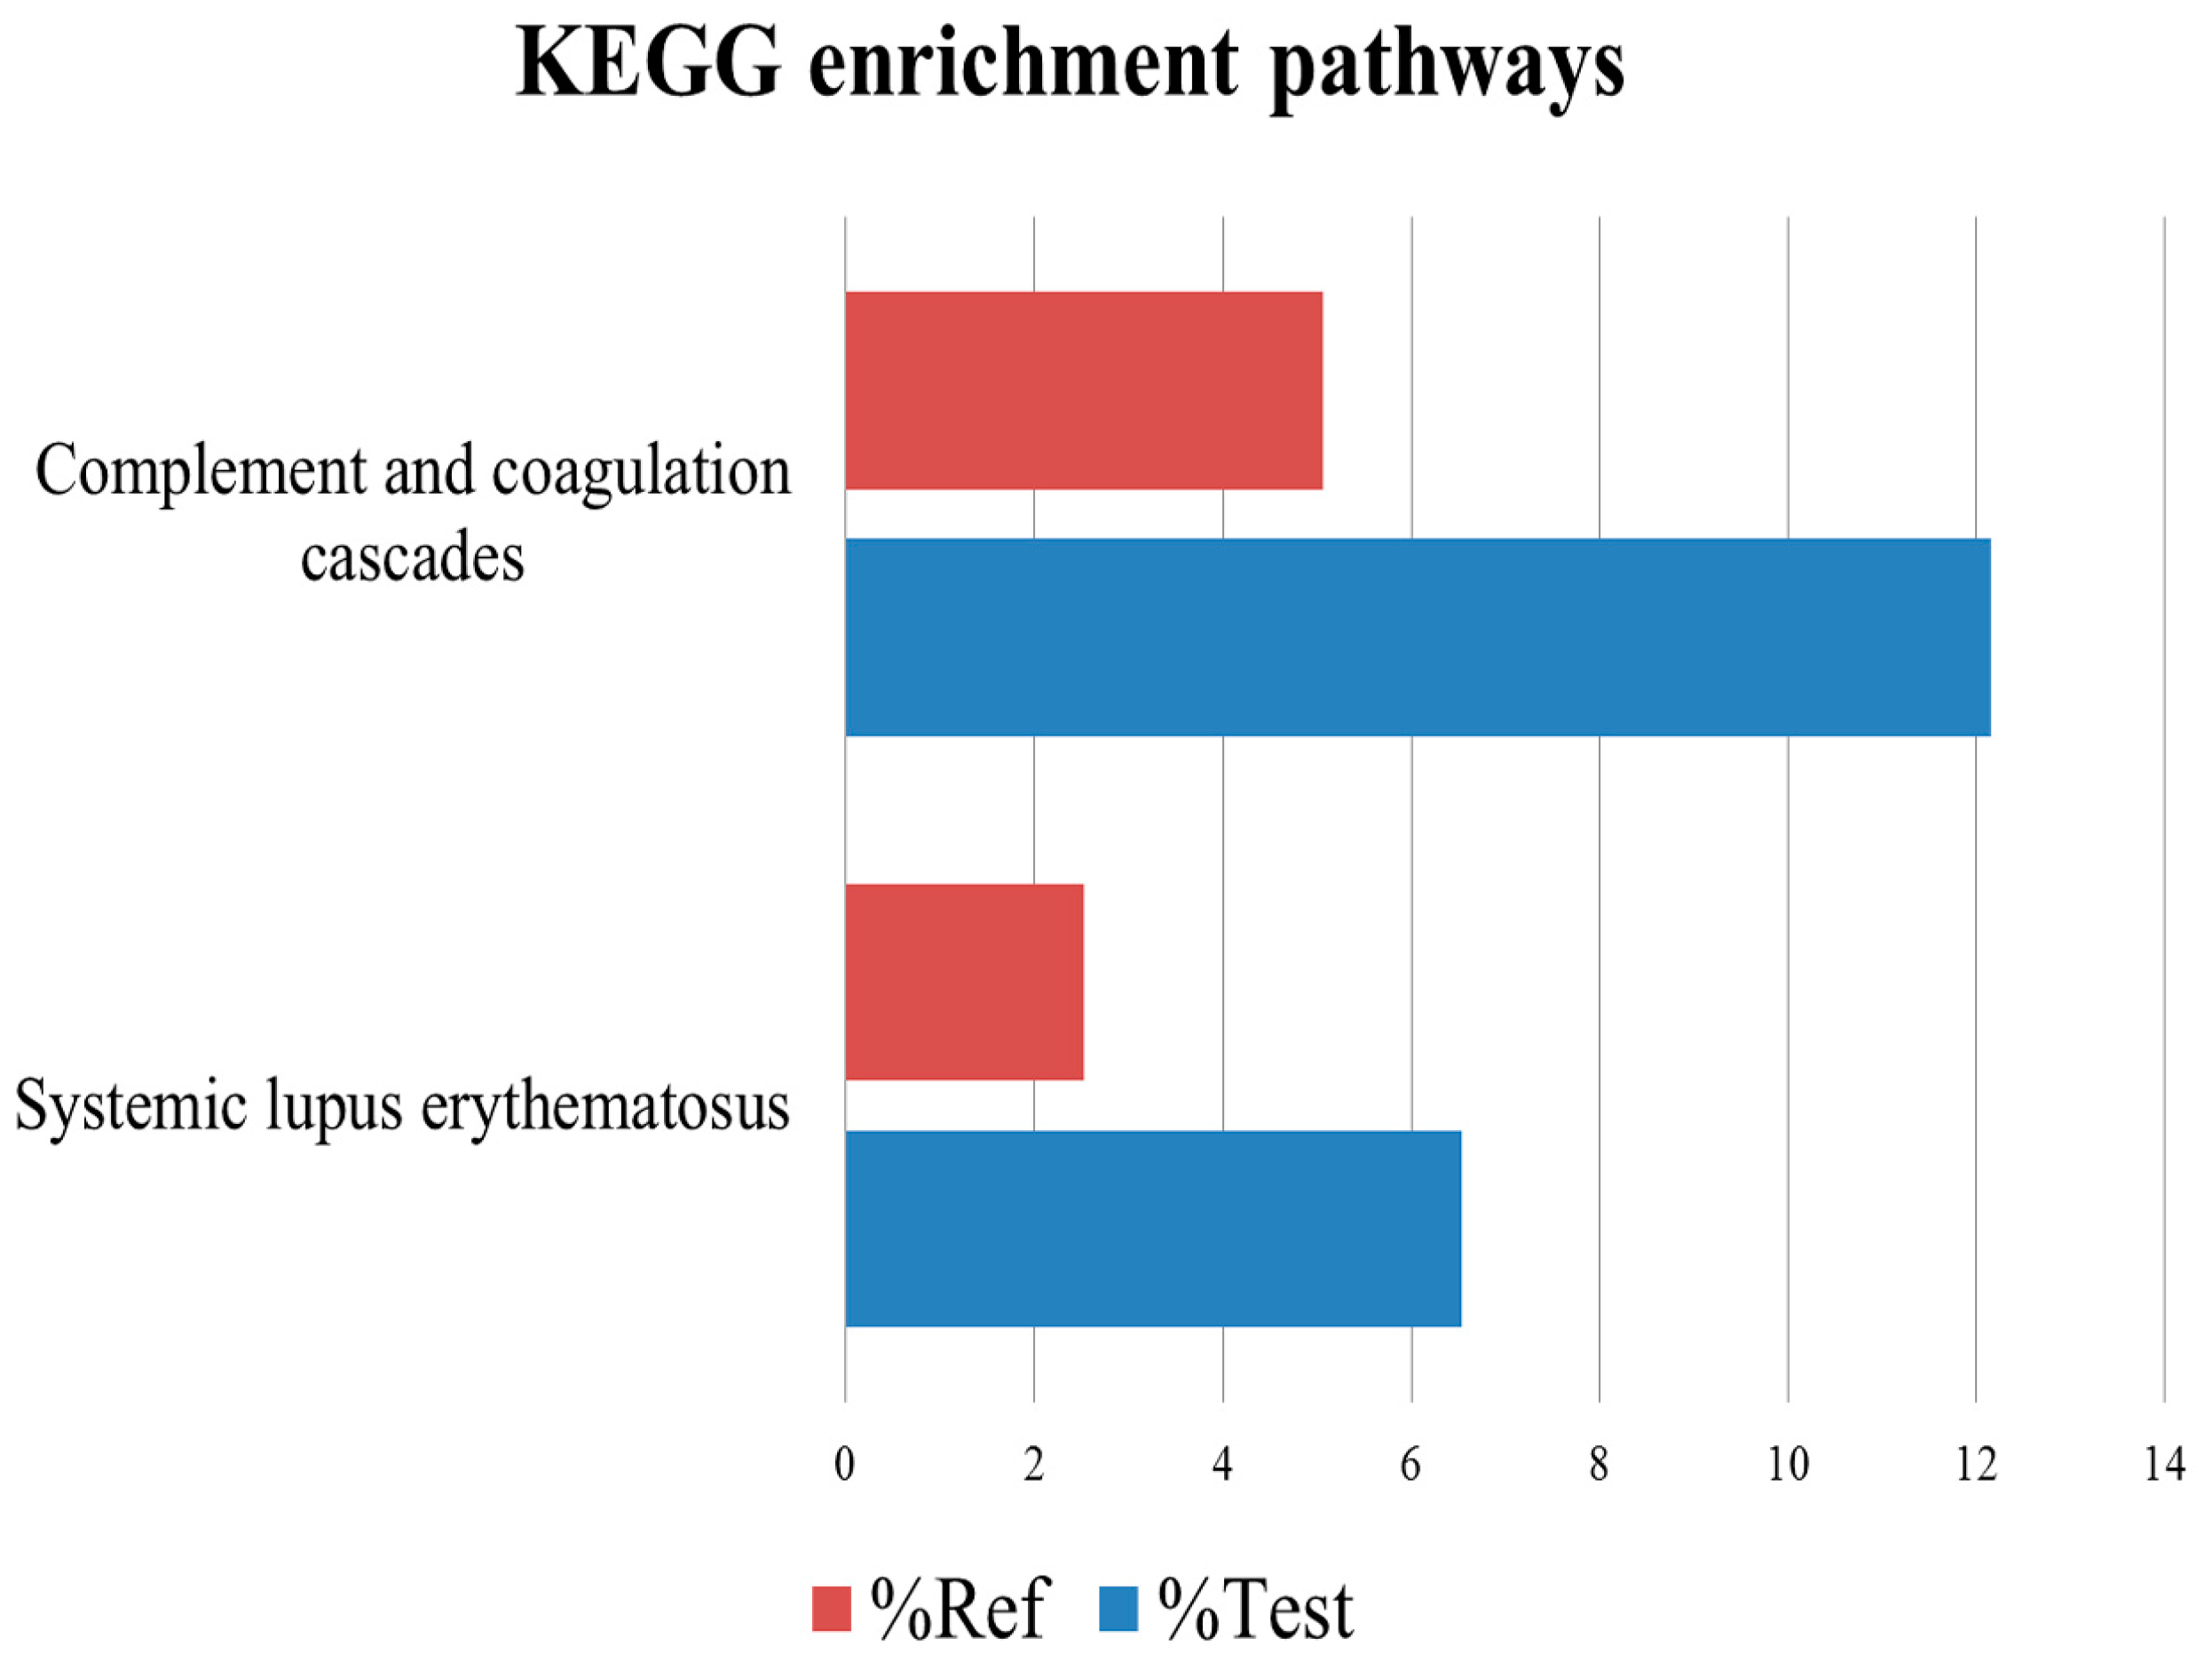
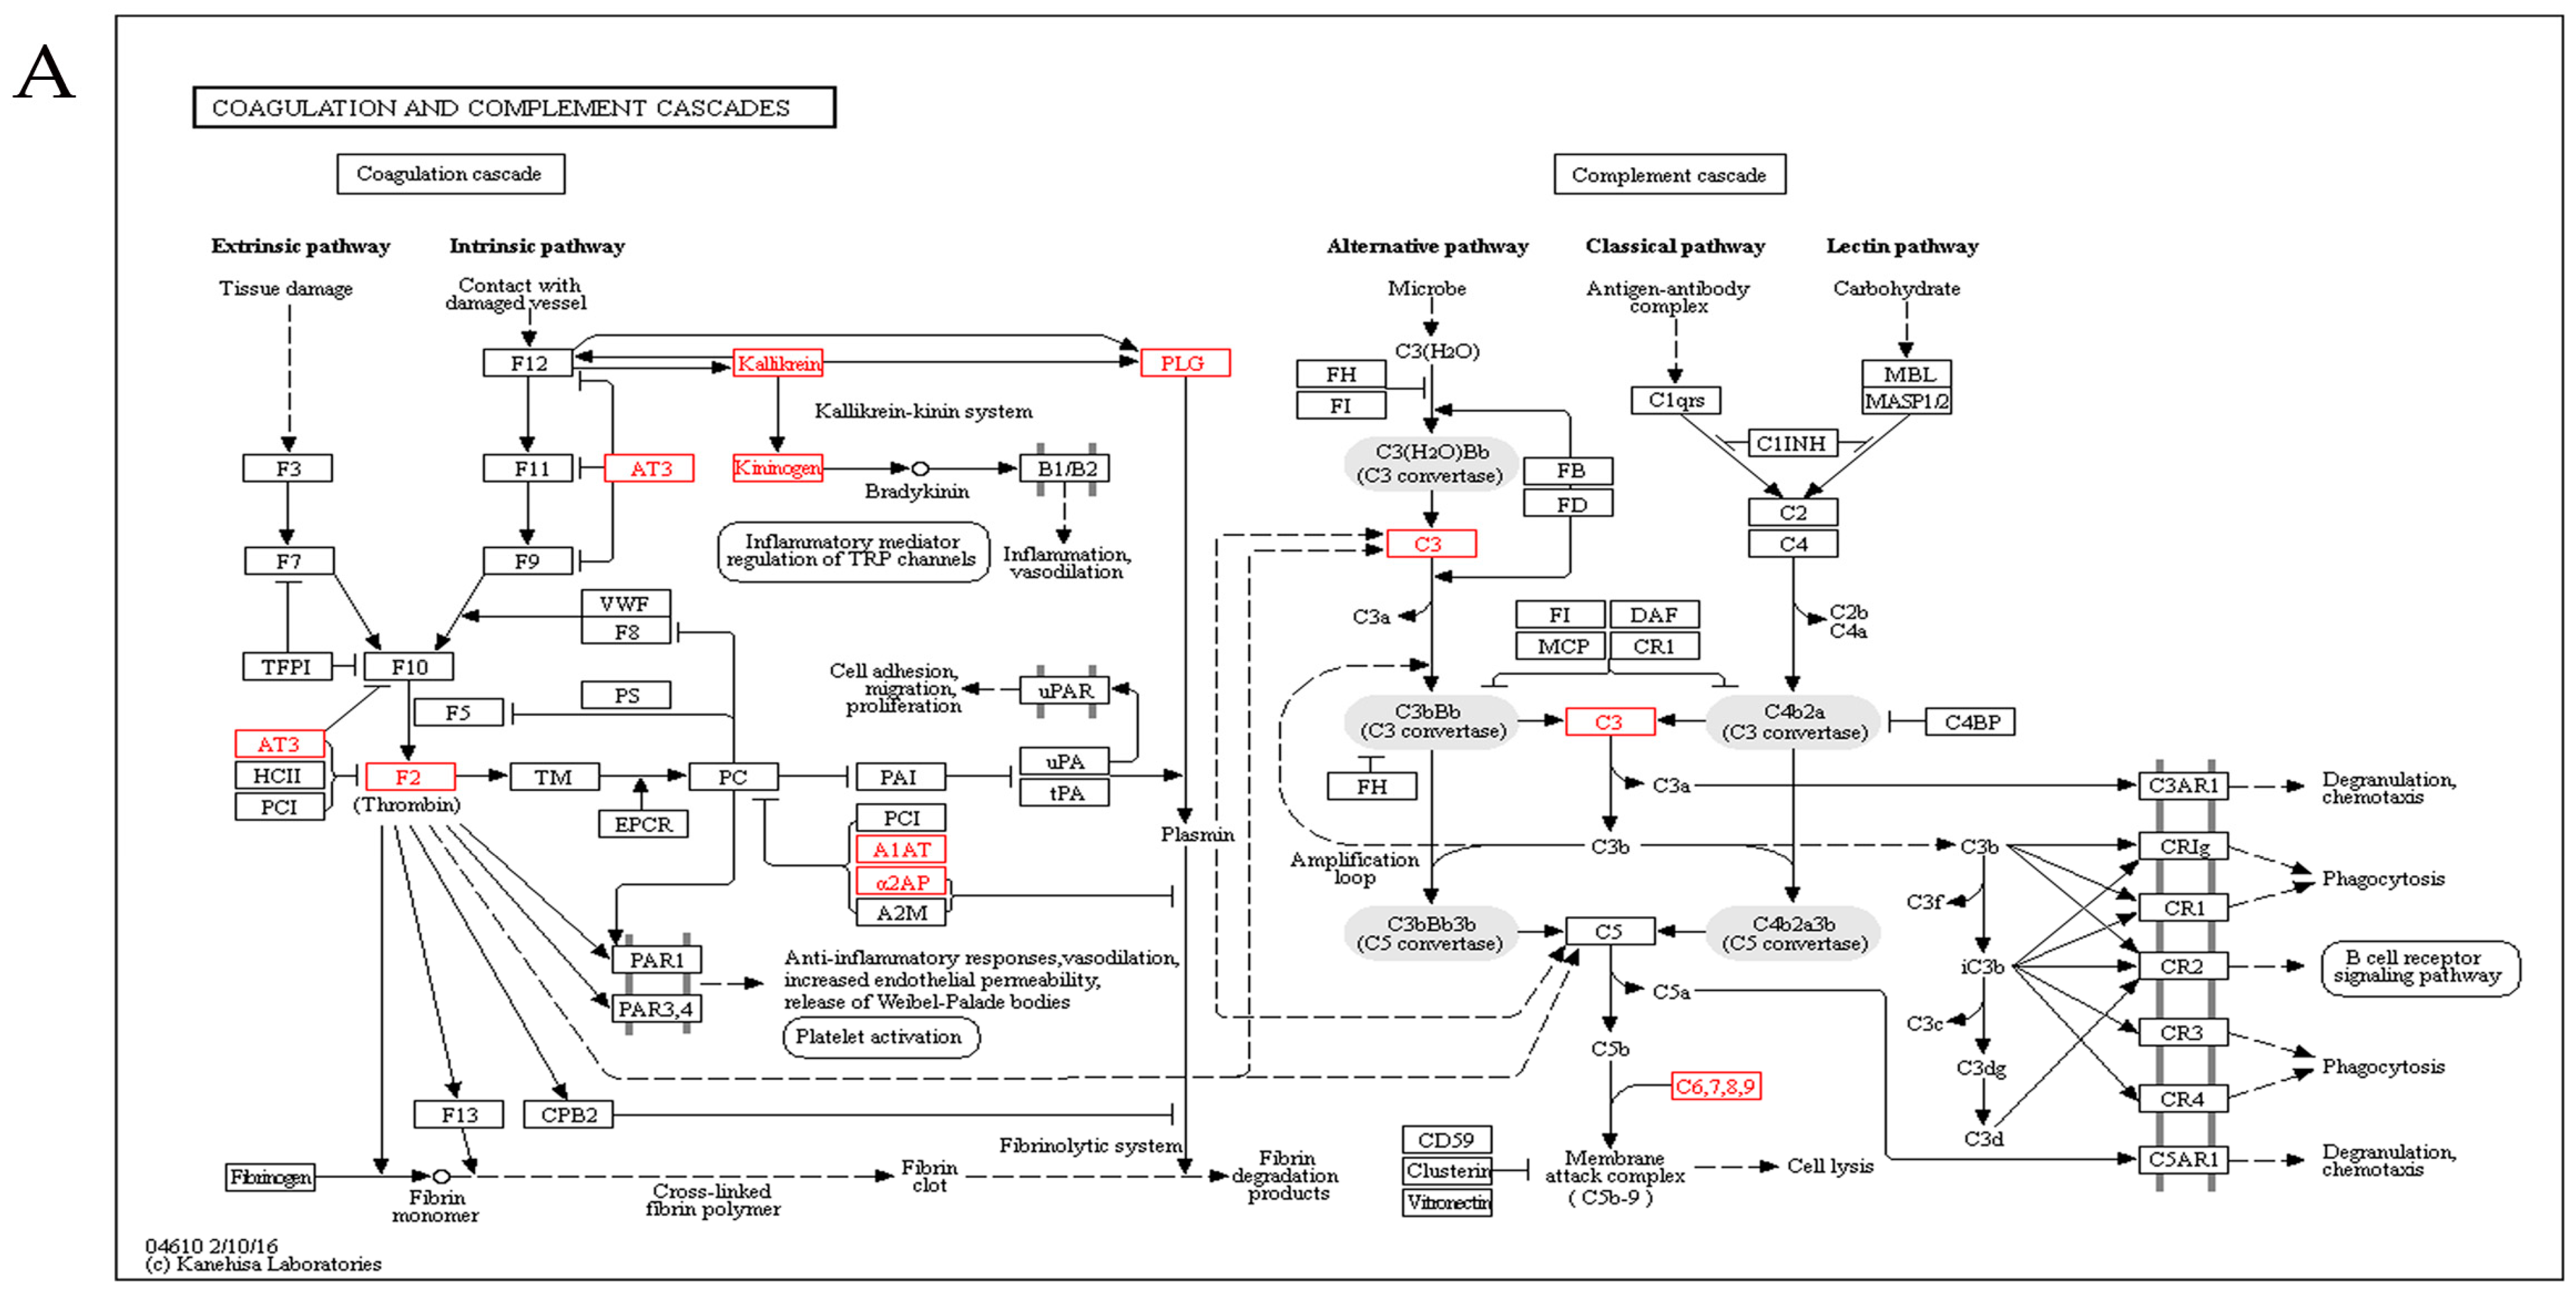
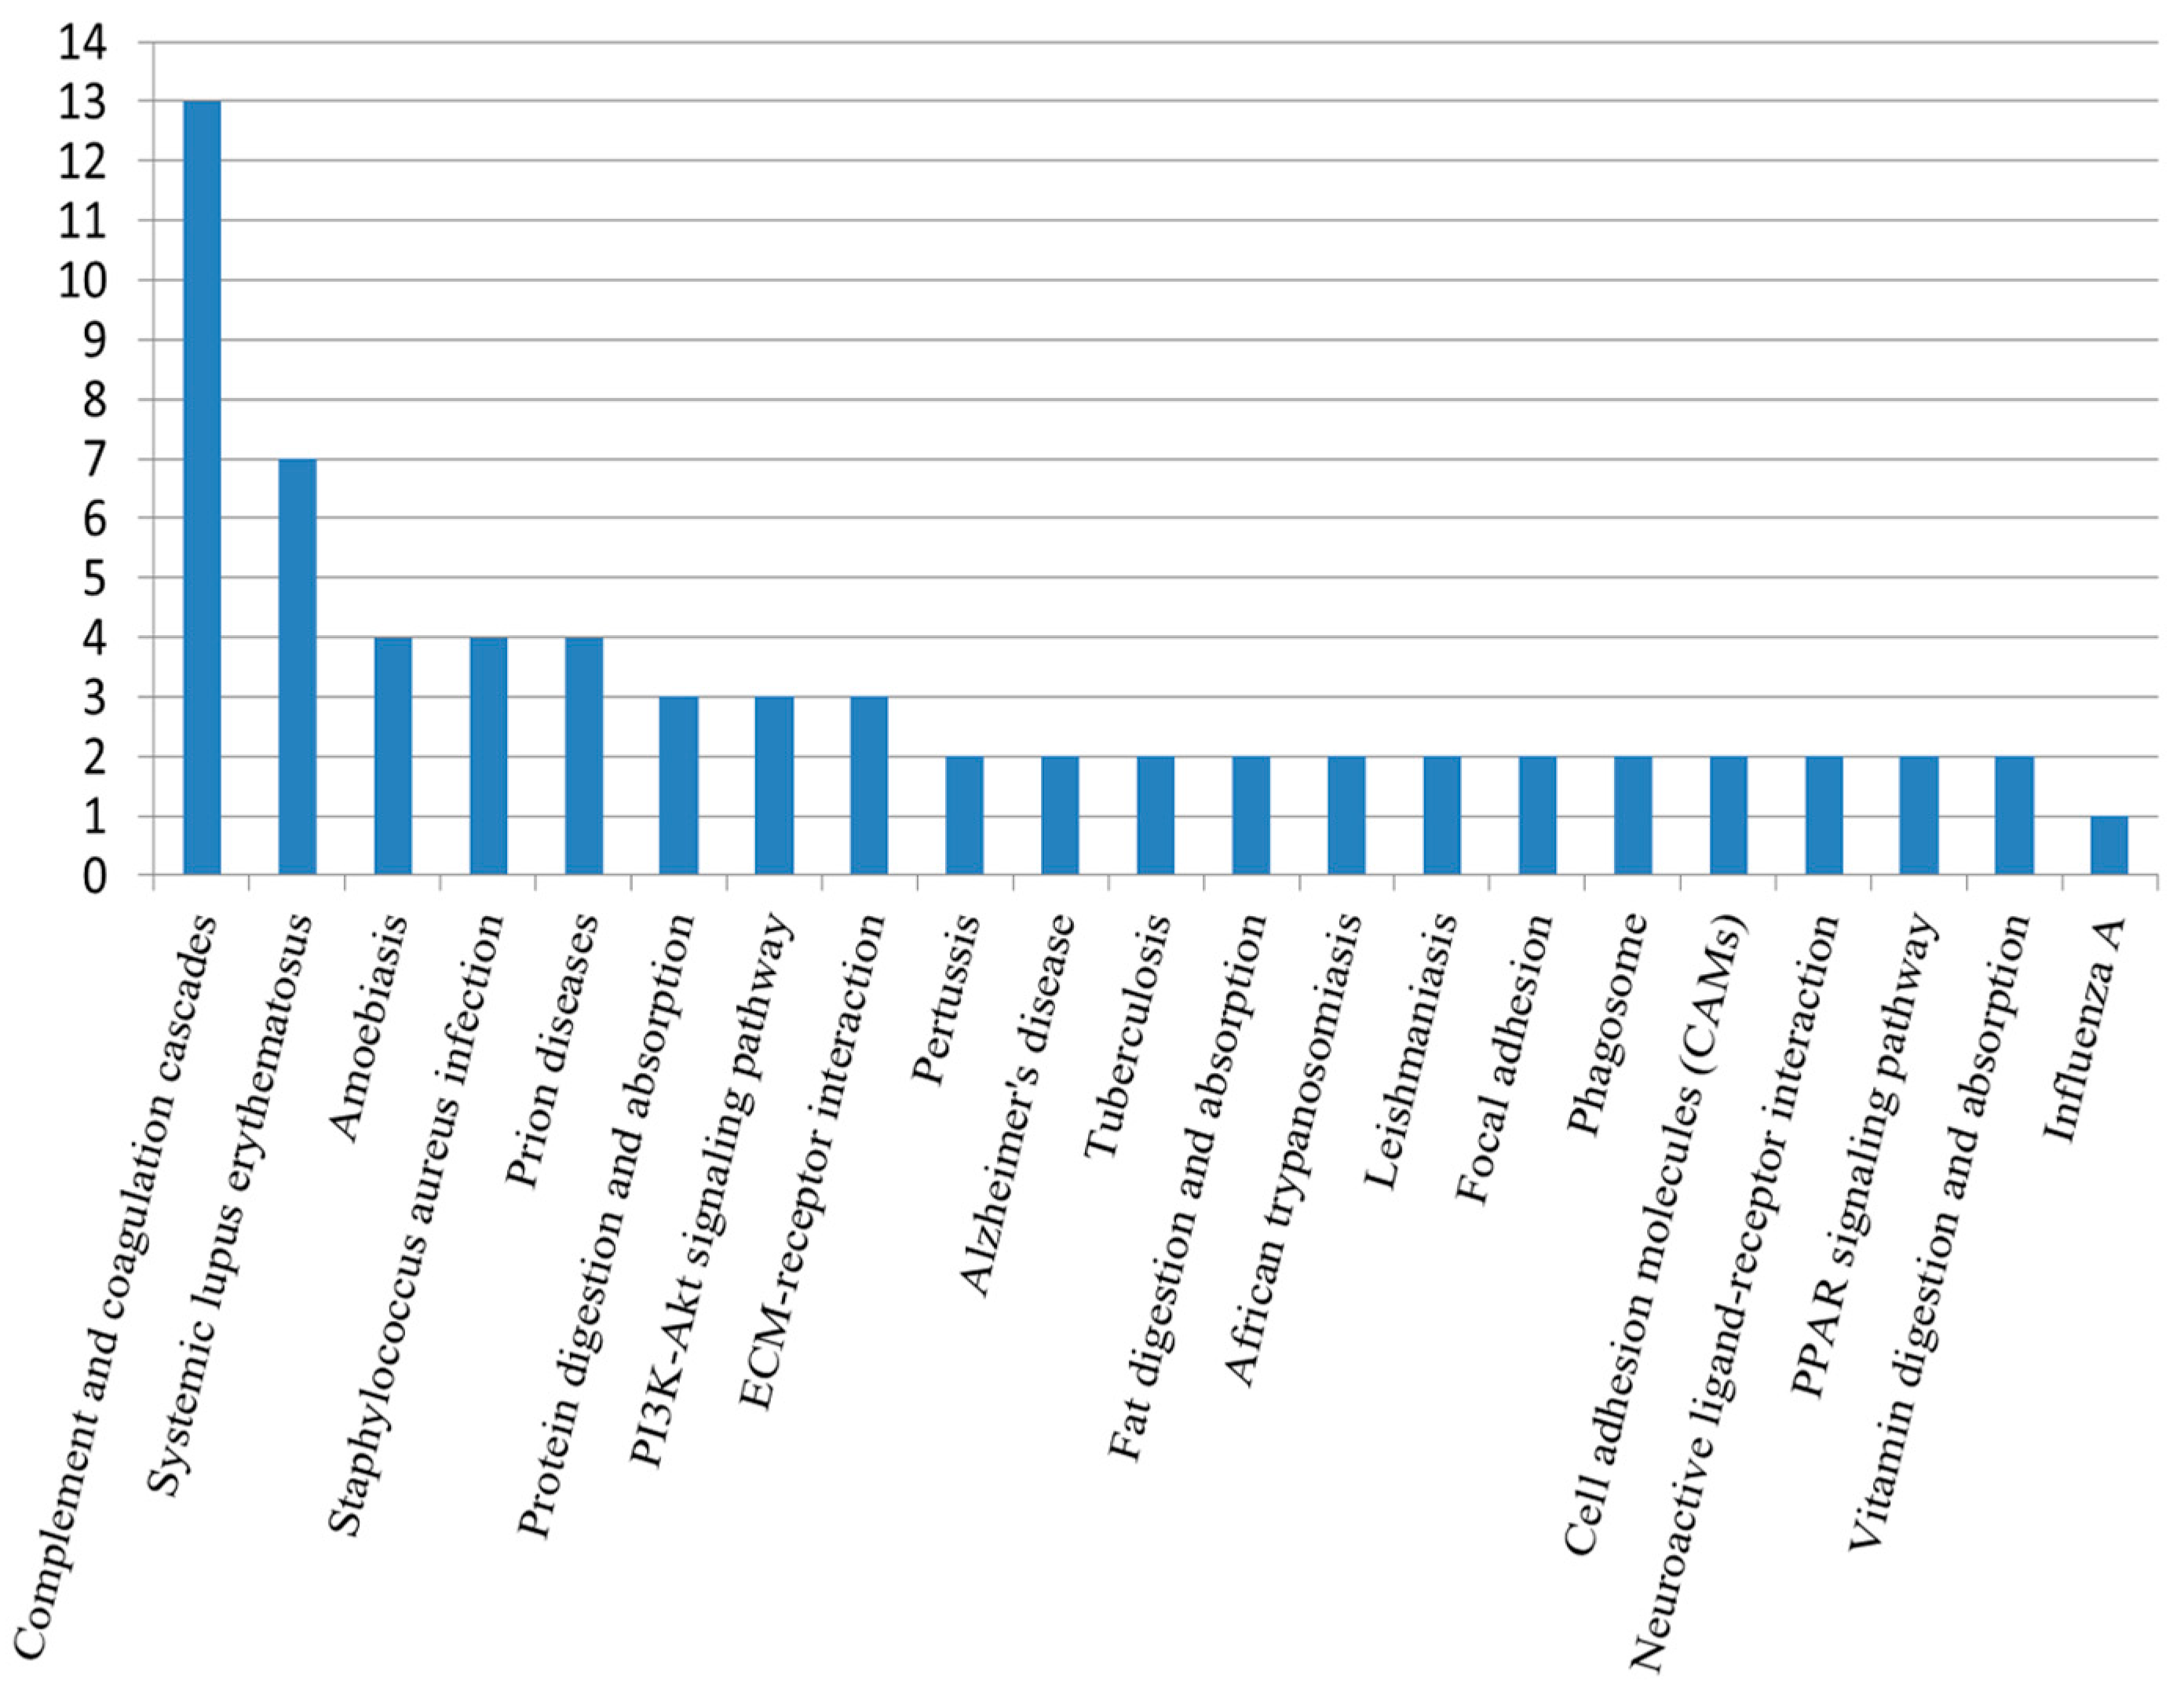
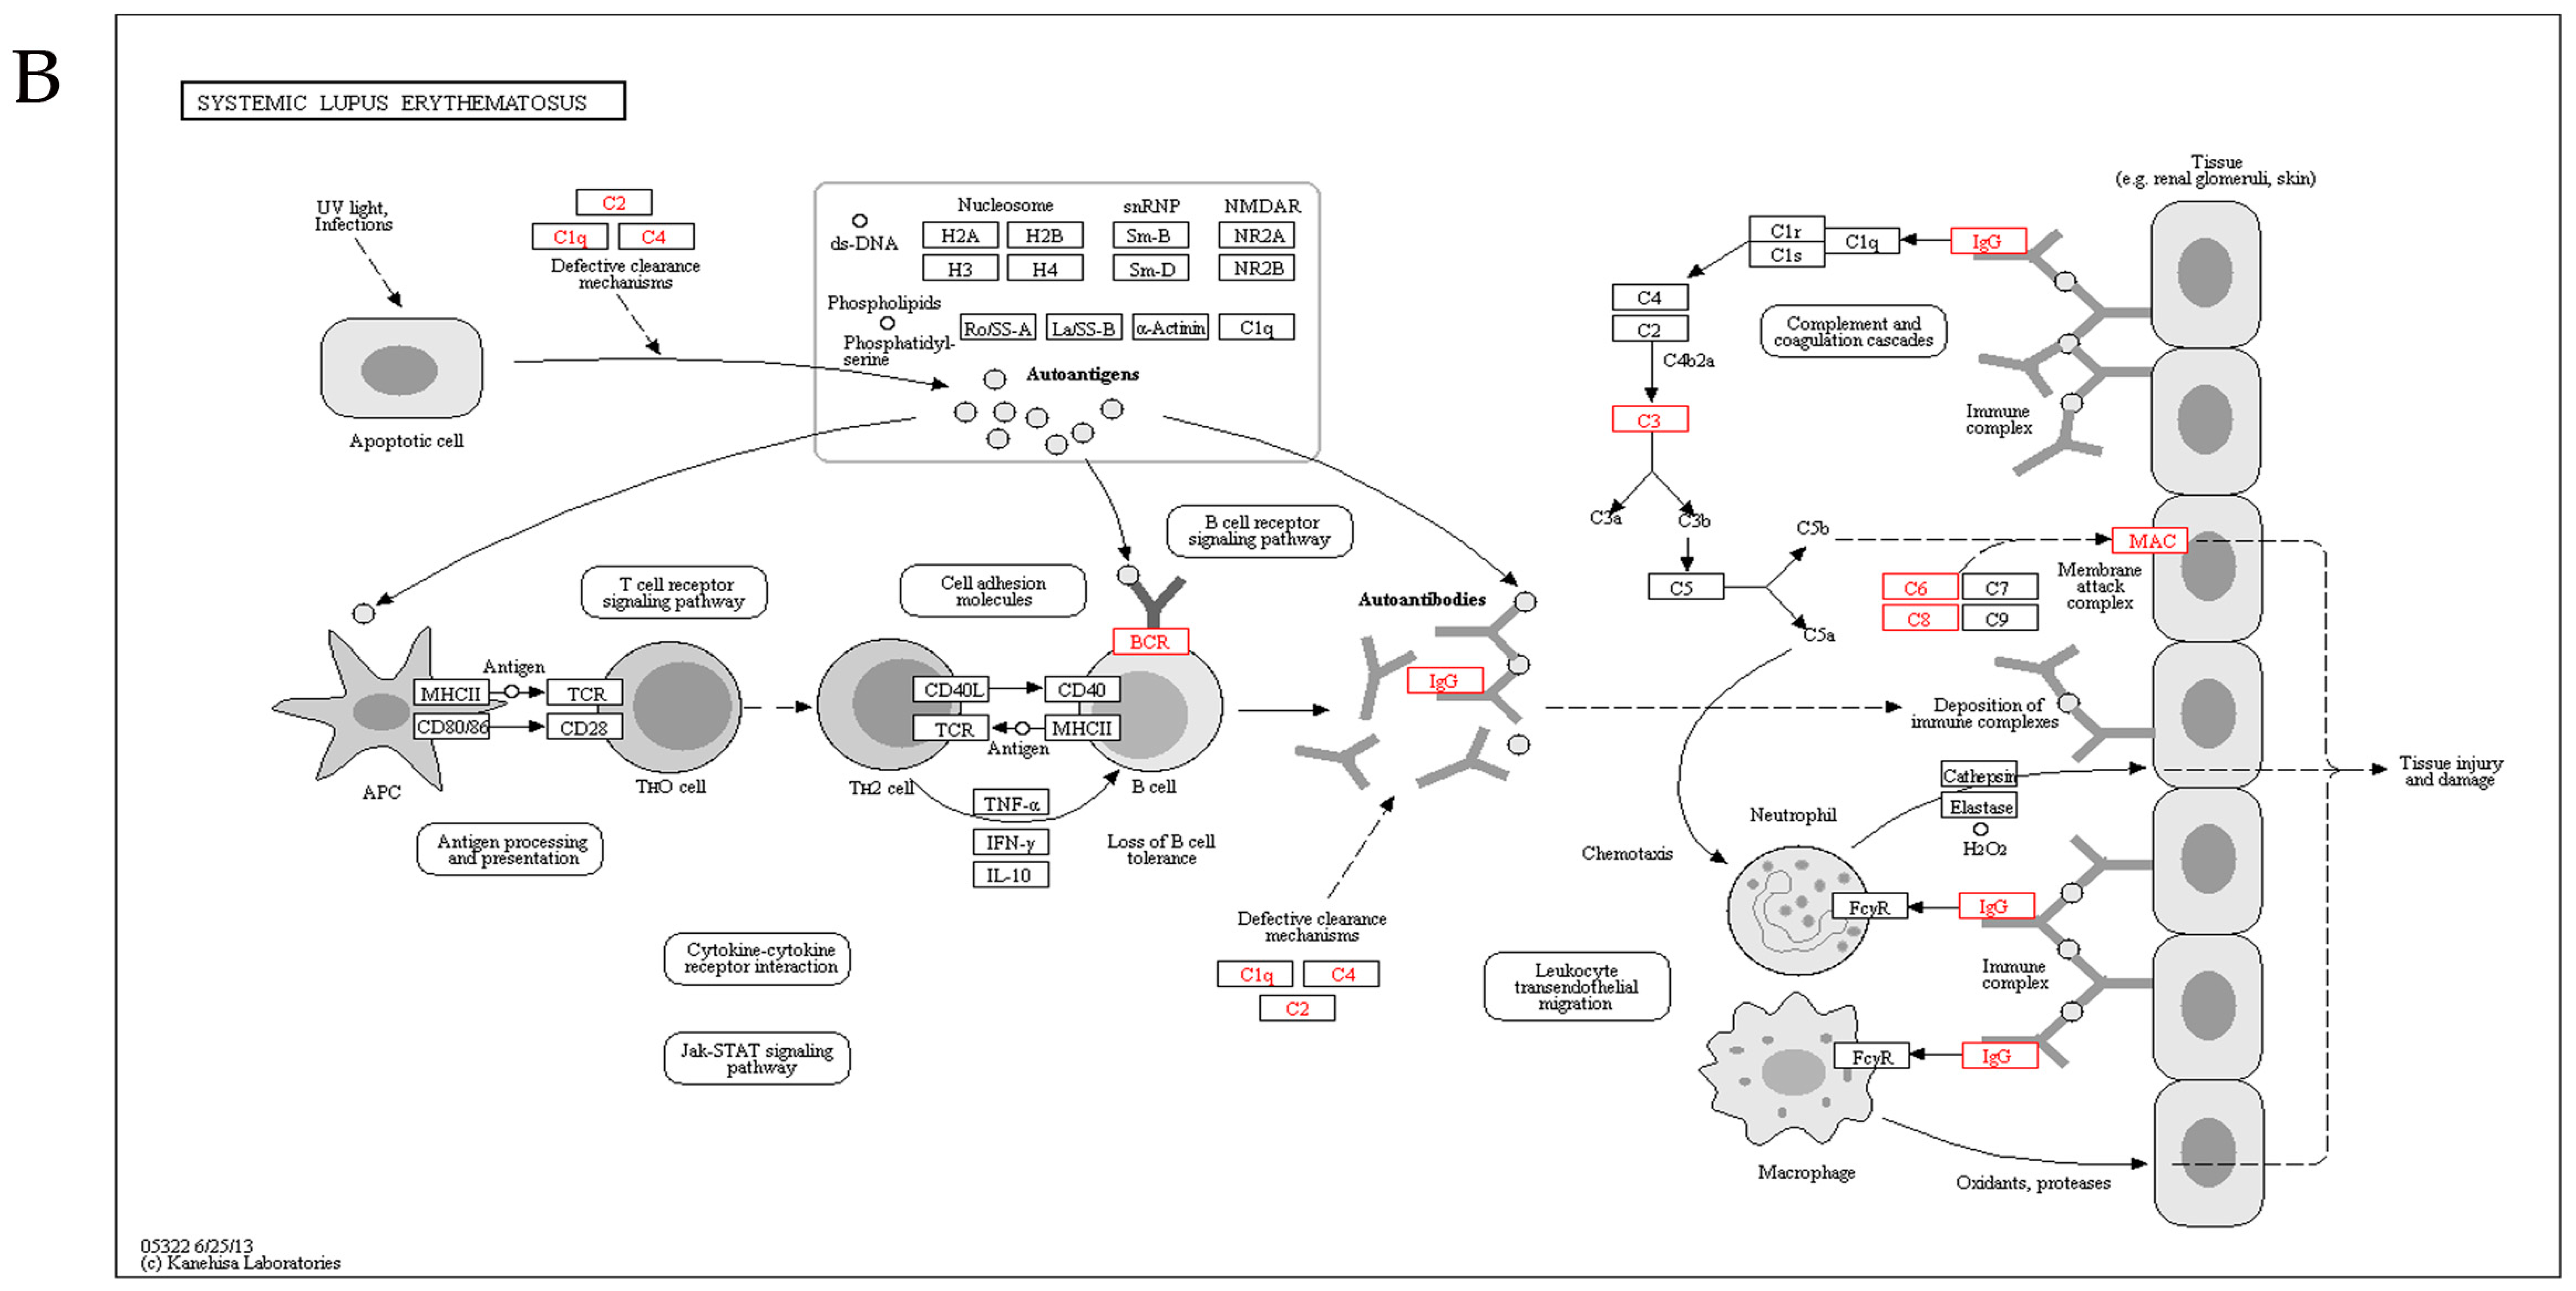
2.5. Kyoto Encyclopedia of Genes and Genomes Analysis

Using the Kyoto encyclopedia of genes and genomes (KEGG) pathway database, the differentially expressed proteins were classified into 65 pathways, the top 21 of which are shown in Figure 4. The complement and coagulation pathway was the top pathway, followed by the systemic lupus erythematosus (SLE) pathway. KEGG analysis showed that the significantly enriched pathways included the complement and coagulation and SLE pathways (Figure 5). The KEGG maps are shown in Figure 6.

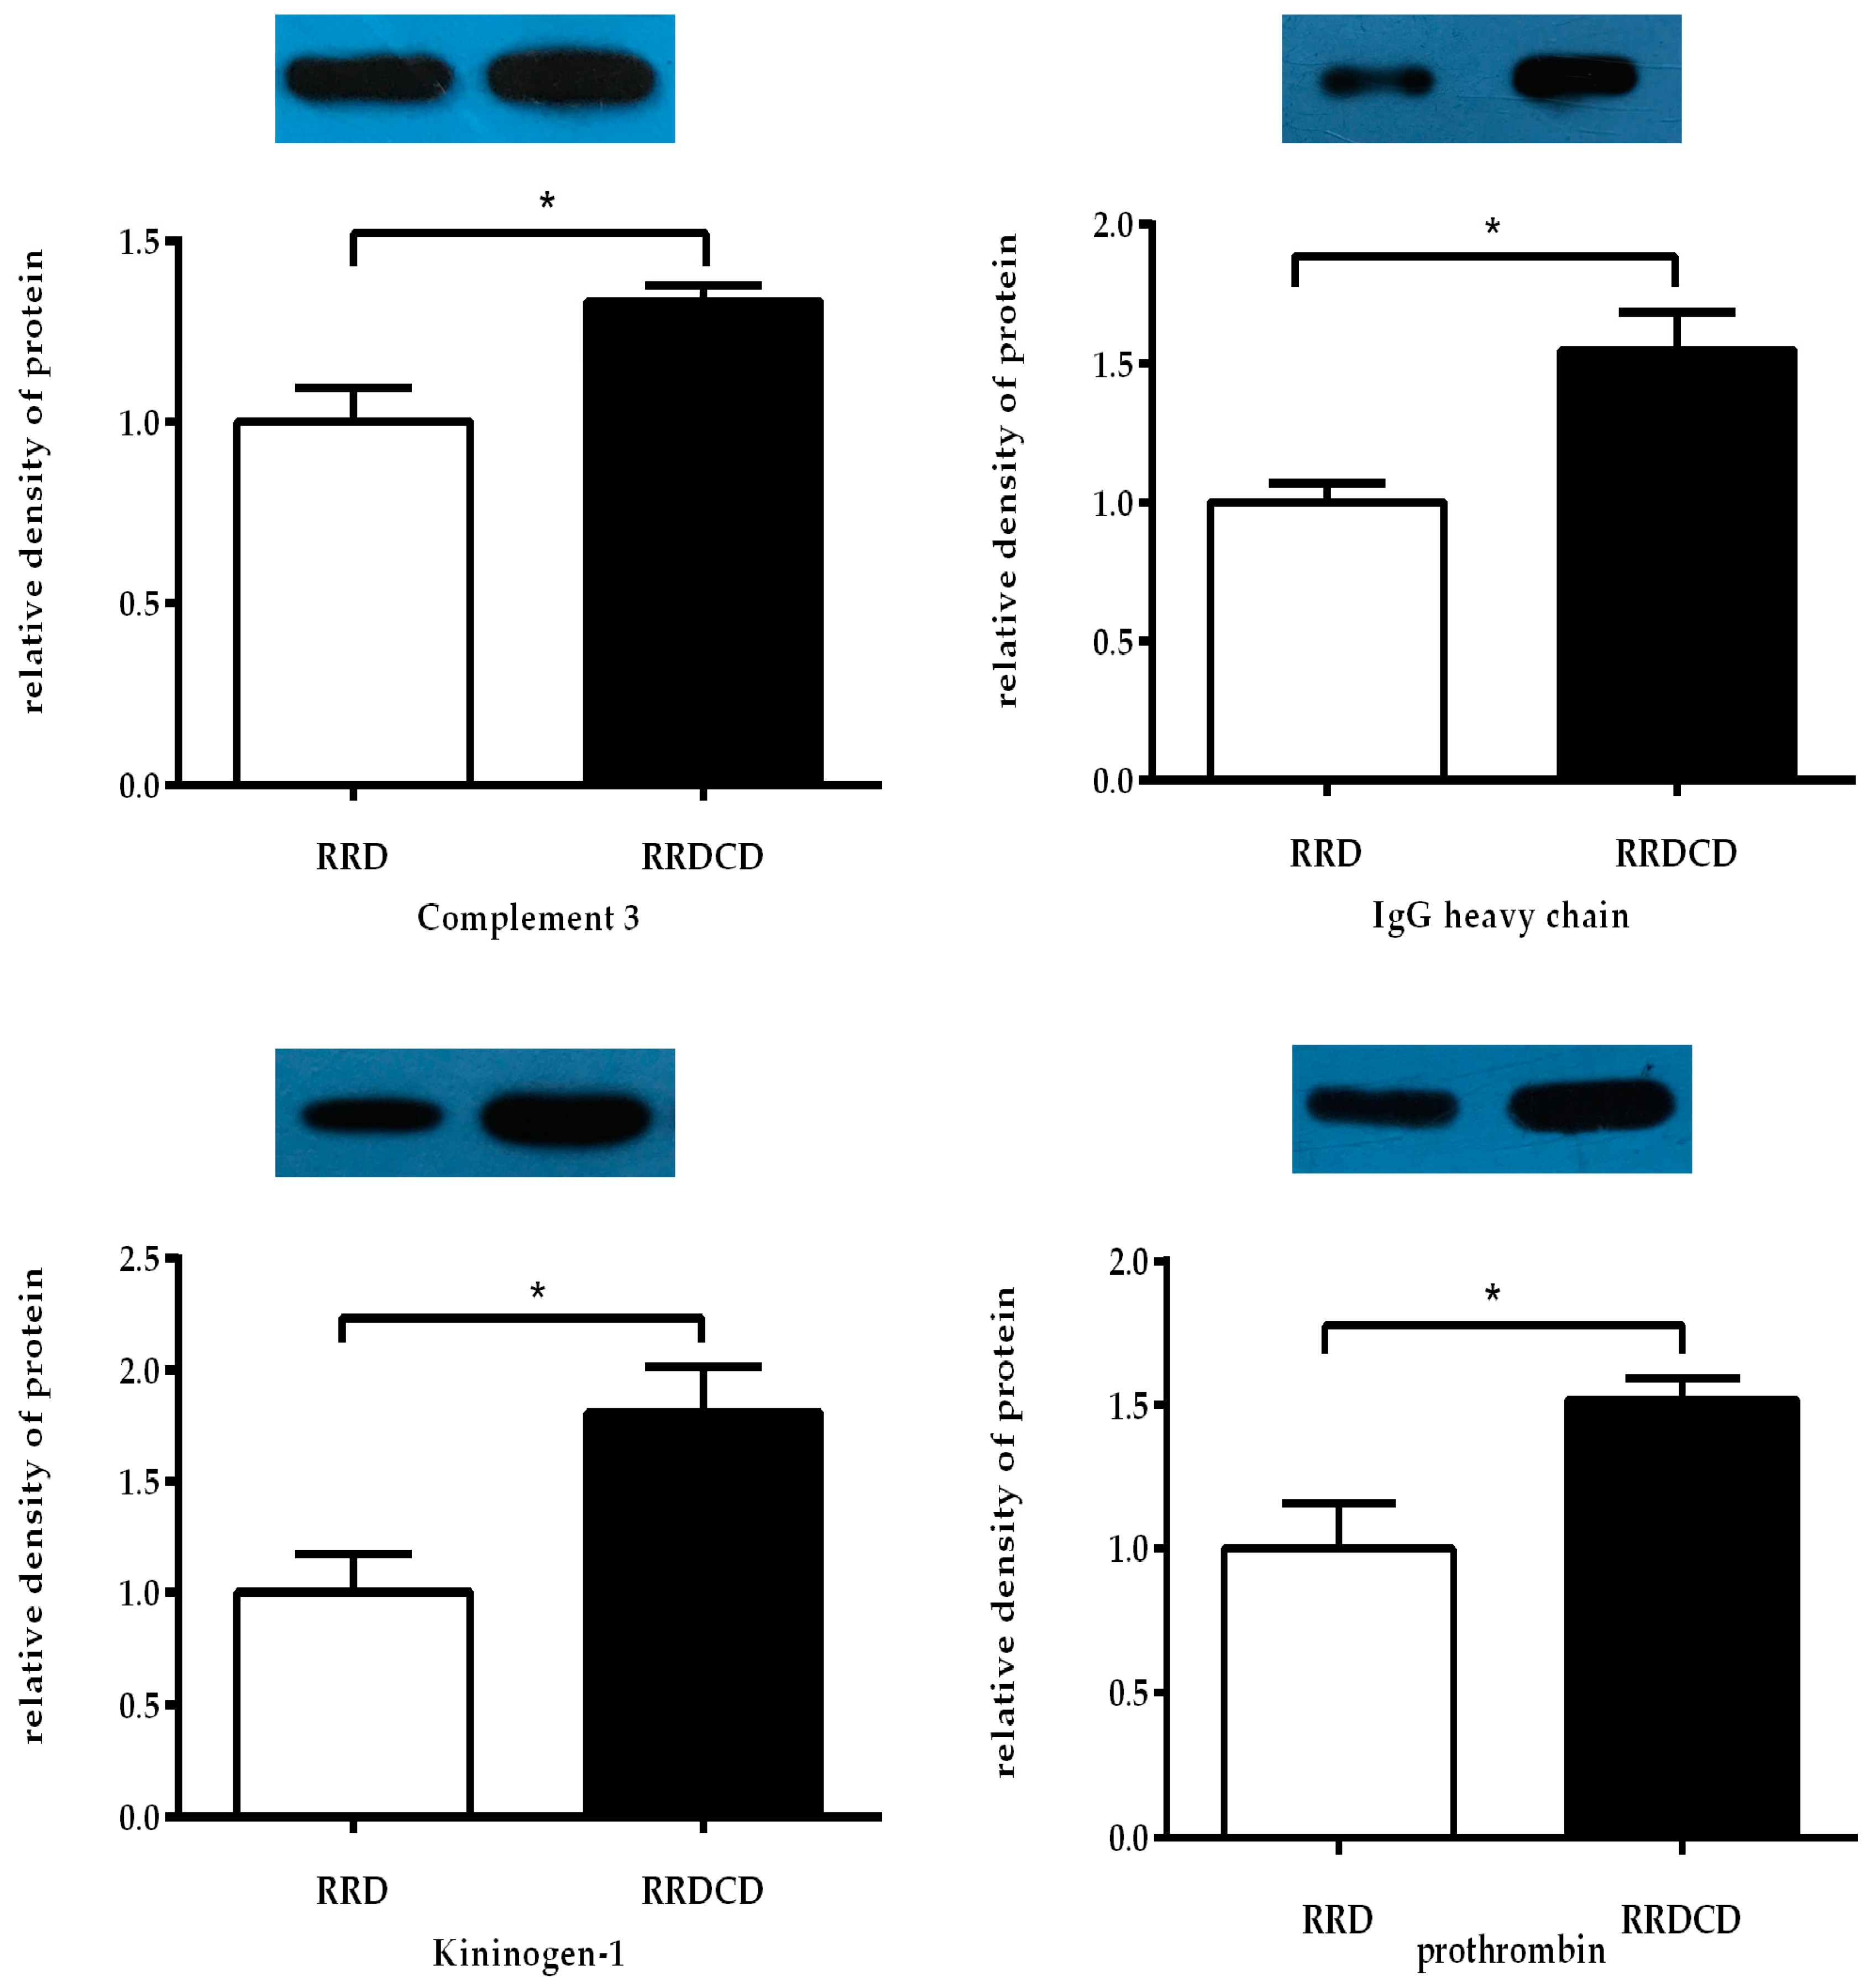
2.6. Protein Verification by Western Blotting Analysis

C3, prothrombin, kininogen-1, and IgG heavy chain were randomly chosen and detected in all RRD (n = 8) and RRDCD (n = 8) vitreous samples by Western analysis. Changes in protein abundance shown by Western analysis and quantification of the proteins were highly consistent with the proteomic data of patients (Figure 7).

3. Discussion

This study investigated the proteomic profiles of RRDCD vitreous humor using the iTRAQ and nano-LC-ESI-MS/MS techniques. We identified 103 differentially expressed proteins, including 54 up-regulated and 49 down-regulated proteins, in the RRDCD samples compared to the RRD samples. We randomly selected four proteins for validation by Western blot analysis. The changes in protein abundance were highly consistent with the proteomic data.
According to GO annotation analysis, the differentially expressed proteins in the RRDCD samples were primarily assigned to biological regulation, binding, and extracellular region when analyzed for BP, MF and CC, respectively. GO enrichment analysis showed that most of the differentially proteins were enriched in the extracellular space. These proteins may be secreted from the neighboring tissues or derived from the broken blood-retinal barrier (BRB). The complement, coagulation and SLE pathways were significantly enriched in KEGG pathway analysis.
Most up-regulated proteins in the vitreous humor of the RRDCD group, compared to those in the RRD group, were plasma proteins. This might be caused by the leakage from the suprachoroidal space or retinal vessels into the vitreous. These proteins might not be inductive factors for RRDCD. It is possible that the level of protein concentration is useful for diagnosis or predictions of RRDCD.
This study identified highly abundant proteins associated with inflammation in RRDCD, such as α-1-antitrypsin, immunoglobulin chains and complement proteins (C1r, C3, C6 and C8). α-1-antitrypsin is a member of the serpin superfamily. Its typical function is inhibiting serine protease like neutrophil elastase, proteinase 3, trypsin, kallikreins and so on [13]. α-1-antitrypsin is an acute-phase response prtein and involves in reducing production of inflammatory mediators, blocking inflammatory cells to modulates inflammatory responses [14]. The previous studies show that complement components and immunoglobulins existed in epiretinal membranes of PVR [15,16]. The immunoglobulin heavy and light chains were significantly up-regulated in the vitreous of RRDCD, indicating that the immune reaction or BRB breakdown in RRDCD was more serious than in RRD.
The complement system is an important constituent of human innate immunity and a bridge to adaptive immunity [17]. C3a is product of C3 activation, also known as anaphylatoxin. Activation of the G protein coupled receptors (C3aR) by C3a promotes degranulation in mast cells and basophils and release of histamine and other mediators, finally resulting in inflammatory hyperemia and edema [18,19,20]. C3a recruits neutrophils, macrophages and other inflammatory cells and induces vasodilation and inflammatory mediator release [18,19,20]. High expression of C3 in the RRDCD vitreous humor can result in intraocular inflammation and destruction of ocular tissues like retina and vessels. This process may lead to RRDCD pathophysiological processes. C6 and C8 participate in the formation of the membrane attack complex (MAC) C5–C9, and subsequently lead to cell lysis [21]. Cashman and colleagues found that mice injected with C3-expressing adenovirus significantly increased vascular permeability, RPE atrophy, endothelial cell proliferation, and migration [18]. Our results support this previous study suggesting a role of complement in RRDCD. The complement components may cause increased retinal vascular permeability, retinal damage, cell proliferation and inflammation, which in turn to promote RRDCD and contribute to PVR and poor visual prognosis.
In this study, coagulation proteins, such as prothrombin, α-1-antitrypsin, α-2-antiplasmin and plasminogen, were significantly up-regulated in the RRDCD vitreous humor. This may be due to the penetration of plasma proteins due to broken BRB and dysfunction of retinal vessels. Blood coagulation is a process in which successive activation of coagulation factors triggers a chain reaction, resulting in fibrin clot formation. The activated coagulation cascade has a positive feedback effect [22,23]. Additionally, there is a reciprocal relationship between coagulation and inflammation [24,25]. Thrombin, which is activated from prothrombin and was identified in this study, is a serine protease that mediates a strong inflammatory response [25]. Up-regulated coagulation proteins may further aggravate ocular inflammation. The coagulation cascade also has a reciprocal relationship with the complement system. The dysregulation of one system can escalate the activation of both. A previous study revealed that plasminogen mutually and prominently activates and coexists with complement in many chronic inflammation diseases [26]. Coagulation cascade components have been found in vitreous humor by some proteomic studies for other vitreoretinal diseases [27,28], but significant enrichment in RRDCD has not been reported. The significantly enriched coagulation components in RRDCD compared to RRD indicate that increased coagulation activity plays a role in the development of RRDCD. This study showed that kininogen-1 and plasma kallikrein B, the components of the kallikrein-kinin system, were up-regulated in the vitreous humor of RRDCD compared to RRD. The kallikrein-kinin system plays important roles in many physiological and pathological processes such as regulation of vasomotor tone, blood coagulation, fibrinolysis process, inflammation, and electrolyte balance [29,30,31,32]. Plasma kallikrein and high molecular weight kininogen (HMWK) circulate as a complex that binds to plasma membrane of the endothelial cells, therefore, we can assume that the complex also exists in retinal vessels. A previous study has reported that high levels of bradykinin B1 and B2 receptors are expressed in all of the layers of human retina and the vascular endothelial cells [33]. This suggests that the plasma kallikrein/kininogen might participate in the regulation of retinal vessel functions. It has been reported that intraocular hemorrhage increases retinal vascular permeability and leukocyte stasis induced by plasma kallikrein [34]. Another study has shown that intravitreal injection of plasma kallikrein in rats increases retinal vascular permeability [35]. The components of the kinin-kallikrein system probably cross the BRB into the vitreous fluid and enhance vascular permeability. Additionally, plasma kallikrein/kininogen might interact with coagulation components and inflammatory factors, finally promoting PVR and RRDCD disease progression.
Some other proteins, like apolipoprotein, serum albumin, hemopexin, and retinol binding protein 4 (RBP4), were up-regulated in the vitreous of RRDCD. These proteins are important for maintaining cell activities and transport functions. Recently, a few studies indicated that increased RBP4 in blood may promote retinal dysfunction [34,36,37].
Most down-regulated proteins in the vitreous humor of the RRDCD group compared to those in the RRD group were development related proteins. This may indicate that the pathogenesis of RRDCD is more severe and complicated compared to RRD. Prostaglandin-H2 d-isomerase (PTGDS) catalyzes change of prostaglandin H2 to prostaglandin D2 in the arachidonic acid (AA) metabolic pathway. In our study, PTGDS was down-regulated in the vitreous of RRDCD, consistent with the results in our previous metabolomics study of down-regulated AA in the vitreous of RRDCD patients [10].
Although proteomic techniques were already developed and can obtain accurate data to provide additional insights into the development of RRDCD, there were several limitations in this study. First, the number of vitreous samples was relatively small. RRDCD is a disease with low prevalence. In our department, only 13 samples of RRDCD were collected between September 2014 and September 2015, after RRDCD patients administered with preoperative steroids and patients with recurrent RRDCD, secondary RRDCD and comorbid diseases were excluded. However, there was statistically significant difference between the two groups in our study, and the results of WB were consistent with the proteomic data, suggesting that the results are credible; Second, due to the limited number of reliable and constantly updated reference databases for protein identification, our interpretation of the results was limited; Lastly, it is difficult to know what to make of protein interaction networks in a fluid like vitreous humor. Our data offer another perspective to understand the function of retina and choroid in process of RRDCD. The results and conclusions of this study still need to be improved by expanding the samples' size and verified by blood samples in the future research.

4. Materials and Methods

4.1. Patients

Eight primary RRD and 8 primary RRDCD patients, undergoing pars plana vitrectomy between September 2014 and September 2015 at Nanjing Medical University Affiliated Wuxi Second Hospital (Wuxi, China) were enrolled in this study. The exclusion criteria included diabetic retinopathy, intraocular inflammation, systemic disease such as hypertension, diabetic, previous intraocular surgery and intravitreal injection with steroid or anti-vascular endothelial growth factor. All subjects received comprehensive ophthalmic examination before operation by two experienced doctors. The grade of Proliferative vitreoretinopathy (PVR) was recorded on the basis of the classification of the Retina Society Terminology Committee [38]. The symptom duration was recorded in days and the extents of retinal detachment were recorded in quadrants.

4.2. Ethics Statement

The study was followed the principles of Helsinki Declaration and was approved by the ethics committee of Nanjing Medical University affiliated Wuxi NO.2 Hospital (Wuxi, China. Identification code: WXEYLL256. 29 August 2014). All subjects in this study signed a copy of informed consent prior to participation.

4.3. Sample Preparation

Approximately 0.5–1.0 mL vitreous samples were collected using a 5 mL sterile syringe when the 25-gauge trocar was inserted into the vitreous cavity before active infusion. Undiluted vitreous fluid was transferred into 1.5 mL Eppendorf Tubes immediately and centrifuged at 9398× g for 10 min at 4 °C. The supernatants were aliquoted and stored at −80 °C until analysis. The samples were thawed and mixed with 800 µL SDT lysis buffer (4% SDS, 100 mM Tris-HCl, 1 mM DTT, and pH 7.6), followed by sonication. After being incubated in a 95 °C water bath for 15 min, the samples were centrifuged at 14,000× g for 40 min. The protein concentration of the supernatants was determined by Bicinchoninic acid protein assay kit (Beyotime, P0012, Nantong, China).

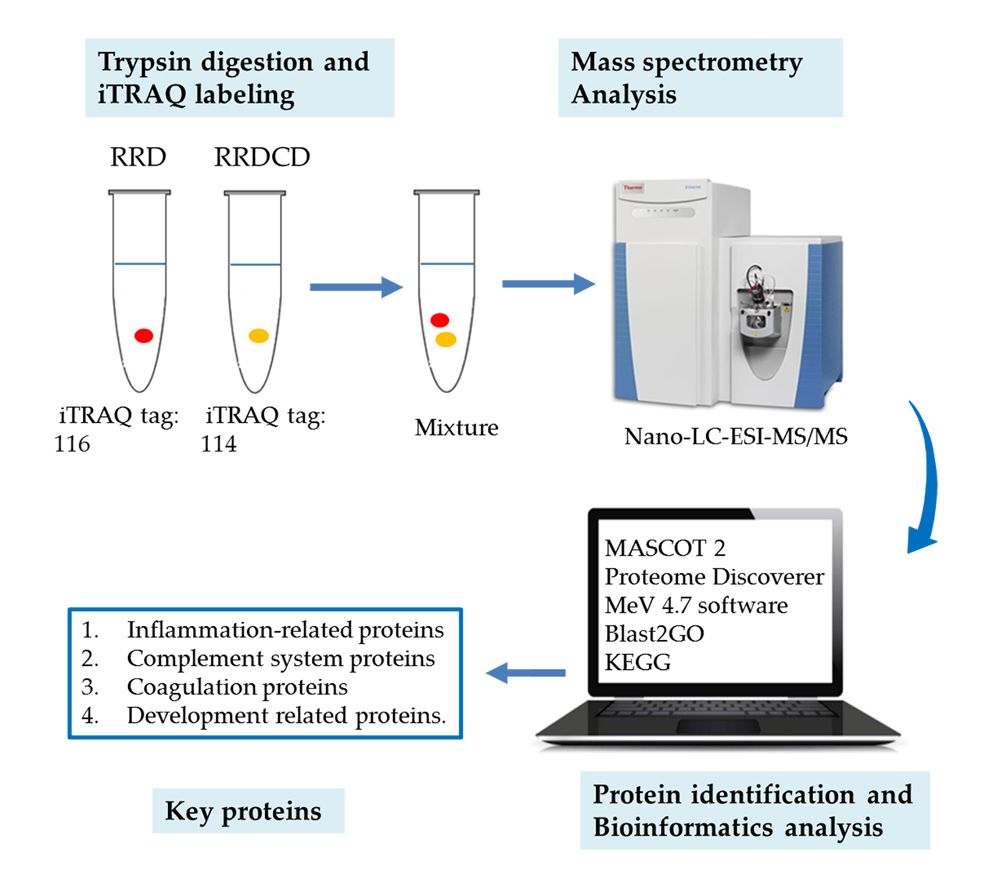
4.4. Protein Digestion and iTRAQ Labeling

Filter aided proteome preparation (FASP) was performed as previously described for proteins digestion [39]. The finally filtrates were collected and the peptides were quantified at 280 nm. According to the manufacturer’s instructions, 100 µg samples from each group were labeled by iTRAQ Reagent-4plex multiplex kit (AB SCIEX, Foster City, CA, USA). Proteins from RRDCD group and RRD group were labeled with reagent 114 and reagent 116 respectively. Blank control group were labeled with reagent 117.

4.5. Strong Cationic-Exchange (SCX) Chromatography Separation

The labeled peptides of samples were mixed and acidified with 2 mL of buffer A (10 mM KH2PO4, pH 3.0, and 25% (v/v) acetonitrile (ACN)). The mixed peptides were then loaded onto a Polysulfoethyl™ (Poly-LC Inc., Columbia, MD, USA) column (4.6 × 100 mm, 5 µm, 200 Å). The peptides were eluted at a flow rate of 1000 µL/min, setting the gradient at 0%–100% of buffer B (10 mM KH2PO4, 500 mM KCl, 25% ACN, and pH 3.0). Absorbance at 214 nm was monitored during elution, and the fractions were collected every minute. Approximately 30 fractions were collected and combined into 10 pools and desalted on C18 Cartridges.

4.6. Nano-LC-ESI-MS/MS Analysis

The fractions were analyzed using Q Exactive MS equipped with Easy nLC (Thermo Finnigan, San Jose, CA, USA). The chromatographic columns were balanced with buffer A (0.1% formic acid). Peptide mixture (2 µg) was loaded via an auto-sampler into a Thermo scientific EASY column (2 cm × 100 µm, 5 µm-C18) and separated by analytical columns (75 µm × 100 mm, 3 µm-C18) at a flow rate of 250 nL/min. The linear gradient was set as 0%–100% buffer B (10 mM KH2PO4, 500 mM KCl, 25% ACN, and pH 3.0) for 240 min. After separation of nano-HPLC, samples were analyzed by the Q-Exactive mass spectrometer in a positive ion mode. The parent Ion Scan range set as 300–1800 m/z. 10 MS2 scans were collected after every full scan to obtain the mass-to-charge ratio of peptides/peptides fragments.

4.7. Protein Identification and Quantification

The raw dates from Q Exactive were submitted to Mascot search software (version 2.2.1; Matrix Science, London, UK) and Proteome Discoverer 1.4 (Thermo Electron, San Jose, CA, USA) for date filtering and proteins identification. Furthered analysis was performed according to false discovery rate (FDR) ≤0.01 using Proteome Discoverer 1.4. Protein identification was supported by at least one unique peptide identified using the Peptide Prophet algorithm. Proteins with fold change >1.2 were retained. Hierarchical clustering analysis was performed by MeV 4.7 software, and Pearson’s correlation analysis was used for the distance matrix and the Ward’s linkage.

4.8. Bioinformatic Analysis

Proteins/peptides sequences were imported into Blast2GO for GO annotation and enrichment [12]. The differentially expressed proteins were then blasted against KEGG GENES to retrieve their KEGG Orthology (KOs) and were mapped to KEGG pathways [40]. Fisher’s exact test was carried out to evaluate the enrichment of GO terms and KEGG pathways of differentially expressed proteins against the annotation of all identified proteins.

4.9. Western Blotting

Western blot analyses were performed to validate the proteomic data on some randomly chosen differentially expressed proteins. Briefly, equal amounts of proteins (20 µg) for each sample were loaded on a 10% sodium dodecyl sulfate polyacrylamide gel. After blocking with 5% bovine serum albumin, the membranes were incubated with monoclonal antibodies of C3 (21337-1-AP; Proteintech, Chicago, IL, USA), prothrombin (ab109087; Abcam, Cambridge, MA, USA), kininogen-1 (ab175386; Abcam), and IgG heavy chain (16402-1-AP; Proteintech), followed by incubation with secondary antibodies (sc-2004; Santa Cruz, CA, USA). Protein bands were visualized using the ECL assay kit (P0018; Beyotime, Nantong, China). The quantification of the proteins was done using Image J software (http://rsb.info.nih.gov/ij/).

5. Conclusions

We performed a proteomic study using iTRAQ-nano-LC-ESI-MS/MS techniques and bioinformatic analyses to identify differentially expressed proteins between RRDCD and RRD. Based on our findings, the proteins of complement and coagulation cascades, the kallikrein-kinin system, and inflammation may play a crucial role in the course of RRDCD. This study provides insights into the development of RRDCD and warrants further studies in the future.

Acknowledgments

We thank the Shanghai Applied Protein Technology Co., Ltd., for technological assistance.

Author Contributions

Zhifeng Wu and Qin Jiang conceived and designed the experiments; Mengxi Yu and Nannan Ding performed the experiments; Ke Wang and Shasha Luo analyzed the data; Wenjun Zou and Ying Zhou contributed samples collection and processing; Nannan Ding wrote the paper; Biao Yan proofed writing.

Conflicts of Interest

The authors declare no conflict of interest.

Abbreviations

AAArachidonic acid
BPBiological process
BRBBlood-retinal barrier
CCCellular component
GOGene ontology
iTRAQIsobaric tags for relative and absolute quantitation
KEGGKyoto encyclopedia of genes and genomes
MACMembrane attack complex
MFMolecular function
Nano-LC-ESI-MS/MSNano-liquid chromatography-electrospray ion trap-mass spectrometry-mass spectrometry
PTGDSProstaglandin-H2 d-isomerase
PVRProliferative vitreoretinopathy
RRDRhegmatogenous retinal detachment
RRDCDRhegmatogenous retinal detachment associated with choroidal detachment
SLESystemic lupus erythematosus

Appendix A

Table A1. 54 up-regulated proteins in vitreous humor of rhegmatogenous retinal detachment associated with choroidal detachment (RRDCD) compared to rhegmatogenous retinal detachment (RRD) identified from iTRAQ analysis.
AccessionDescriptionCoverageUnique PeptidesPeptidesFold Changet Test p Value
K7ERI9Apolipoprotein C-I23.38332.720746.32 × 10−5
A0A087X0E2Serum amyloid A protein22.95332.5483670.000442
A0A0F7TAV4IGHV5-51 protein (Fragment)16.36221.9356540.032955
P00738Haptoglobin30.0515151.9259420.021916
Q6P163APOC2 protein25221.8039610.0011
Q9NPP6Immunoglobulin heavy chain variant17.79291.7993590.001327
A0A075B7E8Protein IGHV3OR16-1311.97221.7898690.010504
H0YLF3β-2-Microglobulin (Fragment)28.17221.7829090.00658
P05090Apolipoprotein D30.16661.7638580.045205
B4DPP6Serum albumin53.885491.7488570.000246
V9GYE3Apolipoprotein A-II42.31551.7400550.000297
A8K9A9Kallikrein B, plasma12.54881.7196250.000228
P02790Hemopexin19.2612121.6224250.000326
Q9H804Completement C1R7.31231.5804320.006066
P02763α-1-Acid glycoprotein 116.42261.5729670.009053
P02647Apolipoprotein A-I46.4417171.565360.00079
A0A0K0Q2Z1Serpin peptidase inhibitor clade C member 119.8313131.5625640.000278
B7Z544Inter-α-trypsin inhibitor heavy chain H411.7111111.5462810.003001
Q96PD5N-acetylmuramoyl-l-alanine amidase7.29331.5455210.00139
B4DPP8Kininogen-130.8417171.485140.000647
B4E1I8Leucine-rich α-2-glycoprotein15.15661.4583160.006872
E9PIT3Prothrombin13.04881.4554480.013628
P43652Afamin25.0417171.4539590.003423
P08697α-2-Antiplasmin12.83771.4504950.008491
B2R582C-type lectin domain family 3, member B21.78441.4477960.002065
P06727Apolipoprotein A-IV42.1721211.442840.000649
Q5SQ08Complement component C8 γ chain11.59221.4311010.018442
Q9UL84Myosin-reactive immunoglobulin heavy chain variable region14.75221.3872290.017727
P04217α-1B-Glycoprotein13.74771.3728690.014165
B7Z539Inter-α-trypsin inhibitor heavy chain H17.91771.3636040.027945
B2R7F8Plasminogen24.222221.3609770.007811
A0A0C4DGV7Retinol-binding protein 414.07441.3598680.04222
P01024Complement C324.9554541.3417470.002478
P02765α-2-HS-glycoprotein26.1610101.3333650.00478
B7Z550Complement component 8, β polypeptide7.56441.3293650.007697
P07357Complement component C8 α chain11.47771.3200780.04949
Q5T985Inter-α-trypsin inhibitor heavy chain H215.5117171.3105720.030167
P25311Zinc-α-2-glycoprotein30.210101.3071670.031312
P01009α-1-Antitrypsin27.5114141.3030750.020778
P13671Component C66.64771.2241110.03757
Uniprot accession numbers that can be found on www.uniprot.org; Coverage: The percentage of the protein sequence covered by identified peptides. Unique Peptides: The number of peptide sequences unique to a protein group. Peptides: The number of distinct peptide sequences in the protein group. Fold change: The quantity changes of protein abundance between the two groups.
Table A2. 49 down-regulated proteins in vitreous humor of RRDCD compared to RRD identified from iTRAQ analysis.
AccessionDescriptionCoverageUnique PeptidesPeptidesFold Changet Test p Value
Q16270Insulin-like growth factor-binding protein 728.72770.7953470.048896
H7BXV5Collagen α-1(XVIII) chain6.84440.728970.007309
B4DEN5N-acetyllactosaminide β-1,3-N-acetylglucosaminyltransferase14.71660.6970590.007153
A8KAJ3EGF-containing fibulin-like extracellular matrix protein 122.3110100.6946260.020864
O75326Semaphorin-7A14.56990.6883320.008646
Q12860Contactin-18.35880.6871350.010164
P41222Prostaglandin-H2 d-isomerase17.89770.6737210.012421
Q9UHG2ProSAAS15330.671950.006702
Q8NHP8Putative phospholipase B-like 23.57220.6691770.017856
Q92520Protein FAM3C24.23660.6681840.00515
O15240Neurosecretory protein VGF14.15880.6617620.010221
B4DZY7Growth-arrest-specific protein 65.72330.6502940.033296
B4DUI5Triosephosphate isomerase25.82550.6423480.009858
A0A0C4DFP6Cartilage acidic protein 19.73770.6367970.005166
P10909Clusterin25.846140.6294570.000292
B4DZX0Nucleobindin-114.51770.6272940.000278
A0A087X0S5Collagen α-1(VI) chain8.09880.6174610.013995
Q9UBP4Dickkopf-related protein 318.57660.6031690.004542
O00391Sulfhydryl oxidase 19.37770.5982550.003939
P35555Fibrillin-11.99770.5971250.005083
F8W785Golgi integral membrane protein 46.59440.5923850.022707
B4DGD0Amyloid β A4 protein 11.34890.5862160.009153
F5GZ08Amyloid-like protein 115.717100.5826420.011373
O15354Prosaposin receptor2.77220.5677660.016087
P02458Collagen α-1(II) chain3.36550.5645080.025358
A0A087X232Complement C1s subcomponent6.45550.5392720.021601
A0A096LP62Inter-α-trypsin inhibitor heavy chain H57.28550.539030.024978
P81605Dermcidin27.27440.5370860.029414
F5H5G1Limbic system-associated membrane protein6.6220.5286970.007773
Q12841Follistatin-related protein 128.9990.4956660.000459
Q14515SPARC-like protein 111.6770.4948210.001398
Q99574Neuroserpin7.8440.4939370.026239
Q6MZW2Follistatin-related protein 44.51230.4853520.028432
P02649Apolipoprotein E63.7220220.4804890.00203
A0A024RAB6Heparan sulfate proteoglycan 2 (Perlecan)3.8917170.4799966.82E-05
P13521Secretogranin-26.97440.4700640.028148
B4E3Q1Calsyntenin-110.7113130.4400090.008494
B3KX75Neural cell adhesion molecule L1-like protein3.14440.4311030.04737
Q9HCB6Spondin-111.7710100.4127710.000529
B3KXD3Carboxypeptidase E20.4310100.3763810.001059
A0A024R3N3Amyloid β (A4)-like protein 212.68890.371160.001787
B4E367Plexin domain-containing protein 23.69220.3634990.006849
B2R6W4Frizzled-related protein (FRZB)11.69440.2910760.000102
Q9Y5W5Wnt inhibitory factor 110.82440.2904360.009571
Uniprot accession numbers that can be found on www.uniprot.org; Coverage: The percentage of the protein sequence covered by identified peptides. Unique Peptides: The number of peptide sequences unique to a protein group. Peptides: The number of distinct peptide sequences in the protein group. Fold change: The quantity changes of protein abundance between the two groups.

References

  1. Li, Z.; Li, Y.; Huang, X.; Cai, X.Y.; Chen, X.; Li, S.; Huang, Y.S.; Lu, L. Quantitative analysis of rhegmatogenous retinal detachment associated with choroidal detachment in Chinese using UBM. Retina 2012, 32, 2020–2025. [Google Scholar] [CrossRef] [PubMed]
  2. Gottlieb, F. Combined choroidal and retinal detachment. Arch. Ophthalmol. 1972, 88, 481–486. [Google Scholar] [CrossRef] [PubMed]
  3. Jarrett, W.H., 2nd. Rhematogenous retinal detachment complicated by severe intraocular inflammation, hypotony, and choroidal detachment. Trans. Am. Ophthalmol. Soc. 1981, 79, 664–683. [Google Scholar] [PubMed]
  4. Zhu, J.; Xu, X.; Zhang, X. Surgical therapeutic results of rhegmatogenous retinal detachment associated with choroidal detachment. Zhonghua Yan Ke Za Zhi 2002, 38, 135–139. [Google Scholar] [PubMed]
  5. Seelenfreund, M.H.; Kraushar, M.F.; Schepens, C.L.; Freilich, D.B. Choroidal detachment associated with primary retinal detachment. Arch. Ophthalmol. 1974, 91, 254–258. [Google Scholar] [CrossRef] [PubMed]
  6. Rahman, N.; Harris, G.S. Choroidal detachment associated with retinal detachment as a presenting finding. Can. J. Ophthalmol. 1992, 27, 245–248. [Google Scholar] [PubMed]
  7. Kang, J.H.; Park, K.A.; Shin, W.J.; Kang, S.W. Macular hole as a risk factor of choroidal detachment in rhegmatogenous retinal detachment. Korean J. Ophthalmol. 2008, 22, 100–103. [Google Scholar] [CrossRef] [PubMed]
  8. Yang, C.M. Pars plana vitrectomy in the treatment of combined rhegmatogenous retinal detachment and choroidal detachment in aphakic or pseudophakic patients. Ophthalmic Surg. Lasers 1997, 28, 288–293. [Google Scholar] [PubMed]
  9. Dai, Y.; Wu, Z.; Sheng, H.; Zhang, Z.; Yu, M.; Zhang, Q. Identification of inflammatory mediators in patients with rhegmatogenous retinal detachment associated with choroidal detachment. Mol. Vis. 2015, 21, 417–427. [Google Scholar] [PubMed]
  10. Yu, M.; Wu, Z.; Zhang, Z.; Huang, X.; Zhang, Q. Metabolomic analysis of human vitreous in rhegmatogenous retinal detachment associated with choroidal detachment. Investig. Ophthalmol. Vis. Sci. 2015, 56, 5706–5713. [Google Scholar] [CrossRef] [PubMed]
  11. Aggarwal, S.; Yadav, A.K. Dissecting the iTRAQ data analysis. Methods Mol. Biol. 2016, 1362, 277–291. [Google Scholar] [PubMed]
  12. Ashburner, M.; Ball, C.A.; Blake, J.A.; Botstein, D.; Butler, H.; Cherry, J.M.; Davis, A.P.; Dolinski, K.; Dwight, S.S.; Eppig, J.T.; et al. Gene ontology: Tool for the unification of biology. The gene ontology consortium. Nat. Genet. 2000, 25, 25–29. [Google Scholar] [CrossRef] [PubMed]
  13. Janciauskiene, S.M.; Bals, R.; Koczulla, R.; Vogelmeier, C.; Köhnlein, T.; Welte, T. The discovery of α-antitrypsin and its role in health and disease. Respir. Med. 2011, 105, 1129–1139. [Google Scholar] [CrossRef] [PubMed]
  14. Ehlers, M.R. Immune-modulating effects of α-1 antitrypsin. Biol. Chem. 2014, 395, 1187–1193. [Google Scholar] [CrossRef] [PubMed]
  15. Grisanti, S.; Wiedemann, P.; Weller, M.; Heimann, K.; Zilles, K. The significance of complement in proliferative vitreoretinopathy. Investig. Ophthalmol. Vis. Sci. 1991, 32, 2711–2717. [Google Scholar]
  16. Baudouin, C.; Gordon, W.C.; Baudouin, F.; Peyman, G.; Lapalus, P.; Gastaud, P.; Bazan, N.G.; Fredj-Reygrobellet, D. Immunohistologic study of epiretinal membranes in proliferative vitreoretinopathy. Am. J. Ophthalmol. 1990, 110, 593–598. [Google Scholar] [CrossRef]
  17. Walport, M.J. Complement. First of two parts. N. Engl. J. Med. 2001, 344, 1058–1066. [Google Scholar] [PubMed]
  18. Klos, A.; Tenner, A.J.; Johswich, K.O.; Ager, R.R.; Reis, E.S.; Köhl, J. The role of the anaphylatoxins in health and disease. Mol. Immunol. 2009, 46, 2753–2766. [Google Scholar] [CrossRef] [PubMed]
  19. Silasi-Mansat, R.; Zhu, H.; Popescu, N.I.; Peer, G.; Sfyroera, G.; Magotti, P.; Ivanciu, L.; Lupu, C.; Mollnes, T.E.; Taylor, F.B.; et al. Complement inhibition decreases the procoagulant response and confers organ protection in a baboon model of Escherichia coli sepsis. Blood 2010, 116, 1002–1010. [Google Scholar] [CrossRef] [PubMed]
  20. Hack, C.E.; Nuijens, J.H.; Felt-Bersma, R.J.; Schreuder, W.O.; Eerenberg-Belmer, A.J.; Paardekooper, J.; Bronsveld, W.; Thijs, L.G. Elevated plasma levels of the anaphylatoxins C3a and C4a are associated with a fatal outcome in sepsis. Am. J. Med. 1989, 86, 20–26. [Google Scholar] [CrossRef]
  21. Schuerholz, T.; Leuwer, M.; Cobas-Meyer, M.; Vangerow, B.; Kube, F.; Kirschfink, M.; Marx, G. Terminal complement complex in septic shock with capillary leakage: Marker of complement activation? Eur. J. Anaesthesiol. 2005, 22, 541–547. [Google Scholar] [CrossRef] [PubMed]
  22. Norris, L.A. Blood coagulation. Best Pract. Res. Clin. Obstet. Gynaecol. 2003, 17, 369–383. [Google Scholar] [CrossRef]
  23. De Witt, S.M.; Verdoold, R.; Cosemans, J.M.; Heemskerk, J.W. Insights into platelet-based control of coagulation. Thromb. Res. 2014, 133, S139–S148. [Google Scholar] [CrossRef]
  24. O'Brien, M. The reciprocal relationship between inflammation and coagulation. Top. Companion Anim. Med. 2012, 27, 46–52. [Google Scholar] [CrossRef] [PubMed]
  25. Mackman, N. The many faces of tissue factor. J. Thromb. Haemost. 2009, 7, 136–139. [Google Scholar] [CrossRef] [PubMed]
  26. Torzewski, M.; Bhakdi, S. Complement and atherosclerosis-united to the point of no return? Clin. Biochem. 2013, 46, 20–25. [Google Scholar] [CrossRef] [PubMed]
  27. Loukovaara, S.; Loukovaara, S.; Nurkkala, H.; Tamene, F.; Gucciardo, E.; Liu, X.; Repo, P.; Lehti, K.; Varjosalo, M. Quantitative proteomics analysis of vitreous humor from diabetic retinopathy patients. J. Proteome Res. 2015, 14, 5131–5143. [Google Scholar] [CrossRef] [PubMed]
  28. Yu, J.; Liu, F.; Cui, S.J.; Liu, Y.; Song, Z.Y.; Cao, H.; Chen, F.E.; Wang, W.J.; Sun, T.; Wang, F. Vitreous proteomic analysis of proliferative vitreoretinopathy. Proteomics 2008, 8, 3667–3678. [Google Scholar] [CrossRef] [PubMed]
  29. Pathak, M.; Wong, S.S.; Dreveny, I.; Emsley, J. Structure of plasma and tissue kallikreins. Thromb. Haemost. 2013, 110, 423–433. [Google Scholar] [CrossRef] [PubMed]
  30. Schmaier, A.H. The plasma kallikrein-kinin system counterbalances the renin-angiotensin system. J. Clin. Investig. 2002, 109, 1007–1009. [Google Scholar] [CrossRef] [PubMed]
  31. Diamandis, E.P.; Yousef, G.M.; Clements, J.; Ashworth, L.K.; Yoshida, S.; Egelrud, T.; Nelson, P.S.; Shiosaka, S.; Little, S.; Lilja, H.; et al. New nomenclature for the human tissue kallikrein gene family. Clin. Chem. 2000, 46, 1855–1858. [Google Scholar] [PubMed]
  32. Campbell, D.J. The kallikrein-kinin system in humans. Clin. Exp. Pharmacol. Physiol. 2001, 28, 1060–1065. [Google Scholar] [CrossRef] [PubMed]
  33. Ma, J.X.; Song, Q.; Hatcher, H.C.; Crouch, R.K.; Chao, L.; Chao, J. Expression and cellular localization of the kallikrein-kinin system in human ocular tissues. Exp. Eye Res. 1996, 63, 19–26. [Google Scholar] [CrossRef] [PubMed]
  34. Liu, J.; Clermont, A.C.; Gao, B.B.; Feener, E.P. Intraocular hemorrhage causes retinal vascular dysfunction via plasma kallikrein. Investig. Ophthalmol. Vis. Sci. 2013, 54, 1086–1094. [Google Scholar] [CrossRef] [PubMed]
  35. Phipps, J.A.; Clermont, A.C.; Sinha, S.; Chilcote, T.J.; Bursell, S.E.; Feener, E.P. Plasma kallikrein mediates angiotensin II type 1 receptor-stimulated retinal vascular permeability. Hypertension 2009, 53, 175–181. [Google Scholar] [CrossRef] [PubMed]
  36. Yu, J.; Peng, R.; Chen, H.; Cui, C.; Ba, J.; Wang, F. Kininogen 1 and insulin-like growth factor binding protein 6: Candidate serum biomarkers of proliferative vitreoretinopathy. Clin. Exp. Optom. 2014, 97, 72–79. [Google Scholar] [CrossRef] [PubMed]
  37. Cioffi, C.L.; Dobri, N.; Freeman, E.E.; Conlon, M.P.; Chen, P.; Stafford, D.G.; Schwarz, D.M.C.; Golden, K.C.; Zhu, L.; Kitchen, D.B.; et al. Design, synthesis, and evaluation of nonretinoid retinol binding protein 4 antagonists for the potential treatment of atrophic age-related macular degeneration and Stargardt disease. J. Med. Chem. 2014, 57, 7731–7757. [Google Scholar] [CrossRef] [PubMed]
  38. Retina Society Terminology Committee. The classification of retinal detachment with proliferative vitreoretinopathy. Ophthalmology 1983, 90, 121–125. [Google Scholar]
  39. Chiu, K.H.; Chang, Y.H.; Wu, Y.S.; Lee, S.H.; Liao, P.C. Quantitative secretome analysis reveals that COL6A1 is a metastasis-associated protein using stacking gel-aided purification combined with iTRAQ labeling. J. Proteome Res. 2011, 10, 1110–1125. [Google Scholar] [CrossRef] [PubMed]
  40. Kanehisa, M.; Goto, S.; Sato, Y.; Furumichi, M.; Tanabe, M. KEGG for integration and interpretation of large-scale molecular data sets. Nucleic Acids Res. 2012, 40, D109–D114. [Google Scholar] [CrossRef] [PubMed]
Figure 1. Heat map of differentially expressed proteins between rhegmatogenous retinal detachment (RRD) and rhegmatogenous retinal detachment associated with choroidal detachment (RRDCD). The color scale shown at the top illustrates the protein expression fold change of all the samples. Red represents up-regulated protein expression of RRD compared to RRDCD, whereas green represents down-regulated protein expression of RRD compared to RRDCD.
Ijms 17 02052 g001
Figure 2. Gene ontology (GO) annotation of differentially expressed proteins. Most of the proteins of differential abundance analyzed for biological process, molecular function, and cellular component were biological regulation, binding, and extracellular region, respectively.
Ijms 17 02052 g002
Figure 3. Gene ontology (GO) enrichment analysis. The GO terms of most differentially expressed proteins were mainly enriched in extracellular space, followed by biological regulation. Regulation of biological process. The Y axis represent the proportion of differentially expressed proteins. X. Test represents the proportion of differentially expressed proteins related to the GO term in all differentially proteins. X. Ref represents the proportion of proteins related to the GO term in all identified proteins.
Ijms 17 02052 g003
Figure 4. Kyoto encyclopedia of genes and genomes (KEGG) pathway anlaysis of differentially expressed proteins. The complement and coagulation pathway was enriched in the majority of the differentially expressed proteins. The second highly enriched pathway was the systemic lupus erythematosus pathway. The vertical bars represent the number of differentially expressed proteins.
Ijms 17 02052 g004
Figure 5. Enrichment of differentially expressed proteins in Kyoto encyclopedia of genes and genomes (KEGG) pathways. The significant enriched pathways were the complement and coagulation pathway and systemic lupus erythematosus. %Test represents the number of differentially expressed proteins related to the KEGG pathways in all differentially proteins. %Ref represents the number of proteins related to the KEGG pathways in all identified proteins. The vertical bars represent the number of differentially expressed proteins.
Ijms 17 02052 g005
Figure 6. Kyoto encyclopedia of genes and genomes (KEGG) pathway enrichment analysis maps of the complement and coagulation pathway (A) and systemic lupus erythematosus (B). The proteins in red frames are differentially expressed proteins identified in this study. The box represents proteins, the solid arrow means activation, the dash arrow means indirect activation.
Ijms 17 02052 g006aIjms 17 02052 g006b
Figure 7. Western blotting analyses of 4 differentially expressed proteins. Changes in protein abundance shown by Western analysis and quantification of the proteins were highly consistent with the proteomic data of patients. * Represents p < 0.05.
Ijms 17 02052 g007
Table 1. Clinical characteristics of the study population.
Clinical CharacteristicsRRDCDRRDp Values
N = 8N = 8
Sex, n (%)
Males3 (37.5)3 (37.5)1.0
Females5 (62.5)5 (62.5)
Age, y
Median (range)60 (46–65)59.5 (39–65)0.959
Duration of detachments, d
Median (range)8.5 (5–13)13 (7–20)0.065
PVR grade
Mild, A, B180.001
Heavy, C, D70
IOP, mmHg
Median (range)7.75 (6.8–13.4)14 (11.9–17.2)0.002
p Value was calculated by Mann–Whitney U test or Chi-square test. RRDCD: Rhegmatogenous retinal detachment associated with choroidal detachment; RRD: Rhegmatogenous retinal detachment; PVR: Proliferative vitreoretinopathy; A–D: The grade of PVR; IOP: Intraocular pressure; N: Numbers; Y: Years; D: Days.

