
New Abietane and Kaurane Type Diterpenoids from the Stems of Tripterygium regelii

Abstract
:
1. Introduction
2. Results and Discussion
3. Materials and Methods
3.1. General Experimental Procedures
3.2. Plant Material
3.3. Extraction and Isolation
3.4. Structural Characterization
3.5. Calculation Methods of Electronic Circular Dichroism (ECD) Spectra
3.6. Cytotoxicity of Diterpenes against Three Cancer Cell Lines
4. Conclusions
Supplementary Materials
Acknowledgments
Author Contributions
Conflicts of Interest
Abbreviations
| HRESIMS | High resolution electrospray ionization mass spectrometry |
| CD | Circular dichroism |
| UV | Ultraviolet visible |
| IR | Infrared |
| NMR | Nuclear magnetic resonance |
| DEPT | Distortionless enhancement by polarization transfer |
| HSQC | Heteronuclear single quantum coherence |
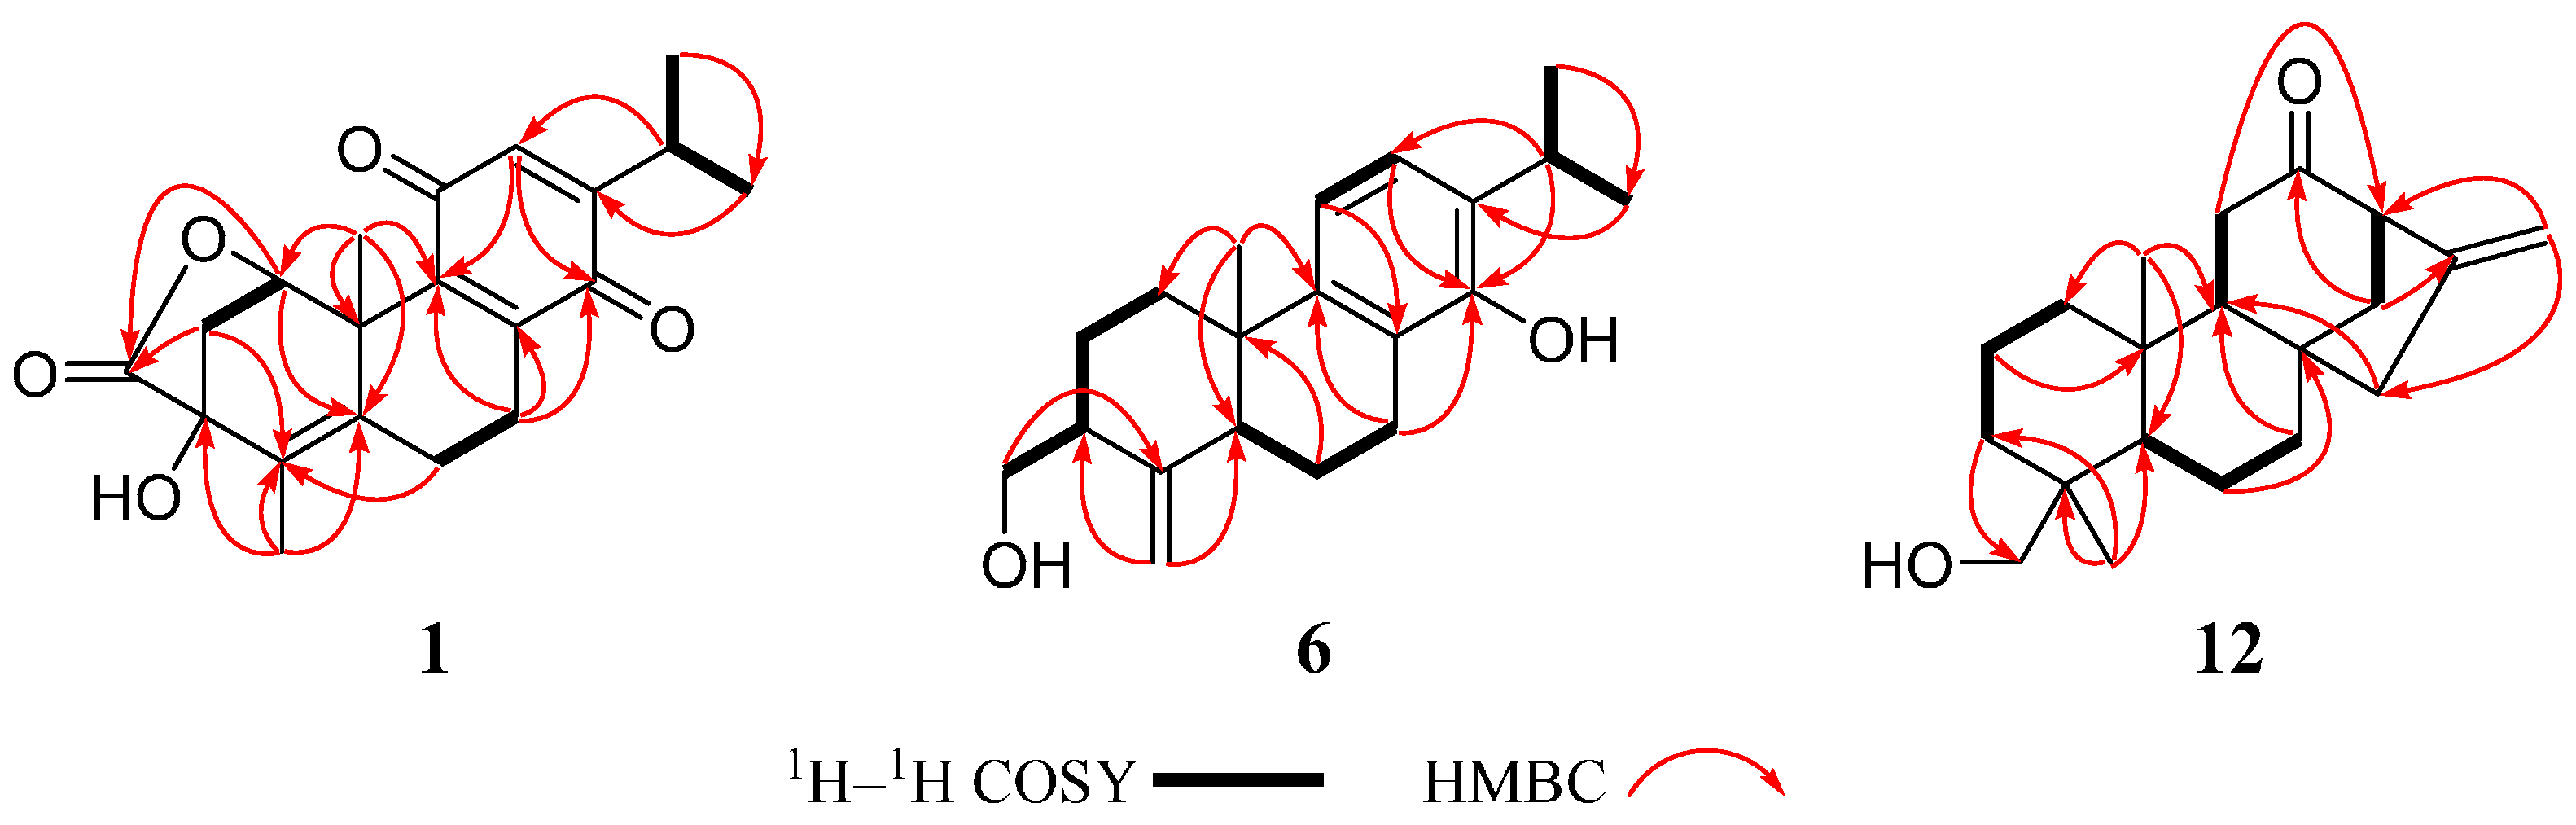
| HMBC | Heteronuclear multiple bond correlation |
| 1H–1H COSY | Proton–proton correlation spectroscopy |
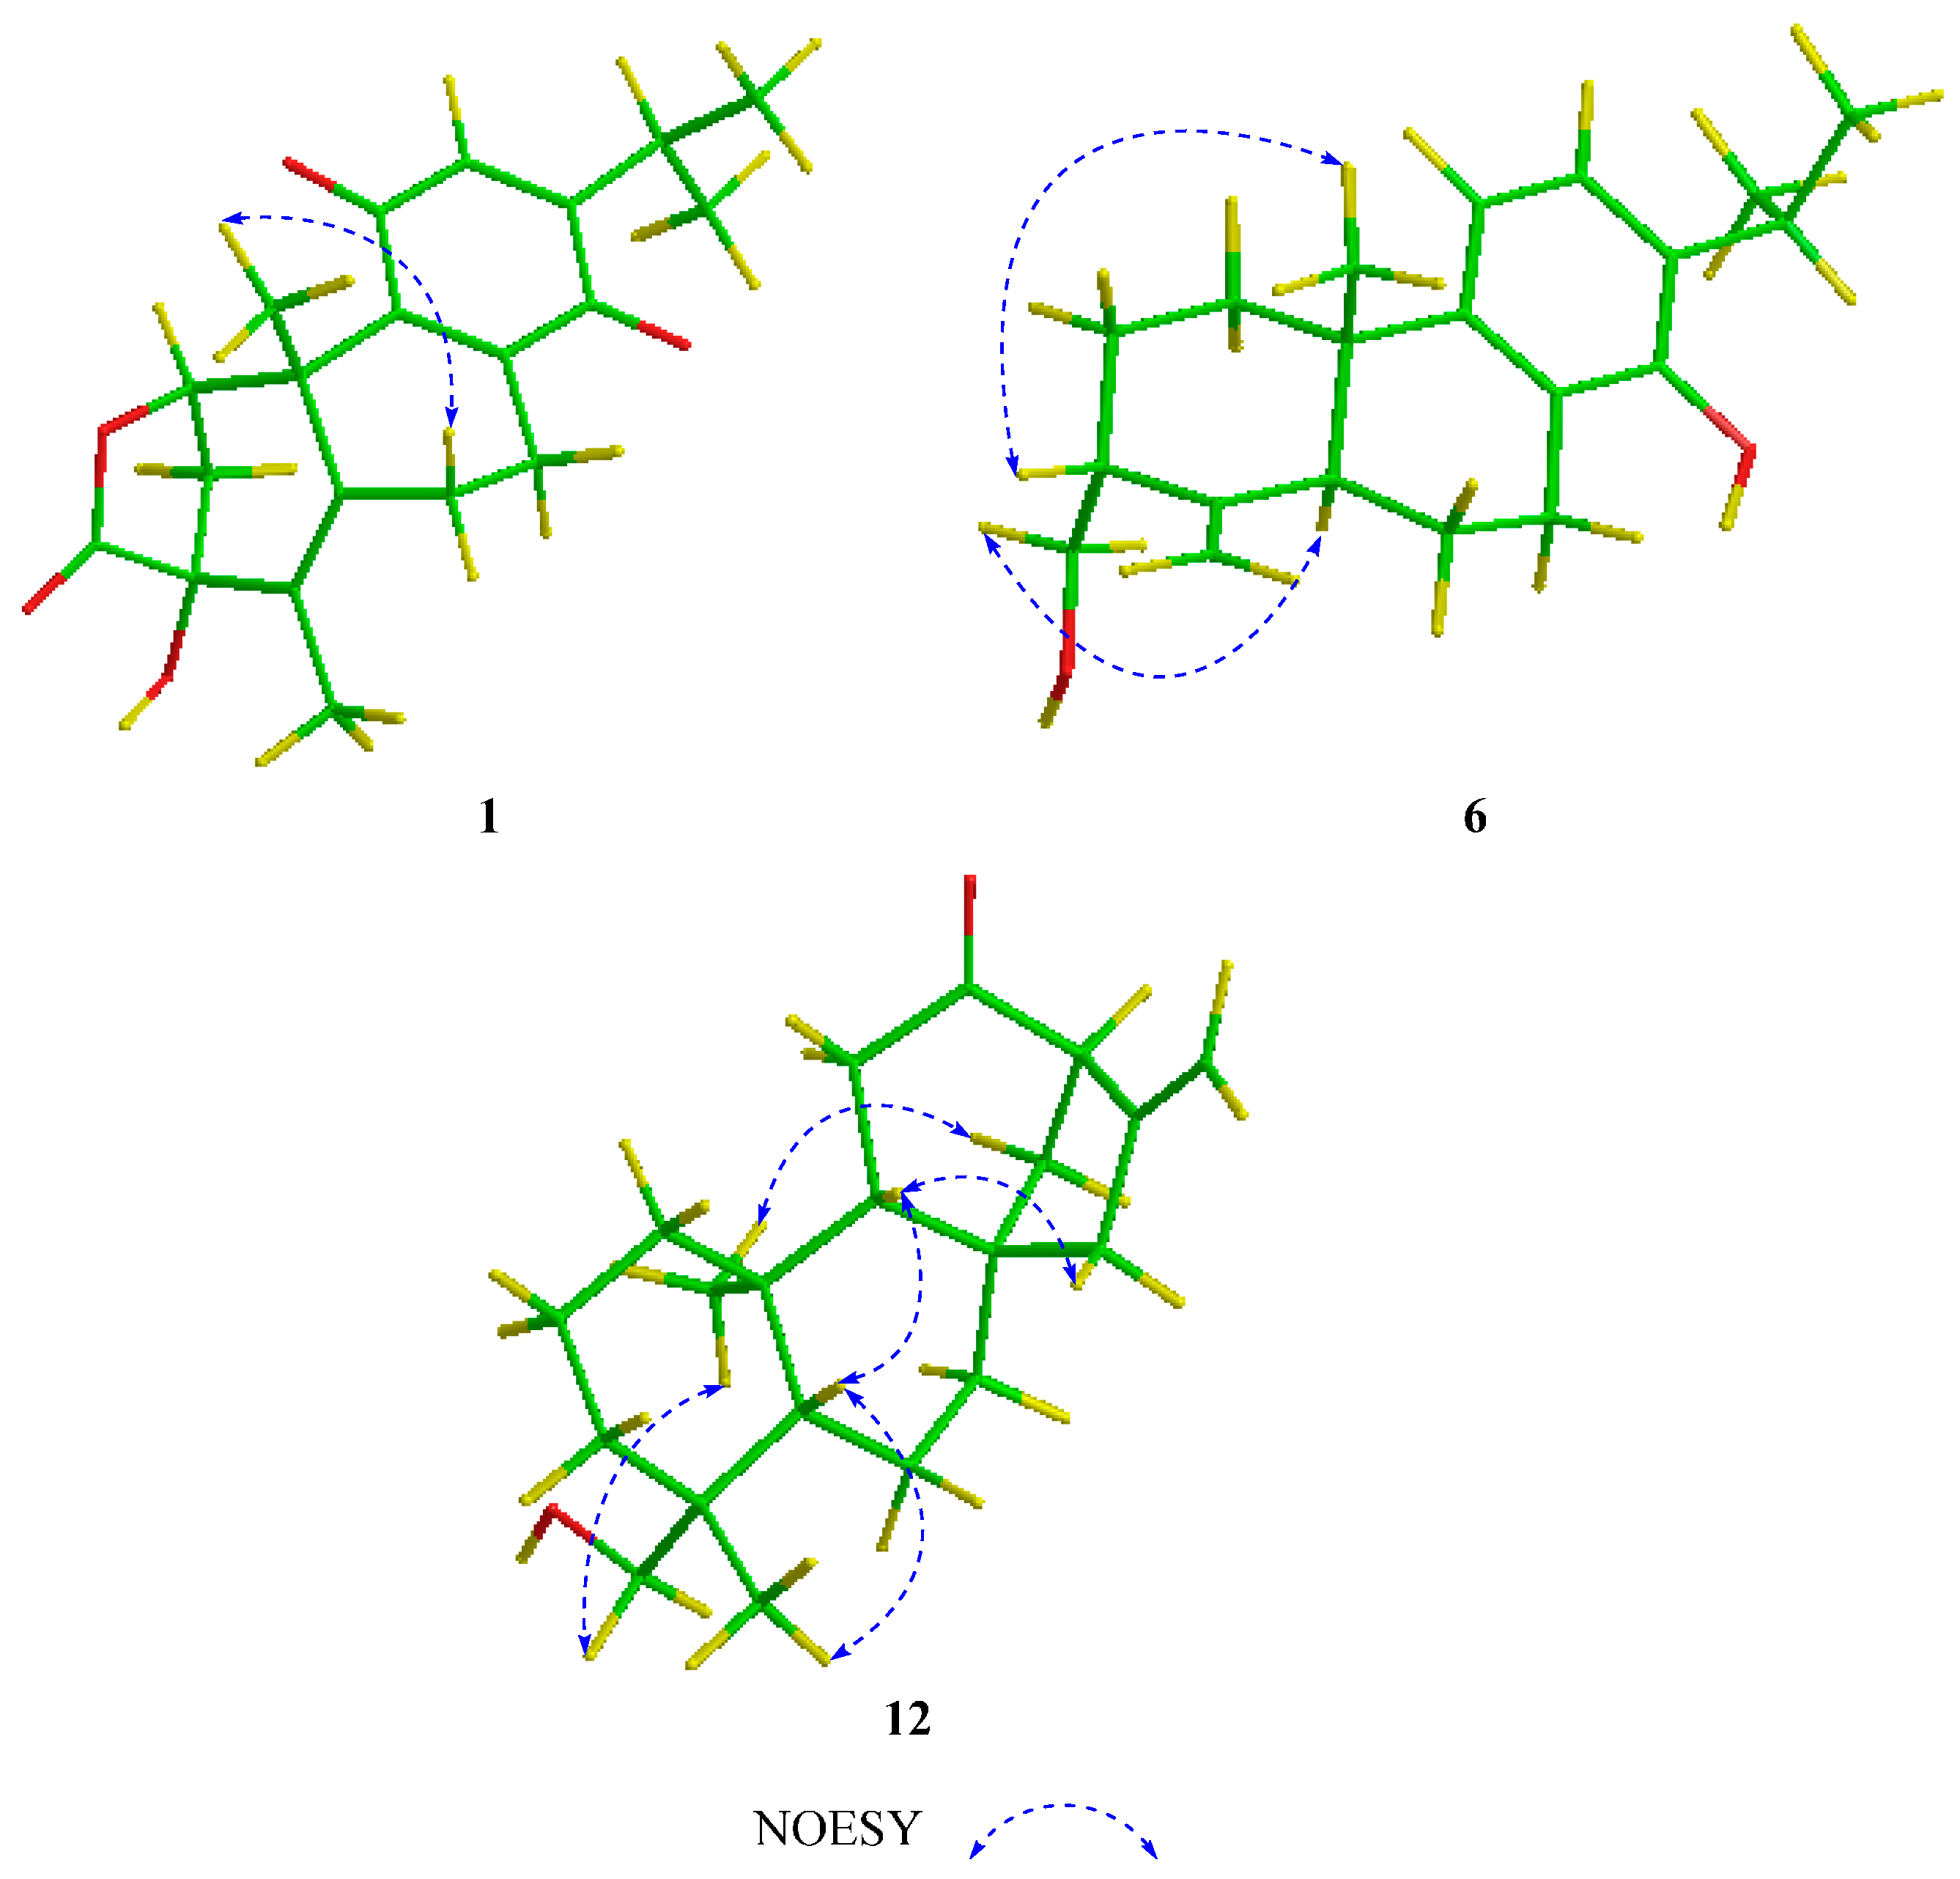
| NOESY | Nuclear Overhauser effect spectroscopy |
References
- Rodríguez, B. 1H and 13C NMR spectral assignments of some natural abietane diterpenoids. Magn. Reson. Chem. 2003, 41, 741–746. [Google Scholar] [CrossRef]
- González, M.A. Aromatic abietane diterpenoids: Their biological activity and synthesis. Nat. Prod. Rep. 2015, 32, 684–704. [Google Scholar] [CrossRef] [PubMed]
- Yang, X.W.; Feng, L.; Li, S.M.; Liu, X.H.; Li, Y.L.; Wu, L.; Shen, Y.H.; Tian, J.M.; Zhang, X.; Liu, X.R. Isolation, structure, and bioactivities of abiesadines A–Y, 25 new diterpenes from Abies georgei orr. Bioorg. Med. Chem. 2010, 18, 744–754. [Google Scholar] [CrossRef] [PubMed]
- Burmistrova, O.; Simões, M.F.T.; Rijo, P.; Quintana, J.; Bermejo, J.; Estévez, F. Antiproliferative activity of abietane diterpenoids against human tumor cells. J. Nat. Prod. 2013, 76, 1413–1423. [Google Scholar] [CrossRef] [PubMed]
- Kafil, V.; Eskandani, M.; Omidi, Y.; Nazemiyeh, H.; Barar, J. Abietane diterpenoid of Salvia sahendica boiss and buhse potently inhibits MCF-7 breast carcinoma cells by suppression of the PI3K/AKT pathway. RSC Adv. 2015, 5, 18041–18050. [Google Scholar] [CrossRef]
- Zhang, G.J.; Li, Y.H.; Jiang, J.D.; Yu, S.S.; Qu, J.; Ma, S.G.; Liu, Y.B.; Yu, D.Q. Anti-coxsackie virus b diterpenes from the roots of Illicium jiadifengpi. Tetrahedron 2013, 69, 1017–1023. [Google Scholar] [CrossRef]
- Zhang, G.J.; Li, Y.H.; Jiang, J.D.; Yu, S.S.; Wang, X.J.; Zhuang, P.Y.; Zhang, Y.; Qu, J.; Ma, S.G.; Li, Y. Diterpenes and sesquiterpenes with anti-coxsackie virus B3 activity from the stems of Illicium jiadifengpi. Tetrahedron 2014, 70, 4494–4499. [Google Scholar] [CrossRef]
- González, M.A.; Zaragozá, R.N.J. Semisynthesis of the antiviral abietane diterpenoid jiadifenoic acid C from callitrisic acid (4-epidehydroabietic acid) isolated from sandarac resin. J. Nat. Prod. 2014, 77, 2114–2117. [Google Scholar] [CrossRef] [PubMed]
- Wang, Y.D.; Zhang, G.J.; Qu, J.; Li, Y.H.; Jiang, J.D.; Liu, Y.B.; Ma, S.G.; Li, Y.; Lv, H.N.; Yu, S.S. Diterpenoids and sesquiterpenoids from the roots of Illicium majus. J. Nat. Prod. 2013, 76, 1976–1983. [Google Scholar] [CrossRef] [PubMed]
- Pferschy-Wenzig, E.M.; Kunert, O.; Presser, A.; Bauer, R. In vitro anti-inflammatory activity of larch (Larix decidua L.) sawdust. J. Agric. Food Chem. 2008, 56, 11688–11693. [Google Scholar] [CrossRef] [PubMed]
- Efferth, T.; Kahl, S.; Paulus, K.; Adams, M.; Rauh, R.; Boechzelt, H.; Hao, X.; Kaina, B.; Bauer, R. Phytochemistry and pharmacogenomics of natural products derived from traditional chinese medicine and chinese materia medica with activity against tumor cells. Mol. Cancer Ther. 2008, 7, 152–161. [Google Scholar] [CrossRef] [PubMed]
- Johnson, J.J. Carnosol: A promising anti-cancer and anti-inflammatory agent. Cancer Lett. 2011, 305, 1–7. [Google Scholar] [CrossRef] [PubMed]
- Zhou, Z.L.; Yang, Y.X.; Ding, J.; Li, Y.C.; Miao, Z.H. Triptolide: Structural modifications, structure-activity relationships, bioactivities, clinical development and mechanisms. Nat. Prod. Rep. 2012, 29, 457–475. [Google Scholar] [CrossRef]
- Zhou, X.; Wang, Y.; Lee, W.Y.; Or, P.M.; Wan, D.C.; Kwan, Y.W.; Yeung, J.H. Miltirone is a dual inhibitor of P-glycoprotein and cell growth in doxorubicin-resistant hepG2 cells. J. Nat. Prod. 2015, 78, 2266–2275. [Google Scholar] [CrossRef] [PubMed]
- Fan, D.; Zhu, G.Y.; Chen, M.; Xie, L.M.; Jiang, Z.H.; Xu, L.; Bai, L.P. Dihydro-β-agarofuran sesquiterpene polyesters isolated from the stems of Tripterygium regelii. Fitoterapia 2016, 112, 1–8. [Google Scholar] [CrossRef] [PubMed]
- Fan, D.; Parhira, S.; Zhu, G.Y.; Jiang, Z.H.; Bai, L.P. Triterpenoids from the stems of Tripterygium regelii. Fitoterapia 2016, 113, 69–73. [Google Scholar] [CrossRef] [PubMed]
- Fan, D.; Zhu, G.Y.; Li, T.; Jiang, Z.H.; Bai, L.P. Dimacrolide sesquiterpene pyridine alkaloids from the stems of Tripterygium regelii. Molecules 2016, 21, 1146. [Google Scholar] [CrossRef] [PubMed]
- Shishido, K.; Nakano, K.; Wariishi, N.; Tateishi, H.; Omodani, T.; Shibuya, M.; Goto, K.; Ono, Y.; Takaishi, Y. Tripterygium wilfordii var. Regelii which are interleukin-1 inhibitors. Phytochemistry 1994, 35, 731–737. [Google Scholar] [CrossRef]
- Xu, Y.; Ma, Y.; Zhou, L.; Sun, H. Abietane quinones from Rabdosia lophanthoides. Phytochemistry 1988, 27, 3681–3682. [Google Scholar] [CrossRef]
- Becke, A.D. A new mixing of hartree—Fock and local density-functional theories. J. Chem. Phys. 1993, 98, 1372–1377. [Google Scholar] [CrossRef]
- Godbout, N.; Salahub, D.R.; Andzelm, J.; Wimmer, E. Optimization of gaussian-type basis sets for local spin density functional calculations. Part I. Boron through neon, optimization technique and validation. Can. J. Chem. 1992, 70, 560–571. [Google Scholar] [CrossRef]
- Shen, Q.; Takaishi, Y.; Zhang, Y.W.; Duan, H.Q. Immunosuppressive terpenoids from Tripterygium wilfordii. Chin. Chem. Lett. 2008, 19, 453–456. [Google Scholar] [CrossRef]
- Takaishi, Y.; Wariishi, N.; Tateishi, H.; Kawazoe, K.; Miyagi, K.; Li, K.; Duan, H. Phenolic diterpenes from Tripterygium wilfordii var. Regelii. Phytochemistry 1997, 45, 979–984. [Google Scholar] [CrossRef]
- Zhou, B.; Zhu, D.; Deng, F.; Huang, C.; Kutney, J.P.; Roberts, M. Studies on new components and stereochemistry of diterpenoids from Trypterygium wilfordii. Planta Med. 1988, 54, 330–332. [Google Scholar] [CrossRef] [PubMed]
- Pacheco, A.G.; Machado de Oliveira, P.; Piló-Veloso, D.; Flávio de Carvalho Alcântara, A. 13C-NMR data of diterpenes isolated from Aristolochia species. Molecules 2009, 14, 1245–1262. [Google Scholar] [CrossRef] [PubMed] [Green Version]
- Gonzalez, A.G.; Fraga, B.M.; Hernandez, M.G.; Hanson, J.R. The 13C NMR spectra of some ent-18-hydroxykaur-16-enes. Phytochemistry 1981, 20, 846–847. [Google Scholar] [CrossRef]
- Bohlmann, F.; Rao, N. Natürlich vorkommende Terpen-Derivate, XXI. Über die Inhaltsstoffe von Anona squamosa L. Chem. Ber. 1973, 106, 841–844. [Google Scholar] [CrossRef]
- Duan, H.; Takaishi, Y.; Momota, H.; Ohmoto, Y.; Taki, T.; Jia, Y.; Li, D. Immunosuppressive diterpenoids from Tripterygium wilfordii. J. Nat. Prod. 1999, 62, 1522–1525. [Google Scholar] [CrossRef] [PubMed]
- Morota, T.; Qin, W.Z.; Takagi, K.; Xu, L.H.; Maruno, M.; Yang, B.H. Diterpenoids from Tripterigium wilfordii. Phytochemistry 1995, 40, 865–870. [Google Scholar] [CrossRef]
- Duan, H.; Kawazoe, K.; Bando, M.; Kido, M.; Takaishi, Y. Di-and triterpenoids from Tripterygium hypoglaucum. Phytochemistry 1997, 46, 535–543. [Google Scholar] [CrossRef]
- Zhou, W.; Xie, H.; Wu, P.; Wei, X. Abietane diterpenoids from Isodon lophanthoides var. Graciliflorus and their cytotoxicity. Food Chem. 2013, 136, 1110–1116. [Google Scholar] [CrossRef] [PubMed]
- Gaussian 09; Revision A. 1; Gaussian Inc.: Wallingford, CT, USA, 2009.
- Berova, N.; di Bari, L.; Pescitelli, G. Application of electronic circular dichroism in configurational and conformational analysis of organic compounds. Chem. Soc. Rev. 2007, 36, 914–931. [Google Scholar] [CrossRef] [PubMed]


| Position | δH (J in Hz) | |||||
|---|---|---|---|---|---|---|
| 1 a | 2 a | 3 a | 4 a | 5 a | 12 a | |
| 1 | 5.86, d (6.0) | 1.45, m c | 1.89, ddd (14.4, 10.2, 5.4) | 1.90, m | 1.65, m | 0.79, td (13.2, 3.6) |
| - | 2.77, m c | 2.80, ddd (14.4, 9.0, 6.0) c | 2.75, m c | 2.77, m c | 1.79, m c | |
| 2 | 1.96, d (10.8) | 2.46, m | 2.46, m c | 2.45, m c | 2.52, ddd (15.6, 6.6, 3.6) | 1.43, dt (13.8, 3.6) |
| 2.36, m c | 2.55, m | 2.73, ddd (16.2, 10.2, 6.0) c | 2.75, m c | 3.03, ddd (15.6, 7.2, 3.6) c | 1.55, m c | |
| 3 | - | - | - | - | - | 0.95, dd (13.8, 4.2) |
| - | - | - | - | - | 1.79, m c | |
| 5 | - | 2.22, m c | 2.46, d (13.8) c | 2.47, d (13.8) c | 1.78, dd (12.6, 1.8) | 1.00, m c |
| 6 | 2.16, m | 1.50, m c | 1.65, td (13.8, 4.2) | 1.41, td (13.8, 3.0) | 1.59, m | 1.36, qd (12.6, 3.6) |
| 2.76, dd (13.2, 6.0) | 2.24, m c | 1.96, br d (13.8) | 2.02, dt (13.8, 1.8) | 1.96, br d, d (13.2, 7.2) | 1.72, m c | |
| 7 | 2.37, m c | 2.39, ddd (18.6, 11.4, 7.2) | 4.81, br s | 4.39, dd (3.0, 1.8) | 2.34, ddd (18.6, 12.0, 7.2) | 1.62, dd (13.8, 4.8) |
| 2.90, dd (19.8, 6.0) | 2.80, m | - | - | 2.81, m c | 1.72, m c | |
| 9 | - | - | - | - | - | 1.58, m c |
| 11 | - | - | - | - | - | 2.24, d (17.0) |
| - | - | - | - | - | 2.53, dd (17.0, 9.6) | |
| 12 | 6.41, d (1.2) | 6.47, s | 6.44, s | 6.42, d (1.2) | 6.37, d (1.2) | |
| 13 | - | - | - | - | - | 3.21, d (4.8) |
| 14 | - | - | - | - | - | 1.51, dd (12.6, 4.8) |
| - | - | - | - | - | 2.40, d (12.6) | |
| 15 | 3.00, sept d (6.6, 1.2) | 3.12, m | 3.02, sept (7.0) | 3.04, sept d (7.2, 1.2) | 3.00, d (7.2) c | 2.36, s |
| 16 | 1.12, d (6.6) | 1.17, d (7.2) | 1.14, d (7.0) | 1.12, d (7.2) | 1.10, d (7.2) | - |
| 17 | 1.11, d (6.6) | 3.67, d (7.2) | 1.13, d (7.0) | 1.13, d (7.2) | 1.11, d (7.2) | 4.87, s |
| - | - | - | - | - | 4.99, s | |
| 18 | - | - | 1.37, s | 1.36, s | 1.22, s | 0.98, s |
| 19 | 1.85, s | 2.11, s | 3.47, t (10.8) | 3.44, d (12.0) | 4.56, d (12.0) | 3.68, dd (10.1, 4.0) |
| - | - | 4.02, dd (10.8, 2.4) | 4.05, d (12.0) | 4.08, d (12.0) | 3.44, dd (10.1, 4.0) | |
| 20 | 1.54, s | 1.18, s | 1.24, s | 1.22, s | 1.44, s | 0.85, s |
| OH-7 | - | - | 2.77, s c | - | - | - |
| OH-19 | - | - | 3.15, dd (10.8, 2.4) | 3.26, br s | - | 1.09, br s |
| OMe-7 | - | - | - | 3.50, s | - | - |
| OAc-19 | - | - | - | - | 2.03, s | - |
| Position | δC, Type | |||||||||||
|---|---|---|---|---|---|---|---|---|---|---|---|---|
| 1 a | 2 a | 3 a | 4 a | 5 a | 6 a | 7 a | 8 a | 9 a | 10 a | 11 b | 12 a | |
| 1 | 78.4, CH | 31.8, CH2 | 34.1, CH2 | 34.1, CH2 | 34.7, CH2 | 38.2, CH2 | 35.1, CH2 | 35.1, CH2 | 34.5, CH2 | 36.2, CH2 | 32.8, CH2 | 39.7, CH2 |
| 2 | 39.1, CH2 | 24.6, CH2 | 34.2, CH2 | 34.2, CH2 | 34.9, CH2 | 27.4, CH2 | 35.3, CH2 | 34.8, CH2 | 28.3, CH2 | 28.1, CH2 | 27.0, CH2 | 17.8, CH2 |
| 3 | 74.3, C | 147.9, C | 220.4, C | 220.8, C | 212.4, C | 46.1, CH | 214.8, C | 219.0, C | 79.7, CH | 79.9, CH | 74.8, CH | 35.5, CH2 |
| 4 | 130.2, C | 124.5, C | 49.9, C | 49.7, C | 51.3, C | 150.8, C | 53.0, C | 50.3, C | 42.8, C | 42.3, C | 38.3, C | 38.6, C |
| 5 | 132.6, C | 47.3, CH | 45.2, CH | 44.9, CH | 52.9, CH | 47.9, CH | 51.5, CH | 49.4, CH | 49.6, CH | 48.8, CH | 44.0, CH | 56.2, CH |
| 6 | 22.2, CH2 | 18.7, CH2 | 26.1, CH2 | 22.5, CH2 | 18.5, CH2 | 20.8, CH2 | 124.0, CH | 35.6, CH2 | 35.5, CH2 | 35.7, CH2 | 18.9, CH2 | 20.2, CH2 |
| 7 | 27.0, CH2 | 25.2, CH2 | 61.9, CH | 69.8, CH | 26.0, CH2 | 23.7, CH2 | 122.1, CH | 204.3, C | 205.6, C | 205.2, C | 25.1, CH2 | 39.4, CH2 |
| 8 | 146.0, C | 142. 6, C | 140.9, C | 139.3, C | 142.8, C | 120.7, C | 113.6, C | 114.9, C | 115.1, C | 114.2, C | 119.7, C | 44.1, C |
| 9 | 144.6, C | 149.0, C | 148.7, C | 148.6, C | 148.0, C | 145.8, C | 145.2, C | 133.1, C | 134.7, C | 153.1, C | 150.0, C | 57.6, CH |
| 10 | 44.7, C | 36.6, C | 37.5, C | 37.3, C | 37.6, C | 39.7, C | 37.7, C | 38.3, C | 39.5, C | 37.5, C | 37.9, C | 39.2, C |
| 11 | 187.3, C | 187.4, C | 187.8, C | 187.9, C | 187.5, C | 117.6, CH | 98.4, CH | 144.5, C | 144.2, C | 113.6, CH | 108.8, CH | 35.9, CH2 |
| 12 | 131.6, CH | 134.0, CH | 132.4, CH | 131.8, CH | 132.0, CH | 123.3, CH | 158.3, C | 123.8, CH | 123.9, CH | 133.6, CH | 156.5, C | 211.5, C |
| 13 | 153.9, C | 149.0, C | 153.6, C | 154.0, C | 153.3, C | 130.3, C | 119.6, C | 136.6, C | 136.3, C | 134.9, C | 125.1, C | 60.7, CH |
| 14 | 186.8, C | 188.1, C | 188.7, C | 186.4, C | 187.4, C | 150.3, C | 150.3, C | 155.4, C | 155.7, C | 160.7, C | 156.9, C | 39.4, CH2 |
| 15 | 26.6, CH | 34.5, CH | 26.4, CH | 26.5, CH | 26.4, CH | 26.9, CH | 24.3, CH | 26.0, CH | 26.0, CH | 26.1, CH | 26.1, CH | 48.2, CH |
| 16 | 21.3, CH3 | 15.4, CH3 | 21.3, CH3 | 21.3, CH3 | 21.3, CH3 | 22.6, CH3 | 20.9, CH3 | 22.1, CH3 | 22.1, CH3 | 22.1, CH3 | 21.6, CH3 | 148.8, C |
| 17 | 21.4, CH3 | 66.6, CH2 | 21.3, CH3 | 21.4, CH3 | 21.3, CH3 | 22.8, CH3 | 20.9, CH3 | 22.2, CH3 | 22.2, CH3 | 22.3, CH3 | 21.7, CH3 | 107.8, CH2 |
| 18 | 177.3, C | 173.7, C | 22.3, CH3 | 22.3, CH3 | 21.8, CH3 | 64.7, CH2 | 19.7, CH3 | 22.6, CH3 | 22.4, CH3 | 22.0, CH3 | 29.1, CH3 | 26.9, CH3 |
| 19 | 11.8, CH3 | 18.5, CH3 | 65.7, CH2 | 65.8, CH2 | 65.7, CH2 | 104.5, CH2 | 65.9, CH2 | 65.5, CH2 | 63.7, CH2 | 63.7, CH2 | 22.4, CH3 | 65.4, CH2 |
| 20 | 23.7, CH3 | 19.2, CH3 | 19.7, CH3 | 20.0, CH3 | 20.2, CH3 | 22.5, CH3 | 20.3, CH3 | 18.3, CH3 | 18.3, CH3 | 24.2, CH3 | 25.2, CH3 | 16.4, CH3 |
| OMe-7 | - | - | - | 57.9, CH3 | - | - | - | - | - | - | - | - |
| OMe-12 | - | - | - | - | - | - | 55.7, CH3 | - | - | - | - | - |
| OMe-14 | - | - | - | - | - | - | - | - | - | - | 60.5, CH3 | - |
| OAc-19 | - | - | - | - | 20.9, CH3 | - | - | - | - | - | - | - |
| - | - | - | - | 170.8, C | - | - | - | - | - | - | - | |
| Position | δH (J in Hz) | |||||
|---|---|---|---|---|---|---|
| 6 a | 7 a | 8 a | 9 a | 10 a | 11 b | |
| 1 | 1.63, td (13.2, 4.2) | 2.14, td (13.2, 5.4) | 2.07, ddd (16.2, 9.6, 4.8) | 1.50, td (13.8, 3.6) | 1.70, td (13.8, 4.2) | 1.97, dt (12.6, 3.6) |
| 2.32, dt (13.2, 4.2) | 2.48, ddd (12.6, 6.0, 3.0) | 3.31, m c | 3.34, dt (13.8, 3.6) | 2.36, dt (13.8, 3.0) | 2.38, td (13.2, 3.6) | |
| 2 | 1.43, qd (13.0, 4.2) | 2.61, ddd (15.6, 5.4, 3.0) | 2.54, ddd (15.6, 8.4, 7.2) | 1.89, m c | 1.98, m | 1.87, m c |
| 1.92, m c | 2.83, ddd (15.6, 13.2, 6.0) | 2.74, m c | 2.02, m | 2.04, m | 2.10, tt (14.4, 3.6) | |
| 3 | 2.20, m c | - | - | 3.56, dd (11.4, 3.6) | 3.55, dd (11.4, 3.6) | 3.68, q (3.6) |
| 5 | 2.17, d (12.6) c | 2.69, t (3.0) | 2.64, d (15.0) c | 1.91, dd (14.4, 2.4) c | 1.94, dd (14.4, 3.6) | 2.22, dd (12.6, 2.4) |
| 6 | 1.81, qd (12.6, 6.0) | 5.86, dd (10.2, 3.0) | 2.63, d (16.2) | 2.64, dd (16.8, 14.4) | 2.67, dd (18.0, 14.4) | 1.88, m c |
| 1.95, m c | - | 2.72, m c | 2.74, dd (16.8, 2.4) | 2.80, dd (18.0, 3.6) | 1.72, m c | |
| 7 | 2.61, ddd (16.4, 12.6, 7.2) | 6.82, dd (10.2, 3.0) | - | - | - | 2.81, ddd (16.2, 11.4, 7.8) |
| 2.87, dd (16.4, 6.0) | - | - | - | - | 3.13, dd (16.2, 6.6) | |
| 11 | 6.90, d (7.8) | 6.34, s | - | - | 6.74, d (7.8) | 7.07, s |
| 12 | 7.04, d (7.8) | - | 6.83, s | 6.77, s | 7.36, d (7.8) | - |
| 15 | 3.15, sept (7.2) | 3.44, sept (7.2) | 3.32, sept (6.6) c | 3.30, sept (6.6) | 3.32, sept (6.6) | 3.76, sept (7.2) |
| 16 | 1.26, d (7.2) | 1.33, d (7.2) | 1.20, d (6.6) | 1.18, d (6.6) | 1.22, d (6.6) | 1.72, d (7.2) c |
| 17 | 1.25, d (7.2) | 1.33, d (7.2) | 2.21, d (6.6) | 1.20, d (6.6) | 1.20, d (6.6) | 1.68, d (7.2) |
| 18 | 3.70, dd (10.8, 6.0) | 1.27, s | 1.35, s | 1.30, s | 1.29, s | 1.27, s |
| 3.95, dd (10.8, 6.0) | - | - | - | - | - | |
| 19 | 4.77, s | 3.84, d (12.0, 4.8) | 3.54, d (11.4) | 3.42, dd (11.4, 9.0) | 3.50, dd (11.4, 7.8) | 0.96, s |
| 4.86, s | 4.14, d (12.0) | 4.06, d (11.4) | 4.35, d (11.4) | 4.36, d (11.4) | - | |
| 20 | 0.99, s | 1.21, s | 1.42, s | 1.35, s | 1.19, s | 1.25, s |
| OH-3 | - | - | - | - | 2.56, s | 5.69, d (3.6) |
| OH-11 | - | - | 4.62, s | 4.47, s | - | - |
| OH-12 | - | - | - | - | - | 10.80, s |
| OH-14 | - | 4.90, s | 12.79, s | 12.96, s | 13.07, s | - |
| OH-19 | - | 1.77, br s | 2.96, s | 2.80, br d (9.0) | 2.83, br d (7.8) | - |
| OMe-12 | - | 3.80, s | - | - | - | - |
| OMe-14 | - | - | - | - | - | 3.72, s |
| Compounds * | IC50 (µM) against A2780 | IC50 (µM) against HepG2 | IC50 (µM) against MCF-7 |
|---|---|---|---|
| 9 | 5.88 ± 2.22 | 11.74 ± 1.92 | 46.40 ± 3.54 |
| 11 | >100 | >100 | 26.70 ± 5.57 |
| 14 | 65.80 ± 21.53 | 35.45 ± 8.23 | 64.80 ± 24.90 |
| taxol | 0.006 ± 0.001 | 0.003 ± 0.0002 | 0.005 ± 0.001 |
© 2017 by the authors; licensee MDPI, Basel, Switzerland. This article is an open access article distributed under the terms and conditions of the Creative Commons Attribution (CC-BY) license (http://creativecommons.org/licenses/by/4.0/).
Share and Cite
Fan, D.; Zhou, S.; Zheng, Z.; Zhu, G.-Y.; Yao, X.; Yang, M.-R.; Jiang, Z.-H.; Bai, L.-P. New Abietane and Kaurane Type Diterpenoids from the Stems of Tripterygium regelii. Int. J. Mol. Sci. 2017, 18, 147. https://doi.org/10.3390/ijms18010147
Fan D, Zhou S, Zheng Z, Zhu G-Y, Yao X, Yang M-R, Jiang Z-H, Bai L-P. New Abietane and Kaurane Type Diterpenoids from the Stems of Tripterygium regelii. International Journal of Molecular Sciences. 2017; 18(1):147. https://doi.org/10.3390/ijms18010147
Chicago/Turabian StyleFan, Dongsheng, Shuangyan Zhou, Zhiyuan Zheng, Guo-Yuan Zhu, Xiaojun Yao, Ming-Rong Yang, Zhi-Hong Jiang, and Li-Ping Bai. 2017. "New Abietane and Kaurane Type Diterpenoids from the Stems of Tripterygium regelii" International Journal of Molecular Sciences 18, no. 1: 147. https://doi.org/10.3390/ijms18010147