Article

Clinically Isolated Syndrome According to McDonald 2010: Intrathecal IgG Synthesis Still Predictive for Conversion to Multiple Sclerosis

1
Clinical Neuroimmunology and Neurochemistry, Department of Neurology, Hannover Medical School, 30625 Hannover, Germany
2
Department of Diagnostic and Interventional Neuroradiology, Hannover Medical School, 30625 Hannover, Germany
3
Department of Neurology, University Clinic Essen, 45147 Essen, Germany
*
Author to whom correspondence should be addressed.
Int. J. Mol. Sci. 2017, 18(10), 2061; https://doi.org/10.3390/ijms18102061
Submission received: 30 August 2017 / Revised: 20 September 2017 / Accepted: 22 September 2017 / Published: 27 September 2017
(This article belongs to the Special Issue Advances in Multiple Sclerosis 2017)

Abstract

:
While the revised McDonald criteria of 2010 allow for the diagnosis of multiple sclerosis (MS) in an earlier stage, there is still a need to identify the risk factors for conversion to MS in patients with clinically isolated syndrome (CIS). Since the latest McDonald criteria were established, the prognostic role of cerebrospinal fluid (CSF) and visual evoked potentials (VEP) in CIS patients is still poorly defined. We conducted a monocentric investigation including patients with CIS in the time from 2010 to 2015. Follow-ups of 120 patients revealed that 42% converted to MS. CIS patients with positive oligoclonal bands (OCB) were more than twice as likely to convert to MS as OCB negative patients (hazard ratio = 2.6). The probability to develop MS was even higher when a quantitative intrathecal IgG synthesis was detected (hazard ratio = 3.8). In patients with OCB, VEP did not add further information concerning the conversion rate to MS. In patients with optic neuritis and negative OCB, a significantly higher rate converted to MS when VEP were delayed. In conclusion, the detection of an intrathecal IgG synthesis increases the conversion probability to MS. Pathological VEP can help to predict the conversion rate to MS in patients with optic neuritis without an intrathecal IgG synthesis.

Graphical Abstract

1. Introduction

A clinically isolated syndrome (CIS) is defined as a first episode of neurological symptoms caused by inflammation leading to demyelination in the central nervous system (CNS) [1,2]. Multiple sclerosis (MS), as a chronic inflammatory CNS disease, begins in approximately 85% of patients with such an acute clinical episode [1,2,3]. According to the latest revision of the McDonald criteria for the diagnosis of MS from 2010, patients can be diagnosed with MS after a single clinical episode when cranial magnetic resonance imaging (MRI) detects CNS lesions in typical CNS areas together with an asymptomatic contrast enhancing lesion, thus fulfilling the criteria of dissemination in space and time [4]. However, around 60–70% of patients with a first clinical episode do not fulfill these MS diagnosis criteria [1,5]. Since an early disease modifying immunomodulatory treatment is considered to be beneficial in patients who are at high risk to develop MS, it is essential to identify the predictive factors to anticipate the conversion from CIS to MS [6,7]. CSF inflammatory changes and delayed evoked potentials are characteristic findings in patients with a demyelinating disease [8]. Visual evoked potentials as an easy method to examine a demyelinating disease are considered to have a diagnostic value and can deliver prognostic information on the disease course [9,10,11,12,13]. An intrathecal synthesis of IgG antibodies in the form of oligoclonal bands (OCB) is typical and highly prevalent in MS patients, but can also be observed in CIS patients [14]. In a recent study which applied the Poser criteria to diagnose MS, the presence of OCB has been identified as one of the strongest independent predictors for MS [3]. Another study confirmed the crucial role of OCB for prognosis of CIS patients when applying the McDonald criteria of 2010 [15]. Because the prognostic role of CSF findings in patients with CIS according to the latest McDonald criteria is still poorly defined, we performed a thorough evaluation of CSF parameters. Furthermore, the role of visual evoked potential as an additional prognostic marker was investigated.

2. Results

A follow-up of 120 patients with CIS revealed that 50 patients (42%) converted to MS according to the McDonald criteria of 2010, while 70 patients (58%) were assessed as stable CIS (Table 1). MS was diagnosed due to a second clinical relapse in 28 patients (56% in the MS group), while 22 patients presented new CNS lesions on follow-up MRI. The median conversion time for MS was 11 months (range 2–66). The follow-up time of patients with stable CIS was between 24 and 87 months (median 47 months).
Patients with the brainstem symptoms and spinal cord symptoms as a first clinical episode converted significantly more frequently to MS during follow-up than showing a stable course (Table 1). The majority of patients diagnosed with optic neuritis as the first clinical episode showed a stable course and only 27% of patients converted to MS.

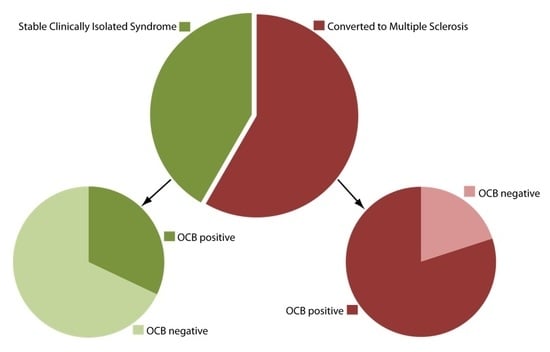
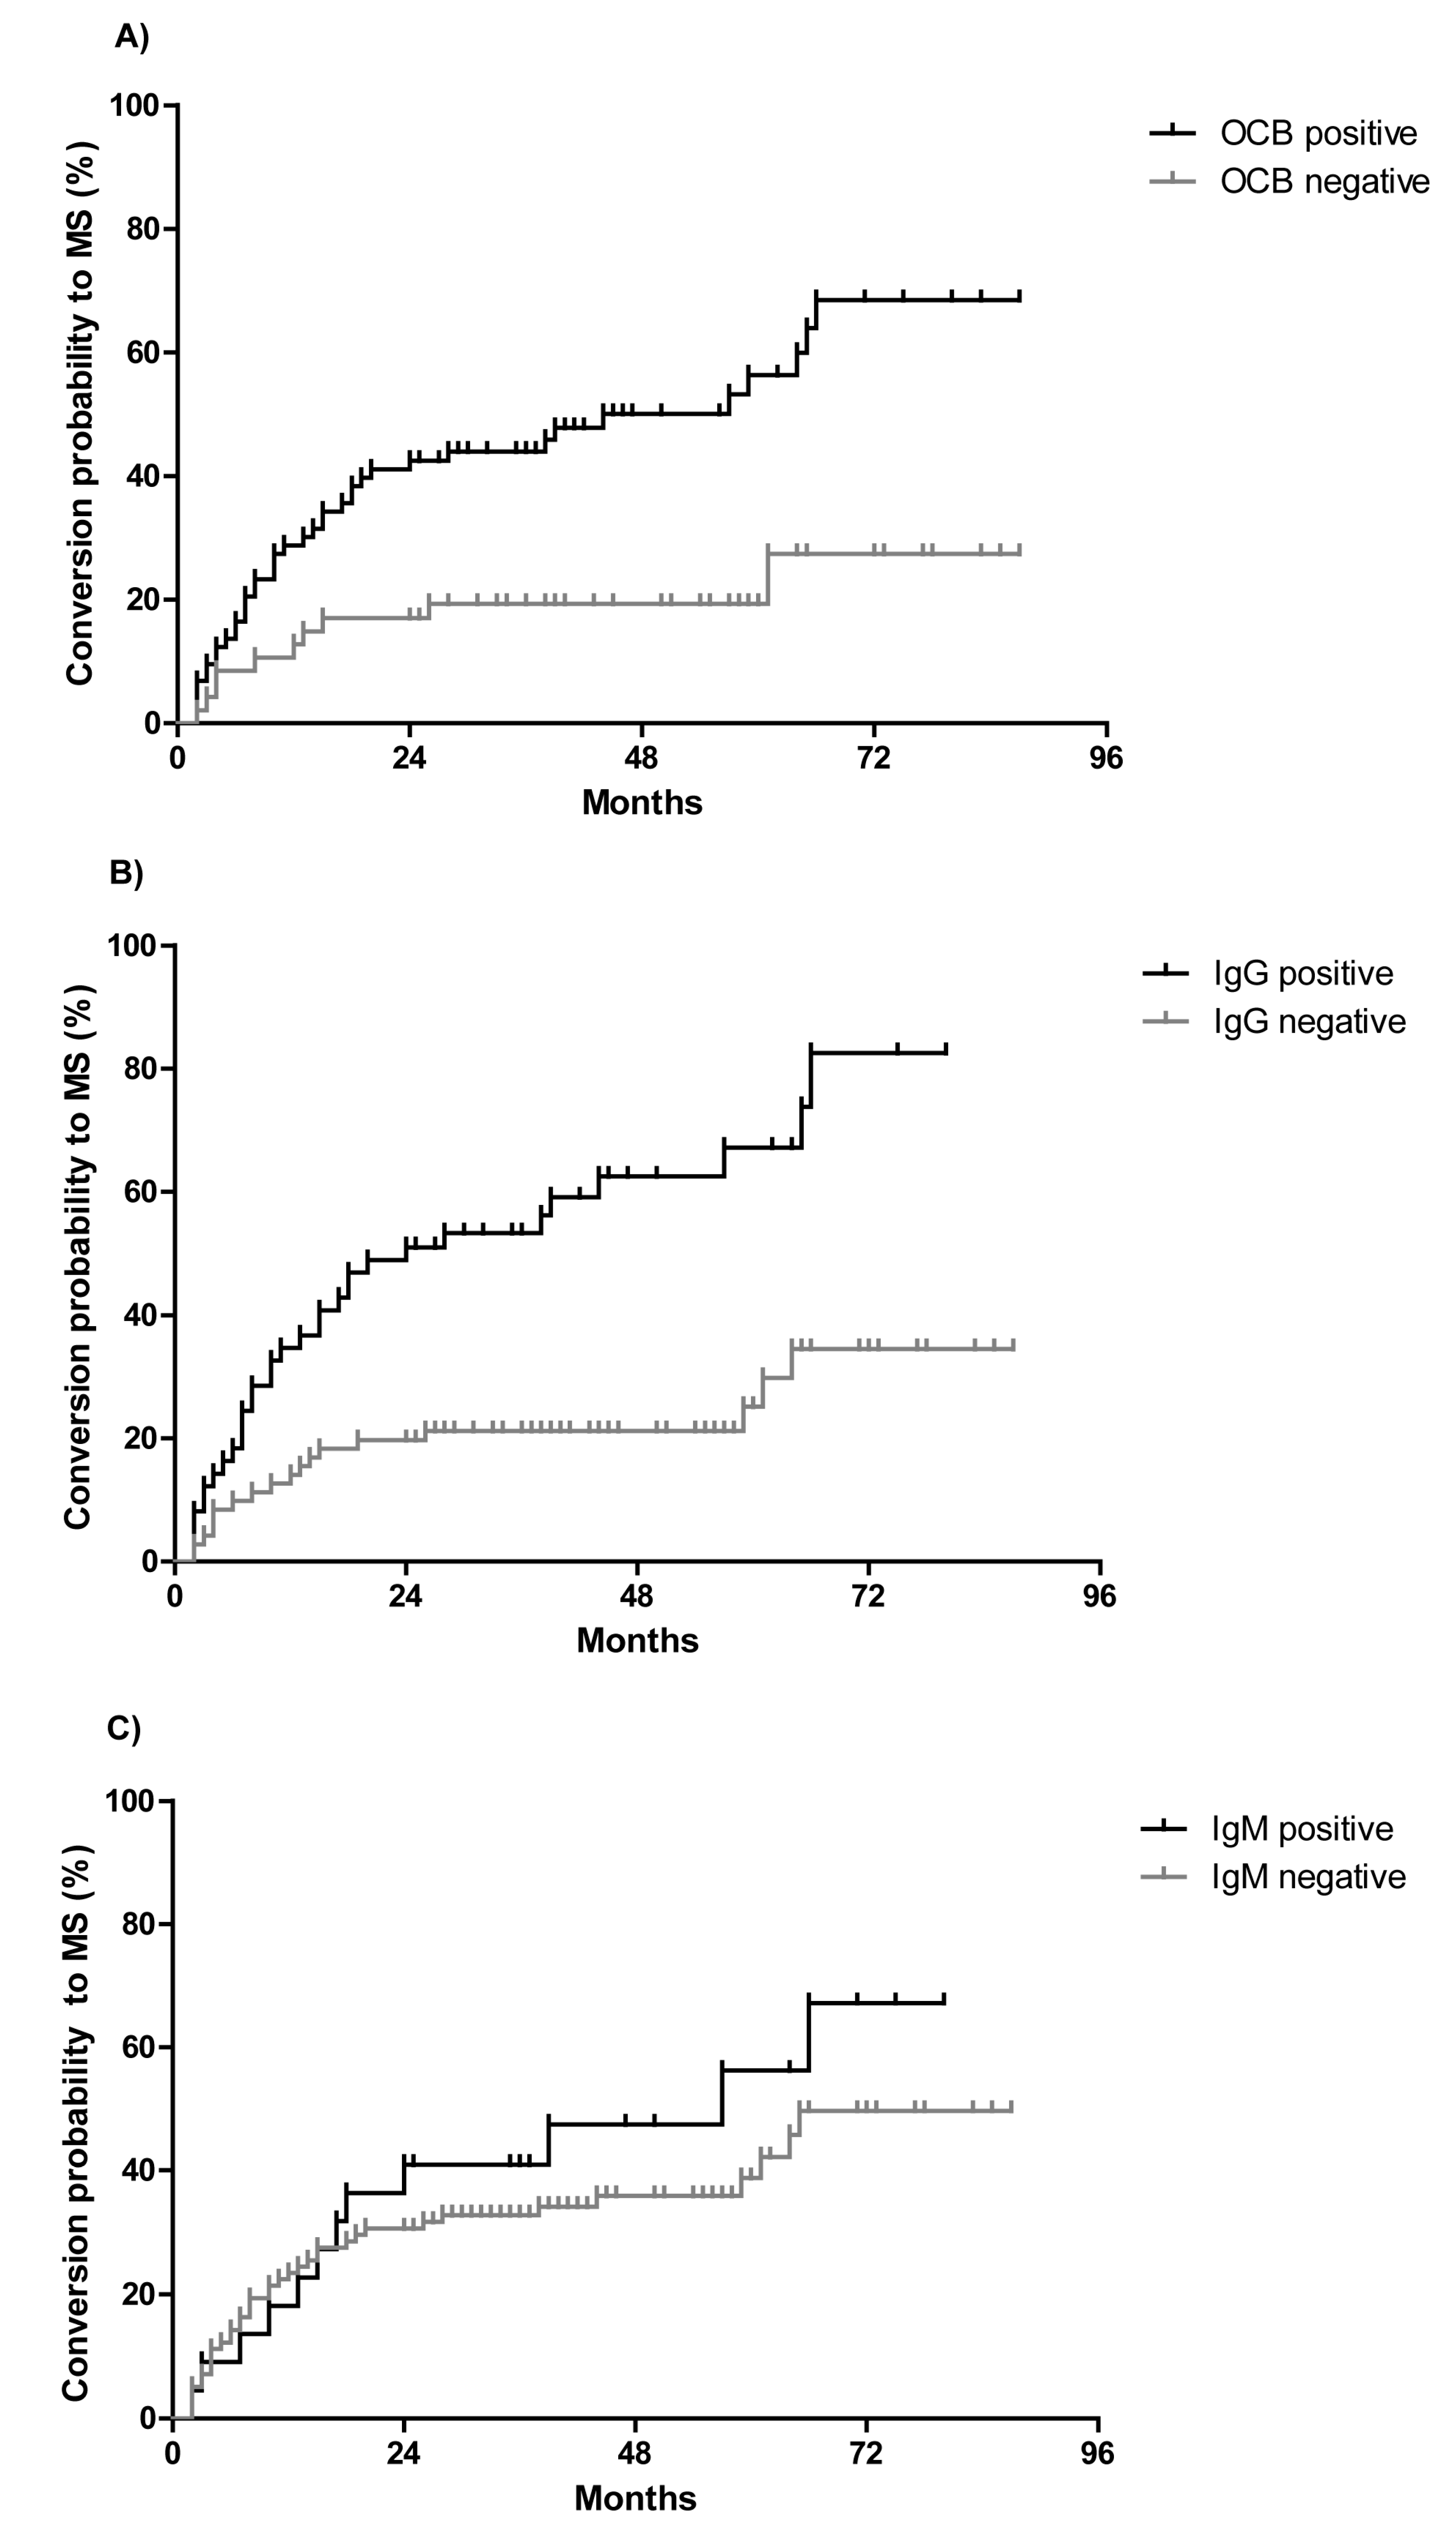
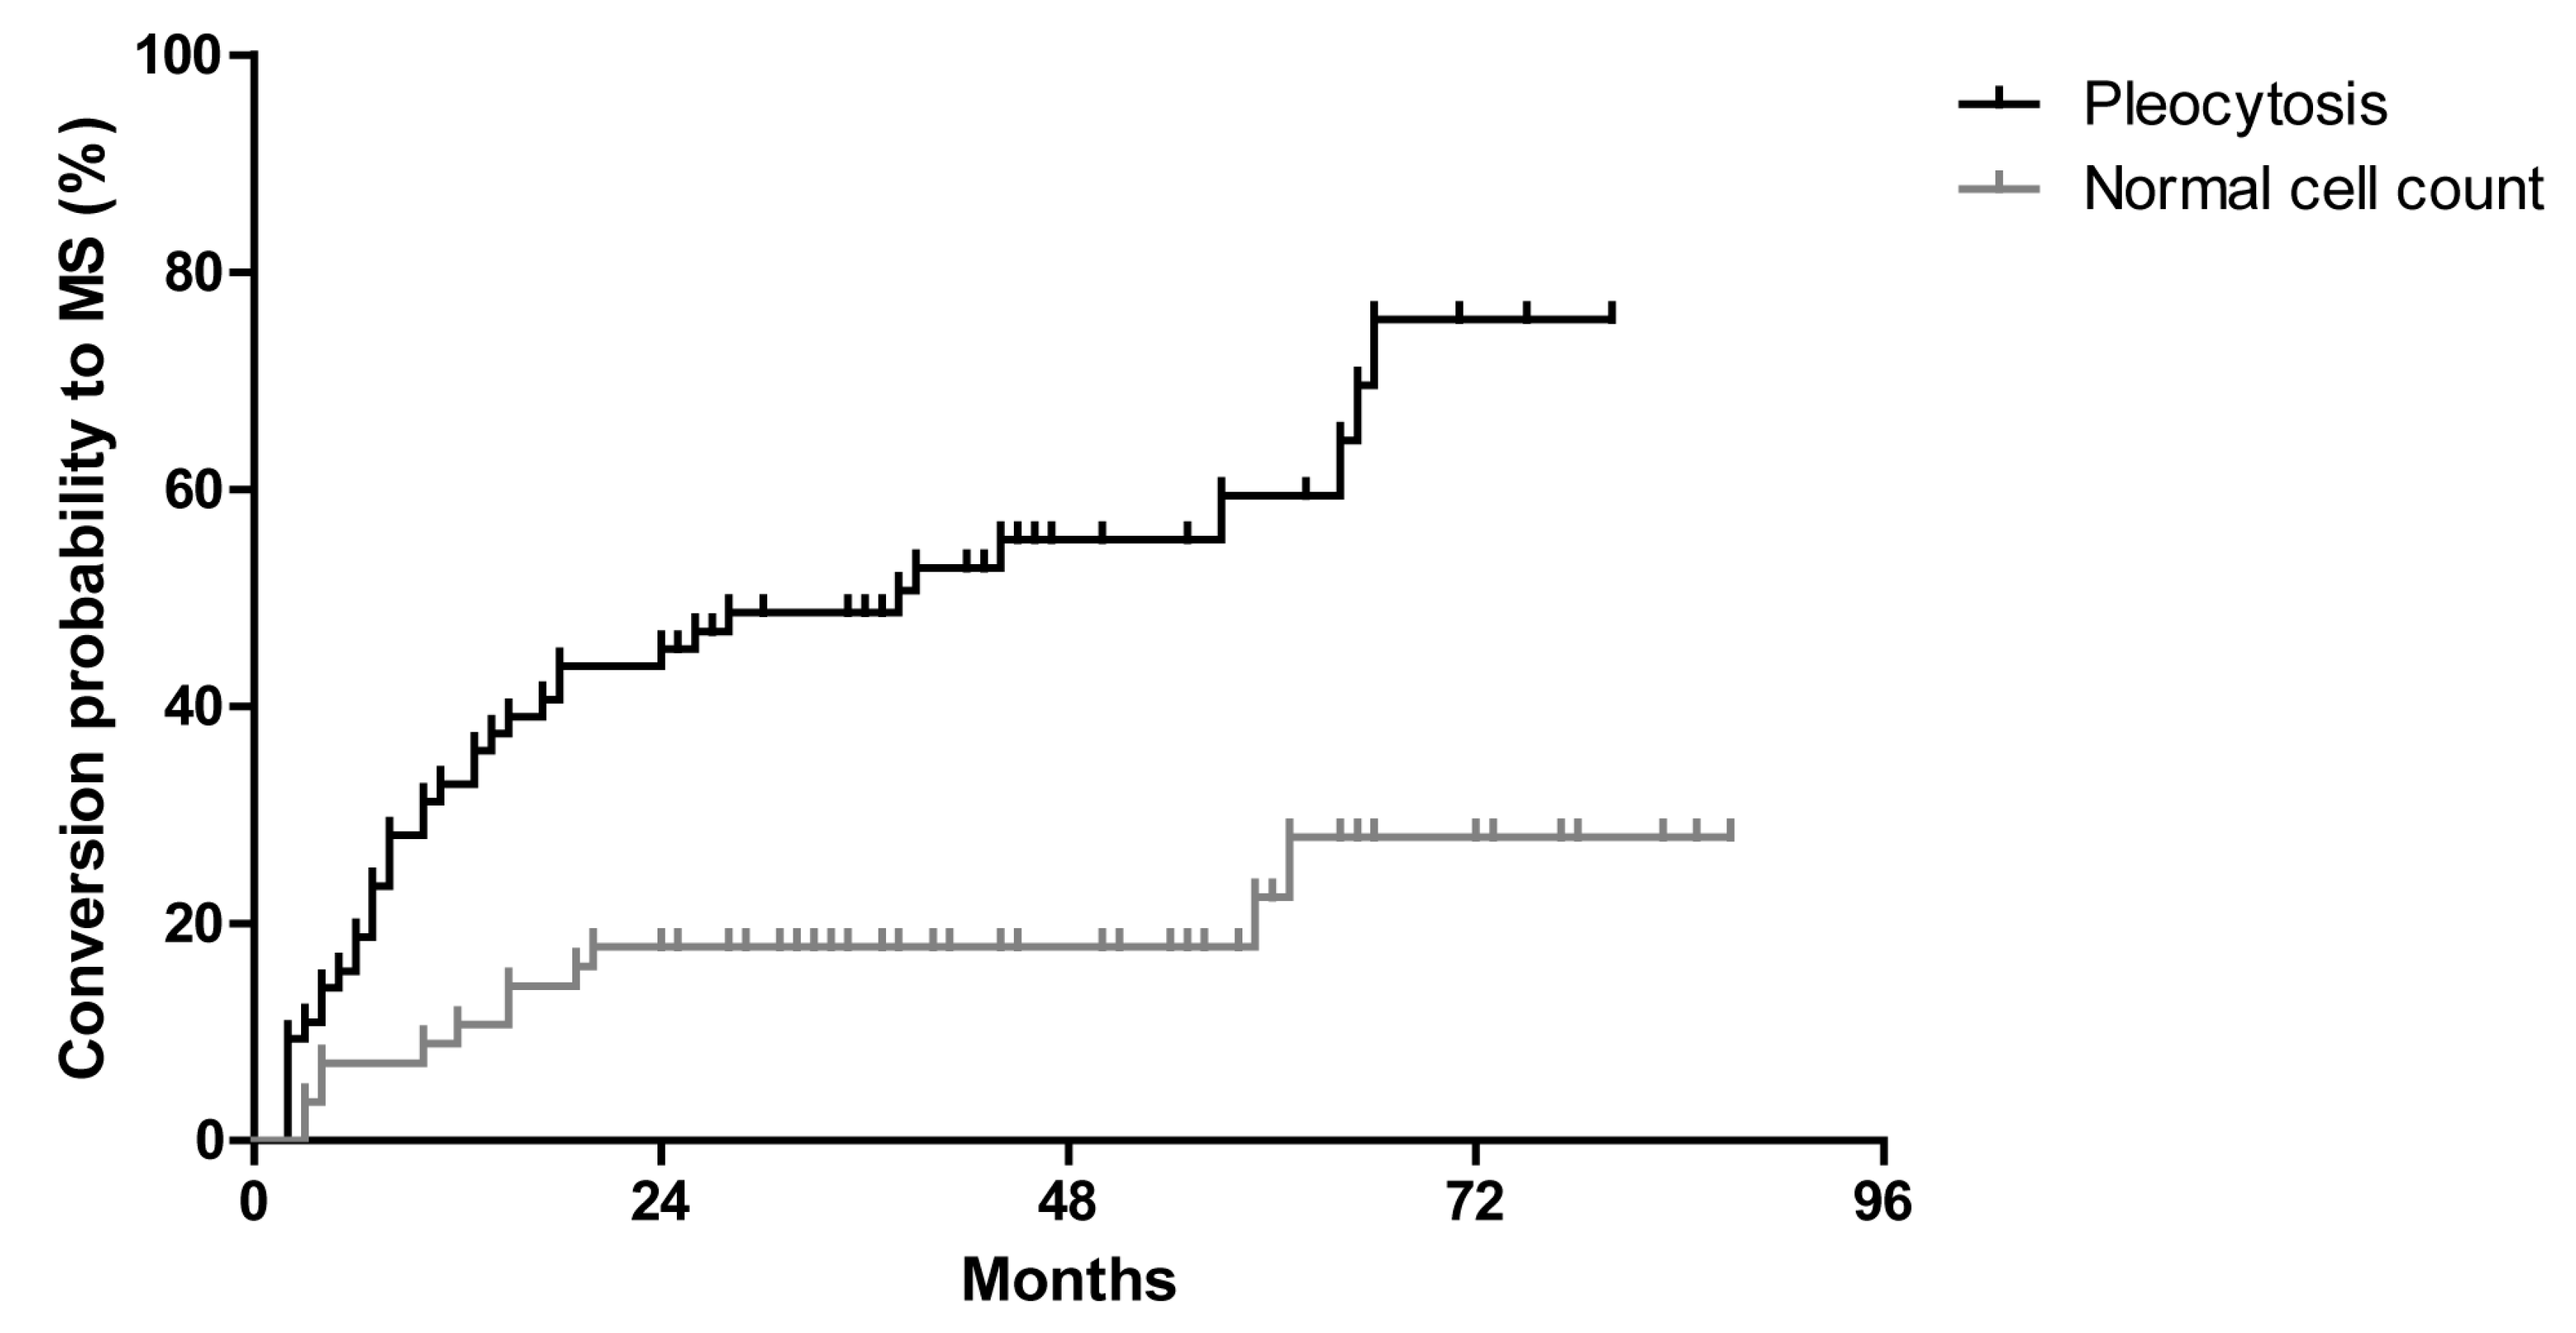
2.1. CSF Parameters Predict Conversion to Multiple Sclerosis (MS) in Clinically Isolated Syndrome (CIS) Patients

OCB restricted to CSF were detected in 73 patients (61%) with CIS at baseline examination. During the follow-up the conversion rate to MS was significantly higher in patients with OCB (55%, 40/73 patients) as compared to patients tested negative for OCB (21%, 10/47 patients). CIS patients with positive OCB were more than twice as likely to convert to MS as OCB negative patients (hazard ratio = 2.6, p = 0.0005, Figure 1A). The median conversion time to MS was similar in both groups, and thus, not dependent on OCB positivity (11 months in OCB positive patients, 10 months in OCB negative patients; range 2–66 months in both groups).
A quantitative measured intrathecal synthesis of either IgG, IgM, or IgA according to the method of Reiber-Felgenhauer was present in 50 patients (42%) with CIS at baseline and was always accompanied by OCB positivity. IgG synthesis was found in 48 patients (40%), IgM synthesis in 22 patients (18%), and IgA synthesis in 4 patients (3%). The combination of IgG and IgM was found most frequently in 20 patients (17%), while the combination of IgM and IgA was only found once (1%). Three patients (2%) presented a three-class-reaction of IgG, IgM, and IgA at baseline.
During the follow-up the conversion rate to MS was significantly higher in patients with intrathecal IgG synthesis (67%, 32/48 patients) as compared to patients without IgG synthesis (33%, 16/48 patients). Patients with the detection of an intrathecal IgG synthesis were more than three and a half times as likely to convert to MS (hazard ratio = 3.8, p < 0.0001, Figure 1B). The median conversion time to MS was 11 months in both patients groups, independent if patients exhibited intrathecal IgG synthesis or not. For intrathecal IgM synthesis, a similar trend for the conversion rate to MS failed to be significant (hazard ratio = 1.4, p = 0.33, Figure 1C). 12 patients (55%) with intrathecal IgM synthesis converted to MS during follow-up while 10 patients with intrathecal IgM synthesis remained as stable CIS (45%). IgA synthesis occurred in only four patients, and was thus not able to distinguish between groups.
CSF pleocytosis was found in 64 patients with CIS (53%) at the baseline. During follow-up the conversion rate to MS was significantly higher in patients with pleocytosis (59%, 38/64 patients) as compared to patients with normal cell count (41%, 26/64 patients). CIS patients with CSF pleocytosis were three and a half times as likely to convert to MS as patients with normal cell count (hazard ratio = 3.4, p < 0.0001, Figure 2).
The CSF parameters lactate, total protein, and albumin ratio were not able to distinguish between the patients with conversion to MS and stable CIS (Table 2).

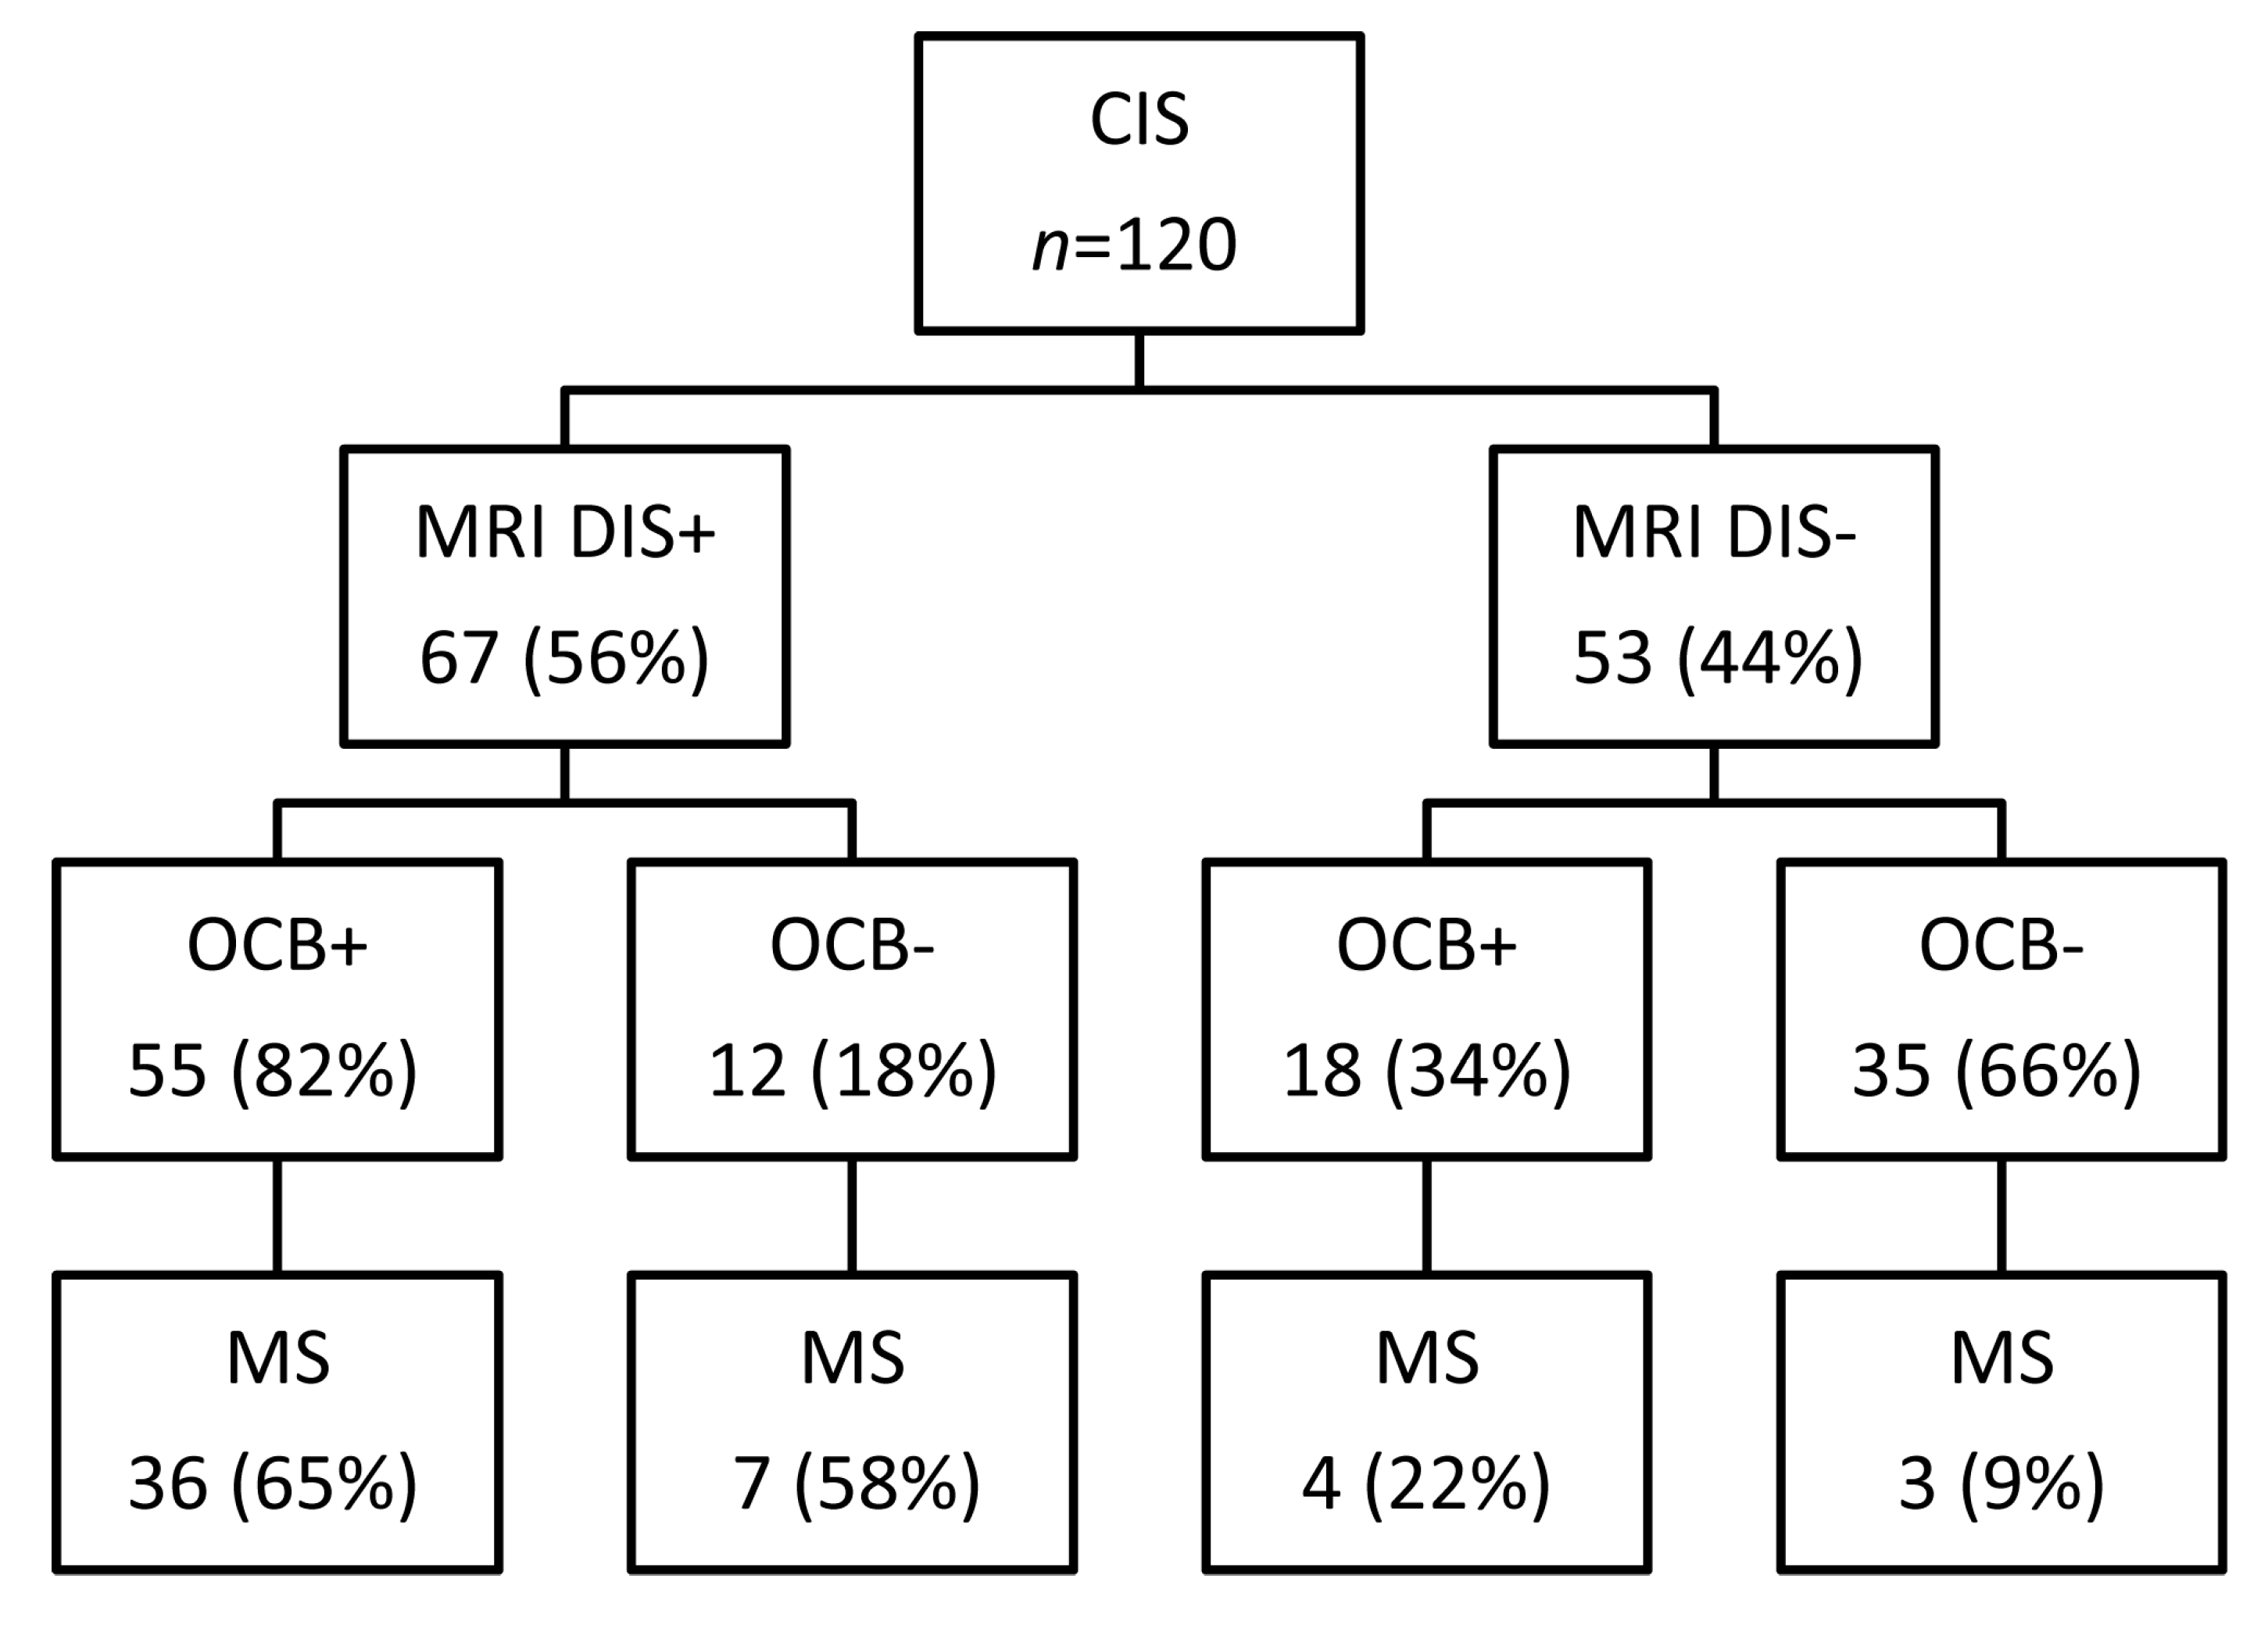
2.2. OCB Predict the Conversion Rate to MS in CIS Patients Who do not Fulfill MRI Dissemination in Space

At baseline examination, 67 patients with CIS (56%) fulfilled the MRI criteria for dissemination in space (Figure 2). The majority of these patients displayed OCB in the CSF (82%). During follow-up, the conversion rate to MS was slightly increased in patients with OCB (65%, 36/55 patients) as compared to patients tested negative for OCB (58%, 7/12 patients, p = 0.092, Figure 3) but the result did not reach a significant difference.
In the remaining 53 patients (44%) who did not fulfill the MRI criteria for dissemination in space OCB were found in 18 of them (34%). During the follow-up the conversion rate to MS was significantly higher in patients with OCB (22%, 4/18 patients) as compared to patients tested negative for OCB (9%, 3/35 patients; p = 0.018, Figure 3).

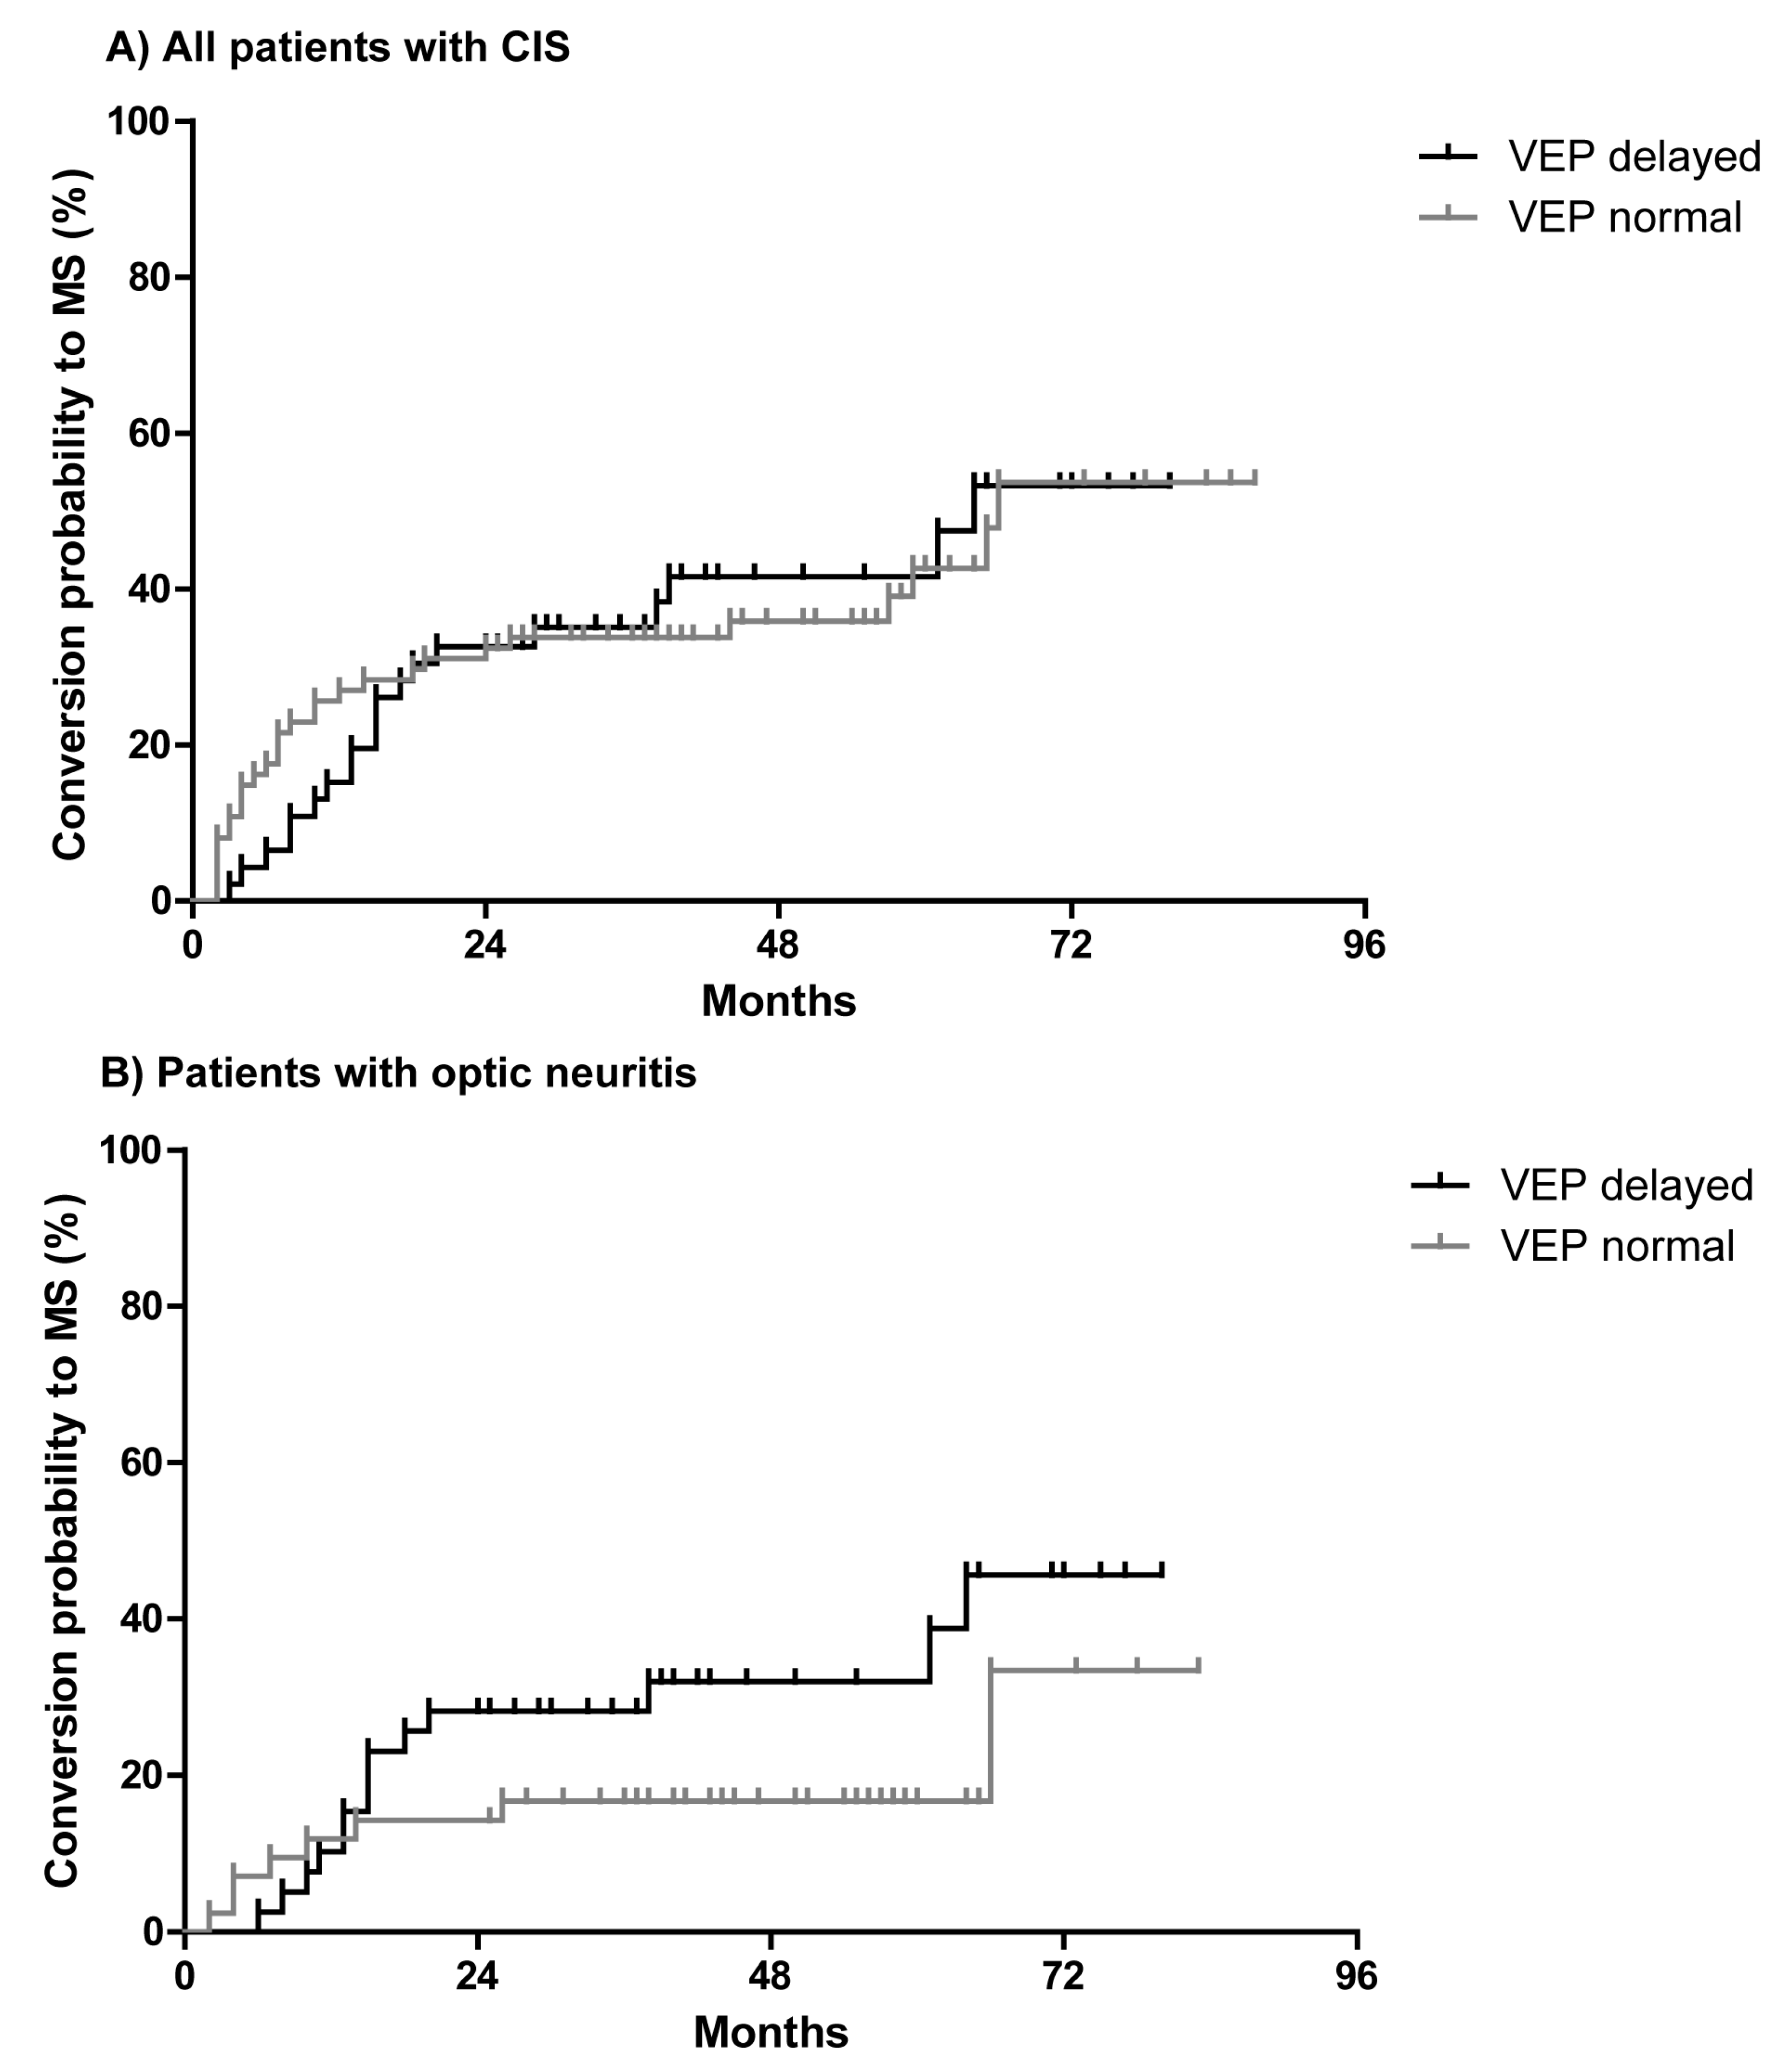
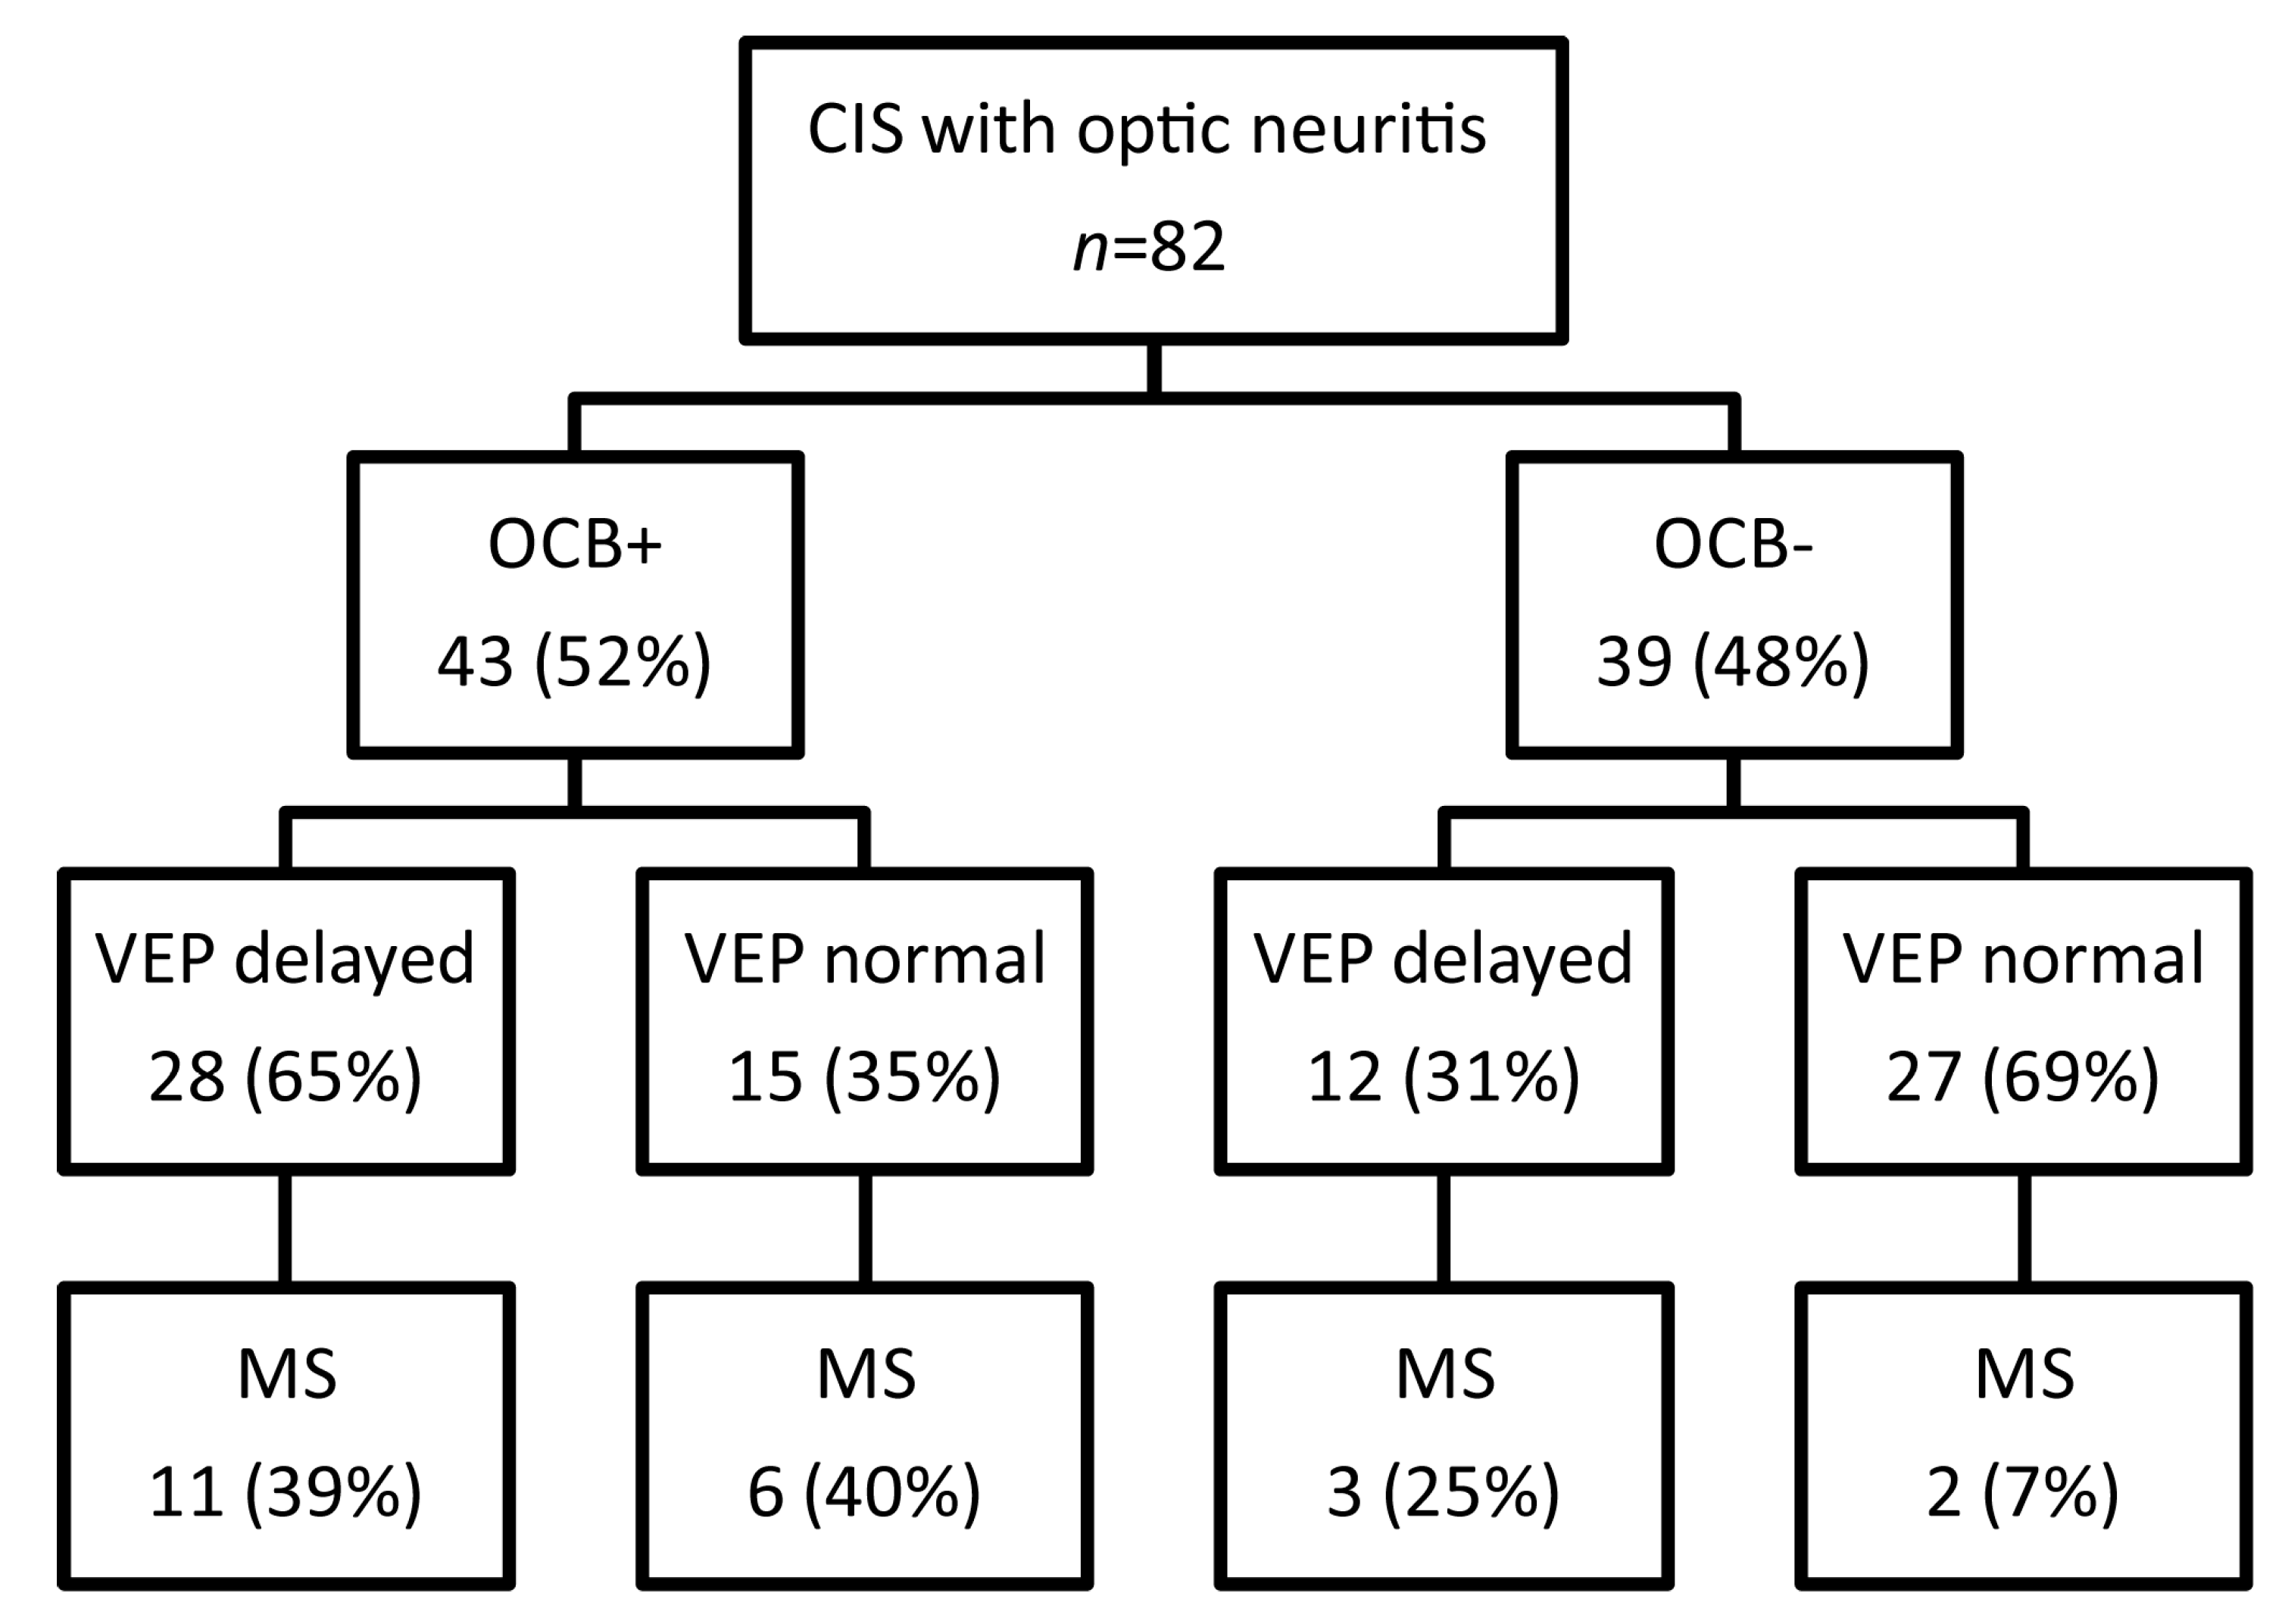
2.3. The Predictive Role of Visual Evoked Potentials for Conversion of CIS to MS

Electrophysiological examinations including visual evoked potentials (VEP) were performed in all patients with CIS. Examinations revealed delayed VEP indicating a demyelination of the optic nerve in 46 patients (38%) with CIS at the baseline. Delayed VEP at baseline could not discriminate between patients who later converted to MS and patients who remained stable as CIS (hazard ratio = 1.0, p = 0.96, Figure 4A).
When only patients with optic neuritis were analyzed, delayed VEP were found in 49% of them. There was a trend to higher conversion rate in patients with optic neuritis and delayed VEP to develop MS as compared to patients with normal VEP that failed to be significant (hazard ratio = 1.8, p = 0.16, Figure 4B).
Further subgroup analyses revealed that patients with optic neuritis and positive OCB in the CSF converted to MS with a similar distribution independently of whether VEP were delayed (39%) or not (40%, Figure 5). However, in patients with optic neuritis and negative OCB, a significantly higher rate converted to MS when VEP were delayed as compared to normal VEP (p = 0.008, Figure 5).
In the group of CIS patients with symptoms other than optic neuritis, delayed VEP were found in six patients who fulfilled the MRI criteria of dissemination in space and converted to MS. Of the six patients with delayed VEP, five were tested OCB positive. In our cohort, delayed VEP were not found in CIS patients with symptoms other than optic neuritis who did not fulfill the MRI criteria of dissemination in space.

3. Discussion

Since MS can be diagnosed in an earlier stage according to the last revision of the McDonald criteria in 2010, previously defined risk factors for conversion from CIS to MS need to be reconsidered according to these new guidelines [4]. A recent study has demonstrated that the prevalence of OCB in MS patients persists at a high level [16]. Concomitantly, OCB were less frequently found in patients who did not fulfil the criteria of definitive MS at the first presentation and where thus diagnosed with CIS [16]. Studies applying previous criteria to diagnose MS have shown that the presence of OCB in CIS patients increased the risk to develop MS significantly [3,17,18]. Kuhle and colleagues showed that the presence of OCB in CIS patients duplicated the risk to develop MS independent of the MRI findings, while the detection of MRI lesions in combination with OCB indicated the highest risk [3]. In the present study, CSF parameters in CIS patients diagnosed according to the McDonald criteria of 2010 were analyzed. Our study confirmed the high predictive value of OCB in CSF for conversion to MS. CIS patients with positive OCB were more than twice as likely to convert to MS as OCB negative patients. While the OCB status has been in focus of many studies, further CSF parameters were previously only poorly investigated. We could demonstrate that although a quantitative intrathecal IgG synthesis according to the method of Reiber-Felgenhauer was less frequently detected in patients who converted to MS when compared to OCB as a qualitative method, patients with an increased quantitative IgG production had an even higher risk to develop MS. We could not confirm previous reports that an intrathecal IgM synthesis represents a prognostic factor for conversion of CIS to definitive MS [19,20]. Instead, we found that CSF pleocytosis was associated with a higher risk to convert to MS, which is in contrast to previous reports [3]. However, the previous studies included CIS patients with criteria older than those of McDonald 2010.
Importantly, there are also OCB negative patients who convert to MS. A recent study has shown that MS patients without OCB at the baseline might develop an intrathecal immunoglobulin synthesis in a follow-up CSF investigation [21,22]. In our study, two OCB negative patients who converted to MS received a second lumbar puncture in which OCB in CSF could then be detected. We therefore suggest a follow-up puncture in OCB negative patients within one year in order to confirm the diagnosis and to estimate the prognosis because OCB negative patients have been proposed to have a more benign disease course [14,22]. Alternatively, an investigation of other laboratory predictors in patients with negative OCB might be helpful [23,24,25,26]. A polyspecific response to neurotropic viruses such as measles, rubella, and varicella zoster, with corresponding antibodies in the CSF, which is called “MRZ reaction”, could be found frequently in CIS patients who converted to MS [27]. Another neurotropic virus, the Epstein-Barr virus has been considered as a trigger factor for developing MS and a recent study suggested the detection of an antibody response against the Epstein-Barr virus as a prognostic marker for disease conversion [25]. A unique antibody gene mutation pattern in CSF B-cells and specific molecular changes in circulating CD4+ T-Cells were recently identified as risk factors for MS [24,28]. Proteomic analysis of CSF samples is another promising method that suggested chitinase 3-like 1 as a biomarker [23].
Although most studies could not find a significant relationship between clinical presentation at the baseline and the risk to develop MS, some studies suggested that patients with optic neuritis are at a lower risk for conversion to definite MS, which we could confirm [5,29,30,31]. In our cohort, CIS patients with brainstem and spinal cord lesions were at a higher risk, while patients with optic neuritis were at a lower risk to convert to MS. Since the spectrum of diseases leading to visual impairment is broad, clinical examination to objectify patients symptoms are limited and even so considered typical optic neuritis needs to be differentiated from other causes of an acute optic neuropathy [32,33]. Visual pathways lesions due to demyelination can be detected by delayed VEP latencies even in patients without visual symptoms [34,35,36,37]. Therefore, the detection of sub-clinical lesions of the visual pathway has become an important aspect in the assessment of newly diagnosed MS cases [38,39]. While electrophysiological examinations are not a part of the McDonald 2010 criteria, studies demonstrated that VEP latency combined with MRI could improve the accuracy of MS prediction [9,40]. Our results confirm that delayed VEP represent an additional risk factor for conversion to MS in OCB negative CIS patients with optic neuritis. In OCB, positive patients with optic neuritis VEP were not able to discriminate between patients who develop MS or remain stable with CIS. As many patients with CIS present with optic neuritis as first clinical episode, we suggest VEP examination in addition to lumbar puncture to gain additional information to stratify the risk to convert to MS.
In conclusion, although the revised McDonald criteria of 2010 do not consider CSF diagnostics and electrophysiological examination mandatory, the detection of OCB, and delayed VEP can help to identify CIS patients with a high risk to convert to MS.

4. Methods

4.1. Patients

The study investigated patients with symptoms suggestive for a demyelinating disease who were diagnosed with CIS in the time from 2010 to 2015 at the Department of Neurology of the Hannover Medical School. Patients diagnosed with MS according to the McDonald criteria of 2010 were not included. This group of CIS patients with baseline characteristics was identified in a previous study [16]. In the underlying study, follow-up clinical and MRI parameters were analysed to identify patients who develop MS. The aim of the study was to identify risk factors for developing MS that were evaluated at baseline examination with special interest on CSF parameters and visual evoked potentials.
Of 189 patients diagnosed with CIS in the time from 2010 to 2015, follow-up data was available for 125 patients (66%). In three patients, an alternative diagnosis for the initial clinical episode appeared during follow-up (keratoconus, keratoectasia, pseudotumor cerebri) and therefore these patients were excluded. Two other patients were not included due to death caused by brain tumor and brain bleeding.
MS mimicking diseases such as connective tissue diseases and infectious diseases were excluded by laboratory testing (antinuclear antibodies, anti-DNA antibodies, antineutrophil cytoplasmic antibodies, antiphospholipid antibodies, HIV, antibodies to borrelia burgdorferi, antibodies to Treponema pallidum). Baseline clinical data, CSF findings, and MRI of the brain were available for all of the patients. Follow-up data included information about the clinical course with further relapses and MRI results for all patients.
This investigation was approved by the institutional ethics committee of the Hannover Medical School (No. 7483, 23 May 2017).

4.2. CSF and Serum Analytical Procedures

All of the CSF and serum laboratory tests were performed in the neurochemistry laboratory of the Department of Neurology [41,42]. After microscopic cell counting and cell differentiation, CSF samples were centrifuged and total protein (cut-off = 500 mg/L) was determined by a Bradford dye-binding procedure [43]. Immunoglobulin classes IgG, IgA, IgM, and albumin were measured in CSF and serum by kinetic nephelometry (Beckman Coulter IMMAGE). The CSF-serum albumin quotient (QAlb) was used as a marker for the blood-CSF barrier function. The upper normal reference value of the QAlb was calculated by using the formula QAlb = 4 + (age in years/15) [43]. Evidence of an intrathecal synthesis of IgG, IgA, and IgM was based on the calculation according to the method of Reiber-Felgenhauer [43]. CSF-specific OCB were determined by isoelectric focusing in polyacrylamide gels with consecutive silver staining. All of the used CSF analytic methods are quality controlled by participating in the external INSTAND survey program [44].

4.3. Magnetic Resonance Imaging (MRI)

All of the patients were examined by cerebral MRI, including a T1-weighted, T2-weighted, and gadolinium-enhancing T1-weighted sequence at baseline. Spinal MRI at the baseline was additionally considered whenever available. The number, location, and gadolinium uptake of CNS lesions was analyzed and classified according to the McDonald Criteria of 2010 (Swanton MRI criteria of 2006) [45]. Evidence of new CNS lesion on follow-up MRI examination with reference to baseline MRI was assessed as dissemination in time.

4.4. Visual Evoked Potentials

VEP were performed by trained technicians on a Natus System according to standard methods. The latency of onset and the peak to peak amplitudes of the initial negative peak (N100) and the following positive peak (P100) were measured. An absolute latency of P100 >120 ms or a side difference >10 ms was defined as prolonged VEP [46,47,48,49].

4.5. Statistical Analysis

The statistical analysis was performed by GraphPad Prism (La Jolla, CA, USA; version 5.02). Sample values were described as median and range. Statistical significance in categorical data was assessed by Fisher’s exact test while Mann-Whitney U-test was performed for two independent samples. Statistical significance was considered for p-values <0.05. Values were tested for normal distribution by the D’Agostino-Pearson normality test. Kaplan-Meier surviving analysis was used to estimate probability for conversion to MS.

Acknowledgments

The authors thank Karin Fricke (Clinical Neuroimmunology and Neurochemistry, Department of Neurology, Hannover Medical School, 30625 Hannover, Germany), Kathrin Scheiwe (Clinical Neuroimmunology and Neurochemistry, Department of Neurology, Hannover Medical School, 30625 Hannover, Germany), Katharina Dorsch (Clinical Neuroimmunology and Neurochemistry, Department of Neurology, Hannover Medical School, 30625 Hannover, Germany), Ilona Cierpka-Leja (Clinical Neuroimmunology and Neurochemistry, Department of Neurology, Hannover Medical School, 30625 Hannover, Germany) and Sabine Lang (Clinical Neuroimmunology and Neurochemistry, Department of Neurology, Hannover Medical School, 30625 Hannover, Germany) for excellent technical assistance.

Author Contributions

Philipp Schwenkenbecher participated in the design of the study, collected and analyzed the data and drafted the manuscript. Anastasia Sarikidi collected the data and analyzed the data. Lena Bönig contributed in drafting the manuscript. Ulrich Wurster was responsible for CSF analysis, analyzed the data and contributed in drafting the manuscript. Paul Bronzlik was responsible for MRI examination and analyzed the data. Kurt-Wolfram Sühs contributed in drafting the manuscript. Martin Stangel analyzed the data and contributed in drafting the manuscript. Refik Pul analyzed the data and contributed in drafting the manuscript. Thomas Skripuletz conceived the study, analyzed the data and drafted the manuscript. All authors read and approved the final manuscript.

Conflicts of interest

The authors declare no conflict of interest.

References

  1. Miller, D.H.; Chard, D.T.; Ciccarelli, O. Clinically isolated syndromes. Lancet Neurol. 2012, 11, 157–169. [Google Scholar] [CrossRef]
  2. Compston, A.; Coles, A. Multiple sclerosis. Lancet 2002, 359, 1221–1231. [Google Scholar] [CrossRef]
  3. Kuhle, J.; Disanto, G.; Dobson, R.; Adiutori, R.; Bianchi, L.; Topping, J.; Bestwick, J.P.; Meier, U.C.; Marta, M.; Dalla Costa, G.; et al. Conversion from clinically isolated syndrome to multiple sclerosis: A large multicentre study. Mult. Scler. 2015, 21, 1013–1024. [Google Scholar] [CrossRef] [PubMed]
  4. Polman, C.H.; Reingold, S.C.; Banwell, B.; Clanet, M.; Cohen, J.A.; Filippi, M.; Fujihara, K.; Havrdova, E.; Hutchinson, M.; Kappos, L.; et al. Diagnostic criteria for multiple sclerosis: 2010 Revisions to the McDonald criteria. Ann. Neurol. 2011, 69, 292–302. [Google Scholar] [CrossRef] [PubMed]
  5. Fisniku, L.K.; Brex, P.A.; Altmann, D.R.; Miszkiel, K.A.; Benton, C.E.; Lanyon, R.; Thompson, A.J.; Miller, D.H. Disability and T2 MRI lesions: A 20-year follow-up of patients with relapse onset of multiple sclerosis. Brain 2008, 131, 808–817. [Google Scholar] [CrossRef] [PubMed]
  6. Kappos, L.; Polman, C.H.; Freedman, M.S.; Edan, G.; Hartung, H.P.; Miller, D.H.; Montalban, X.; Barkhof, F.; Bauer, L.; Jakobs, P.; et al. Treatment with interferon β-1b delays conversion to clinically definite and McDonald MS in patients with clinically isolated syndromes. Neurology 2006, 67, 1242–1249. [Google Scholar] [CrossRef] [PubMed]
  7. Edan, G.; Kappos, L.; Montalban, X.; Polman, C.H.; Freedman, M.S.; Hartung, H.P.; Miller, D.; Barkhof, F.; Herrmann, J.; Lanius, V.; et al. Long-term impact of interferon β-1b in patients with cis: 8-year follow-up of benefit. J. Neurol. Neurosurg. Psychiatry 2014, 85, 1183–1189. [Google Scholar] [CrossRef] [PubMed] [Green Version]
  8. Deangelis, T.M.; Miller, A. Diagnosis of multiple sclerosis. Handb. Clin. Neurol. 2014, 122, 317–342. [Google Scholar] [PubMed]
  9. Chirapapaisan, N.; Laotaweerungsawat, S.; Chuenkongkaew, W.; Samsen, P.; Ruangvaravate, N.; Thuangtong, A.; Chanvarapha, N. Diagnostic value of visual evoked potentials for clinical diagnosis of multiple sclerosis. Doc. Ophthalmol. Adv. Ophthalmol. 2015, 130, 25–30. [Google Scholar] [CrossRef] [PubMed]
  10. Fuhr, P.; Borggrefe-Chappuis, A.; Schindler, C.; Kappos, L. Visual and motor evoked potentials in the course of multiple sclerosis. Brain 2001, 124, 2162–2168. [Google Scholar] [CrossRef] [PubMed]
  11. Leocani, L.; Rocca, M.A.; Comi, G. Mri and neurophysiological measures to predict course, disability and treatment response in multiple sclerosis. Curr. Opin. Neurol. 2016, 29, 243–253. [Google Scholar] [CrossRef] [PubMed]
  12. Schlaeger, R.; D’Souza, M.; Schindler, C.; Grize, L.; Kappos, L.; Fuhr, P. Combined evoked potentials as markers and predictors of disability in early multiple sclerosis. Clin. Neurophysiol. 2012, 123, 406–410. [Google Scholar] [CrossRef] [PubMed]
  13. Schlaeger, R.; Schindler, C.; Grize, L.; Dellas, S.; Radue, E.W.; Kappos, L.; Fuhr, P. Combined visual and motor evoked potentials predict multiple sclerosis disability after 20 years. Mult. Scler. 2014, 20, 1348–1354. [Google Scholar] [CrossRef] [PubMed]
  14. Link, H.; Huang, Y.M. Oligoclonal bands in multiple sclerosis cerebrospinal fluid: An update on methodology and clinical usefulness. J. Neuroimmunol. 2006, 180, 17–28. [Google Scholar] [CrossRef] [PubMed]
  15. Huss, A.M.; Halbgebauer, S.; Ockl, P.; Trebst, C.; Spreer, A.; Borisow, N.; Harrer, A.; Brecht, I.; Balint, B.; Stich, O.; et al. Importance of cerebrospinal fluid analysis in the era of McDonald 2010 criteria: A German-Austrian retrospective multicenter study in patients with a clinically isolated syndrome. J. Neurol. 2016, 263, 2499–2504. [Google Scholar] [CrossRef] [PubMed]
  16. Schwenkenbecher, P.; Sarikidi, A.; Wurster, U.; Bronzlik, P.; Suhs, K.W.; Raab, P.; Stangel, M.; Pul, R.; Skripuletz, T. Mcdonald criteria 2010 and 2005 compared: Persistence of high oligoclonal band prevalence despite almost doubled diagnostic sensitivity. Int. J. Mol. Sci. 2016, 17, 1592. [Google Scholar] [CrossRef] [PubMed]
  17. Tintore, M.; Rovira, A.; Rio, J.; Otero-Romero, S.; Arrambide, G.; Tur, C.; Comabella, M.; Nos, C.; Arevalo, M.J.; Negrotto, L.; et al. Defining high, medium and low impact prognostic factors for developing multiple sclerosis. Brain 2015, 138, 1863–1874. [Google Scholar] [CrossRef] [PubMed]
  18. Tintore, M.; Rovira, A.; Rio, J.; Tur, C.; Pelayo, R.; Nos, C.; Tellez, N.; Perkal, H.; Comabella, M.; Sastre-Garriga, J.; et al. Do oligoclonal bands add information to MRI in first attacks of multiple sclerosis? Neurology 2008, 70, 1079–1083. [Google Scholar] [CrossRef] [PubMed]
  19. Sharief, M.K.; Thompson, E.J. The predictive value of intrathecal immunoglobulin synthesis and magnetic resonance imaging in acute isolated syndromes for subsequent development of multiple sclerosis. Ann. Neurol. 1991, 29, 147–151. [Google Scholar] [CrossRef] [PubMed]
  20. Ozakbas, S.; Cinar, B.P.; Ozcelik, P.; Baser, H.; Kosehasanogullari, G. Intrathecal igm index correlates with a severe disease course in multiple sclerosis: Clinical and MRI results. Clin. Neurol. Neurosurg. 2017, 160, 27–29. [Google Scholar] [CrossRef] [PubMed]
  21. Davies, G.; Keir, G.; Thompson, E.J.; Giovannoni, G. The clinical significance of an intrathecal monoclonal immunoglobulin band: A follow-up study. Neurology 2003, 60, 1163–1166. [Google Scholar] [CrossRef] [PubMed]
  22. Zeman, A.Z.; Kidd, D.; McLean, B.N.; Kelly, M.A.; Francis, D.A.; Miller, D.H.; Kendall, B.E.; Rudge, P.; Thompson, E.J.; McDonald, W.I. A study of oligoclonal band negative multiple sclerosis. J. Neurol. Neurosurg. Psychiatry 1996, 60, 27–30. [Google Scholar] [CrossRef] [PubMed]
  23. Comabella, M.; Fernandez, M.; Martin, R.; Rivera-Vallve, S.; Borras, E.; Chiva, C.; Julia, E.; Rovira, A.; Canto, E.; Alvarez-Cermeno, J.C.; et al. Cerebrospinal fluid chitinase 3-like 1 levels are associated with conversion to multiple sclerosis. Brain 2010, 133, 1082–1093. [Google Scholar] [CrossRef] [PubMed]
  24. Corvol, J.C.; Pelletier, D.; Henry, R.G.; Caillier, S.J.; Wang, J.; Pappas, D.; Casazza, S.; Okuda, D.T.; Hauser, S.L.; Oksenberg, J.R.; et al. Abrogation of T cell quiescence characterizes patients at high risk for multiple sclerosis after the initial neurological event. Proc. Natl. Acad. Sci. USA 2008, 105, 11839–11844. [Google Scholar] [CrossRef] [PubMed]
  25. Lunemann, J.D.; Tintore, M.; Messmer, B.; Strowig, T.; Rovira, A.; Perkal, H.; Caballero, E.; Munz, C.; Montalban, X.; Comabella, M. Elevated epstein-barr virus-encoded nuclear antigen-1 immune responses predict conversion to multiple sclerosis. Ann. Neurol. 2010, 67, 159–169. [Google Scholar] [CrossRef] [PubMed]
  26. Masjuan, J.; Alvarez-Cermeno, J.C.; Garcia-Barragan, N.; Diaz-Sanchez, M.; Espino, M.; Sadaba, M.C.; Gonzalez-Porque, P.; Martinez San Millan, J.; Villar, L.M. Clinically isolated syndromes: A new oligoclonal band test accurately predicts conversion to MS. Neurology 2006, 66, 576–578. [Google Scholar] [CrossRef] [PubMed]
  27. Brettschneider, J.; Tumani, H.; Kiechle, U.; Muche, R.; Richards, G.; Lehmensiek, V.; Ludolph, A.C.; Otto, M. Igg antibodies against measles, rubella, and varicella zoster virus predict conversion to multiple sclerosis in clinically isolated syndrome. PLoS ONE 2009, 4, e7638. [Google Scholar] [CrossRef] [PubMed]
  28. Cameron, E.M.; Spencer, S.; Lazarini, J.; Harp, C.T.; Ward, E.S.; Burgoon, M.; Owens, G.P.; Racke, M.K.; Bennett, J.L.; Frohman, E.M.; et al. Potential of a unique antibody gene signature to predict conversion to clinically definite multiple sclerosis. J. Neuroimmunol. 2009, 213, 123–130. [Google Scholar] [CrossRef] [PubMed]
  29. Mowry, E.M.; Pesic, M.; Grimes, B.; Deen, S.R.; Bacchetti, P.; Waubant, E. Clinical predictors of early second event in patients with clinically isolated syndrome. J. Neurol. 2009, 256, 1061–1066. [Google Scholar] [CrossRef] [PubMed]
  30. Polman, C.; Kappos, L.; Freedman, M.S.; Edan, G.; Hartung, H.P.; Miller, D.H.; Montalban, X.; Barkhof, F.; Selmaj, K.; Uitdehaag, B.M.; et al. Subgroups of the BENEFIT study: Risk of developing MS and treatment effect of interferon β-1b. J. Neurol. 2008, 255, 480–487. [Google Scholar] [CrossRef] [PubMed] [Green Version]
  31. Tintore, M.; Rovira, A.; Rio, J.; Nos, C.; Grive, E.; Tellez, N.; Pelayo, R.; Comabella, M.; Montalban, X. Is optic neuritis more benign than other first attacks in multiple sclerosis? Ann. Neurol. 2005, 57, 210–215. [Google Scholar] [CrossRef] [PubMed]
  32. Brownlee, W.J.; Miller, D.H. Clinically isolated syndromes and the relationship to multiple sclerosis. J. Clin. Neurosci. 2014, 21, 2065–2071. [Google Scholar] [CrossRef] [PubMed]
  33. Toosy, A.T.; Mason, D.F.; Miller, D.H. Optic neuritis. Lancet Neurol. 2014, 13, 83–99. [Google Scholar] [CrossRef]
  34. Alshowaeir, D.; Yiannikas, C.; Garrick, R.; Parratt, J.; Barnett, M.H.; Graham, S.L.; Klistorner, A. Latency of multifocal visual evoked potentials in nonoptic neuritis eyes of multiple sclerosis patients associated with optic radiation lesions. Investig. Ophthalmol. Vis. Sci. 2014, 55, 3758–3764. [Google Scholar] [CrossRef] [PubMed]
  35. Klistorner, A.; Garrick, R.; Barnett, M.H.; Graham, S.L.; Arvind, H.; Sriram, P.; Yiannikas, C. Axonal loss in non-optic neuritis eyes of patients with multiple sclerosis linked to delayed visual evoked potential. Neurology 2013, 80, 242–245. [Google Scholar] [CrossRef] [PubMed]
  36. Naismith, R.T.; Tutlam, N.T.; Xu, J.; Shepherd, J.B.; Klawiter, E.C.; Song, S.K.; Cross, A.H. Optical coherence tomography is less sensitive than visual evoked potentials in optic neuritis. Neurology 2009, 73, 46–52. [Google Scholar] [CrossRef] [PubMed]
  37. Sriram, P.; Wang, C.; Yiannikas, C.; Garrick, R.; Barnett, M.; Parratt, J.; Graham, S.L.; Arvind, H.; Klistorner, A. Relationship between optical coherence tomography and electrophysiology of the visual pathway in non-optic neuritis eyes of multiple sclerosis patients. PLoS ONE 2014, 9, e102546. [Google Scholar] [CrossRef] [PubMed]
  38. Behbehani, R.; Ahmed, S.; Al-Hashel, J.; Rousseff, R.T.; Alroughani, R. Sensitivity of visual evoked potentials and spectral domain optical coherence tomography in early relapsing remitting multiple sclerosis. Mult. Scler. Relat. Disord. 2017, 12, 15–19. [Google Scholar] [CrossRef] [PubMed]
  39. Galetta, K.M.; Balcer, L.J. Measures of visual pathway structure and function in ms: Clinical usefulness and role for MS trials. Mult. Scler. Relat. Disord. 2013, 2, 172–182. [Google Scholar] [CrossRef] [PubMed]
  40. Ellidag, H.Y.; Eren, E.; Erdogan, N.; Ture, S.; Yilmaz, N. Comparison of neurophysiological and MRI findings of patients with multiple sclerosis using oligoclonal band technique. Ann. Neurosci. 2013, 20, 149–154. [Google Scholar] [CrossRef] [PubMed]
  41. Schwenkenbecher, P.; Chacko, L.P.; Wurster, U.; Pars, K.; Pul, R.; Suhs, K.W.; Stangel, M.; Skripuletz, T. Intrathecal synthesis of anti-Hu antibodies distinguishes patients with paraneoplastic peripheral neuropathy and encephalitis. BMC Neurol. 2016, 16, 136. [Google Scholar] [CrossRef] [PubMed]
  42. Skripuletz, T.; Schwenkenbecher, P.; Pars, K.; Stoll, M.; Conzen, J.; Bolat, S.; Pul, R.; Vonberg, R.P.; Sedlacek, L.; Wurster, U.; et al. Importance of follow-up cerebrospinal fluid analysis in cryptococcal meningoencephalitis. Dis. Mark. 2014, 2014, 162576. [Google Scholar] [CrossRef] [PubMed]
  43. Reiber, H. Cerebrospinal fluid—Physiology, analysis and interpretation of protein patterns for diagnosis of neurological diseases. Mult. Scler. 1998, 4, 99–107. [Google Scholar] [PubMed]
  44. Reiber, H. External quality assessment in clinical neurochemistry: Survey of analysis for cerebrospinal fluid (CSF) proteins based on CSF/serum quotients. Clin. Chem. 1995, 41, 256–263. [Google Scholar] [PubMed]
  45. Swanton, J.K.; Fernando, K.; Dalton, C.M.; Miszkiel, K.A.; Thompson, A.J.; Plant, G.T.; Miller, D.H. Modification of MRI criteria for multiple sclerosis in patients with clinically isolated syndromes. J. Neurol. Neurosurg. Psychiatry 2006, 77, 830–833. [Google Scholar] [CrossRef] [PubMed]
  46. Waldman, A.T.; Liu, G.T.; Lavery, A.M.; Liu, G.; Gaetz, W.; Aleman, T.S.; Banwell, B.L. Optical coherence tomography and visual evoked potentials in pediatric MS. Neurol. Neuroimmunol. Neuroinflamm. 2017, 4, e356. [Google Scholar] [CrossRef] [PubMed]
  47. Giffroy, X.; Maes, N.; Albert, A.; Maquet, P.; Crielaard, J.M.; Dive, D. Multimodal evoked potentials for functional quantification and prognosis in multiple sclerosis. BMC Neurol. 2016, 16, 83. [Google Scholar] [CrossRef] [PubMed]
  48. Kallmann, B.A.; Fackelmann, S.; Toyka, K.V.; Rieckmann, P.; Reiners, K. Early abnormalities of evoked potentials and future disability in patients with multiple sclerosis. Mult. Scler. 2006, 12, 58–65. [Google Scholar] [CrossRef] [PubMed]
  49. Sharma, R.; Joshi, S.; Singh, K.D.; Kumar, A. Visual evoked potentials: Normative values and gender differences. J. Clin. Diagn. Res. 2015, 9, CC12–CC15. [Google Scholar] [CrossRef] [PubMed]
Figure 1. Kaplan-Meier curves for conversation of all clinically isolated syndrome (CIS) patients to multiple sclerosis (MS) in regard to prevalence of OCB restricted to cerebrospinal fluid (CSF) (A) intrathecal IgG synthesis; (B) and intrathecal IgM synthesis; (C) according to the method of Reiber-Felgenhauer.
Ijms 18 02061 g001
Figure 2. Kaplan-Meier curves for conversation of all CIS patients to MS in regard to prevalence of CSF pleocytosis.
Ijms 18 02061 g002
Figure 3. Flow diagram depicting conversion of all CIS patients to MS in regard of the prevalence of OCB restricted to CSF and fulfilling the magnetic resonance imaging (MRI) criteria for dissemination in space.
Ijms 18 02061 g003
Figure 4. Kaplan-Meier curves for conversation to MS of all CIS patients in regard to normal and delayed visual evoked potentials (VEP) (A) and patients with optic neuritis in regard of normal and delayed VEP (B).
Ijms 18 02061 g004
Figure 5. Flow diagram showing conversion of CIS patients with optic neuritis to MS in regard of normal and delayed VEP and the prevalence of OCB.
Ijms 18 02061 g005
Table 1. Demographic and clinical data of patients with clinically isolated syndrome (CIS) who converted to multiple sclerosis (MS) and patients with stable CIS. p-values indicate comparison between MS and patients with stable CIS.
CharacteristicsConverted to MS
(n = 50)
Stable CIS
(n = 70)
p-Value
Age, median (range)33 (17–73)35 (16–60)0.33
Females33/50 (66%)45/70 (64%)0.65
Optic neuritis22/82 (27%)60/82 (73%)0.0001
Paresis/sensory symptoms4/7 (57%)3/7 (43%)0.07
Brainstem symptoms9/13 (69%)4/13 (31%)0.0001
Spinal cord symptoms15/18 (83%)3/18 (17%)0.0001
Table 2. Cerebrospinal fluid findings of patients with clinically isolated syndrome (CIS) who converted to multiple sclerosis (MS) and patients with stable CIS. p-values indicate comparison between MS and patients with stable CIS.
CSF FindingsConverted to MS
(n = 50)
Stable CIS
(n = 70)
p-Value
CSF oligoclonal bands40/50 (80%)33/70 (47%)<0.0001
Intrathecal synthesis (Reiber graphs)32/50 (64%)18/70 (26%)<0.0001
IgG32/50 (64%)16/70 (23%)<0.0001
IgM12/50 (24%)10/70 (14%)0.10
IgA1/50 (2%)3/70 (4%)0.68
Pleocytosis (≥5 cells/µl)38/50 (76%)26/70 (37%)<0.0001
Lactate (>3.5 mmol/L)0 (0%)0 (0%)1
Protein (>500 mg/L)13/50 (26%)14/70 (20%)0.31
Blood-CSF-barrier dysfunction12/50 (24%)17/70 (24%)1

