Article

Hydrogen Peroxide Response in Leaves of Poplar (Populus simonii × Populus nigra) Revealed from Physiological and Proteomic Analyses

1
Alkali Soil Natural Environmental Science Center, Northeast Forestry University, Key Laboratory of Saline-alkali Vegetation Ecology Restoration, Ministry of Education, Harbin 150040, China
2
Development Centre of Plant Germplasm Resources, College of Life and Environmental Sciences, Shanghai Normal University, Shanghai 200234, China
3
Shanghai Center for Plant Stress Biology, Chinese Academy of Sciences, Shanghai 201602, China
4
Department of Biology, Genetics Institute, Plant Molecular and Cellular Program, Interdisciplinary Center for Biotechnology Research, University of Florida, Gainesville, FL 32610, USA
*
Author to whom correspondence should be addressed.
The authors contributed equally to this work.
Int. J. Mol. Sci. 2017, 18(10), 2085; https://doi.org/10.3390/ijms18102085
Submission received: 29 August 2017 / Revised: 25 September 2017 / Accepted: 26 September 2017 / Published: 2 October 2017
(This article belongs to the Special Issue Selected Papers from the 6th National Plant Protein Research Congress)

Abstract

:
Hydrogen peroxide (H2O2) is one of the most abundant reactive oxygen species (ROS), which plays dual roles as a toxic byproduct of cell metabolism and a regulatory signal molecule in plant development and stress response. Populus simonii × Populus nigra is an important cultivated forest species with resistance to cold, drought, insect and disease, and also a key model plant for forest genetic engineering. In this study, H2O2 response in P. simonii × P. nigra leaves was investigated using physiological and proteomics approaches. The seedlings of 50-day-old P. simonii × P. nigra under H2O2 stress exhibited stressful phenotypes, such as increase of in vivo H2O2 content, decrease of photosynthetic rate, elevated osmolytes, antioxidant accumulation, as well as increased activities of several ROS scavenging enzymes. Besides, 81 H2O2-responsive proteins were identified in the poplar leaves. The diverse abundant patterns of these proteins highlight the H2O2-responsive pathways in leaves, including 14-3-3 protein and nucleoside diphosphate kinase (NDPK)-mediated signaling, modulation of thylakoid membrane structure, enhancement of various ROS scavenging pathways, decrease of photosynthesis, dynamics of proteins conformation, and changes in carbohydrate and other metabolisms. This study provides valuable information for understanding H2O2-responsive mechanisms in leaves of P. simonii × P. nigra.

Graphical Abstract

1. Introduction

Various environmental stresses usually affect reactive oxygen species (ROS) homeostasis in plants, leading to the generation of excess ROS, such as singlet oxygen (1O2), superoxide anion radicals (O2•−), hydrogen peroxide (H2O2), and hydroxyl radicals (HO). Among them, H2O2 is the most abundant ROS in plant cells during photosynthesis, photorespiration, and respiration processes [1]. The relatively stable non-radical H2O2 can easily penetrate membrane through water channels, functioning as a likely long-distance signaling molecule in plant growth and stress perception [2]. Moreover, H2O2 has been proven to be a regulator of many physiological processes, such as cell wall modulation, senescence, phytoalexin production, photosynthesis, stomatal movement, and cell cycle [3]. Excess H2O2 has obvious oxidative destruction of diverse molecules (e.g., proteins, nucleic acids, carbohydrates, and unsaturated lipids) in plant cells [4], which disturbs cellular activity and causes programmed cell death [2]. Interestingly, considerable investigations have shown that low concentration of H2O2 can improve seed germination [5] and plant resistance to various abiotic and biotic stresses, such as salinity [6,7], osmotic stress [8], aluminum [9], heat [6], chilling [10], paraquat [11], and potato virus Y infection [12]. H2O2 changes in cells showed as a bell-shaped response with an optimum, depending on the plant species, developmental stages, cell types, and environmental conditions [2,7].
Previous transcriptomic analyses have reported a large number of H2O2-responsive genes in various plants. For example, more than 170 non-redundant expressed sequence tags (ESTs) in Arabidopsis [13], 713 ESTs in catalase (CAT)-deficient tobacco plants [14], and 437 transcripts in CAT-deficient Arabidopsis [15] were identified as H2O2 responsive genes. In addition, 6156, 6875 and 3276 transcripts were differentially expressed in three wheat lines including a powdery mildew resistant (PmA) line and two susceptible (Han and Cha) lines [16]. Recently, more than 385 H2O2-responsive proteins were identified in leaves from rice (Oryza sativa L. cv. 93–11) [17], citrus (Citrus aurantium L.) [18], Brachypodium distachyon [19], and wheat (Triticum aestivum L.) [20] using two-dimensional gel electrophoresis (2DE)-based or isobaric tags for relative and absolute quantification (iTRAQ)-based proteomics approaches. The dynamic abundance patterns of these proteins imply that ROS homeostasis, signaling, photosynthesis, energy metabolism, lipid metabolism, and protein turnover play important roles in leaf H2O2 response. However, most of these proteomics studies focused on model plants and crops. Proteomic analysis of the response of forest trees to H2O2 stress has not been reported.
Poplar trees are widely planted, and poplar woods are commonly used for building materials, furniture and paper [21]. With the sequencing of Populus genome, poplar has emerged as a model system for molecular and genetic studies of forest trees [21]. Populus simonii × Populus nigra, also called as Populus xiaohei, is the hybrid of Populus simonii and Populus nigra, which widely distributes in northern China, and has been well used for afforestation and commercial forest. P. simonii × P. nigra is a fast-growing tree species with excellent properties of resistance to cold, drought, insect and disease. The early studies of P. simonii × P. nigra were mainly focused on cultivation and germplasm introduction [22]. Recently, research has been focused on using transgenic technology to improve salt and drought tolerance [23], insect resistance [24], and disease resistance [25]. Besides, transcriptics and proteomics have been utilized to study P. simonii × P. nigra [26,27,28,29]. Thousands of genes were shown to be differentially expressed in response to NaCl stress using cDNA-amplified fragment length polymorphism approach [26] and Solexa/illumine digital gene expression technique [27]. Additionally, genome-wide and proteomic analysis of a TaLEA (Tamarix androssowii late embryogenesis abundant gene)-introduced transgenic P. simonii × P. nigra dwarf mutant showed 537 genes and 99 proteins were significantly altered, respectively [28,29]. However, there is still lack of proteomics information of P. simonii × P. nigra in response to stresses. Thus, the dynamic proteomic analysis of P. simonii × P. nigra under H2O2 stress is important for further investigation of the molecular mechanism of oxidative stress and biotechnological manipulation with the aim of enhancing poplar stress tolerance.
In this study, we performed physiological and proteomic analyses of P. simonii × P. nigra leaves under 0, 12, 24 and 36 mM H2O2 treatments for 6 h. Our results indicate that modulation of thylakoid structure, ROS scavenging pathways, photosynthesis, and protein conformation play critical roles in P. simonii × P. nigra leaves in response to H2O2. These results provide new insights into the molecular mechanisms underlying poplar response to H2O2 stress.

2. Results

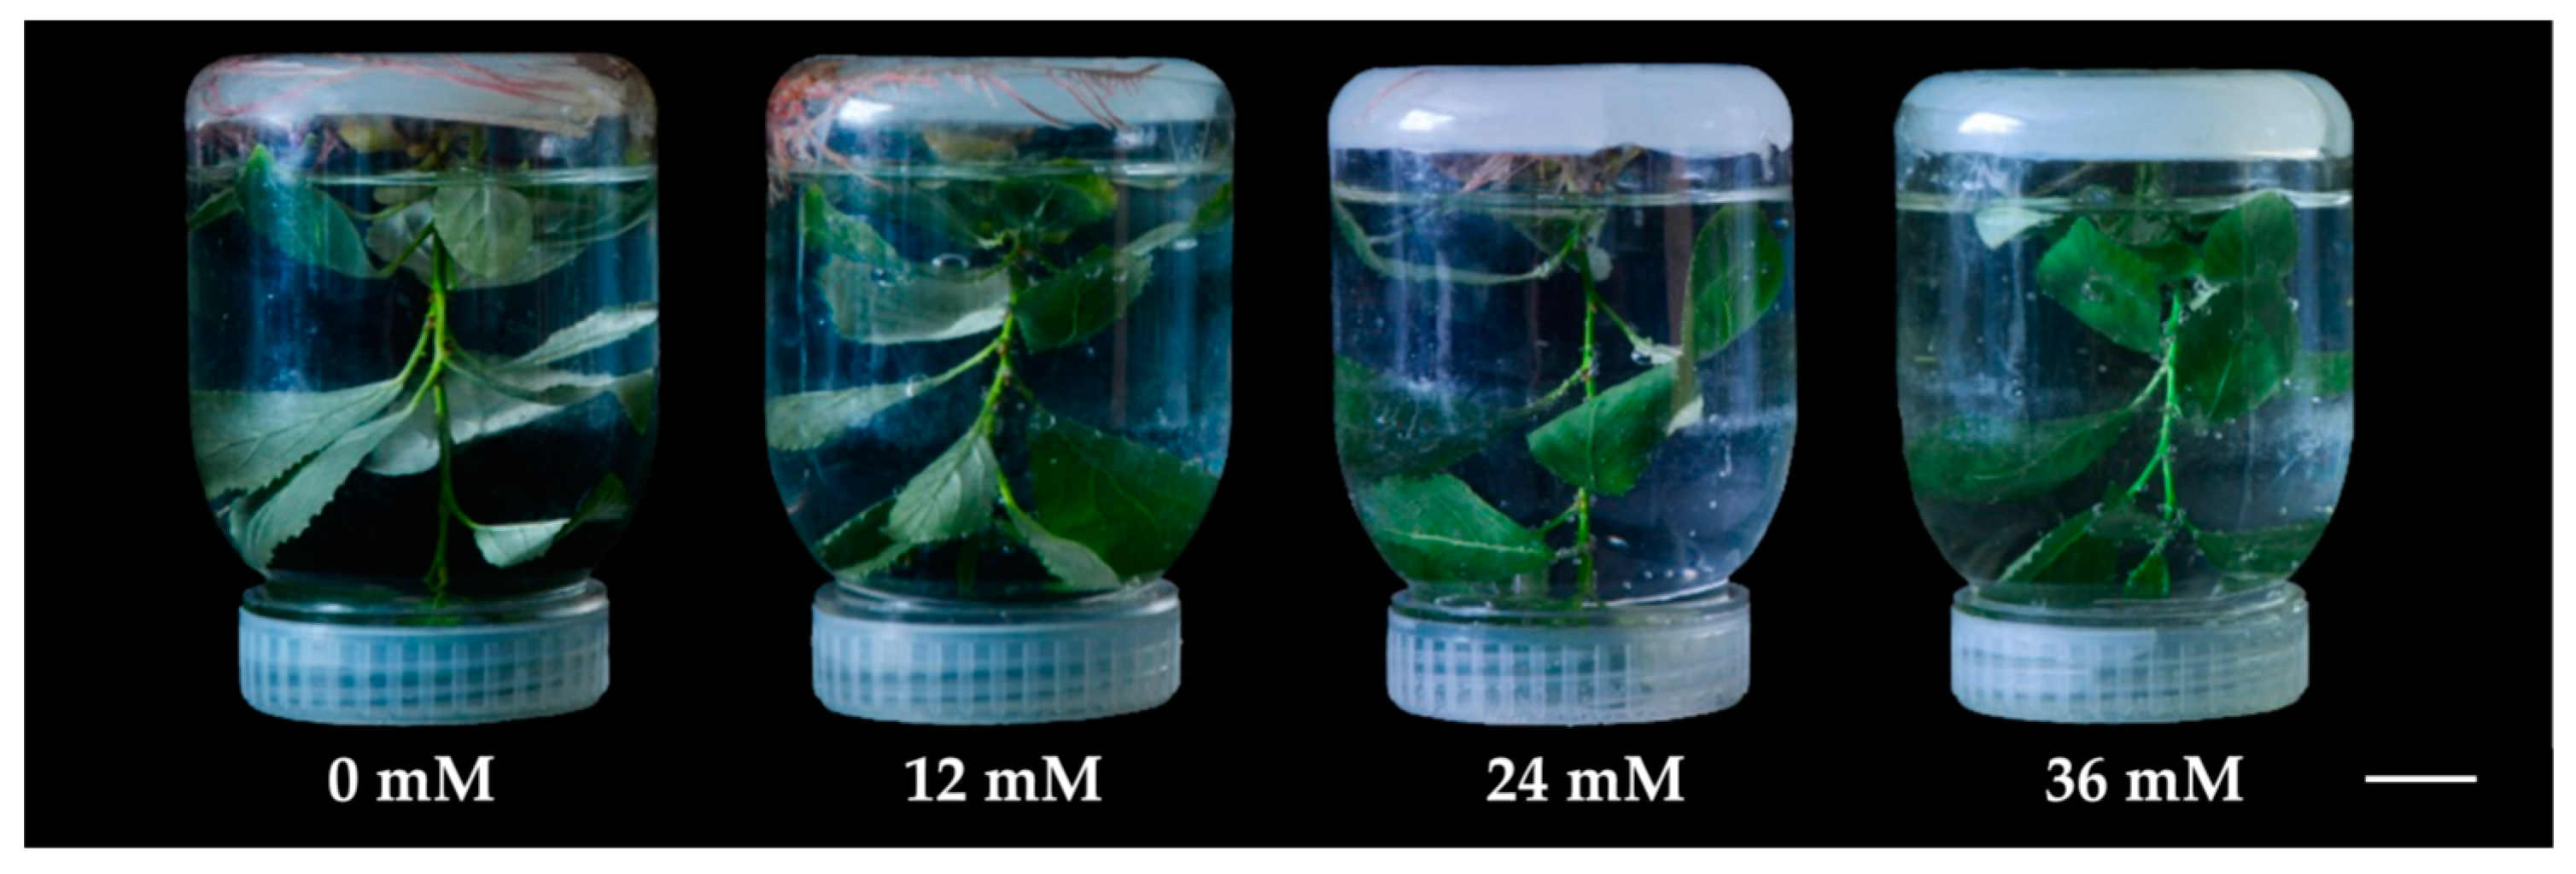
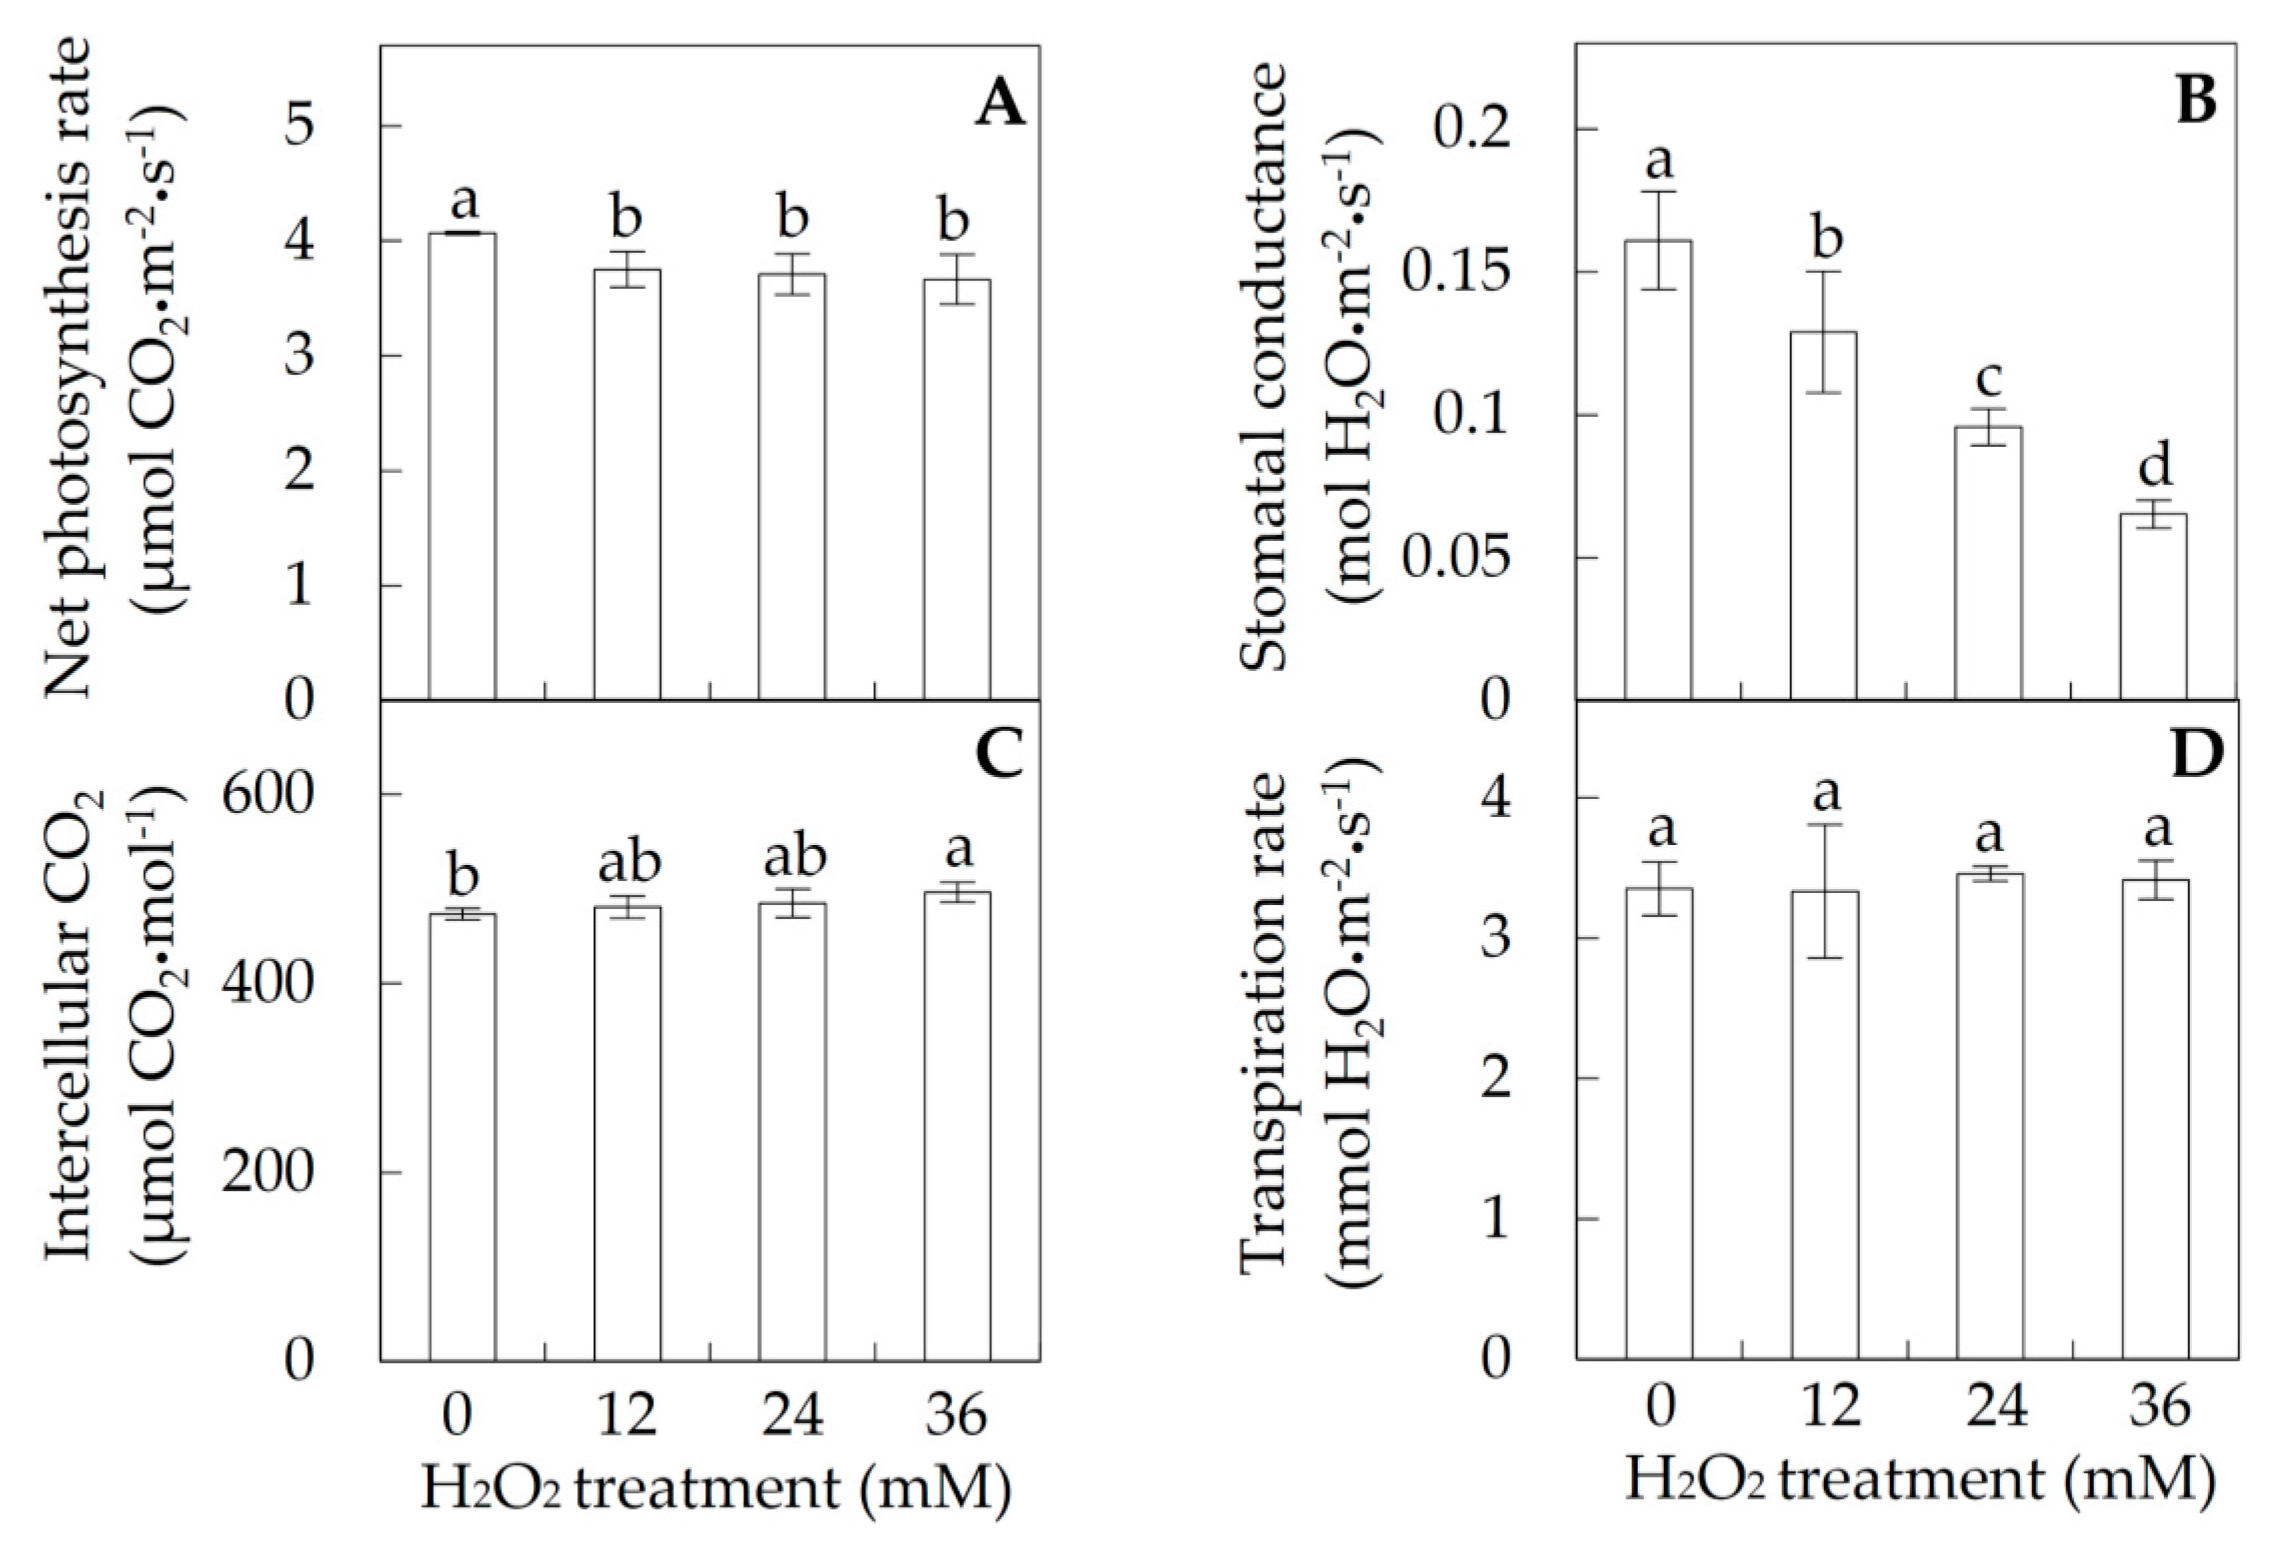
2.1. Photosynthesis under Hydrogen Peroxide (H2O2) Stress

The leaves of P. simonii × P. nigra were immersed in 0, 12, 24 and 36 mM H2O2 solutions for 6 h, respectively (Figure 1). The photosynthetic parameters were measured to evaluate the photosynthetic changes in response to the H2O2 stress. The net photosynthetic rate (Pn) decreased from 4 μmol CO2∙m−2·s−1 in control to about 3.7 μmol CO2∙m−2·s−1 under each H2O2 treatment (Figure 2A). The stomatal conductances (Gs) under 12, 24, and 36 mM H2O2 were also reduced 1.2-, 1.7-, and 2.4-fold, respectively, when compared with control (Figure 2B). In addition, the intercellular CO2 concentration (Ci) increased slightly from 473.2 μmol CO2·mol−1 in control to 496.3 μmol CO2·mol−1 under 36 mM H2O2, but the transpiration rate (Tr) was not significantly altered under the H2O2 stress (Figure 2C,D).

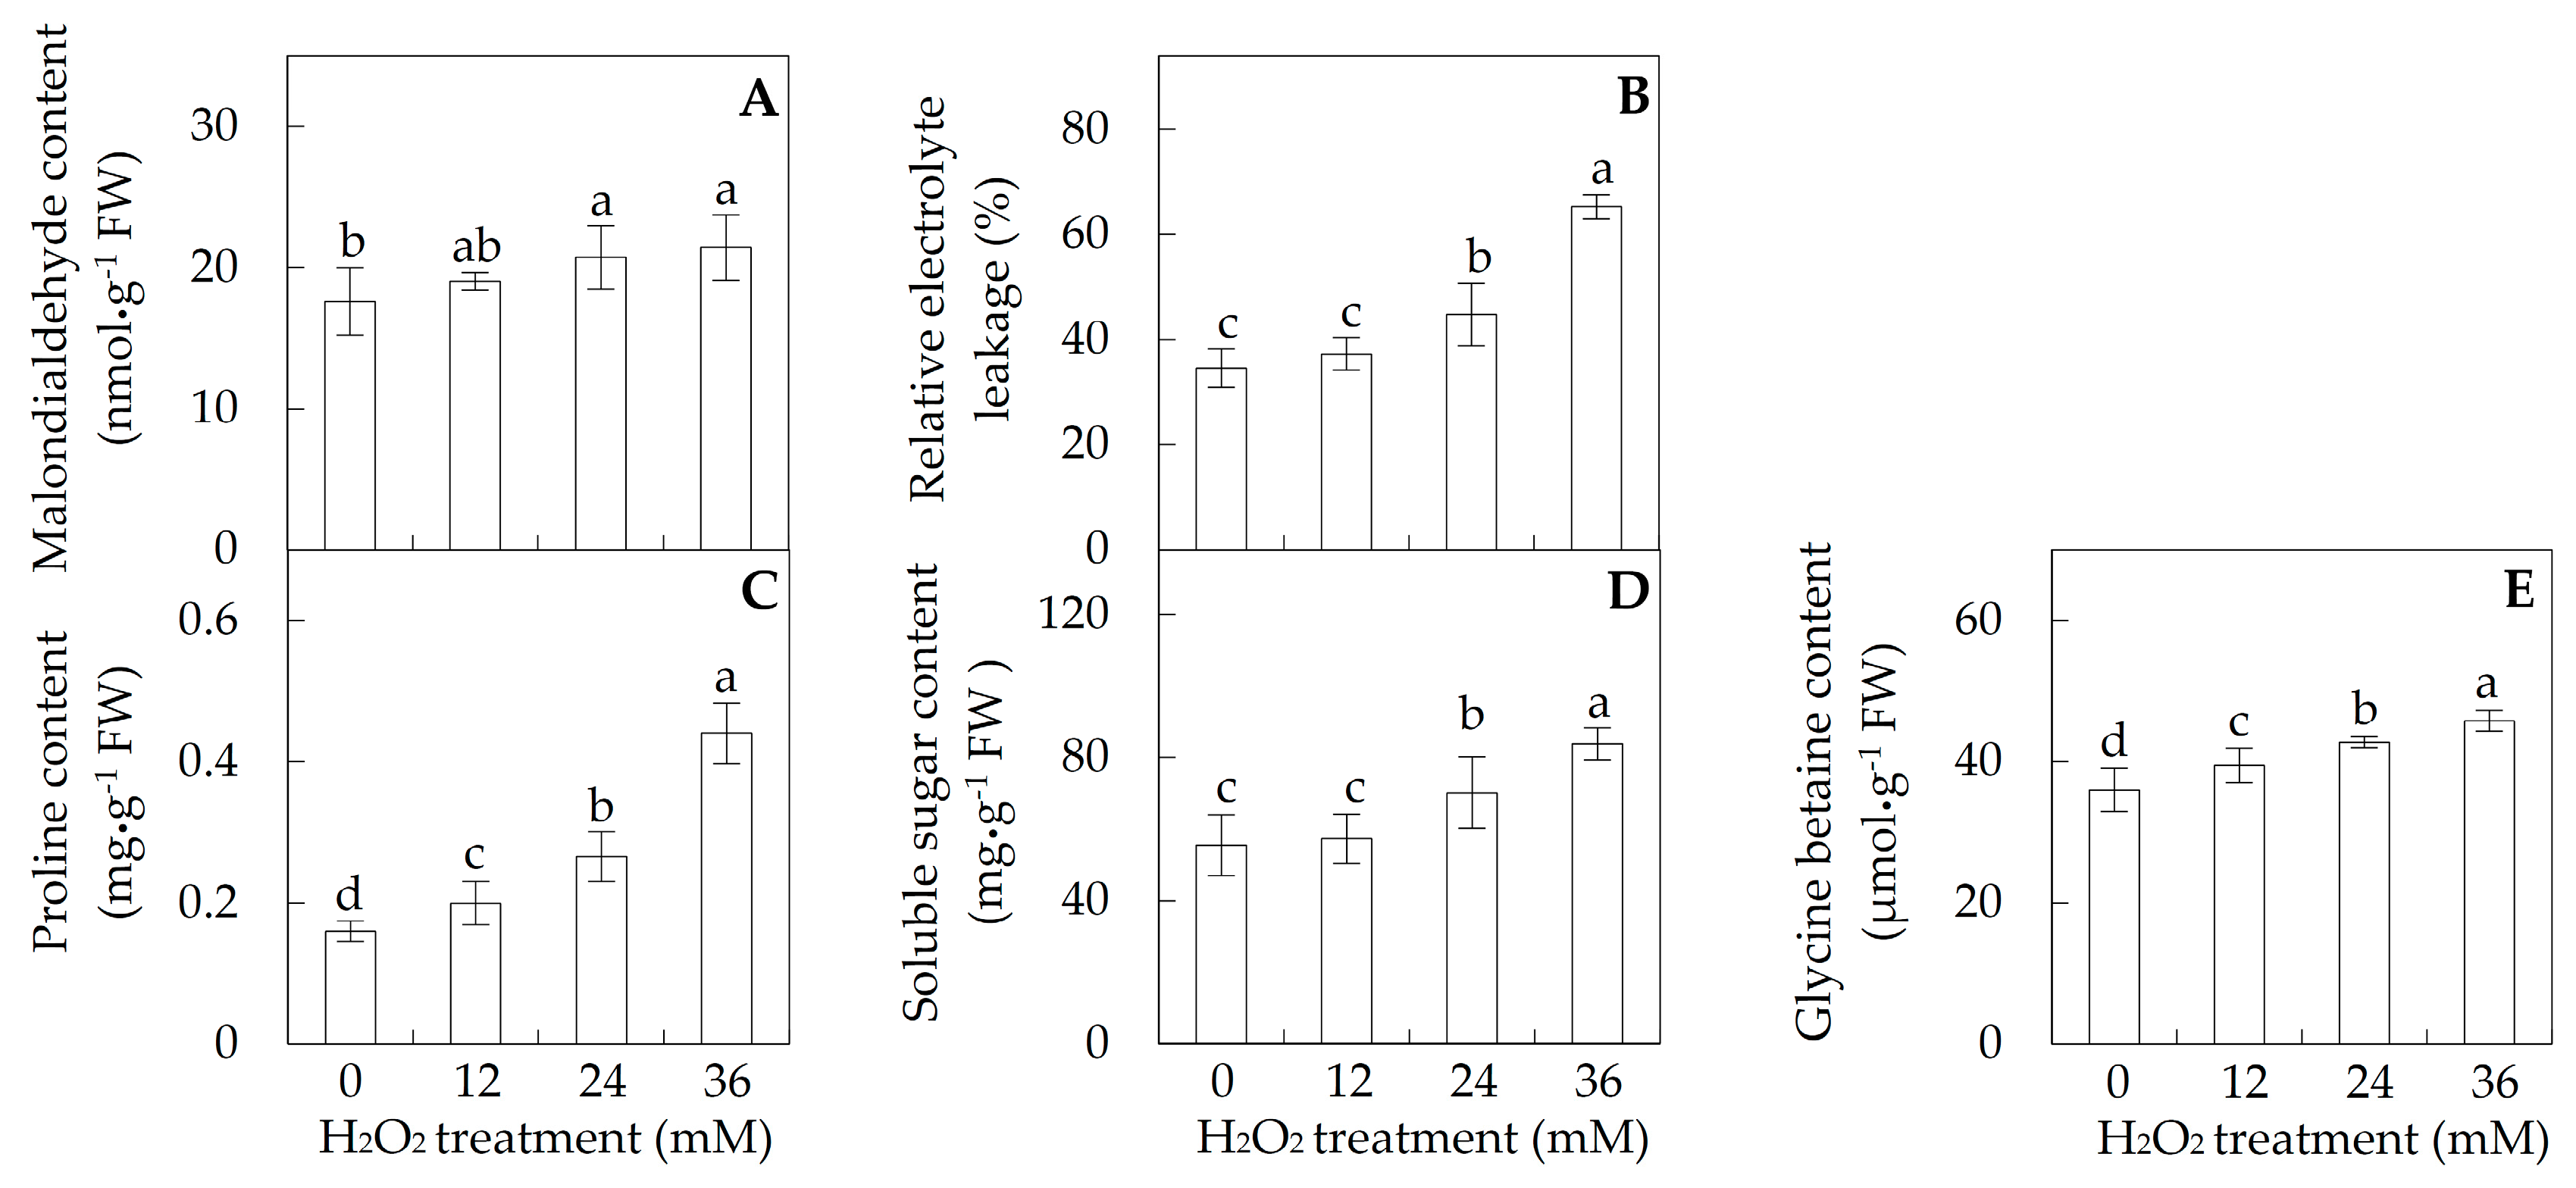
2.2. Membrane Integrity and Osmolyte Accumulation in Leaves

To evaluate the effects of H2O2 on membrane stability, the malondialdehyde (MDA) content and relative electrolyte leakage (REL) in leaves were determined. MDA contents and RELs were not changed under 12 mM H2O2, but increased under 24 and 36 mM H2O2 (Figure 3A,B). MDA contents were increased from 17.6 nmol·g−1 fresh weight (FW) in control to about 21.4 nmol·g−1 FW under 24 and 36 mM H2O2 (Figure 3A). For REL, a 1.3-fold increase under 24 mM H2O2 and a 1.9-fold under 36 mM H2O2 were observed when compared with control (Figure 3B).
In addition, the contents of proline and glycine betaine were increased gradually and significantly with the increasing concentration of H2O2. The proline contents under H2O2 treatment of 12, 24 and 36 mM were increased 1.3-, 1.7-, and 2.8-fold, respectively (Figure 3C). The contents of glycine betaine under three H2O2 treatments were increased 1.1-, 1.2-, 1.3-fold, respectively (Figure 3E). In addition, the contents of soluble sugar were increased 1.3-fold under 24 mM and 1.5-fold under 36 mM H2O2 (Figure 3D).

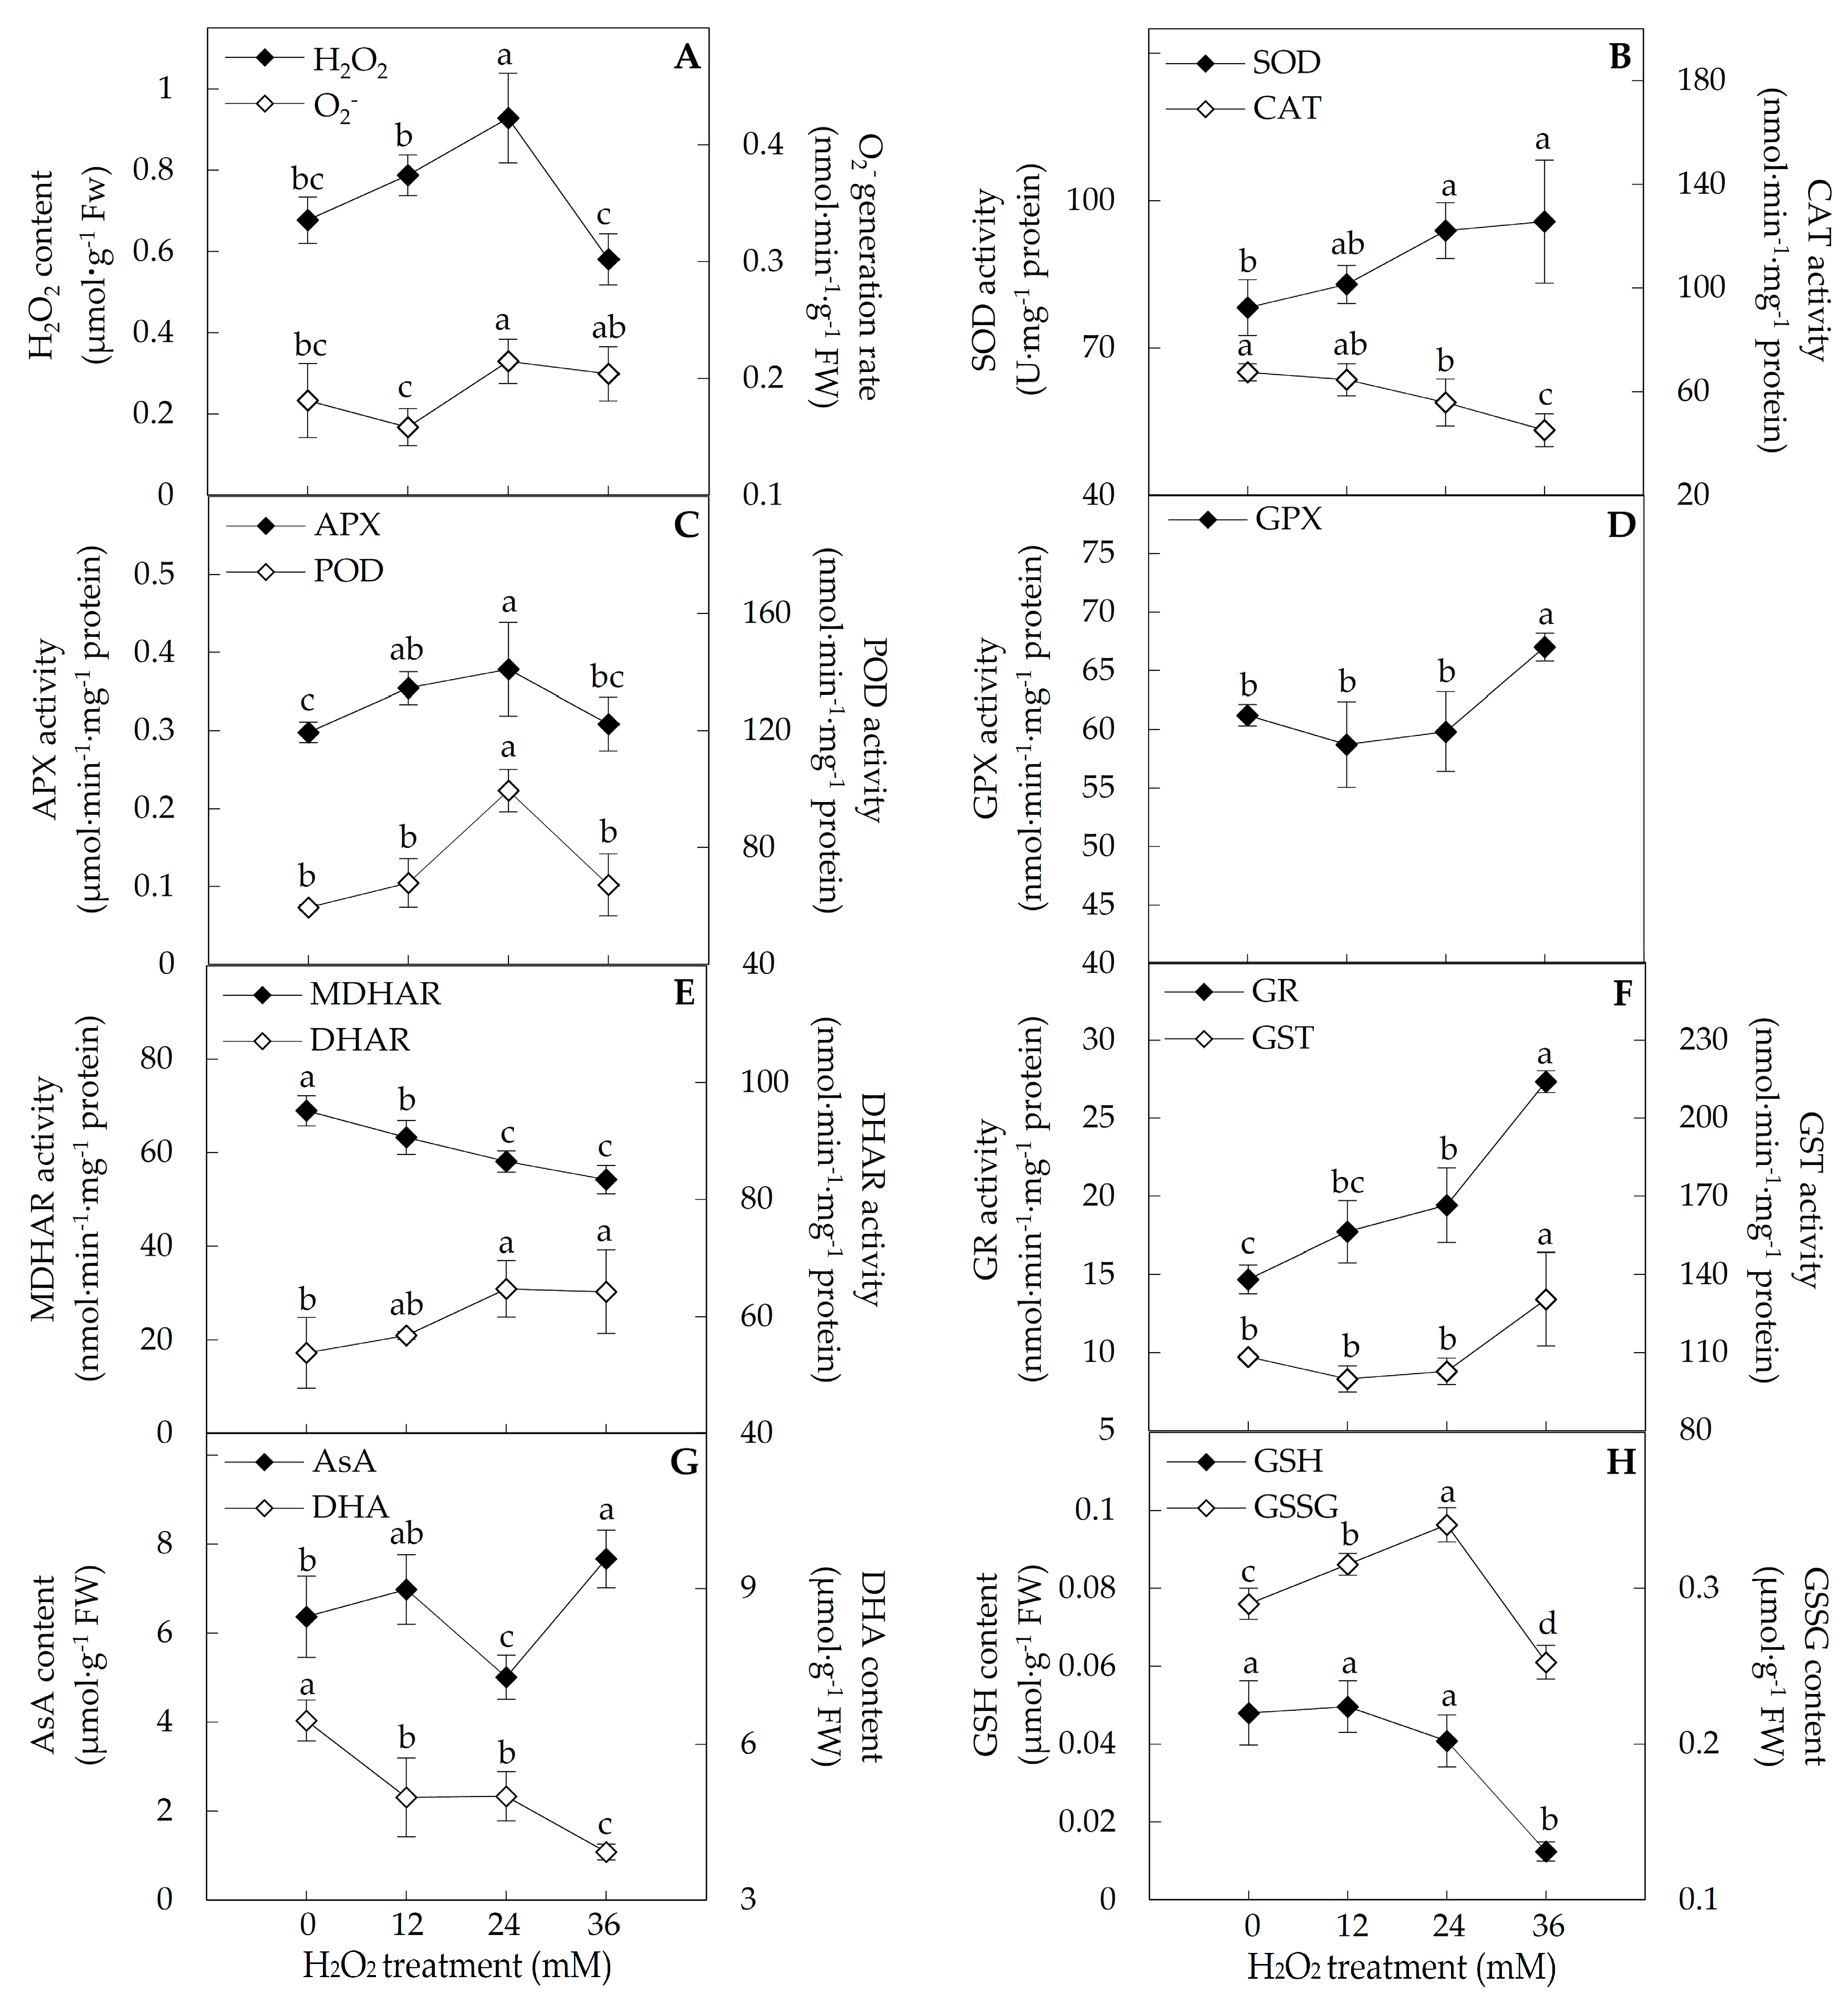
2.3. ROS and Antioxidant Substances Content, and Antioxidant Enzyme Activities

To evaluate the ROS homeostasis in the H2O2-treated leaves, the O2•− generation rate, H2O2 content, and the activities of several ROS scavenging enzymes were analyzed. The O2•− generation rate remained constant under 12 and 36 mM H2O2 treatments, but was increased 1.2-fold under 24 mM H2O2 treatment (Figure 4A). H2O2 content in leaves was increased 1.4-fold under 24 mM H2O2 treatment (Figure 4A). Superoxide dismutase (SOD) activity was increased about 1.2-fold under 24 and 36 mM H2O2 treatments (Figure 4B). Besides, the activities of several ROS scavenging enzymes were altered in leaves under certain H2O2 concentrations. The CAT activities were decreased 1.2-fold under 24 mM and 1.5-fold under 36 mM H2O2 treatments (Figure 4B). However, the activities of ascorbate peroxidase (APX) were increased about 1.2-fold under 12 and 24 mM H2O2, and peroxidase (POD) activity was increased 1.7-fold under 24 mM H2O2 (Figure 4C). The glutathione peroxidase (GPX) activity was increased 1.1-fold under 36 mM H2O2 treatment (Figure 4D). Moreover, the activities of three enzymes involved in the regeneration of the reduced antioxidants were all altered under the H2O2 stress. The activity of monodehydroascorbate reductase (MDHAR) was inhibited, while the activities of dehydroascorbate reductase (DHAR) and glutathione reductase (GR) were significantly increased under H2O2 treatments (Figure 4E,F). The activities of MDHAR under three H2O2 treatments were reduced 1.1-, 1.2-, and 1.3-fold, respectively. DHAR activities were increased about 1.2-fold under 24 and 36 mM H2O2, and GR activities were increased 1.3-fold under 24 mM H2O2 and 1.9-fold under 36 mM H2O2 (Figure 4E,F). In addition, the glutathione S-transferase (GST) activity was induced 1.2-fold under 36 mM H2O2 treatment (Figure 4F).
In addition, ascorbate (AsA), dehydroascorbate (DHA), reduced glutathione (GSH), and oxidized glutathione (GSSG) were detected in leaves in response to the H2O2 treatment. The contents of AsA were decreased 1.3-fold under 24 mM H2O2, but increased 1.2-fold under 36 mM H2O2 treatment (Figure 4G). The contents of DHA and GSH were all reduced under H2O2 treatment. DHA contents were decreased about 1.3-fold under 12 and 24 mM H2O2, and 1.6-fold under 36 mM H2O2 (Figure 4G). GSH contents were decreased significantly with 3.9-fold under 36 mM H2O2 (Figure 4H). The contents of GSSG were increased 1.1-fold under 12 mM H2O2 and 1.2-fold under 24 mM H2O2, but decreased 1.2-fold under 36 mM H2O2 treatment (Figure 4H).

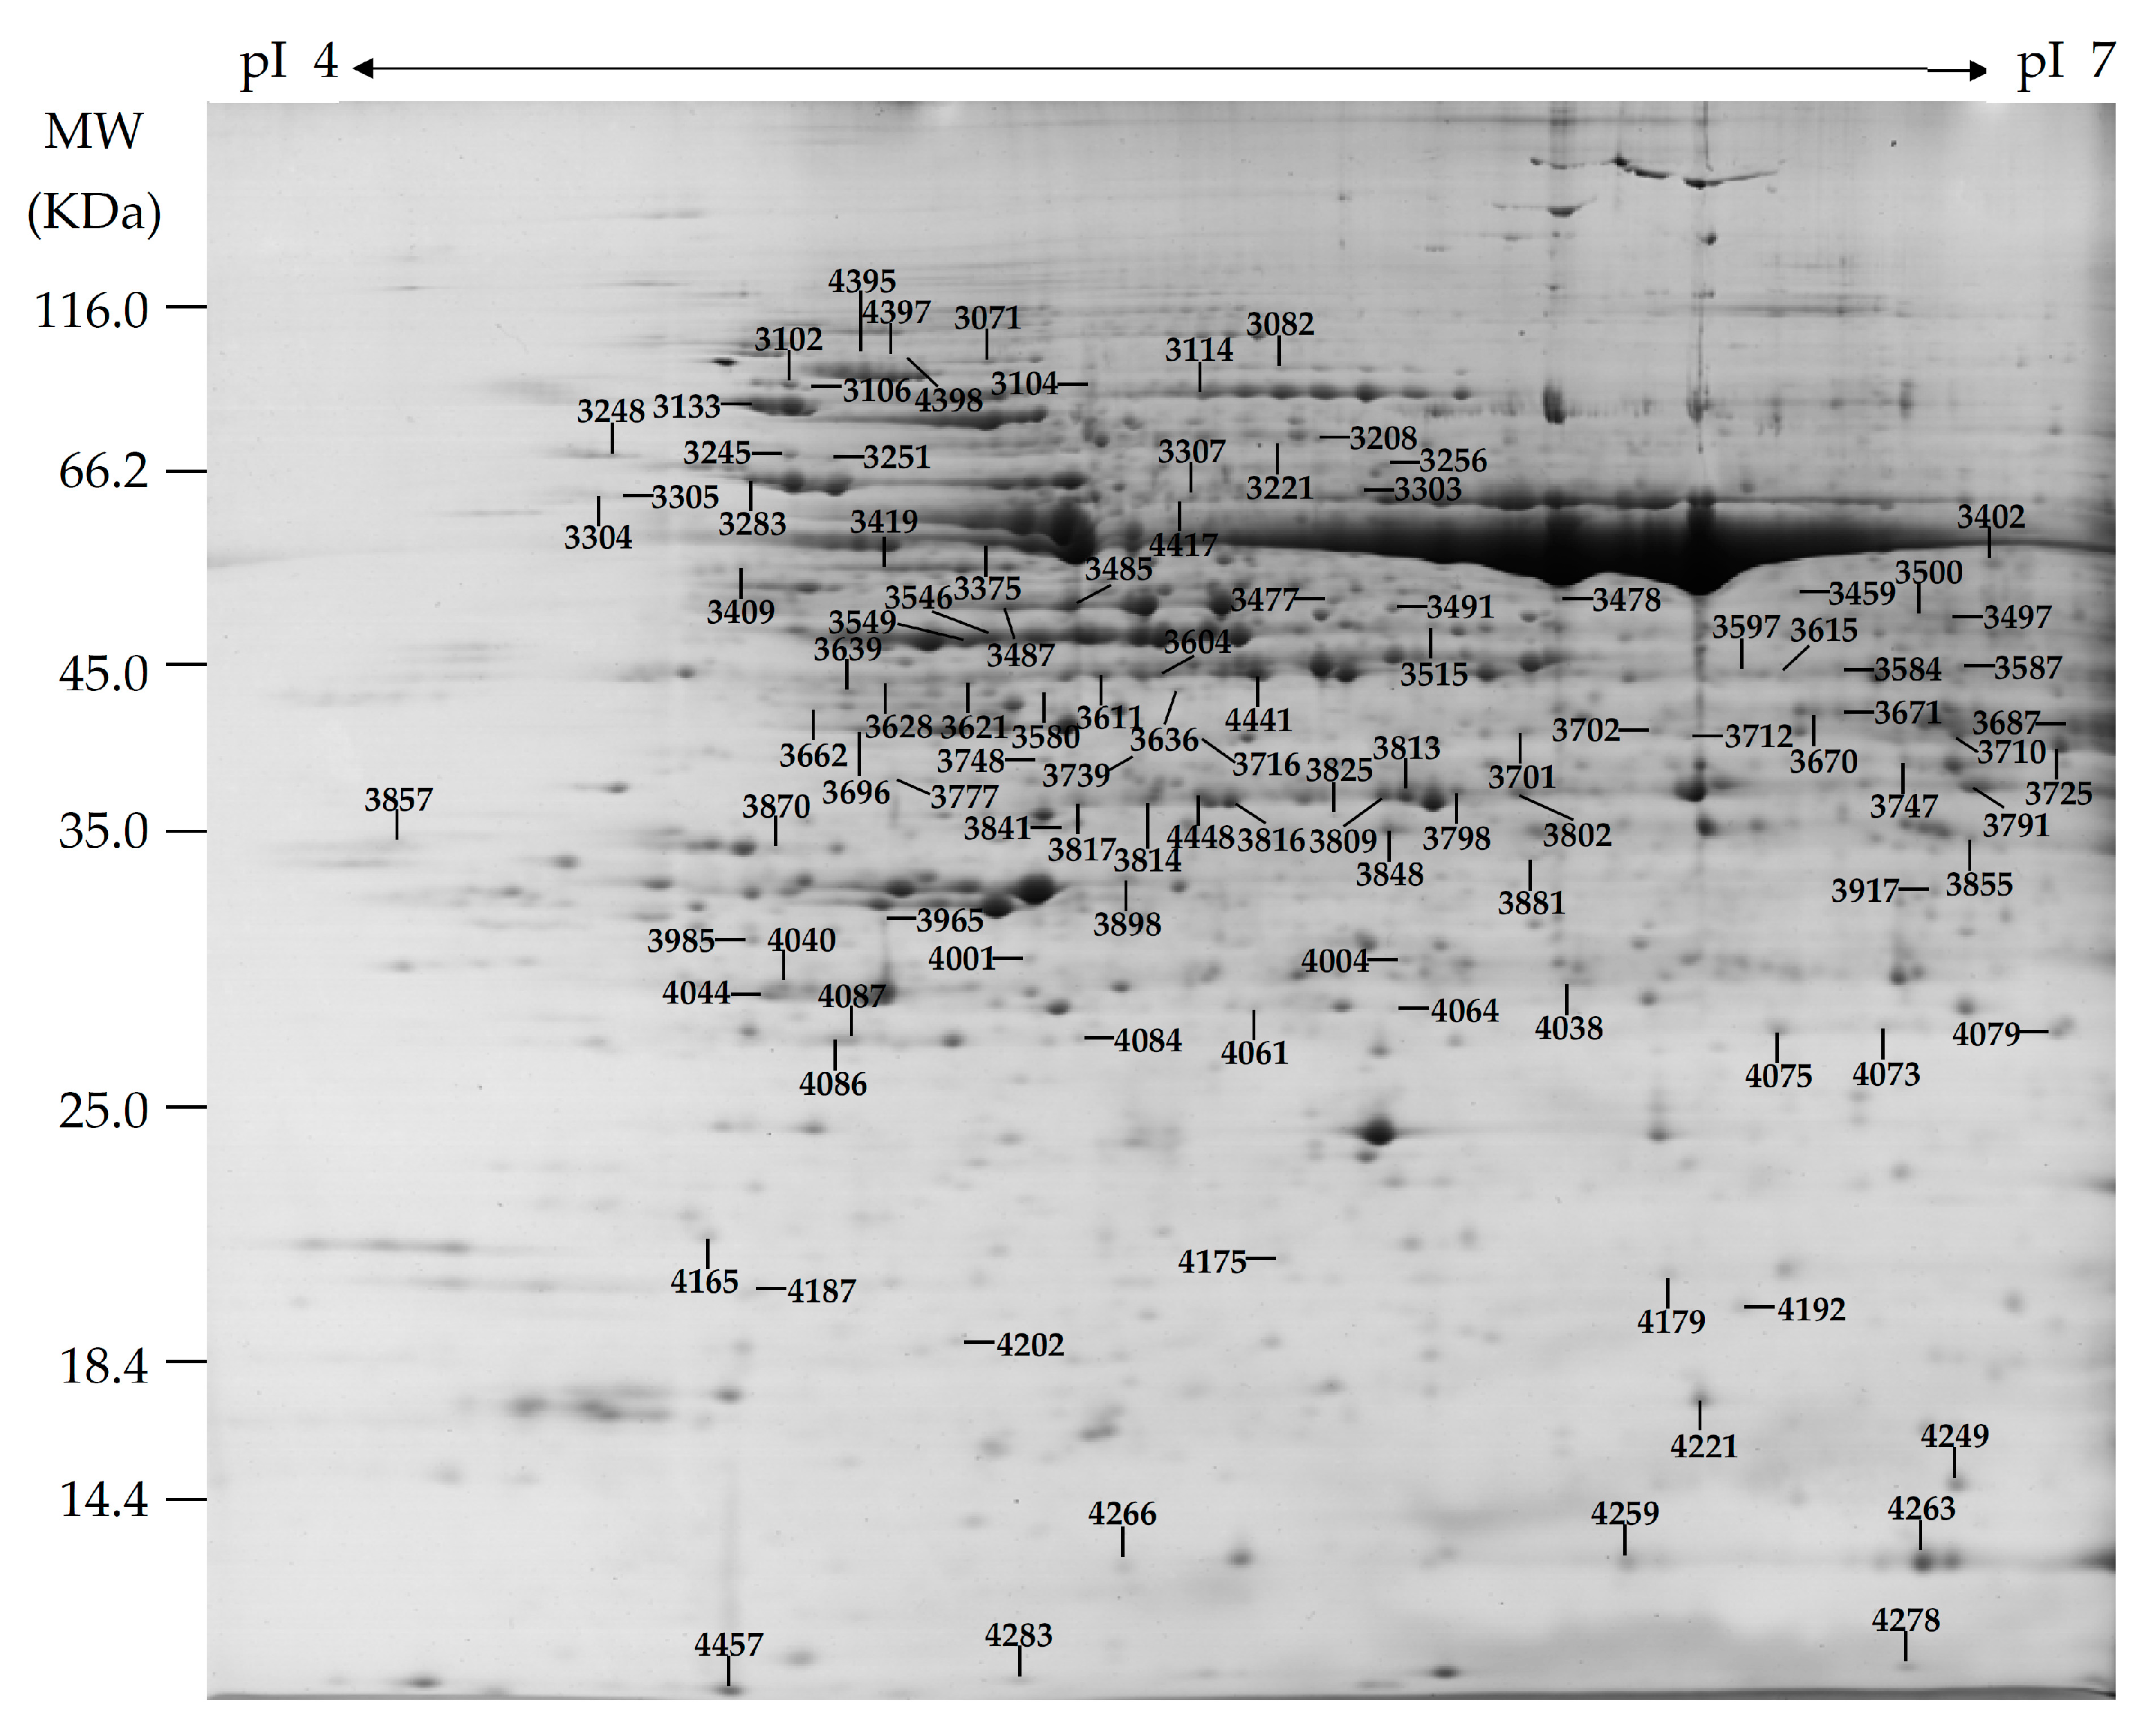
2.4. Identification of H2O2-Responsive Proteins in Leaves

To explore the differential accumulated proteins (DAP) in P. simonii × P. nigra leaves in response to H2O2, the protein profiles in 0, 12, 24 and 36 mM H2O2-treated leaves were obtained using 2DE. On Coomassie Brilliant Blue (CBB)-stained gels (24 cm, pH 4–7 linear gradient immobilized pH gradient strips), 877 ± 21, 838 ± 23, 768 ± 48, and 811 ± 31 protein spots from 0, 12, 24 and 36 mM H2O2-treated leaves were detected, respectively (Figure 5 and Figure S1). Among them, 114 protein spots showed differential abundances in leaves under four distinct H2O2 concentrations (fold change > 1.5 and p < 0.05). All of the 114 DAP spots were subjected to in-gel digestion and protein identification using tandem mass spectrometry. A total of 83 DAPs were identified using matrix-assisted laser desorption/ ionization (MALDI) tandem time of flight (TOF-TOF) mass spectrometry (MS) and Mascot Searching with stringent criteria. Among the 83 identified DAP spots, 81 DAP spots contained a single protein each (Table 1 and Table S1), and the remaining two DAP spots contained more than one protein each (Table S2). Thus, the 81 DAPs were taken as H2O2-responsive proteins in leaves of P. simonii × P. nigra.

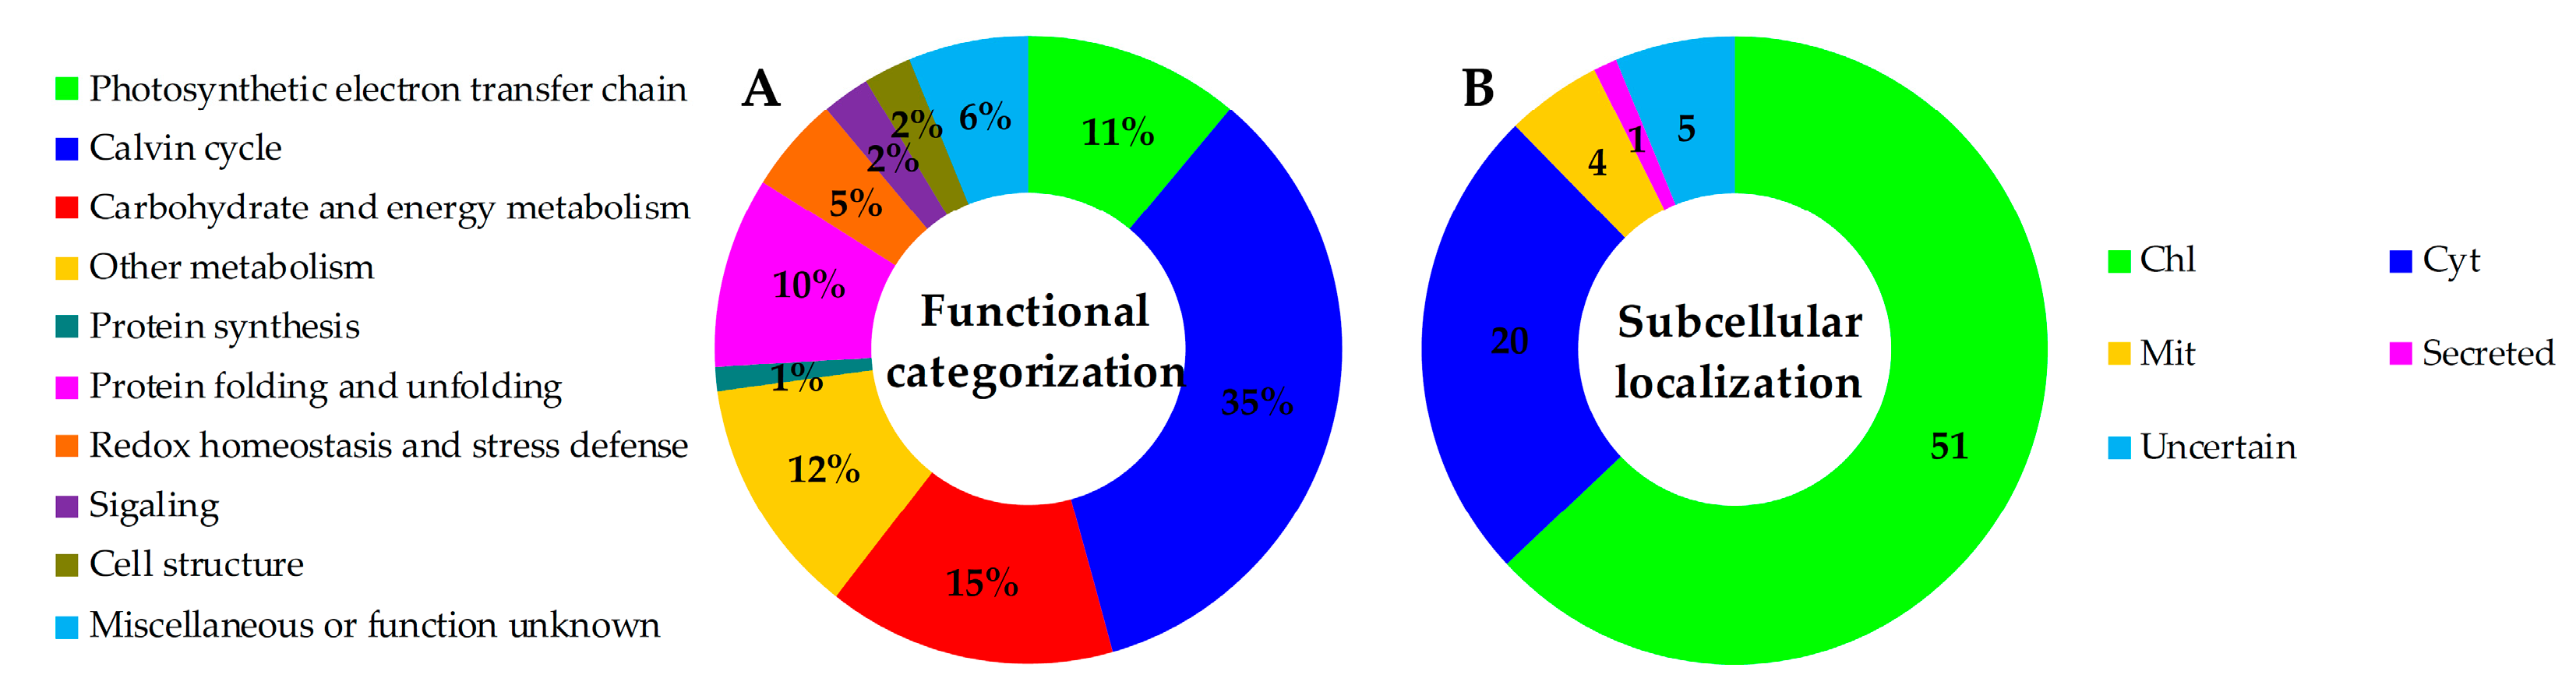
2.5. Annotation and Functional Categorization of the H2O2-Responsive Proteins

Among the 81 H2O2-responsive proteins, 34 proteins were originally annotated as unknown, hypothetical proteins, or without annotation. They were all re-annotated according to the Basic Local Alignment Search Tool (BLAST) analysis (Table 1 and Table S3). Based on BLAST alignments, Gene Ontology, subcellular localization prediction, and information from literature, the 81 proteins were classified into ten functional categories including photosynthetic electron transfer chain, Calvin cycle, carbohydrate and energy metabolism, other metabolism, protein synthesis, protein folding and unfolding, redox homeostasis and stress defense, signaling, cell structure, and miscellaneous or function unknown (Table 1 and Figure 6A). Interestingly, proteins involved in photosynthetic electron transfer and Calvin cycle accounted for the largest group (46% of H2O2-responsive proteins). Besides, carbohydrate and energy metabolism (15%), other metabolism (12%), as well as protein folding and unfolding (10%) were also over-represented.

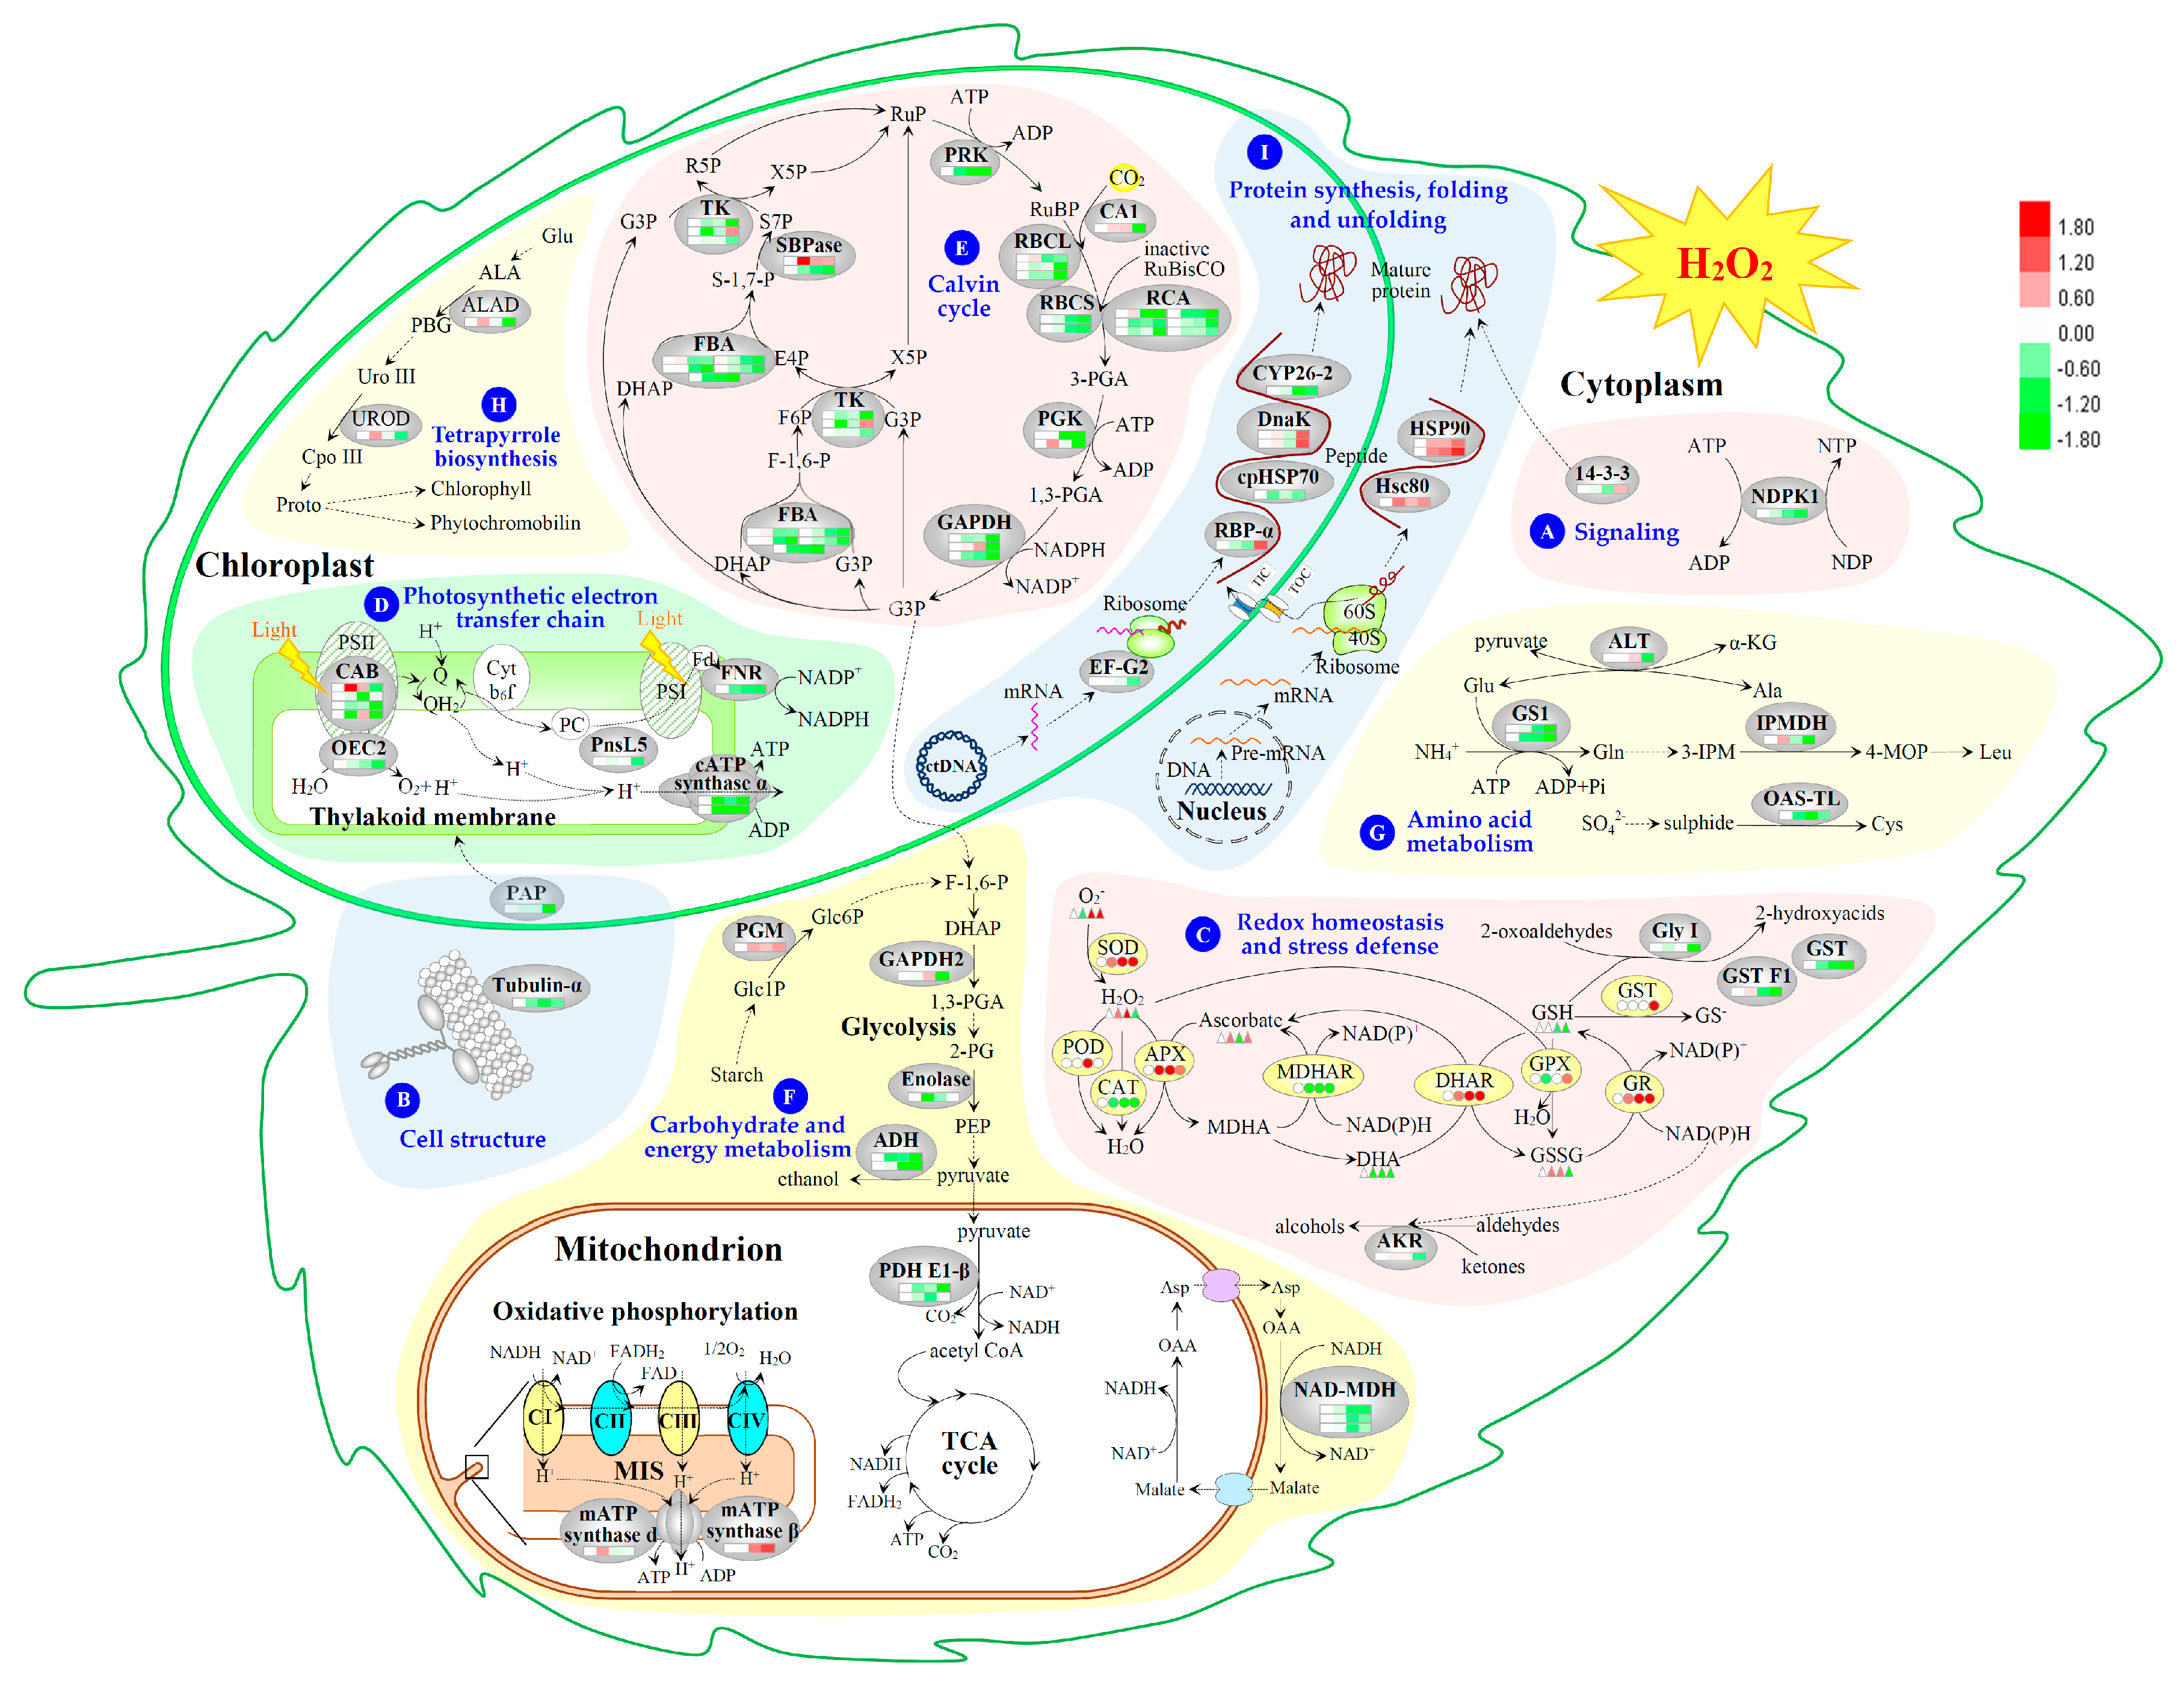
2.6. Subcellular Localization and Hierarchical Clustering of H2O2-Responsive Proteins

The subcellular localization of the 81 proteins was predicted using five different tools (i.e., YLoc, LocTree3, Plant-mPLoc, ngLOC, and TargetP) (Figure 6B, Table 1 and Table S4). In total, 51 proteins (63%) were predicted to be localized in chloroplasts, 20 in cytoplasm, four in mitochondria, one secreted, and five uncertain. This implied that most chloroplast proteins were obviously affected by H2O2.

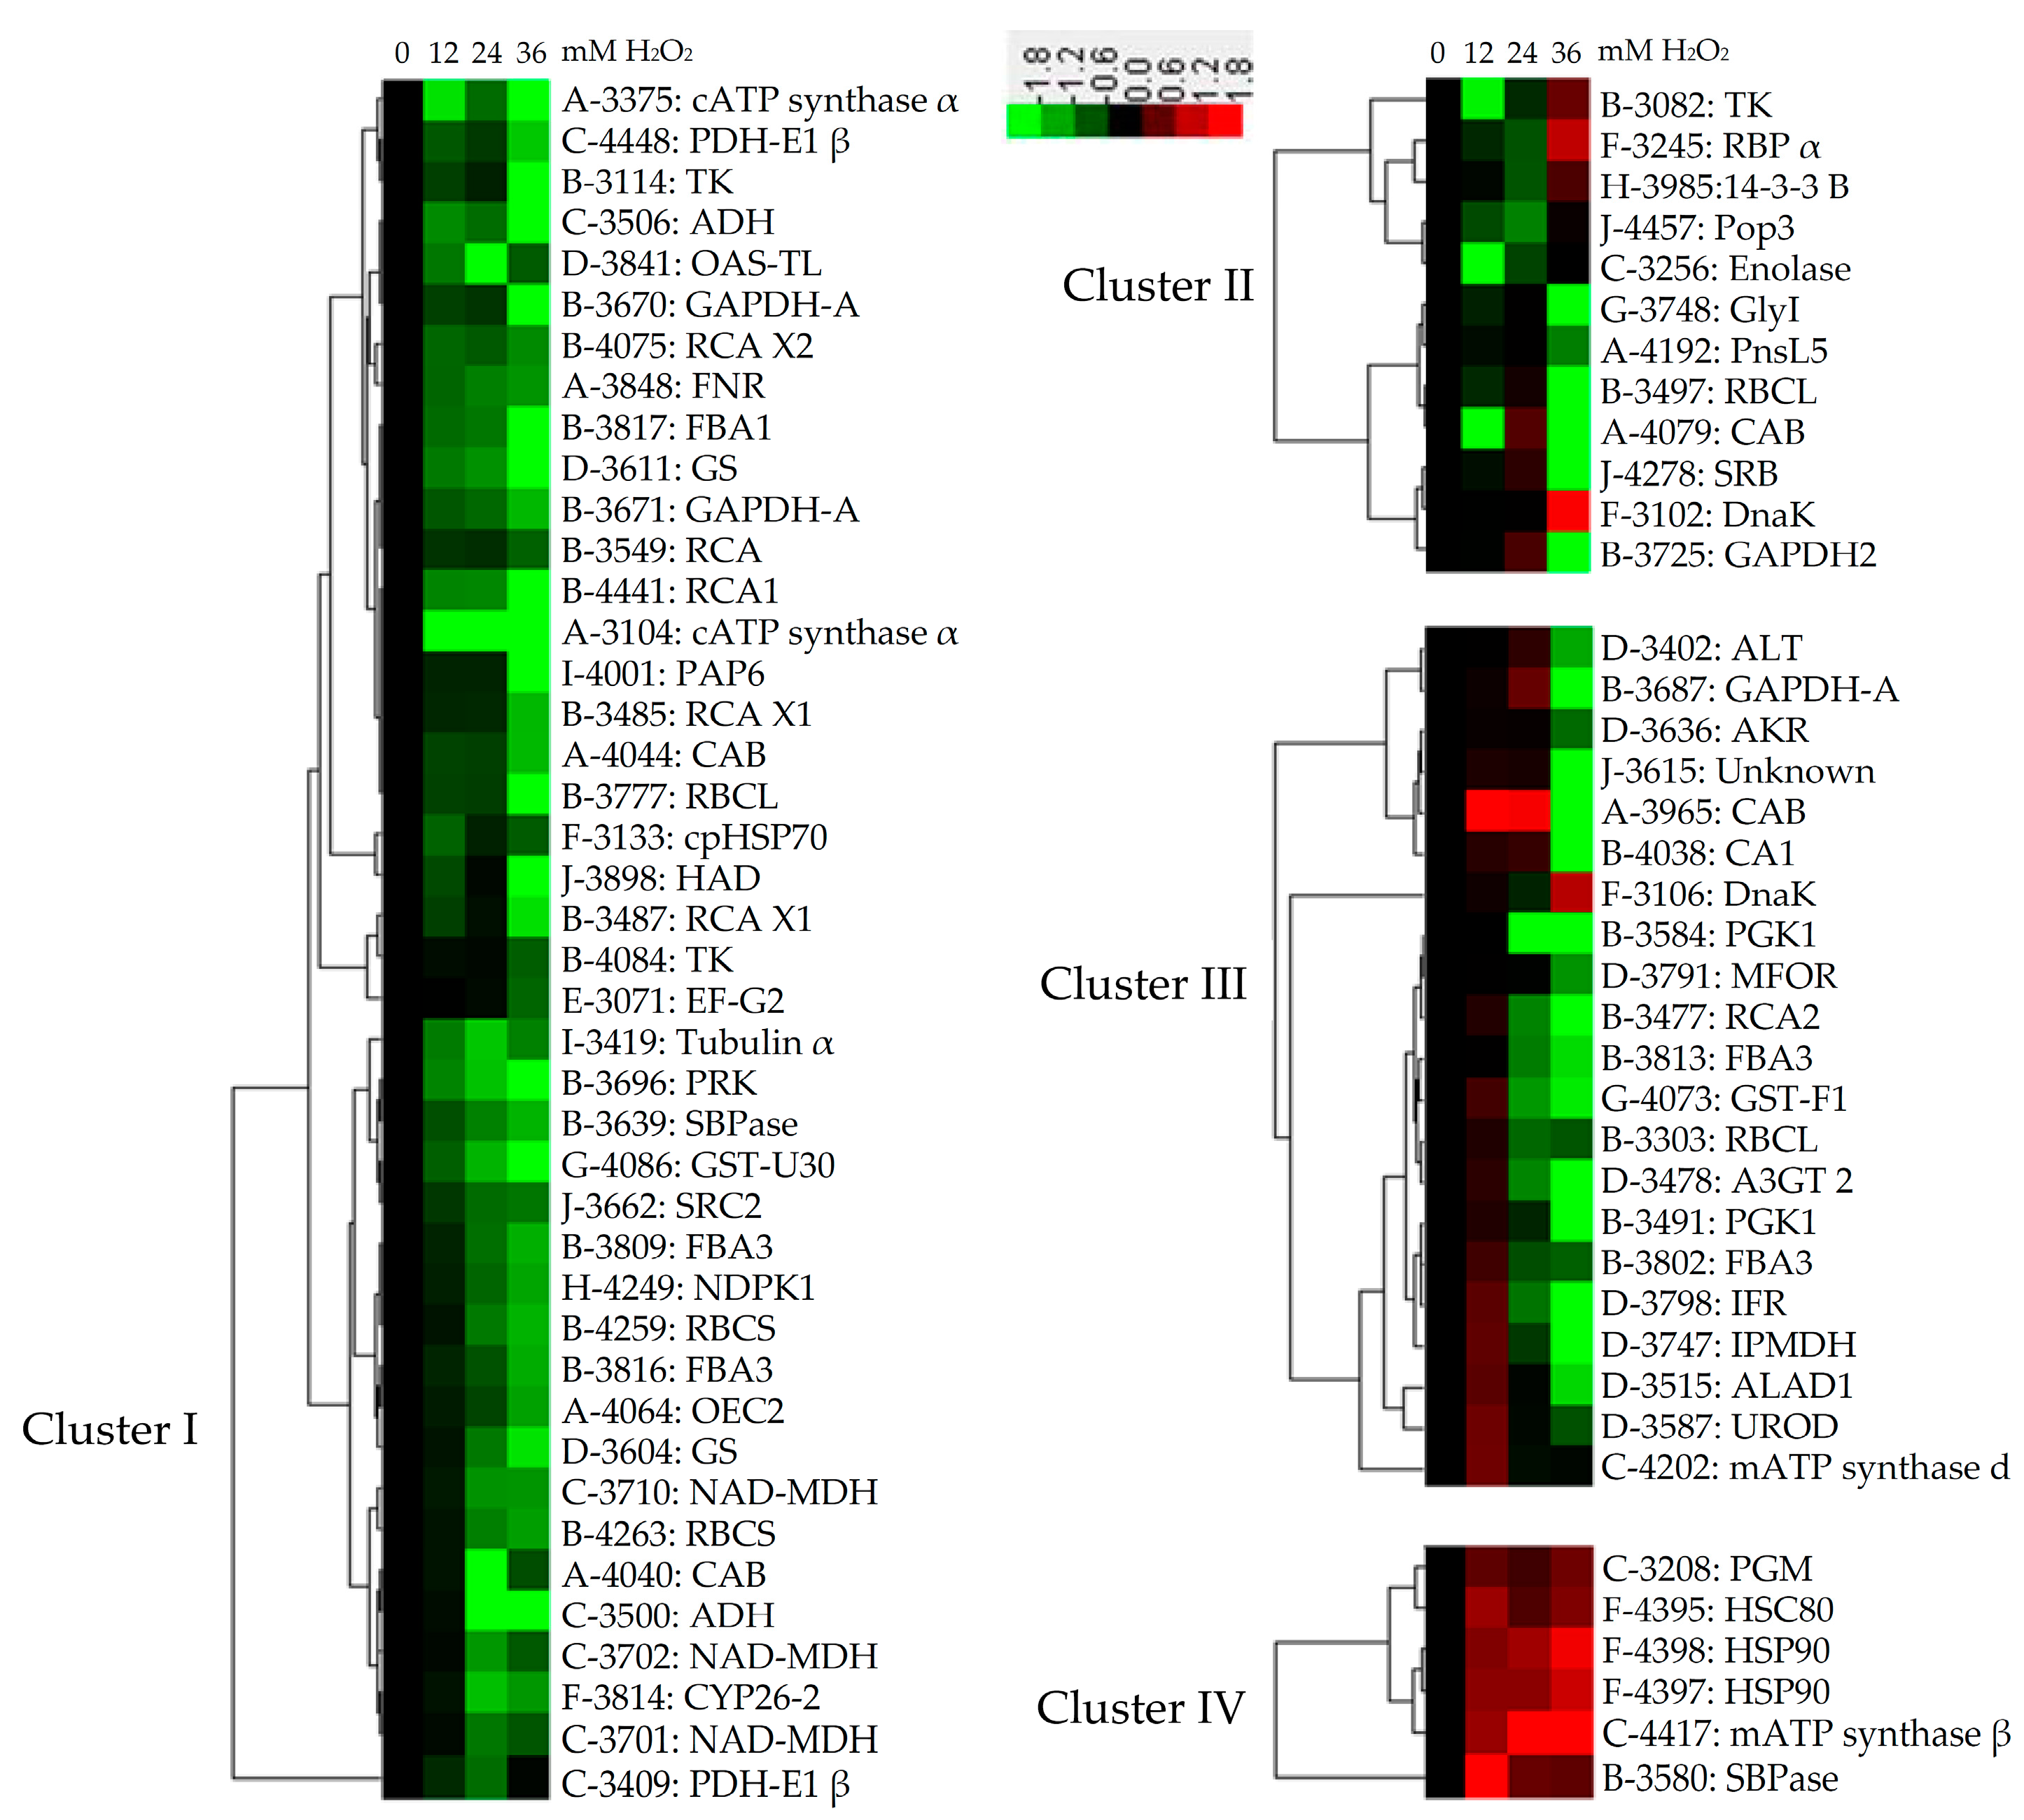
2.7. Hierarchical Clustering and Analysis of H2O2-Responsive Proteins

To better understand the abundance patterns of the coordinately regulated proteins, hierarchical clustering analysis of the 81 H2O2-responsive proteins were performed, which revealed four main clusters (Figure 7). Cluster I included a total of 42 proteins, as the most group cluster, which included the significantly decreased proteins under H2O2 treatment. Cluster II included the proteins decreased under 12 mM, but increased under 24 or 36 mM H2O2 treatment. Cluster III contained the proteins unchanged or increased under relative lower concentration of H2O2 stress, but decreased under relative higher concentration, especially 36 mM H2O2 treatment. Several proteins involved in carbohydrate and energy metabolism were grouped into this subcluster. Cluster IV contained six proteins whose abundances were increased under H2O2 treatment. Notably, several heat shock proteins (HSPs) were categorized into Cluster IV.

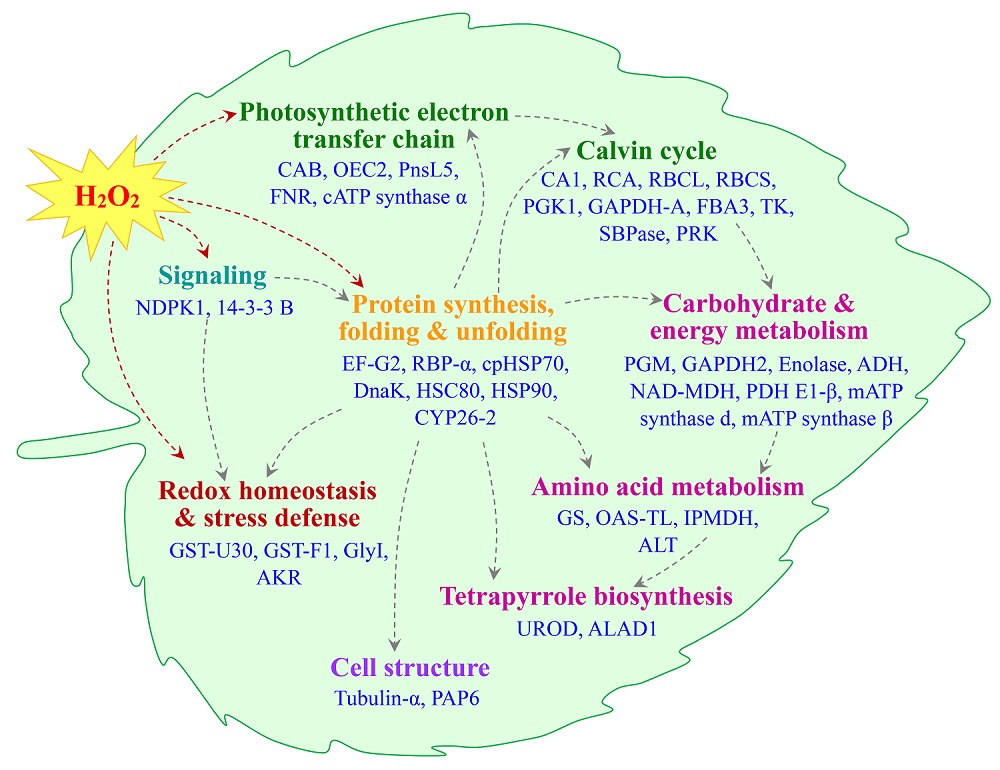
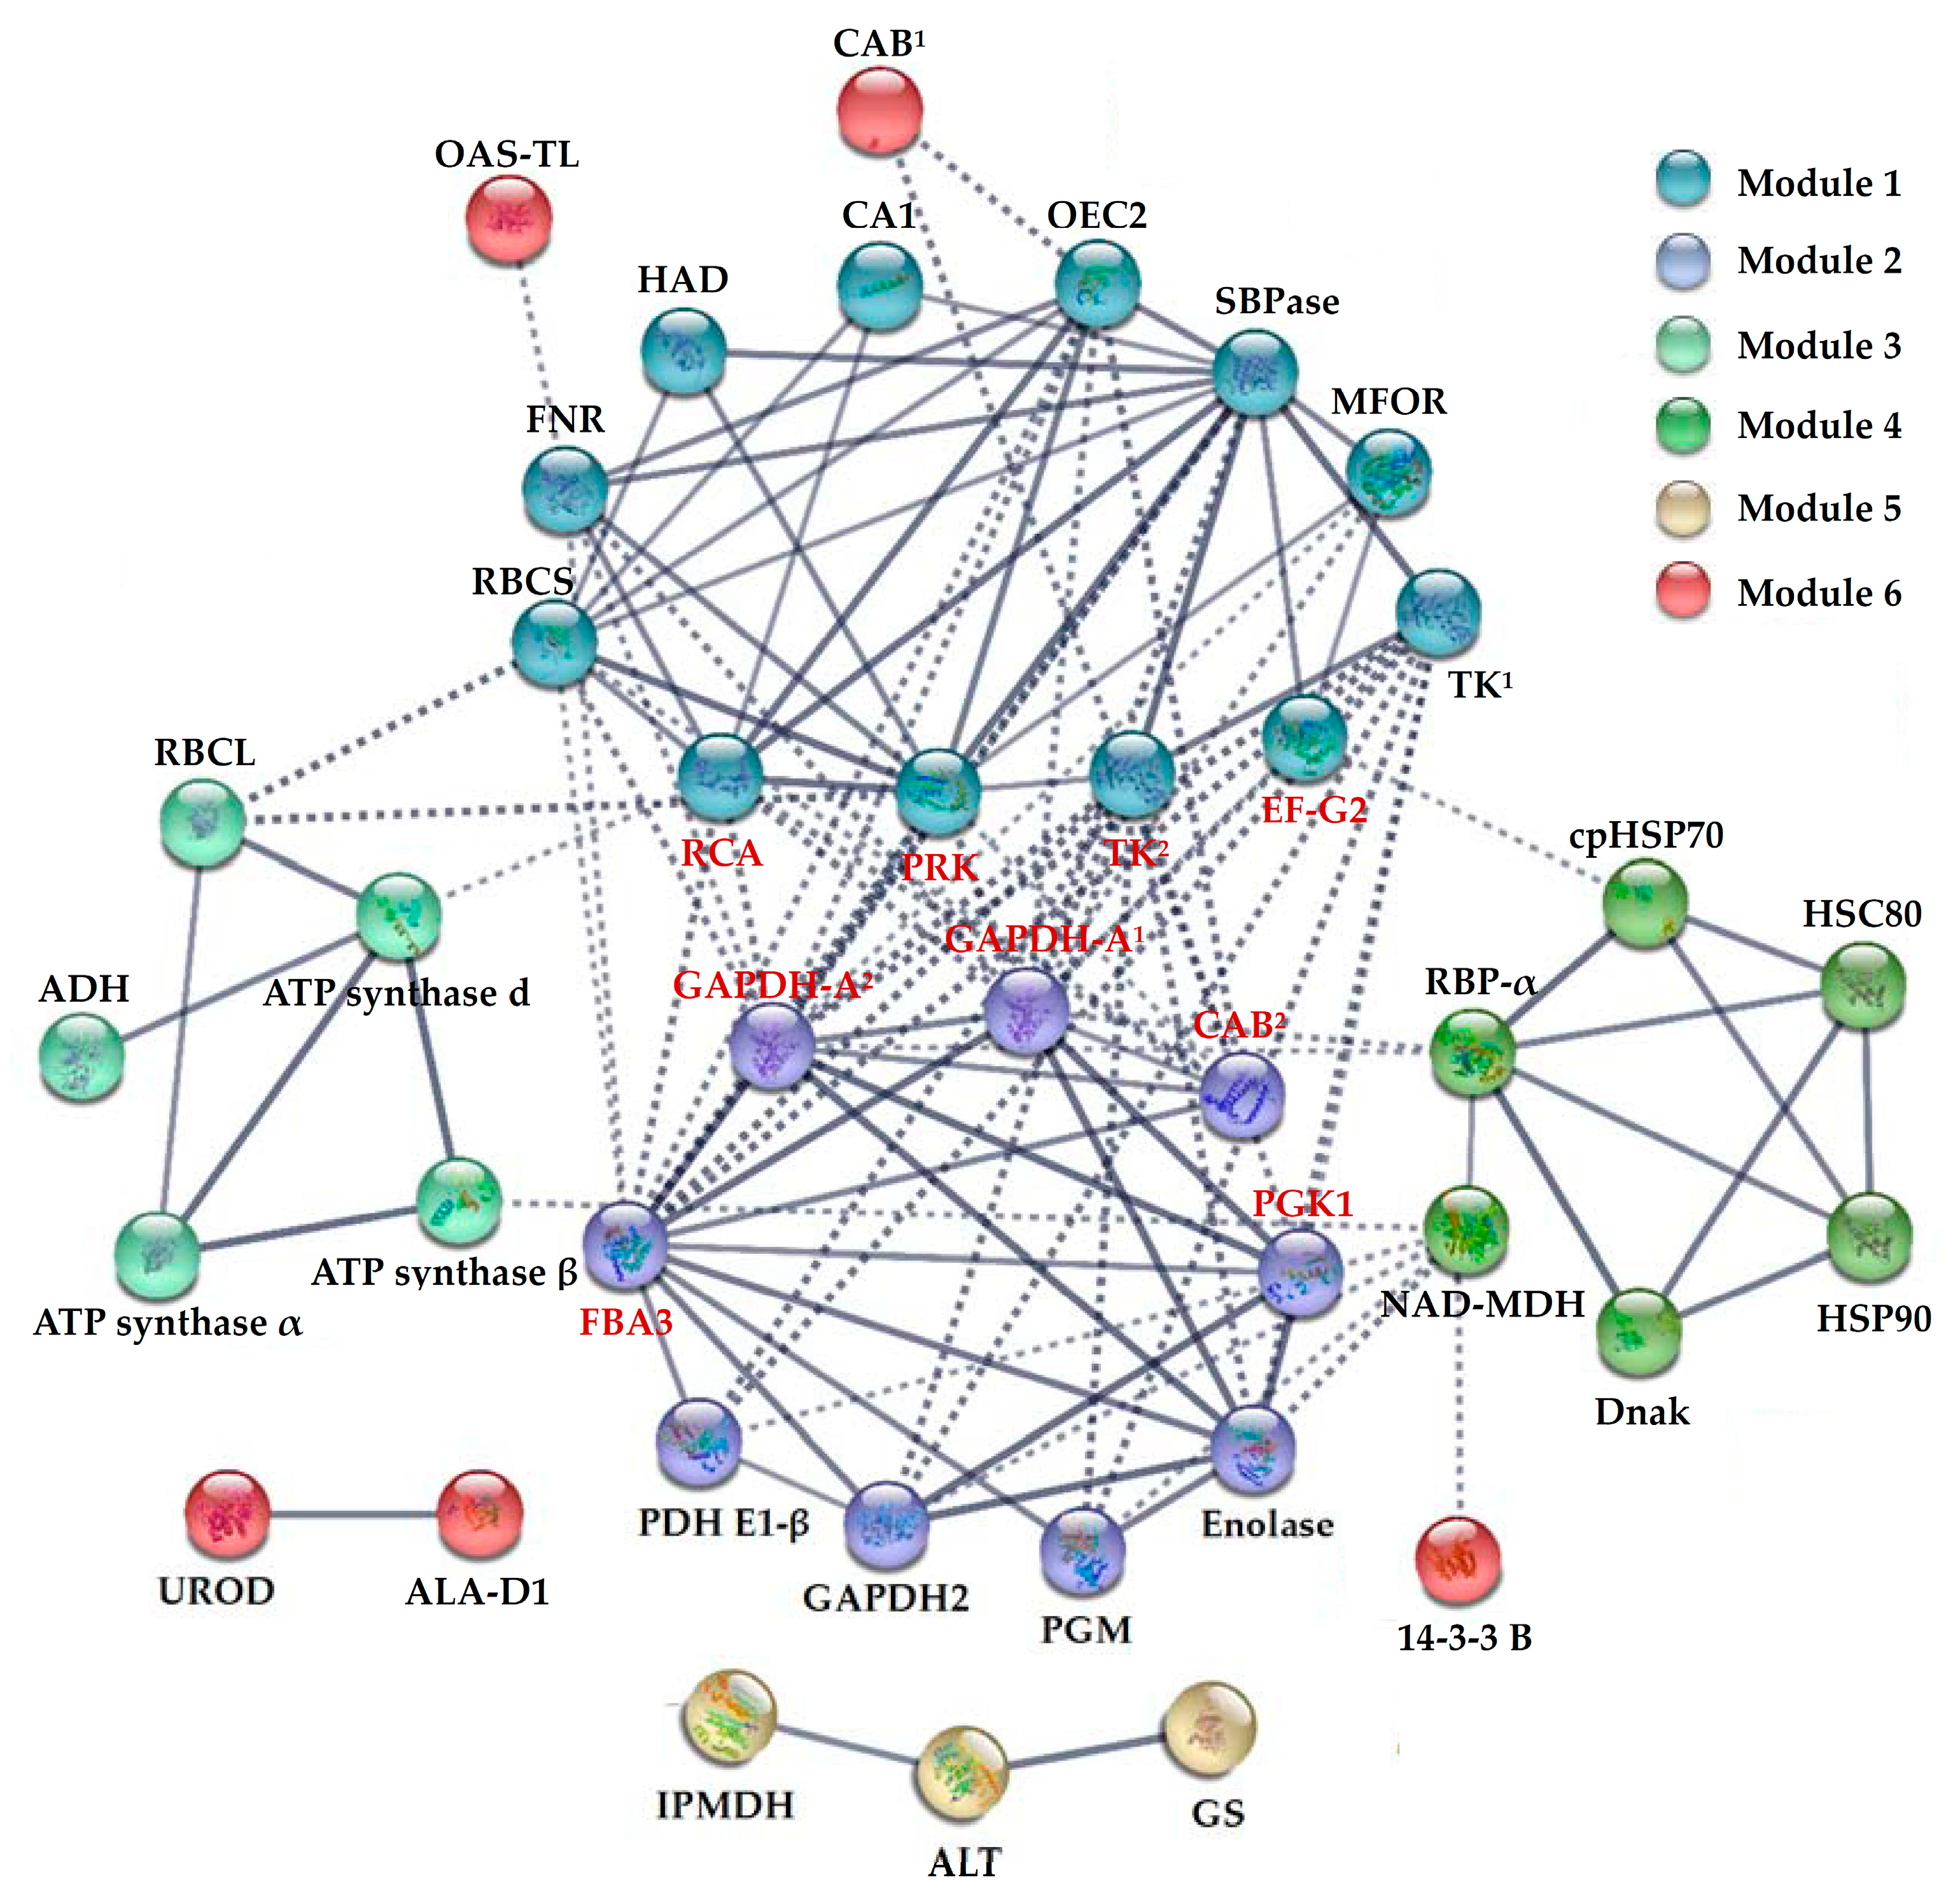
2.8. Protein–Protein Interaction (PPI) among H2O2-Responsive Proteins

To discover the relationship of the 81 H2O2-responsive proteins, the PPI networks were generated using the web-tool STRING 10 [30]. Among the 81 H2O2-responsive proteins, 59 unique homologous proteins were found in Arabidopsis (Table S5) [31]. Out of the 59 proteins, 40 proteins were depicted in the STRING database (Figure 8). Six modules forming tightly connected clusters were illuminated, and stronger associations were represented by thicker lines in the networks (Figure 8). Twelve and nine proteins were connected in Module 1 and Module 2, respectively. Most of them were involved in photosynthesis or carbohydrate metabolism. Module 3 contained five proteins mainly involved in energy metabolism, and Module 4 contained six proteins mainly involved in protein folding. Three proteins involved in amino acid metabolism were assigned in Module 5.

3. Discussion

3.1. H2O2-Responsive Signal Transduction and Cellular Structure Modulation in Poplar

H2O2 is generally regarded as a signal molecule in various abiotic/biotic stress-responsive pathways [6,7,8,9,10,11,12]. In this study, two signaling transduction-related proteins, 14-3-3 like protein B and nucleoside diphosphate kinase 1 (NDPK1), were altered in the H2O2-treated leaves of P. simonii × P. nigra. 14-3-3 like protein B was increased remarkably under 36 mM H2O2 (Table 1 and Figure 9A). Similarly, 14-3-3 like protein GF14-D was accumulated in B. distachyon leaves under 20 mM H2O2 for 4 h [19]. Plant 14-3-3 family proteins mediate the regulation of distinct biological processes by binding to phosphorylated client proteins. Recent proteome-wide in vivo approaches indicated that 14-3-3 proteins might interact with more than 100 target proteins in Arabidopsis [32]. Especially, plant 14-3-3 family was confirmed to be responsive to various environmental stresses [33]. In addition, NDPKs are multifunctional proteins that regulate a variety of eukaryotic cellular activities [34]. We found that NDPK1 was reduced in poplar leaves under H2O2 stress (Table 1 and Figure 9A), which was also reduced in Arabidopsis leaves in response to 3 mM H2O2 for five days [20]. However, H2O2 stress strongly induced the expression of AtNDPK2 gene in Arabidopsis, which was associated with H2O2-mediated mitogen-activated protein kinase signaling in plants [34]. The different H2O2-responsive patterns between NDPK1 and NDPK2 may be attributed to the different functions of various plant NDPK types [35]. For instance, cytoplasm-localized Type I NDPKs are involved in growth, metabolism and stress responses, whereas chloroplast-localized Type II NDPKs are involved in photosynthetic development and oxidative stress management [35]. The specific functions of the NDPK family members need to be investigated in polar in response to H2O2.
Excessive H2O2 can damage protein and lipid structure, leading to the destruction of cell membrane stability. In this study, the increases of MDA content and REL implied that H2O2 induced plasma membrane lipid peroxidation and plasma membrane permeability in leaves of poplar (Figure 3A,B). Importantly, our proteomics results indicated that plastid lipid associated proteins (PAPs) and tubulin were 36 mM H2O2-reduced in leaves (Figure 9B). PAPs, also termed as fibrillin/CDSP34 proteins, are involved in the structural stabilization of thylakoid membrane upon environmental constraints. The gene expression and protein accumulation of PAPs were induced in tomato (Lycopersicon esculentum) and potato (Solanum tuberosum) under osmotic and oxidative stresses [36,37]. Besides, the expression of PAPs in Brassica napus and Arabidopsis were differentially regulated by various abiotic stresses, such as drought, ozone, cold, NaCl, light, and mechanical wounding [38,39]. The α/β-tubulin heterodimer is the building block of microtubules, which regulates cell division and expansion, as well as organelle movement. Microtubule organization and dynamics quickly responds to various external stress signals, such as low temperature [40], cold acclimation [41], as well as osmotic and salt stresses [42,43]. All these imply that cell structure modulation is critical for the tolerance of various exogenous stresses-induced intracellular oxidative stress in poplar.

3.2. H2O2-Induced Alteration of ROS Scavenging Pathways in Poplar

Generally, when leaves are exposed to H2O2 treatment, exogenous H2O2 can permeate through cell membrane into cells, leading to the increase of intracellular H2O2 level [17]. In this study, the H2O2 concentrations in leaves were increased under 12 and 24 mM H2O2 (Figure 4A). Interesting, the intracellular H2O2 levels were increased in leaves of grass pea (Lathyrus sativu L.) under 5 and 10 mM H2O2 for 24 h, but returned to the normal level under 20 mM H2O2, which were revealed from H2O2 content detection and the histochemical localization using DAB staining [44]. These implied that special pathways were employed for intracellular H2O2 scavenging when plants were exposed to relatively higher concentration of H2O2.
In poplar leaves, we found diverse antioxidative enzymes and antioxidants were involved in intracellular H2O2 scavenging to cope with exogenous H2O2 stress (Figure 9C). The increase of SOD activity would contribute to dismutase intracellular O2•− to H2O2 in leaves under 24 and 36 mM H2O2 stress (Figure 4B). Interestingly, other primary antioxidative enzymes showed distinct activity patterns in response to various H2O2 concentrations. The activities of APX, POD, and GPX were induced under 12, 24 and 36 mM H2O2, respectively, indicating that different antioxidative pathways were employed under certain H2O2 level (Figure 4C,D). Similar results were also obtained in H2O2-stressed grass pea (Lathyrus sativus L.). The activities of APX and POD were increased under 5 and 10 mM H2O2, but returned to the normal level under 20 mM H2O2 [44]. Importantly, in this study, the induced GPX activity would especially facilitate to reduce relative higher intracellular H2O2 levels (Figure 4D), and enhance the reduction of lipid peroxide for defensing against oxidative membrane damage in poplar leaves under 36 mM H2O2 stress [45]. Unexpectedly, the H2O2-reduced CAT activity implied that the intracellular H2O2 would not be mainly scavenged in peroxisome when poplar leaves expose to extracellular H2O2 stress (Figure 4B) [1].
The activities of several antioxidative enzymes (e.g., MDHAR, DHAR, and GR) were H2O2-modulated for regeneration of reduced AsA and GSH, such as reduced MDHAR activity, and increased activities of DHAR and GR in poplar (Figure 4E,F). MDHAR and DHAR catalyze the regeneration of AsA, using nicotinamide adenine dinucleotide phosphate (NADPH) and GSH as electron source/donor, respectively, while GR maintains the cellular reduced GSH pool through converting GSSG to GSH with NADPH. The stress-induced activities of DHAR and GR also have been reported in several plants (e.g., maize and pepper) in response to abiotic stresses, such as salinity, drought, low temperature, and heavy metal [46]. This suggests that the H2O2-induced activities of DHAR and GR would maintain the reduced AsA and GSH pools for antioxidative processes in leaves. In addition, the altered H2O2-reponsive contents of antioxidants AsA/DHA and GSH/GSSG indicated that they contributed to H2O2 scavenging, which would function as the substances of aforementioned antioxidative enzyme (i.e., APX, POD, GPX, and DHAR) systems, but also could directly reduce H2O2 as reductants in poplar leaves. Additionally, the exogenous H2O2-induced osmolytes (i.e., proline, soluble sugar, and glycine betaine) were suggested to protect cellular components from degeneration by scavenging ROS in poplar leaves (Figure 3C–E). Similarly, the accumulation of proline and soluble sugars was found in wheat leaves under H2O2 treatment [20].

3.3. H2O2-Altered Redox Homeostasis in Poplar Leaves

In addition to the ROS scavenging pathways, glutathione-S-transferase (GST), glyoxylase (Gly) and aldo/keto reductase (AKR) were altered in regulating secondary release of metabolite signals in poplar leaves to cope with H2O2 stress. GSTs are mostly known as detoxifiers of electrophilic compounds by covalently linking glutathione to hydrophobic substrates for sequestration or removal, which plays an important role in improving plant stress tolerance [47]. In this study, GST activity was increased significantly under 36 mM H2O2, but the abundances of GST U30 and GST F1 were decreased (Figure 4F and Figure 9C, and Table 1). It can be explained that the enzyme activity is determined by not only protein abundance, but also its changes in conformation and post-translational modification (PTM). Moreover, plant GST group is a large protein family containing at least eight classes, and each family member has different role in response to various stress conditions. For example, the abundances of B. distachyon GST1-like [19] and citrus GST [18] were H2O2-decreased in leaves, but the abundances of wheat GST 19E50 [20] and rice GST F11 [17] were H2O2-increased in leaves. Therefore, in this study, the reduced abundances of two GST members would not account for the overall GST activity in polar leaves to cope with H2O2. The PTM mechanisms of GSTs are valuable to be further investigated.
Gly system comprising of Gly I and Gly II is the primary route for detoxification of methylglyoxal that is a toxic byproduct inhibiting cell proliferation, protein degradation, and antioxidant defense system [48]. Gly I was accumulated in rice leaves under 0.6 and 3 mM H2O2 stresses [17], but decreased in citrus leaves under 10 mM for 8 h [18]. In addition, AKRs are involved in detoxifying lipid peroxidation derived reactive aldehydes, leading to enhance the tolerance against abiotic stress-induced oxidative stress [49]. In this study, all the abundances of Gly I and AKR maintained at normal levels under 12 and 24 mM H2O2, but decreased significantly under 36 mM H2O2 (Table 1 and Figure 9C). This implied that Gly and AKR systems were probably employed for detoxification under relative lower concentration of H2O2 stress.

3.4. H2O2-Reduced Photosynthesis in Poplar

Photosynthesis is sensitive to ROS accumulation resulted from diverse stresses, because most photosynthetic enzymes are the preferential targets for the oxidation. In this study, the H2O2 immersion resulted in the decreases of net photosynthesis and stomatal conductance of P. simonii × P. nigra seedlings (Figure 2A,B). Importantly, we found 37 H2O2-responsive proteins were involved in photosynthesis, which accounted for 46% of all the H2O2-responsive proteins in poplar leaves (Table 1, and Figure 6A and Figure 9D,E). This is similar to what happened in leaves from rice under 0.6 and 15 mM H2O2 for 6 h and citrus under 10 mM H2O2 for 8 h, respectively [17,18]. In these two studies, 32% and 28% H2O2-responsive proteins in rice and citrus were identified using 2DE-based proteomics approaches, respectively [17,18]. These proteins are involved in light harvest, oxygen evolving, electron transfer, ATP synthesis, and Calvin cycle. Most of them were decreased under certain H2O2 concentration, leading to photosynthesis decline in poplar (Figure 2A and Figure 9D,E, and Table 1). Interestingly, most of these proteins, except for PnsL5, were changed in H2O2-treated leaves from other trees (e.g., citrus [18]) and gramineous plants (e.g., rice [17], wheat [20], and B. distachyon [19]).
In this study, our 2DE-based proteomics investigation revealed that ten of the H2O2-resposive photosynthetic proteins had multi-proteoforms in poplar leaves in response to H2O2 (Table 1 and Figure 9D,E). These proteoforms were mainly resulted from various H2O2-induced PTMs, including oxidative modification. All these proteins have been found to be oxidized in Arabidopsis in response to H2O2 treatments using redox proteomics approaches [50,51,52,53]. This is consistent with the findings from citrus and Arabidopsis that most photosynthesis-related proteins were easily carbonylated [18] and/or oxidized [51] under H2O2 exposure. Therefore, it is necessary to investigate the protein redox PTMs using redox proteomics technologies.

3.5. H2O2-Responsive Carbohydrate and Other Metabolisms in Poplar

Carbohydrate and energy supply are essential for plants in response to oxidative stress [20]. Our proteomics results revealed that phosphoglucomutase (PGM), cytosolic GAPDH, and enolase were altered in poplar leaves under H2O2 stress (Figure 9F). The increase of cytosolic PGM would enhance reversible interconversion of glucose-1-phosphate and glucose-6-phosphate, providing substrates for glycolysis and synthesis of a variety of cellular constituents. In roots of two black poplar (P. nigra) clones, the PGM gene and soluble sugar level were all induced under drought stress [54]. This implied that the mobilization of stored starch would be triggered in poplar when carbon assimilation was inhibited due to oxidization stress-reduced photosynthesis [54]. Besides, the H2O2-decreased abundances of cytosolic GAPDH and enolase implied that glycolysis was inhibited in poplar under H2O2 stress. In addition, the decreased abundances of alcohol dehydrogenase and cytosolic NAD-dependent malate dehydrogenase would reduce the regeneration of reducing power nicotinamide adenine dinucleotide (NADH) in H2O2-stressed poplar leaves [55,56], while the abundance-altered pyruvate dehydrogenase E1 and mitochondria ATP synthase would contribute for modulation of tricarboxylic acid cycle and energy supply in H2O2-stressed poplar leaves.
Glutamate and cysteine are central metabolites that serve as donors for the synthesis of other amino acids, vitamins, coenzymes, GSHs, and proteins, which play critical roles in plant stress responses. The syntheses of glutamine/glutamate and cysteine are depended on glutamine synthetase (GS)-involved pathway [57] and O-acetylserine (thiol) lyase (OAS-TL)-involved pathway [58], respectively. In this study, two proteoforms of cytosolic GS and OAS-TL were decreased in poplar leaves under H2O2 stress (Table 1, Figure 9G). The oxidative-decreased GS was also found in wheat leaves under 15 mM H2O2 for five days [20]. In addition, two other amino acid metabolism-related enzymes (i.e., 3-isopropyl malate dehydrogenase and alanine aminotransferase family protein) were decreased in poplar leaves under 36 mM H2O2 stress (Table 1 and Figure 9G). These proteomics results implied that amino acid metabolism was reduced in poplar leaves under H2O2 stress.
In addition, two enzymes in plant tetrapyrrole biosynthetic pathway, delta-aminolevulinic acid dehydratase 1 (ALAD1) and uroporphyrinogen decarboxylase (UROD), were all decreased under 36 mM H2O2 stress (Table 1, Figure 9H). ALAD catalyzes the asymmetric condensation of two molecules of δ-aminolevulinic acid to porphobilinogen, and UROD catalyzes the formation of coproporphyrinogen from uroporphyrinogen. Altered ALAD activity concomitant with reduced chlorophyll content have been reported in many terrestrial plants exposed to various metal (e.g., aluminum, cadmium, and lead) stresses [59,60,61]. Interestingly, transgenic tobacco plants with reduced activity of UROD was characterized by the accumulation of photosensitizing tetrapyrrole intermediates, which would induce the enzymatic detoxifying defense system, and especially resemble the hypersensitive reaction observed after pathogen attack [62]. Thus, the reduction of ALAD1 and UROD might result in the accumulation of photosensitizing tetrapyrrole intermediates, which probably play roles in the response of H2O2.

3.6. H2O2-Responsive Proteins Conformation in Poplar

Maintaining proteins in their functional conformations and preventing the aggregation of non-native proteins are important for plant survival under oxidative conditions. HSPs and other chaperones are responsible for protein folding, assembly, translocation, and degradation in response to stress conditions [63]. In this study, a RuBisCO large subunit-binding protein α subunit (RBP-α) and two proteoforms of chaperone DnaK (DnaK) were increased remarkably in poplar under 36 mM H2O2 stress (Table 1 and Figure 9I). RBP is considered as chloroplast chaperonin 60 (Cpn60), which is most likely involved in mature protein folding/assembly in plants, and facilitates the translocated protein to fold into native conformation. Previous studies showed that RBPs were induced in wheat leaves under drought [64] and salt stress [65], as well as in rice leaves by H2O2 stress [17]. Moreover, Cpn60 subunit β can protect RuBisCO activase from thermal denaturation and function in acclimating photosynthesis to heat stress [66]. In this study, the two proteoforms of DnaK in poplar have relatively high sequence similarity to chloroplast HSPs [67]. The chloroplast HSPs carry out pivotal function in processes related to growth and development and in response to diverse environmental stresses, such as heat, light, and pathological stress [67]. For example, the expression of the chloroplast-localized Hsp70B is induced in Chlamydomonas under heat shock, high light and oxidative stresses [68]. A wheat chloroplast TaHsp70 plays a critical role in defense response elicited by infection of stripe rust fungus [69]. Therefore, the increases of RBP-α and DnaKs in poplar under 36 mM H2O2 treatment suggest they play an important role in protection against the high dose oxidative stress.
In addition, heat shock cognate protein 80 (HSC80) and two proteoforms of heat shock protein 90 (HSP90) were increased in poplar under H2O2 stress (Table 1, Figure 9I). HSC80 was found to be increased 10-fold in tomato cell culture upon heat shock [70]. HSP90 is distinct from many other molecular chaperones in that most of its known substrates to date are signal transduction-related proteins such as steroid hormone receptors and signaling kinases [63]. Recent studies revealed that plant HSP90s were important in plant development, environmental stress response, as well as disease and pest resistance [71]. Therefore, the induced HSC80 and HSP90s might prevent the aggregation of non-native proteins and reestablish normal protein conformation in H2O2-stressed poplar leaves.

4. Methods

4.1. Plant Cultivation and Treatment

The terminal buds or lateral buds excised from P. simonii × P. nigra plantlets were transferred to a culture flask containing 80 mL 1/2 MS solid medium, containing 2% (w/v) sugar and 0.54% (w/v) agar. The explants were cultured in a phytotron at 26 °C/22 °C (day/night), 16 h photoperiod and 200 μmol·m−2·s−1 light intensity for 50 days. The shoots of regenerated plantlets were immersed in 0, 12, 24 and 36 mM H2O2 for 6 h, respectively. After the treatments, leaves were harvested and blotted dry on filter paper immediately. For each treatment, at least three biological replicates were performed. For each replicate, more than three whole leaves with similar size from at least three separate poplar seedlings were collected and pooled. The fresh weight was 0.2 g. The samples were either used fresh or stored at −80 °C for future analysis.

4.2. Photosynthesis Measurement

Pn, Gs, Ci, and Tr were measured in fully expanded leaves of each plant using a portable photosynthesis system LICOR 6400 XT (LI-COR Inc., Lincoln, NE, USA) [72]. The measurements were done at 10:00 a.m. At least nine leaves for each sample were measured.

4.3. Determination of MDA Content, REL, Total Soluble Sugar, Proline, and Glycine Betaine Contents

The MDA content and REL were determined using previous methods described by Wang et al. [73]. For the MDA content assay, 0.2 g fresh leaves were ground in 5 mL 10% trichloroacetic acid, and centrifuged at 10,000× g at 4 °C for 10 min, then the supernatant was collected. Two milliliters of 0.6% (w/v) thiobarbituric acid solution was added to 2 mL of the supernatant. The reaction solution was incubated for 15 min at 100 °C followed by cooling down to ambient temperature. The absorbance was detected under 450, 532 and 600 nm using an Ultrospec 2100 pro UV/Visible spectrophotometer (GE Healthcare Life Science, Uppsala, Sweden). The MDA content was calculated according to Li et al. [74].
For the REL determination, 0.2 g fresh leaves were cut and completely immersed in 20 mL deionized water, then degassed for 10 min. The electrical conductivity of the solution (E1) was measured using a conductivity instrument (DDS-11A) after 20 min. Subsequently, the solution was incubated at 100 °C for 15 min and cooled to room temperature, and then the electrical conductivity of the solution (E2) was determined. In addition, the electrical conductivity of deionized water (E0) was also detected. The REL was calculated according to the equation: REL (%) = (E1 − E0)/(E2 − E0) × 100%.
Contents of proline and total soluble sugar were determined using ninhydrin reaction and an anthrone reagent method developed by Li et al. [74]. For the proline determination, 0.2 g fresh leaves were ground in 3 mL 3% (w/v) sulfosalicylic acid. After incubation at 100 °C for an hour and followed by cooling down to ambient temperature, the homogenate was centrifuged at 15,000× g for 10 min at 25 °C. Then, 1 mL supernatant, 2 mL glacial acetic acid, and 2 mL ninhydrin were incubated at 100 °C for an hour. After cooled to room temperature, the incubated solution with addition of 8 mL methylbenzene was allowed to stand for an hour before the detection at 520 nm using a spectrophotometer.
For the total soluble sugar assay, 0.2 g fresh leaves were ground in 5 mL deionized water. The homogenate was incubated at 100 °C for 30 min followed by cooling down to ambient temperature. After centrifugation at 15,000× g for 10 min at 25 °C, the supernatant was collected and diluted with deionized water to 50 mL. Then, 1 mL the extracting solution, 0.5 mL 2% (w/v) ethyl acetate solution of anthrone, and 5 mL concentrated sulfuric acid were incubated at 100 °C for 2 min. The absorbance was detected under 630 nm using a spectrophotometer after cooled down to room temperature.
Glycine betaine content was measured using reinecke salt method as described by Zhao et al. [75]. Fresh leaves (0.2 g) were ground in liquid nitrogen, and then the powder was incubated for 24 h in 6 mL 0.375% (w/v) reinecke salt solution. The homogenate was centrifuged at 10,000× g for 15 min at 20 °C. The supernatant was collected and filtered through a 0.45-μm-pore-size cellulose acetate filter. The filtrate was dried at 70 °C and then resuspended in 5 mL deionized water. After 5 mL reinecke salt solution was added, the reaction solution was incubated at 4 °C for 2 h, and then centrifuged at 4000× g for 15 min at 4 °C. The precipitate was collected, and then redissolved in 15 mL aether. Then, the solution was centrifuged at 4000× g for 15 min at 4 °C. The supernatant was harvested, dried, and redissolved in 70% acetone. The absorbance was determined at 525 nm using a spectrophotometer. The contents of proline, total soluble sugar, and glycine betaine content were calculated from the standard curve.

4.4. Determination of ROS and Antioxidant Substances Contents, and Antioxidant Enzyme Activity Assay

The content of H2O2 was determined using potassium iodide reaction as described in Suo et al. [76]. Generation rate of O2•− was obtained according to a method of Zhao et al. [75]. For antioxidant enzyme activity assay, 0.2 g leaves were homogenized on ice in 3 mL 50 mM phosphate buffer (pH 7.8, and containing 2% PVP-40 and 2 mM ascorbate). After centrifugation at 15,000× g for 20 min at 4 °C, the supernatant was collected for enzyme activity assays, including SOD, CAT, APX, GPX, POD, MDHAR, DHAR, GR, and GST. The activities of SOD, CAT, APX, POD, GR, and GST were assayed according to our previous methods [72]. The activities of GPX, MDHAR, and DHAR were measured according to our previous methods described by Suo et al. [76]. For all the enzyme activity assays, protein content was determined using the Bradford method [77]. In addition, contents of AsA, DHA, GSH, and GSSG were measured according to methods of Wei et al. [78].

4.5. Protein Sample Preparation, 2DE, and Protein Abundance Analysis

The proteins from leaves under different concentrations of H2O2 treatments were extracted using a phenol extraction method according to Wang et al. [73]. About 1.6 mg protein was loaded on per gel, separated on linear gradient IPG strips (24 cm, pH 4-7) through isoelectric focusing (IEF) in the first dimension, followed by 12.5% SDS-PAGE gels in the second dimension, and stained by CBB staining. Gel image acquisition and analysis were conducted as described in detail in Wang et al. [73]. For quantitative analysis, the volume of each spot was normalized against the total valid spots. The protein spots displaying consistent abundance changes from three biological replicates with greater than 1.5-fold changes and a p value smaller than 0.05 were considered to be DAP [72].

4.6. Protein Identification by MALDI-TOF/TOF MS and Database Searching

The DAP spots were excised from the gels and digested with trypsin as previously described [73]. MS/MS spectra were obtained using an ABI 5800 MALDI TOF/TOF MS (AB Sciex, Foster City, CA, USA). The mass error was below 30 ppm at both MS and MS/MS mode, and the resolution was 10,000. The MS/MS spectra were subjected to the online Mascot program [79] to search against all green plants (Viridiplantae) in NCBInr protein databases [80]. The searching parameters were set according to Wang et al. [73], the mass accuracy was 0.3 Da, and the maximum number of missed cleavages was set to one. To obtain high confident identification, proteins had to meet the following criteria: (1) the top hits on the database searching report; (2) a probability-based MOWSE score greater than 52 (p < 0.05); and (3) more than two peptides matched with nearly complete y-ion series and complementary b-ion series.

4.7. Protein Classification, Subcellular Localization, Hierarchical Cluster Analysis, and Protein–Protein Interaction Prediction

The identified proteins were searched against the NCBI database [80] and UniProt database [81] to determine if their functions were known. Combined with knowledge from BLAST alignments and literature, proteins were classified into different categories.
The subcellular localization of the identified proteins were predicted using five Internet tools according to Suo et al. [76]: YLoc [82], LocTree3 [83], Plant-mPLoc [84], ngLOC [85], and TargetP [86]. Only the consistent predictions meeting the high criteria from at least two tools were accepted as a confident result.
Self-organizing tree algorithm hierarchical clustering of the protein abundance profiles was obtained from log (base 2) transformed fold change values of protein spots using Cluster software (version 3.0).
The protein–protein interactions were predicted using the web tool STRING 10 [30]. The homologs of the DAPs in Arabidopsis were obtained by sequence BLAST in TAIR database [31], and then the homologs were subjected to the web tool of STRING 10 for creating functional protein association networks, based on published literature, genome analysis of domain fusion, gene neighborhood, phylogenetic profiling/homology, co-expression, co-occurrence, and other experimental evidence [76].

4.8. Statistical Analysis

All the physiological results were presented as means ± standard deviation (SD) of at least three biological replicates. Data were analyzed by one-way ANOVA followed by Duncan's test using the statistical software SPSS 17.0 (SPSS Inc., Chicago, IL, USA). A p value smaller than 0.05 was considered to be statistically significant.

5. Conclusion

In the course of poplar development and stress-response in poplars, the molecular regulation of H2O2 homeostasis in the cells is complicated and fine-tuned. In the present study, we present a primary H2O2-responsive network in leaves of poplar (P. simonii × P. nigra) using integrative analysis of physiological and proteomic approaches. The molecular network includes 14-3-3 protein-/NDPK-mediated signaling pathway, dynamics of thylakoid membrane structure, enhancement of diverse antioxidative defense system, alteration of photosynthesis, adjustment of carbohydrate and other basic metabolisms, as well as modulation of protein synthesis and conformation (Figure 9). This study provides new information and insights into underlying H2O2-responsive mechanisms in poplar plants. Although our proteomics results highlighted some critical candidate proteins/genes in H2O2-responsive signaling and metabolic pathways, their biological functions for H2O2 response in poplar still need future characterization using molecular genetics and PTM analysis tools.

Supplementary Materials

Supplementary materials can be found at www.mdpi.com/1422-0067/18/10/2085/s1.

Acknowledgments

The project was supported by grants from the Fundamental Research Funds for the Central Universities (No. 2572016AA16 and No. 2572017ET01) to Juanjuan Yu, and Shaojun Dai, and Capacity Construction Project of Local Universities, Shanghai, China (No. 14390502700) to Shaojun Dai.

Author Contributions

Shaojun Dai conceived and designed the experiments; Juanjuan Yu, Xin Jin, Tianxiang Gao, Xiaomei Sun, and Xiaomei Chen performed the experiments; Yimin She and Tingbo Jiang contributed analysis tools and plant materials; and Juanjuan Yu and Xin Jin analyzed the data and wrote the manuscript with suggestions by Shaojun Dai and Sixue Chen. All authors have read and approved the final manuscript.

Conflicts of Interest

The authors declare no conflict of interest.

Abbreviations

14-3-3 B14-3-3-like protein B
2DETwo-dimensional gel electrophoresis
1O2Singlet oxygen
A3GT 2Anthocyanidin 3-O-glucosyltransferase 2
ADHAlcohol dehydrogenase
AKRAldo/keto reductase family protein
ALAD1Delta-aminolevulinic acid dehydratase 1
ALTAlanine aminotransferase family protein
APXAscorbate peroxidase
AsAAscorbate
BLASTBasic local alignment search tool
CA1Carbonic anhydrase isoform 1
CABChlorophyll A/B binding protein
CATCatalase
cATP synthase αATP synthase CF1 α subunit
CBBCoomassie brilliant blue
CiIntercellular CO2 concentration
cpHSP70Stromal 70 kda heat shock-related family protein
CYP26-2Peptidyl-prolyl cis-trans isomerase CYP26-2
DAPDifferentially accumulated protein
DHADehydroascorbate
DHARDehydroascorbate reductase
DnaKChaperone Dnak
EF-G2Elongation factor G-2
ESTsExpressed sequence tags
FBAFructose-bisphosphate aldolase
FNRFerredoxin-NADP reductase
GAPDH2Glyceraldehyde-3-phosphate dehydrogenase 2
GAPDH-AGlyceraldehyde-3-phosphate dehydrogenase A
Gly IGlyoxalase I homolog family protein
GPXGlutathione peroxidase
GRGlutathione reductase
GSGlutamine synthetase
GsStomatal conductance
GSHReduced glutathione
GSSGOxidized glutathione
GSTGlutathione S-transferase
GST-F1Glutathione S-transferase F1 (GST-F1)
GST-U30Glutathione S-transferase U30
H2O2Hydrogen peroxide
HADHaloacid dehalogenase-like hydrolase family protein
HOHydroxyl radicals
HSC80Heat shock cognate protein 80
HSP90Heat shock protein 90
IFRIsoflavone reductase family protein
IPGImmobilized pH gradient
IPMDH3-isopropyl malate dehydrogenase
iTRAQIsobaric tags for relative and absolute quantification
mATP synthase dATP synthase subunit d
mATP synthase βATP synthase subunit beta
MDAMalondialdehyde
MDHARMonodehydroascorbate reductase
MFOR2-methylene-furan-3-one reductase
MALDIMatrix-assisted laser desorption/ ionization
MSMass spectrometry
NAD-MDHNAD-dependent malate dehydrogenase
NADHNicotinamide adenine dinucleotide
NADPHNicotinamide adenine dinucleotide phosphate
NDPK1Nucleoside diphosphate kinase 1
O2•−Superoxide anion radicals
OAS-TLO-acetylserine (thiol) lyase family protein
OEC2Photosystem II oxygen-evolving complex protein 2 precursor
PAP6Plastid-lipid-associated protein 6
PDH E1-βPyruvate dehydrogenase E1 component subunit beta
PGK1Phosphoglycerate Kinase 1
PGMPhosphoglucomutase
PnNet photosynthetic rate
PnsL5Photosynthetic NDH subunit of lumenal location 5
PODPeroxidase
Pop3Pop3 peptide family protein
PRKPhosphoribulokinase
PTMpost-translational modification
RBCLRubisco large chain
RBCSRubisco small chain
RBP-αRubisco large subunit-binding protein subunit α
RCARubisco activase
RELRelative electrolyte leakage
ROSReactive oxygen species
RuBisCORibulose-bisphosphate carboxylase
SBPaseSedoheptulose-1, 7-bisphosphatase
SODSuperoxide dismutase
SRBStress responsive A/B Barrel domain
SRC2Soybean genes regulated by cold 2 (SRC2)-like domain
TCATricarboxylic acid
TKTransketolase
TOFTime of flight
TrTranspiration rate
Tubulin αTubulin α chain
URODUroporphyrinogen decarboxylase

References

  1. Mittler, R.; Vanderauwera, S.; Gollery, M.; Van, B.F. Reactive oxygen gene network of plants. Trends Plant Sci. 2004, 9, 490–498. [Google Scholar] [CrossRef] [PubMed]
  2. Mittler, R. ROS are good. Trends Plant Sci. 2017, 22, 11–19. [Google Scholar] [CrossRef] [PubMed]
  3. Petrov, V.D.; van Breusegem, F. Hydrogen peroxide—A central hub for information flow in plant cells. AoB Plants 2012, 2012. [Google Scholar] [CrossRef] [PubMed]
  4. Rinalducci, S.; Murgiano, L.; Zolla, L. Redox proteomics: Basic principles and future perspectives for the detection of protein oxidation in plants. J. Exp. Bot. 2008, 59, 3781–3801. [Google Scholar] [CrossRef] [PubMed]
  5. Ishibashi, Y.; Yamamoto, K.; Tawaratsumida, T.; Yuasa, T.; Iwaya-Inoue, M. Hydrogen peroxide scavenging regulates germination ability during wheat (Triticum aestivum L.) seed maturation. Plant Sign. Behav. 2008, 3, 183–188. [Google Scholar] [CrossRef]
  6. Uchida, A.; Jagendorf, A.T.; Hibino, T.; Takabe, T.; Takabe, T. Effects of hydrogen peroxide and nitric oxide on both salt and heat stress tolerance in rice. Plant Sci. 2002, 163, 515–523. [Google Scholar] [CrossRef]
  7. Rokebul Anower, M.; Peel, M.D.; Mott, I.W.; Wu, Y. Physiological processes associated with salinity tolerance in an alfalfa half-sib family. J. Agro. Crop Sci. 2017. [Google Scholar] [CrossRef]
  8. Liu, Z.J.; Guo, Y.K.; Bai, J.G. Exogenous hydrogen peroxide changes antioxidant enzyme activity and protects ultrastructure in leaves of two cucumber ecotypes under osmotic stress. J. Plant Growth Regul. 2010, 29, 171–183. [Google Scholar] [CrossRef]
  9. Xu, F.J.; Jin, C.W.; Liu, W.J.; Zhang, Y.S.; Lin, X.Y. Pretreatment with H2O2 alleviates aluminum-induced oxidative stress in wheat seedlings. J. Integr. Plant Biol. 2011, 53, 44–53. [Google Scholar] [CrossRef] [PubMed]
  10. Kumar, M.; Sirhindi, G.; Bhardwaj, R.; Kumar, S.; Jain, G. Effect of exogenous H2O2 on antioxidant enzymes of Brassica juncea L. seedlings in relation to 24-epibrassinolide under chilling stress. Indian J. Biochem. Biophys. 2010, 47, 378–382. [Google Scholar] [PubMed]
  11. Moskova, I.; Todorova, D.; Alexieva, V.; Segiev, I. Protective effect of hydrogen peroxide against paraquat toxicity in young pea plants: Possible role of endogenous polyamines. Am. J. Plant Sci. 2014, 5, 3408–3416. [Google Scholar] [CrossRef]
  12. Bădărău, C.L.; Chiru, N.; Damsa, F.; Nistor, A. Effects of Satureja hortensis oil treatments and exogenous H2O2 on Potato virus Y (PVY) infected Solanum tuberosum L. plants under drought conditions. An. Univers. Orad. Fasc. Biol. 2012, 19, 140–145. [Google Scholar]
  13. Desikan, R.; A-H-Mackerness, S.; Hancock, J.T.; Neill, S.J. Regulation of the Arabidopsis transcriptome by oxidative stress. Plant Physiol. 2001, 127, 159–172. [Google Scholar] [CrossRef] [PubMed]
  14. Vandenabeele, S.; van der Kelen, K.; Dat, J.; Gadjev, I.; Boonefaes, T.; Morsa, S.; Rottiers, P.; Slooten, L.; van Montagu, M.; Zabeau, M.; et al. A comprehensive analysis of hydrogen peroxide-induced gene expression in tobacco. Proc. Natl. Acad. Sci. USA 2003, 100, 16113–16118. [Google Scholar] [CrossRef] [PubMed]
  15. Vanderauwera, S.; Zimmermann, P.; Rombauts, S.; Vandenabeele, S.; Langebartels, C.; Gruissem, W.; Inze, D.; van Breusegem, F. Genome-wide analysis of hydrogen peroxide-regulated gene expression in Arabidopsis reveals a high light-induced transcriptional cluster involved in anthocyanin biosynthesis. Plant Physiol. 2005, 139, 806–821. [Google Scholar] [CrossRef] [PubMed] [Green Version]
  16. Li, A.L.; Zhang, R.Z.; Pan, L.; Tang, L.C.; Zhao, G.G.; Zhu, M.Z.; Chu, J.F.; Sun, X.H.; Wei, B.; Zhang, X.Q.; et al. Transcriptome analysis of H2O2-treated wheat seedlings reveals a H2O2-responsive fatty acid desaturase gene participating in powdery mildew resistance. PLoS ONE 2011, 6, e28810. [Google Scholar] [CrossRef] [PubMed]
  17. Wan, X.Y.; Liu, J.Y. Comparative proteomics analysis reveals an intimate protein network provoked by hydrogen peroxide stress in rice seedling leaves. Mol. Cell. Proteom. 2008, 7, 1469–1488. [Google Scholar] [CrossRef] [PubMed]
  18. Tanou, G.; Job, C.; Belghazi, M.; Molassiotis, A.; Diamantidis, G.; Job, D. Proteomic signatures uncover hydrogen peroxide and nitric oxide cross-talk signaling network in citrus plants. J. Proteome Res. 2010, 9, 5994–6006. [Google Scholar] [CrossRef] [PubMed]
  19. Bian, Y.W.; Lv, D.W.; Cheng, Z.W.; Gu, A.Q.; Cao, H.; Yan, Y.M. Integrative proteome analysis of Brachypodium distachyon roots and leaves reveals a synergetic responsive network under H2O2 stress. J. Proteom. 2015, 128, 388–402. [Google Scholar] [CrossRef] [PubMed]
  20. Ge, P.; Hao, P.; Cao, M.; Guo, G.; Lv, D.; Subburaj, S.; Li, X.; Yan, X.; Xiao, J.; Ma, W.; et al. iTRAQ-based quantitative proteomic analysis reveals new metabolic pathways of wheat seedling growth under hydrogen peroxide stress. Proteomics 2013, 13, 3046–3058. [Google Scholar] [CrossRef] [PubMed]
  21. Tuskan, G.A.; Difazio, S.; Jansson, S.; Bohlmann, J.; Grigoriev, I.; Hellsten, U.; Putnam, N.; Ralph, S.; Rombauts, S.; Salamov, A.; et al. The genome of black cottonwood, Populus trichocarpa (Torr. & Gray). Science 2006, 313, 1596–1604. [Google Scholar] [CrossRef] [PubMed]
  22. Ren, H.Q.; Liu, X.; Jiang, Z.H.; Wang, Y.h.; Yu, H.Q. Effects of planting density on wood anatomical properties of Populus × xiaohei. For. Res. 2006, 19, 364–369. [Google Scholar]
  23. Gao, W.; Bai, S.; Li, Q.; Gao, C.; Liu, G.; Li, G.; Tan, F. Overexpression of TaLEA gene from Tamarix androssowii improves salt and drought tolerance in transgenic poplar (Populus simonii × P. nigra). PLoS ONE 2013, 8, e67462. [Google Scholar] [CrossRef] [PubMed]
  24. Cao, C.W.; Liu, G.F.; Wang, Z.Y.; Yan, S.C.; Ma, L.; Yang, C.P. Response of the gypsy moth, Lymantria dispar to transgenic poplar, Populus simonii × P. nigra, expressing fusion protein gene of the spider insecticidal peptide and Bt-toxin C-peptide. J. Insect Sci. 2010, 10, 1–13. [Google Scholar] [CrossRef]
  25. Wang, Z.B. Study on poplar transgene of the fungus disease-resistance. Forest. Sci. Tech. 2006, 31, 22–24. [Google Scholar]
  26. Wang, L.; Zhou, B.; Wu, L.L.; Guo, B.Z.; Jiang, T.B. Differentially expressed genes in Populus simonii × Populus nigra in response to NaCl stress using cDNA-AFLP. Plant Sci. 2011, 180, 796–801. [Google Scholar] [CrossRef] [PubMed]
  27. Chen, S.; Jiang, J.; Li, H.; Liu, G. The salt-responsive transcriptome of Populus simonii × Populus nigra via DGE. Gene 2012, 504, 203–212. [Google Scholar] [CrossRef] [PubMed]
  28. Yuan, H.M.; Chen, S.; Lin, L.; Wei, R.; Li, H.Y.; Liu, G.F.; Jiang, J. Genome-wide analysis of a TaLEA-introduced transgenic Populus simonii × Populus nigra dwarf mutant. Int. J. Mol. Sci. 2012, 13, 2744–2762. [Google Scholar] [CrossRef] [PubMed]
  29. Chen, S.; Yuan, H.M.; Liu, G.F.; Li, H.Y.; Jiang, J. A label-free differential quantitative proteomics analysis of a TaLEA-introduced transgenic Populus simonii × Populus nigra dwarf mutant. Mol. Biol. Rep. 2012, 39, 7657–7664. [Google Scholar] [CrossRef] [PubMed]
  30. STRING: Functional Protein Association Networks. Available online: http://string-db.org (accessed on 2 April 2017).
  31. TAIR BLAST 2.2.8. Available online: http:// www.arabidopsis.org/Blast/index.jsp (accessed on 2 April 2017).
  32. Chang, I.F.; Curran, A.; Woolsey, R.; Quilici, D.; Cushman, J.C.; Mittler, R.; Harmon, A.; Harper, J.F. Proteomic profiling of tandem affinity purified 14-3-3 protein complexes in Arabidopsis thaliana. Proteomics 2009, 9, 2967–2985. [Google Scholar] [CrossRef] [PubMed]
  33. Roberts, M.R.; Salinas, J.; Collinge, D.B. 14-3-3 proteins and the response to abiotic and biotic stress. Plant Mol. Biol. 2002, 50, 1031–1039. [Google Scholar] [CrossRef] [PubMed]
  34. Moon, H.; Lee, B.; Choi, G.; Shin, D.; Prasad, D.T.; Lee, O.; Kwak, S.S.; Kim, D.H.; Nam, J.; Bahk, J.; et al. NDP kinase 2 interacts with two oxidative stress-activated MAPKs to regulate cellular redox state and enhances multiple stress tolerance in transgenic plants. Proc. Natl. Acad. Sci. USA 2003, 100, 358–363. [Google Scholar] [CrossRef] [PubMed]
  35. Dorion, S.; Rivoal, J. Clues to the functions of plant NDPK isoforms. Naunyn-Schmiedeberg's Arch. Pharmacol. 2015, 388, 119–132. [Google Scholar] [CrossRef] [PubMed]
  36. Leitnerdagan, Y.; Ovadis, M.; Shklarman, E.; Elad, Y.; Rav, D.D.; Vainstein, A. Expression and functional analyses of the plastid lipid-associated protein CHRC suggest its role in chromoplastogenesis and stress. Plant Physiol. 2006, 142, 233–244. [Google Scholar] [CrossRef] [PubMed]
  37. Gillet, B.; Beyly, A.; Peltier, G.; Rey, P. Molecular characterization of CDSP 34, a chloroplastic protein induced by water deficit in Solanum tuberosum L. plants, and regulation of CDSP 34 expression by ABA and high illumination. Plant J. 1998, 16, 257–262. [Google Scholar] [CrossRef] [PubMed]
  38. Kim, H.U.; Wu, S.S.; Ratnayake, C.; Huang, A.H. Brassica rapa has three genes that encode proteins associated with different neutral lipids in plastids of specific tissues. Plant Physiol. 2001, 126, 330–341. [Google Scholar] [CrossRef] [PubMed]
  39. Laizet, Y.; Pontier, D.; Mache, R.; Kuntz, M. Subfamily organization and phylogenetic origin of genes encoding plastid lipid-associated proteins of the fibrillin type. J. Genome Technol. Sci. 2004, 3, 19–28. [Google Scholar] [CrossRef]
  40. Bartolo, M.E.; Carter, J.V. Microtubules in mesophyll cells of nonacclimated and cold-acclimated spinach: Visualization and responses to freezing, low temperature, and dehydration. Plant Physiol. 1991, 97, 175–181. [Google Scholar] [CrossRef] [PubMed]
  41. Abdrakhamanova, A.; Wang, Q.Y.; Khokhlova, L.; Nick, P. Is microtubule disassembly a trigger for cold acclimation? Plant Cell Physiol. 2003, 44, 676–686. [Google Scholar] [CrossRef] [PubMed]
  42. Shoji, T.; Suzuki, K.; Abe, T.; Kaneko, Y.; Shi, H.; Zhu, J.K.; Rus, A.; Hasegawa, P.M.; Hashimoto, T. Salt stress affects cortical microtubule organization and helical growth in Arabidopsis. Plant Cell Physiol. 2006, 47, 1158–1168. [Google Scholar] [CrossRef] [PubMed]
  43. Ban, Y.; Kobayashi, Y.; Hara, T.; Hamada, T.; Hashimoto, T.; Takeda, S.; Hattori, T. α-Tubulin is rapidly phosphorylated in response to hyperosmotic stress in rice and Arabidopsis. Plant Cell Physiol. 2013, 54, 848–858. [Google Scholar] [CrossRef] [PubMed]
  44. Jiang, J.L. Effects of H2O2 stress on physiological and biochemical index of Grass Pea. Acta Agr. Boreali-Occident. Sin. 2015, 25, 243–248. [Google Scholar] [CrossRef]
  45. Yoshimura, K.; Miyao, K.; Gaber, A.; Takeda, T.; Kanaboshi, H.; Miyasaka, H.; Shigeoka, S. Enhancement of stress tolerance in transgenic tobacco plants overexpressing Chlamydomonas glutathione peroxidase in chloroplasts or cytosol. Plant J. 2004, 37, 21–33. [Google Scholar] [CrossRef] [PubMed]
  46. Sytykiewicz, H. Expression patterns of genes involved in ascorbate-glutathione cycle in aphid-infested maize (Zea mays L.) seedlings. Int. J. Mol. Sci. 2016, 17, 268. [Google Scholar] [CrossRef] [PubMed]
  47. Mohsenzadeh, S.; Esmaeili, M.; Moosavi, F.; Shahrtash, M.; Saffari, B.; Mohabatkar, H. Plant glutathione S-transferase classification, structure and evolution. Afr. J. Biotechnol. 2011, 10, 8160–8165. [Google Scholar]
  48. Kaur, C.; Singlapareek, S.L.; Sopory, S.K. Glyoxalase and methylglyoxal as biomarkers for plant stress tolerance. Crit. Rev. Plant Sci. 2014, 33, 429–456. [Google Scholar] [CrossRef]
  49. Sengupta, D.; Naik, D.; Reddy, A.R. Plant aldo-keto reductases (AKRs) as multi-tasking soldiers involved in diverse plant metabolic processes and stress defense: A structure-function update. J. Plant Physiol. 2015, 179, 40–55. [Google Scholar] [CrossRef] [PubMed]
  50. Liu, P.; Zhang, H.; Wang, H.; Xia, Y. Identification of redox-sensitive cysteines in the Arabidopsis proteome using OxiTRAQ, a quantitative redox proteomics method. Proteomics 2014, 14, 750–762. [Google Scholar] [CrossRef] [PubMed]
  51. Hu, Q.; Guo, G.; Yang, Z.; Li, Y.; Xia, Y.; Li, N. Stable isotope metabolic labeling-based quantitative thiol redox proteomic analysis of hydrogen peroxide-treated Arabidopsis plant. J. Proteom. Bioinformat. 2014, 7, 121–133. [Google Scholar] [CrossRef]
  52. Muthuramalingam, M.; Matros, A.; Scheibe, R.; Mock, H.P.; Dietz, K.J. The hydrogen peroxide-sensitive proteome of the chloroplast in vitro and in vivo. Front. Plant Sci. 2013, 4, 54. [Google Scholar] [CrossRef] [PubMed] [Green Version]
  53. Wang, H.; Wang, S.; Lu, Y.; Alvarez, S.; Hicks, L.M.; Ge, X.; Xia, Y. Proteomic analysis of early-responsive redox-sensitive proteins in Arabidopsis. J. Proteome Res. 2012, 11, 412–424. [Google Scholar] [CrossRef] [PubMed]
  54. Regier, N.; Streb, S.; Cocozza, C.; Schaub, M.; Cherubini, P.; Zeeman, S.C.; Frey, B. Drought tolerance of two black poplar (Populus nigra L.) clones: Contribution of carbohydrates and oxidative stress defence. Plant Cell Environ. 2009, 32, 1724–1736. [Google Scholar] [CrossRef] [PubMed]
  55. Ellis, M.H.; Dennis, E.S.; Peacock, W.J. Arabidopsis roots and shoots have different mechanisms for hypoxic stress tolerance. Plant Physiol. 1999, 119, 57–64. [Google Scholar] [CrossRef] [PubMed]
  56. Musrati, R.A.; Kollárová, M.; Mernik, N.; Mikulásová, D. Malate dehydrogenase: Distribution, function and properties. Gen. Physiol. Biophys. 1998, 17, 193–210. [Google Scholar] [PubMed]
  57. Tischner, R. Nitrate uptake and reduction in higher and lower plants. Plant Cell Environ. 2000, 23, 1005–1024. [Google Scholar] [CrossRef]
  58. Zagorchev, L.; Seal, C.E.; Kranner, I.; Odjakova, M. A central role for thiols in plant tolerance to abiotic stress. Int. J. Mol. Sci. 2013, 14, 7405–7432. [Google Scholar] [CrossRef] [PubMed]
  59. Pereira, L.B.; Tabaldi, L.A.; Gonçalves, J.F.; Jucoski, G.O.; Pauletto, M.M.; Weis, S.N.; Nicoloso, F.T.; Borher, D.; Rocha, J.B.T.; Schetinger, M.R.C. Effect of aluminum on δ-aminolevulinic acid dehydratase (ALA-D) and the development of cucumber (Cucumis sativus). Environ. Exp. Bot. 2006, 57, 106–115. [Google Scholar] [CrossRef]
  60. Skrebsky, E.C.; Tabaldi, L.A.; Pereira, L.B.; Rauber, R.; Maldaner, J.; Cargnelutti, D.; Gonçalves, J.F.; Castro, G.Y.; Shetinger, M.R.; Nicoloso, F.T. Effect of cadmium on growth, micronutrient concentration, and δ-aminolevulinic acid dehydratase and acid phosphatase activities in plants of Pfaffia glomerata. Braz. J. Plant Physiol. 2008, 20, 285–294. [Google Scholar] [CrossRef]
  61. Gupta, D.K.; Nicoloso, F.T.; Schetinger, M.R.; Rossato, L.V.; Pereira, L.B.; Castro, G.Y.; Srivastava, S.; Tripathi, R.D. Antioxidant defense mechanism in hydroponically grown Zea mays seedlings under moderate lead stress. J. Hazard. Mater. 2009, 172, 479–484. [Google Scholar] [CrossRef] [PubMed]
  62. Mock, H.P.; Keetman, U.; Kruse, E.; Rank, B.; Grimm, B. Defense responses to tetrapyrrole-induced oxidative stress in transgenic plants with reduced uroporphyrinogen decarboxylase or coproporphyrinogen oxidase activity. Plant Physiol. 1998, 116, 107–116. [Google Scholar] [CrossRef]
  63. Wang, W.X.; Vinocur, B.; Shoseyov, O.; Altman, A. Role of plant heat-shock proteins and molecular chaperones in the abiotic stress response. Trends Plant Sci. 2004, 9, 244–252. [Google Scholar] [CrossRef] [PubMed]
  64. Demirevska, K.; Simova-Stoilova, L.; Vassileva, V.; Feller, U. Rubisco and some chaperone protein responses to water stress and rewatering at early seedling growth of drought sensitive and tolerant wheat varieties. Plant Growth Regul. 2008, 56, 97–106. [Google Scholar] [CrossRef]
  65. Caruso, G.; Cavaliere, C.; Guarino, C.; Gubbiotti, R.; Foglia, P.; Laganà, A. Identification of changes in Triticum durum L. leaf proteome in response to salt stress by two-dimensional electrophoresis and MALDI-TOF mass spectrometry. Anal. Bioanal. Chem. 2008, 391, 381–390. [Google Scholar] [CrossRef] [PubMed]
  66. Salvucci, M.E. Association of Rubisco activase with chaperonin-60β: A possible mechanism for protecting photosynthesis during heat stress. J. Exp. Bot. 2008, 59, 1923–1933. [Google Scholar] [CrossRef] [PubMed]
  67. Yu, A.M.; Li, P.; Tang, T.; Wang, J.C.; Chen, Y.; Liu, L. Roles of Hsp70s in stress responses of microorganisms, plants, and animals. BioMed Res. Int. 2015, 2015, 510319. [Google Scholar] [CrossRef] [PubMed]
  68. Schroda, M.; Vallon, O.; Wollman, F.-A.; Beck, C.F. A chloroplast-targeted heat shock protein 70 (HSP70) contributes to the photoprotection and repair of photosystem II during and after photoinhibition. Plant Cell 1999, 11, 1165–1178. [Google Scholar] [CrossRef] [PubMed]
  69. Duan, Y.H.; Guo, J.; Ding, K.; Wang, S.J.; Zhang, H.; Dai, X.W.; Chen, Y.Y.; Govers, F.; Huang, L.L.; Kang, Z.S. Characterization of a wheat HSP70 gene and its expression in response to stripe rust infection and abiotic stresses. Mol. Biol. Rep. 2011, 38, 301–307. [Google Scholar] [CrossRef] [PubMed]
  70. Nover, L.; Scharf, K.D. Synthesis, modification and structural binding of heat-shock proteins in tomato cell cultures. Eur. J. Biochem. 1984, 139, 303–313. [Google Scholar] [CrossRef] [PubMed]
  71. Xu, Z.S.; Li, Z.Y.; Chen, Y.; Chen, M.; Li, L.C.; Ma, Y.Z. Heat shock protein 90 in plants: Molecular mechanisms and roles in stress responses. Int. J. Mol. Sci. 2012, 13, 15706–15723. [Google Scholar] [CrossRef] [PubMed]
  72. Yu, J.; Chen, S.; Zhao, Q.; Wang, T.; Yang, C.; Diaz, C.; Sun, G.; Dai, S. Physiological and proteomic analysis of salinity tolerance in Puccinellia tenuiflora. J. Proteome Res. 2011, 10, 3852–3870. [Google Scholar] [CrossRef] [PubMed]
  73. Wang, X.; Chen, S.; Zhang, H.; Shi, L.; Cao, F.; Guo, L.; Xie, Y.; Wang, T.; Yan, X.; Dai, S. Desiccation tolerance mechanism in resurrection fern-ally Selaginella tamariscina revealed by physiological and proteomic analysis. J. Proteome Res. 2010, 9, 6561–6577. [Google Scholar] [CrossRef] [PubMed]
  74. Li, H.S.; Sun, Q.; Zhao, S.J.; Zhang, W.H. Principles and Techniques of Plant Physiological Biochemical Experiment; Higher Education Press: Beijing, China, 2000; pp. 186–191. [Google Scholar]
  75. Zhao, Q.; Suo, J.; Chen, S.; Jin, Y.; Ma, X.; Yin, Z.; Zhang, Y.; Wang, T.; Luo, J.; Jin, W.; et al. Na2CO3-responsive mechanisms in halophyte Puccinellia tenuiflora roots revealed by physiological and proteomic analyses. Sci. Rep. 2016, 6, 32717. [Google Scholar] [CrossRef] [PubMed]
  76. Suo, J.; Zhao, Q.; Zhang, Z.; Chen, S.; Cao, J.; Liu, G.; Wei, X.; Wang, T.; Yang, C.; Dai, S. Cytological and proteomic analyses of Osmunda cinnamomea germinating spores reveal characteristics of fern spore germination and rhizoid tip-growth. Mol. Cell. Proteom. 2015, 14, 2510. [Google Scholar] [CrossRef] [PubMed]
  77. Bradford, M.M. A rapid and sensitive method for the quantitation of microgram quantities of protein utilizing the principle of protein-dye binding. Anal. Biochem. 1976, 72, 248–254. [Google Scholar] [CrossRef]
  78. Wei, S.; Bian, Y.; Zhao, Q.; Chen, S.; Mao, J.; Song, C.; Cheng, K.; Xiao, Z.; Zhang, C.; Ma, W.; et al. Salinity-induced palmella formation mechanism in halotolerant algae Dunaliella salina revealed by quantitative proteomics and phosphoproteomics. Front. Plant Sci. 2017, 8, 810. [Google Scholar] [CrossRef] [PubMed]
  79. Matrix Science. Available online: http://www.matrixscience.com (accessed on 2 December 2016).
  80. National Center for Biotechnology Information Non-Redundant (NCBInr) Protein Databases. Available online: http://www.ncbi.nlm.nih.gov/protein/ (accessed on 2 December 2016).
  81. UniProt. Available online: http://www.uniprot.org/ (accessed on 15 March 2017).
  82. YLoc: Interpretable Subcellular Localization Prediction. Available online: http://abi.inf.uni-tuebingen.de/Services/YLoc/webloc.cgi (accessed on 25 March 2017).
  83. LocTree3: Protein Subcellular Localization Prediction System. Available online: https://rostlab.org/services/loctree3/ (accessed on 25 March 2017).
  84. Plant-mPLoc: Predicting Subcellular Localization of Plant Proteins Including Those With Multiple Sites. Available online: http://www.csbio.sjtu.edu.cn/bioinf/plant-multi/# (accessed on 25 March 2017).
  85. ngLOC: A Bayesian method for Predicting Protein Subcellular Localization. Available online: http://genome.unmc.edu/ngLOC/index.html (accessed on 25 March 2017).
  86. TargetP 1.1 Server. Available online: http://www.cbs.dtu.dk/services/TargetP/ (accessed on 25 March 2017).
Figure 1. The morphology changes of Populus simonii × Populus nigra under hydrogen peroxide (H2O2) stress. The aerial portion of 50-day-old seedling of P. simonii × P. nigra was immersed in 0, 12, 24 and 36 mM H2O2 for 6 h, respectively. Bar = 0.2 cm.
Ijms 18 02085 g001
Figure 2. Photosynthetic characteristics of Populus simonii × Populus nigra leaves under H2O2 treatment: (A) photosynthesis rate (Pn); (B) stomata conductance (Gs); (C) intercellular CO2 (Ci); and (D) transpiration rate (Tr). The values were determined after plants were treated with 0, 12, 24 and 36 mM H2O2, and were presented as means ± standard deviation (SD) (n = 3). The different small letters indicate significant difference (p < 0.05) among different treatments.
Ijms 18 02085 g002
Figure 3. Membrane integrity and osmolyte accumulation in Populus simonii × Populus nigra leaves under H2O2 treatment: (A) malondialdehyde content; (B) relative electrolyte leakage; (C) proline content; (D) soluble sugar content; and (E) glycine betanine content. The values were determined after the plants were treated with 0, 12, 24 and 36 mM H2O2, and were presented as means ± SD (n = 3). The different small letters indicate significant difference (p < 0.05) among different treatments.
Ijms 18 02085 g003
Figure 4. Activities of antioxidant enzymes and antioxidant contents in Populus simonii × Populus nigra leaves under H2O2 treatment: (A) H2O2 content and O2•− generation rate; (B) activities of superoxide dismutase (SOD) and catalase (CAT); (C) activities of ascorbate peroxidase (APX) and peroxidase (POD); (D) glutathione peroxidase (GPX) activity; (E) activities of monodehydroascorbate reductase (MDHAR) and dehydroascorbate reductase (DHAR); (F) activities of glutathione reductase (GR) and glutathione S-transferase (GST); (G) contents of ascorbate (AsA) and dehydroascorbate (DHA); and (H) contents of reduced glutathione (GSH) content and oxidized glutathione (GSSG) content. The values were determined after plants were treated with 0, 12, 24 and 36 mM H2O2, and were presented as means ± SD (n = 3). The different small letters indicate significant difference (p < 0.05) among different treatments.
Ijms 18 02085 g004
Figure 5. A representative 2DE gel images of proteins from leaves of Populus simonii × Populus nigra. Proteins were separated on 24 cm linear gradient immobilized pH gradient (IPG) strips (pH 4–7) using isoelectric focusing (IEF) in the first dimension, followed by 12.5% sodium dodecyl sulfate polyacrylamide gel electrophoresis (SDS-PAGE) gels in the second dimension. The 2DE gel was stained with Coomassie Brilliant Blue. Molecular weight (MW) in kilodaltons (KDa) and isoelectric point (pI) of proteins are indicated on the left and top of the gel, respectively. Eighty-one H2O2-responsive proteins identified by matrix-assisted laser desorption/ ionization (MALDI) tandem time of flight (TOF-TOF) mass spectrometry were marked with numbers on the gel, and the detailed information can be found in Table 1, Figure S1, and Table S1.
Ijms 18 02085 g005
Figure 6. Functional categorization and subcellular localization of the identified 81 H2O2-responsive proteins from leaves of Populus simonii × Populus nigra. (A) The functional categories: The percentage of proteins in different functional categories is shown in the pie; (B) Subcellular localization groups of the identified proteins: The numbers of proteins with different locations are shown. Chl, chloroplast; Cyt, cytoplasm; Mit, mitochondrion.
Ijms 18 02085 g006
Figure 7. Hierarchical clustering analysis of 81 H2O2-responsive proteins in leaves of Populus simonii × Populus nigra. The four columns represent different treatments, including 0, 12, 24 and 36 mM H2O2. The rows represent individual proteins. The increased or decreased proteins are indicated in red or green, respectively. The color intensity increases with increasing abundant differences, as shown in the scale bar. The scale bar indicates log (base2) transformed protein abundance ratios ranging from −1.8 to 1.8. Functional categories indicated by capital letters, spot numbers, and protein names are listed on the right side. A, photosynthetic electron transfer chain; B, Calvin cycle; C, carbohydrate and energy metabolism; D, other metabolisms; E, protein synthesis; F, protein folding and unfolding; G, redox homeostasis and stress defense; H, signaling; I, cell structure; J, miscellaneous or function unknown. The abbreviations refer to Table 1.
Ijms 18 02085 g007
Figure 8. The protein–protein interaction (PPI) network in Populus simonii × Populus nigra leaves revealed by STRING analysis. A total of 81 H2O2-responsive proteins represented by 59 unique homologous proteins from Arabidopsis are shown in PPI network. Six main groups are indicated in different colors. The PPI network is shown in the confidence view generated by STRING database. Stronger associations are represented by thicker lines. The abbreviations refer to Table 1.
Ijms 18 02085 g008
Figure 9. Schematic presentation of H2O2-responsive mechanism in leaves of Populus simonii × Populus nigra. The identified proteins were integrated into subcellular pathways: (A) signaling; (B) cell structure; (C), redox homeostasis and stress defense; (D) photosynthetic electron transfer chain; (E) calvin cycle; (F) carbohydrate and energy metabolism; (G) amino acid metabolism; (H) tetrapyrrole biosynthesis; and (I) protein synthesis, folding and unfolding. The abundances of identified proteins (shaded in gray ovals), enzyme activities (shaded in yellow ovals), and substrate contents are marked with squares, circles and triangles in different colors, respectively. The increased and decreased proteins, enzyme activities, and substrate contents are represented in red and green, respectively. The color intensity increases with increasing differences. The solid line indicates single-step reaction, the dashed line indicates multistep reaction, and the dotted line indicates the movement of proteins or substances. The abbreviations of identified proteins refer to Table 1. The abbreviations of metabolites: 1,3-PGA, 1,3-bisphosphoglycerate; 2-PG, 2-phosphoglycerate; 3-IPM, 3-isopropylmalate; 3-PGA, 3-phosphoglycerate; 4-MOP, 4-methyl-2-oxopentanoate; ADP, adenosine diphosphate; ALA, 5-aminolevulinicacid; Ala, alanine; Asp, aspartate; ATP, adenosine-triphosphate; CpoIII, coproporphyrinogen III; ctDNA, chloroplast DNA; Cys, cysteine; DHA, dehydroascrobate; DHAP, dihydroxyacetone phosphate; E4P, erythrose-4-phosphate; F-1,6-P, fructose-1,6-bisphosphate; F6P, fructose-6-phosphate; FADH2, reduced flavin adenine dinucleotide; Fd, ferredoxin; G3P, glyceraldehyde-3-phosphate; Glc1P, glucose-1-phosphate; Glc6P, glucose-6-phosphate; Gln, glutamine; Glu, glutamate; GSH, reduced glutathione; GSSG, oxidized glutathione; Leu, leucine; MDHA, monodehydroascrobate; MIS, mitochondrial intermembrane space; NAD+/NADH, nicotinamide adenine dinucleotide; NADP+/NADPH, nicotinamide adenine dinucleotide phosphate; NDP, nucleoside diphosphate; NTP, nucleoside triphosphate; OAA, oxaloacetic acid; PBG, porphobilinogen; PC, plastocyanin; PEP, phosphoenolpyruvate; pre-mRNA, precursor mRNA; Proto, protoporphyrin IX; PSI, photosystem I; PSII, photosystem II; Q, quinone; R5P, ribulose-5-phosphate; RuBP, ribulose-1,5-bisphosphate; RuP, ribulose-5-phosphate; S-1,7-P, sedoheptulose-1,7-bisphosphate; S7P, sedoheptulose-7-phosphate; TIC, translocon at the inner envelope membrane of chloroplasts; TOC, translocon at the outer envelope membrane of chloroplasts; UroIII, uroporphyrinogen III; X5P, xylulose-5-phosphate; α-KG, α-ketoglutarate.
Ijms 18 02085 g009
Table 1. H2O2-responsive proteins in leaves of Populus simonii × Populus nigra.
Spot No. (a)Protein Name (b)AbbreviationSubcellular Location (c)Accession No. (d)Sco (e)QM (f)V%±SD (g)
0 12 24 36
Photosynthetic electron transfer chain (9)
4044Chlorophyll A/B binding proteinCABChlAAA185291352 Ijms 18 02085 i001
3965Chlorophyll A/B binding proteinCABChlAAA185291532 Ijms 18 02085 i002
4040Light harvesting chlorophyll A/B binding proteinCABChlABW708002133 Ijms 18 02085 i003
4079Chlorophyll A-B binding family protein*CABChlABK967652013 Ijms 18 02085 i004
4064Photosystem II oxygen-evolving complex protein 2 precursorOEC2ChlXP_0023008581362 Ijms 18 02085 i005
4192Photosynthetic NDH subunit of luminal location 5, chloroplastic*PnsL5ChlCDP133781022 Ijms 18 02085 i006
3848Ferredoxin-NADP reductase, chloroplastic*FNRChlOAY575473105 Ijms 18 02085 i007
3375ATP synthase CF1 α subunit, chloroplasticcATP synthase αChlAKF339063696 Ijms 18 02085 i008
3104ATP synthase CF1 α subunit, chloroplasticcATP synthase αChlAKF339061642 Ijms 18 02085 i009
Calvin cycle (28)
4038Carbonic anhydrase isoform 1*CA1ChlABK963361873 Ijms 18 02085 i010
3549Ribulose-bisphosphate carboxylase (RuBisCO) activase, chloroplasticRCAChlQ015873164 Ijms 18 02085 i011
4441RuBisCO activase 1, chloroplasticRCA1ChlQ7X9A01622 Ijms 18 02085 i012
3485RuBisCO activase, chloroplastic isoform X1*RCA X1ChlABK963595436 Ijms 18 02085 i013
3487RuBisCO activase, chloroplastic isoform X1*RCA X1ChlABK963594016 Ijms 18 02085 i014
3477Rubisco activase isoform 2*RCA2ChlCDP001272945 Ijms 18 02085 i015
4075RuBisCO activase, chloroplastic isoform X2RCA X2ChlXP_0110026352945 Ijms 18 02085 i016
3777RuBisCO large chainRBCLChlO782581762 Ijms 18 02085 i017
3303RuBisCO large subunitRBCLChlCUR000031762 Ijms 18 02085 i018
3497RuBisCO large chainRBCLChlO782581082 Ijms 18 02085 i019
4259RuBisCO small chainRBCSChlXP_0110350622436 Ijms 18 02085 i020
4263RuBisCO small chainRBCSChlXP_0025316241122 Ijms 18 02085 i021
3584Phosphoglycerate kinase 1 family proteinPGK1ChlXP_0023150663517 Ijms 18 02085 i022
3491Phosphoglycerate kinase 1 family proteinPGK1ChlXP_0023150663517 Ijms 18 02085 i023
3687Glyceraldehyde-3-phosphate dehydrogenase A, chloroplastic*GAPDH-AChlABK949564846 Ijms 18 02085 i024
3671Glyceraldehyde-3-phosphate dehydrogenase A, chloroplastic*GAPDH-AChlOIW033511662 Ijms 18 02085 i025
3670Glyceraldehyde-3-phosphate dehydrogenase A, chloroplastic*GAPDH-AChlOIW033511132 Ijms 18 02085 i026
3817Fructose-bisphosphate aldolase 1, chloroplastic*FBA1ChlABK956131643 Ijms 18 02085 i027
3813Fructose-bisphosphate aldolase 3FBA3ChlAGB056001853 Ijms 18 02085 i028
3816Fructose-bisphosphate aldolase 3FBA3ChlAGB056001963 Ijms 18 02085 i029
3809Fructose-bisphosphate aldolase 3FBA3ChlAGB056001242 Ijms 18 02085 i030
3802Fructose-bisphosphate aldolase 3FBA3ChlAGB056001332 Ijms 18 02085 i031
3082Transketolase, chloroplasticTKChlKHG01555992 Ijms 18 02085 i032
3114Transketolase, chloroplasticTKChlEMT028621202 Ijms 18 02085 i033
4084Transketolase, chloroplasticTKChlQ43848922 Ijms 18 02085 i034
3639Sedoheptulose-1,7-bisphosphatase, chloroplastic*SBPaseChlXP_002316235572 Ijms 18 02085 i035
3580Sedoheptulose-1,7-bisphosphatase, chloroplastic*SBPaseChlOAY384821013 Ijms 18 02085 i036
3696Phosphoribulokinase, chloroplastic*PRKChlAOL56425922 Ijms 18 02085 i037
Carbohydrate and energy metabolism (12)
3208Phosphoglucomutase, cytoplasmicPGMCytQ9ZSQ41153 Ijms 18 02085 i038
3725Glyceraldehyde-3-phosphate dehydrogenase 2, cytosolic*GAPDH2CytXP_0023181143744 Ijms 18 02085 i039
3256EnolaseCytQ42971862 Ijms 18 02085 i040
3506Alcohol dehydrogenase*ADHCytXP_0023021951335 Ijms 18 02085 i041
3500Alcohol dehydrogenase*ADHCytXP_0023021951713 Ijms 18 02085 i042
3701NAD-dependent malate dehydrogenaseNAD-MDHCytAAL115021612 Ijms 18 02085 i043
3702NAD-dependent malate dehydrogenaseNAD-MDHCytAAL115021042 Ijms 18 02085 i044
3710NAD-dependent malate dehydrogenaseNAD-MDHCytAAL115022233 Ijms 18 02085 i045
4448Pyruvate dehydrogenase E1 component subunit beta, mitochondrial*PDH E1-βMitGAU165702493 Ijms 18 02085 i046
3409Pyruvate dehydrogenase E1 component subunit beta, mitochondrial*PDH E1-βMitGAU165702213 Ijms 18 02085 i047
4202ATP synthase subunit d, mitochondrial *mATP synthase dMitCBI31501892 Ijms 18 02085 i048
4417ATP synthase subunit beta, mitochondrial *mATP synthase βMitCDP00716662 Ijms 18 02085 i049
Other metabolism (10)
3611Glutamine synthetaseGSCytAGG192031793 Ijms 18 02085 i050
3604Glutamine synthetaseGSCytABF066651503 Ijms 18 02085 i051
3841O-acetylserine (thiol) lyase family proteinOAS-TLUncertainXP_006389317702 Ijms 18 02085 i052
37473-isopropyl malate dehydrogenase, chloroplasticIPMDHChlP296961172 Ijms 18 02085 i053
3402Alanine aminotransferase family proteinALTUncertainALT556392396 Ijms 18 02085 i054
3515Aldolase superfamily protein isoform 1, delta-aminolevulinic acid dehydratase 1, chloroplastic*ALAD1ChlEOY16322923 Ijms 18 02085 i055
3587Uroporphyrinogen decarboxylaseURODChlXP_0110123042724 Ijms 18 02085 i056
3478Anthocyanidin 3-O-glucosyltransferase 2*A3GT 2UncertainABK961362123 Ijms 18 02085 i057
3798Isoflavone reductase family protein*IFRCytABK950191333 Ijms 18 02085 i058
37912-methylene-furan-3-one reductase*MFORChlABK962792383 Ijms 18 02085 i059
Protein synthesis (1)
3071Elongation factor G-2, chloroplastic*EF-G2ChlXP_0023044301084 Ijms 18 02085 i060
Protein folding and unfolding (8)
3245RuBisCO large subunit-binding protein subunit αRBP-αChlXP_011000529993 Ijms 18 02085 i061
3133Stromal 70 kDa heat shock-related family proteincpHSP70ChlXP_0063895176067 Ijms 18 02085 i062
3102Chaperone DnaKDnaKChlKVI030564457 Ijms 18 02085 i063
3106Chaperone DnaKDnaKChlKVI030562754 Ijms 18 02085 i064
4395Heat shock cognate protein 80HSC80CytP36181872 Ijms 18 02085 i065
4397Heat shock protein 90HSP90CytKVI10442742 Ijms 18 02085 i066
4398Heat shock protein 90HSP90CytKVI10442712 Ijms 18 02085 i067
3814Peptidyl-prolyl cis-trans isomerase CYP26-2, chloroplastic*CYP26-2ChlXP_0023185602814 Ijms 18 02085 i068
Redox homeostasis and stress defense (4)
4086Glutathione S-transferase U30GST-U30CytANO39995742 Ijms 18 02085 i069
4073Glutathione S-transferase F1GST-F1CytANO399241642 Ijms 18 02085 i070
3748Glyoxalase I homolog family proteinGlyICytXP_002305564882 Ijms 18 02085 i071
3636Aldo/keto reductase family proteinAKRChlXP_0023021252964 Ijms 18 02085 i072
Signaling (2)
4249Nucleoside diphosphate kinase 1*NDPK1CytABK9560413925% Ijms 18 02085 i073
398514-3-3-like protein B*14-3-3 BCytXP_00230654511912% Ijms 18 02085 i074
Cell structure (2)
3419Tubulin α chainTubulin-αCytQ9FT3610112% Ijms 18 02085 i075
4001Plastid-lipid-associated protein 6, chloroplastic*PAP6ChlAAR2648915418% Ijms 18 02085 i076
Miscellaneous or function unknown (5)
3898Haloacid dehalogenase-like hydrolase family protein*HADChlABK962721147% Ijms 18 02085 i077
4457Pop3 peptide family protein*Pop3Uncertain1SI9_A20751% Ijms 18 02085 i078
3662Soybean genes regulated by cold 2-like domain*SRC2UncertainXP_01103016213610% Ijms 18 02085 i079
4278Stress responsive A/B barrel domain*SRBChlCAA3908213224% Ijms 18 02085 i080
3615Unknown proteinSecretedABK94923937% Ijms 18 02085 i081
a Assigned spot number as indicated in Figure 5. b The name of the proteins identified by MALDI TOF/TOF MS. Protein names marked with an asterisk (*) have been edited based on BLAST against NCBI non-redundant protein database. The detailed information of the NCBI BLAST can be found in Table S2. c Protein subcellular localization predicted by software YLoc, LocTree3, Plant-mPLoc, ngLOC, and TargetP. Chl, chloroplast; Cyt, cytoplasm; Mit, mitochondrion. d Database accession numbers from NCBInr. e The Mascot score obtained after searching against the NCBInr database. f The number of unique peptides identified for each protein. g The mean values of protein spot volumes relative to total volume of all the spots. The different small letters on the columns indicate significant differences (p < 0.05) among the four samples as determined by one-way ANOVA. Error bars indicate ± SD.

