iTRAQ-Based Identification of Proteins Related to Muscle Growth in the Pacific Abalone, Haliotis discus hannai

1
State Key Laboratory of Marine Environmental Science, Xiamen University, Xiamen 361102, China
2
College of Ocean and Earth Sciences, Xiamen University, Xiamen 361102, China
3
Fujian Collaborative Innovation Center for Exploitation and Utilization of Marine Biological Resources, Xiamen University, Xiamen 361102, China
*
Authors to whom correspondence should be addressed.
Int. J. Mol. Sci. 2017, 18(11), 2237; https://doi.org/10.3390/ijms18112237
Submission received: 18 September 2017
/
Revised: 20 October 2017
/
Accepted: 21 October 2017
/
Published: 25 October 2017
(This article belongs to the Section Biochemistry)
Abstract
:The abalone Haliotis discus hannai is an important aquaculture species that is grown for human consumption. However, little is known of the genetic mechanisms governing muscle growth in this species, particularly with respect to proteomics. The isobaric tag for relative and absolute quantitation (iTRAQ) method allows for sensitive and accurate protein quantification. Our study was the first to use iTRAQ-based quantitative proteomics to investigate muscle growth regulation in H. discus hannai. Among the 1904 proteins identified from six samples, 125 proteins were differentially expressed in large specimens of H. discus hannai as compared to small specimens. In the large specimens, 47 proteins were upregulated and 78 were downregulated. Many of the significant Kyoto Encyclopedia of Genes and Genomes (KEGG) pathways, including these differentially expressed proteins, were closely related to muscle growth, including apoptosis, thyroid hormone signaling, regulation of the actin cytoskeleton, and viral myocarditis (p < 0.05). Our quantitative real-time polymerase chain reaction (qRT-PCR) analyses suggested that the alterations in expression levels observed in the differentially expressed proteins were consistent with the alterations observed in the encoding mRNAs, indicating the repeatability of our proteomic approach. Our findings contribute to the knowledge of the molecular mechanisms of muscle growth in H. discus hannai.
1. Introduction
The Pacific abalone, Haliotis discus hannai, is the most popular cultivated abalone throughout China, Japan, and South Korea; it is known for its delicate flavor and high market value [1]. To meet increasing commercial demand, large-scale aquaculture of the Pacific abalone in China began in the late 1980s [1,2]. Moreover, abalone farming has gradually extended from the northern Yellow Sea to the East China Sea [3], and now Fujian province accounts for nearly 80% (112,611 tons/139,697 tons) of total abalone production in China [4]. The time required to grow the abalone to market size is the most important factor contributing to abalone production efficiency [5]. Because the edible portion of the abalone is the foot muscle, genetic improvement programs in the abalone industry have typically focused on enhancing muscle growth as well as increasing growth speed [6]. Unfortunately, little is yet known about the genes involved in muscle growth in H. discus hannai. A better understanding of the genetic mechanisms involved in muscle growth in H. discus hannai is critical for efficient selective breeding.
Proteomic profiling, a direct reflection of gene expression patterns, provides information about gene regulation and active pathways. Most previous studies of gene expression in marine invertebrates have relied on two-dimensional gel electrophoresis, a technique that is limited by low throughput and low reproducibility, such as abalone [7], brine shrimp [8], marine snail [9], and Pomacea canaliculata [10]. In contrast, recently developed proteomic techniques, such as isobaric tags for relative and absolute quantitation (iTRAQ), provide more reliable quantitative measurements and allow for comparisons among samples [11]. Indeed, iTRAQ, used in combination with two-dimensional liquid chromatography and tandem mass spectrometry (LC-MS/MS) is one of the most reliable methods of quantitative proteomic analysis available to date [12,13,14], especially in aquatic animals, such as medaka fish [15], Urobatis jamaicensis [16], zebrafish [17], Crassostrea gigas [18], Portunus trituberculatus [19], and Apostichopus japonicus [20].
Here, we used iTRAQ with GO (Gene Ontology) functional annotations, and KEGG (Kyoto Encyclopedia of Genes and Genomes) pathway information to assess the proteomic changes in the muscle tissues of 2-year-old specimens of H. discus hannai. Our aim was to identify the specific proteins involved in muscle growth regulation in both fast- and slow-growing individuals. We identified several growth-related proteins involved in diverse biological processes, including ion binding, protein binding, metabolism, and stress response. We performed qRT-PCR validation experiments to detect the expression levels of the genes encoding some representative proteins in various tissues. Our results increase the knowledge of the mechanisms underlying abalone muscle growth.
2. Results
2.1. Protein Profiling
2.2. Differentially Expressed Proteins (DEPs)
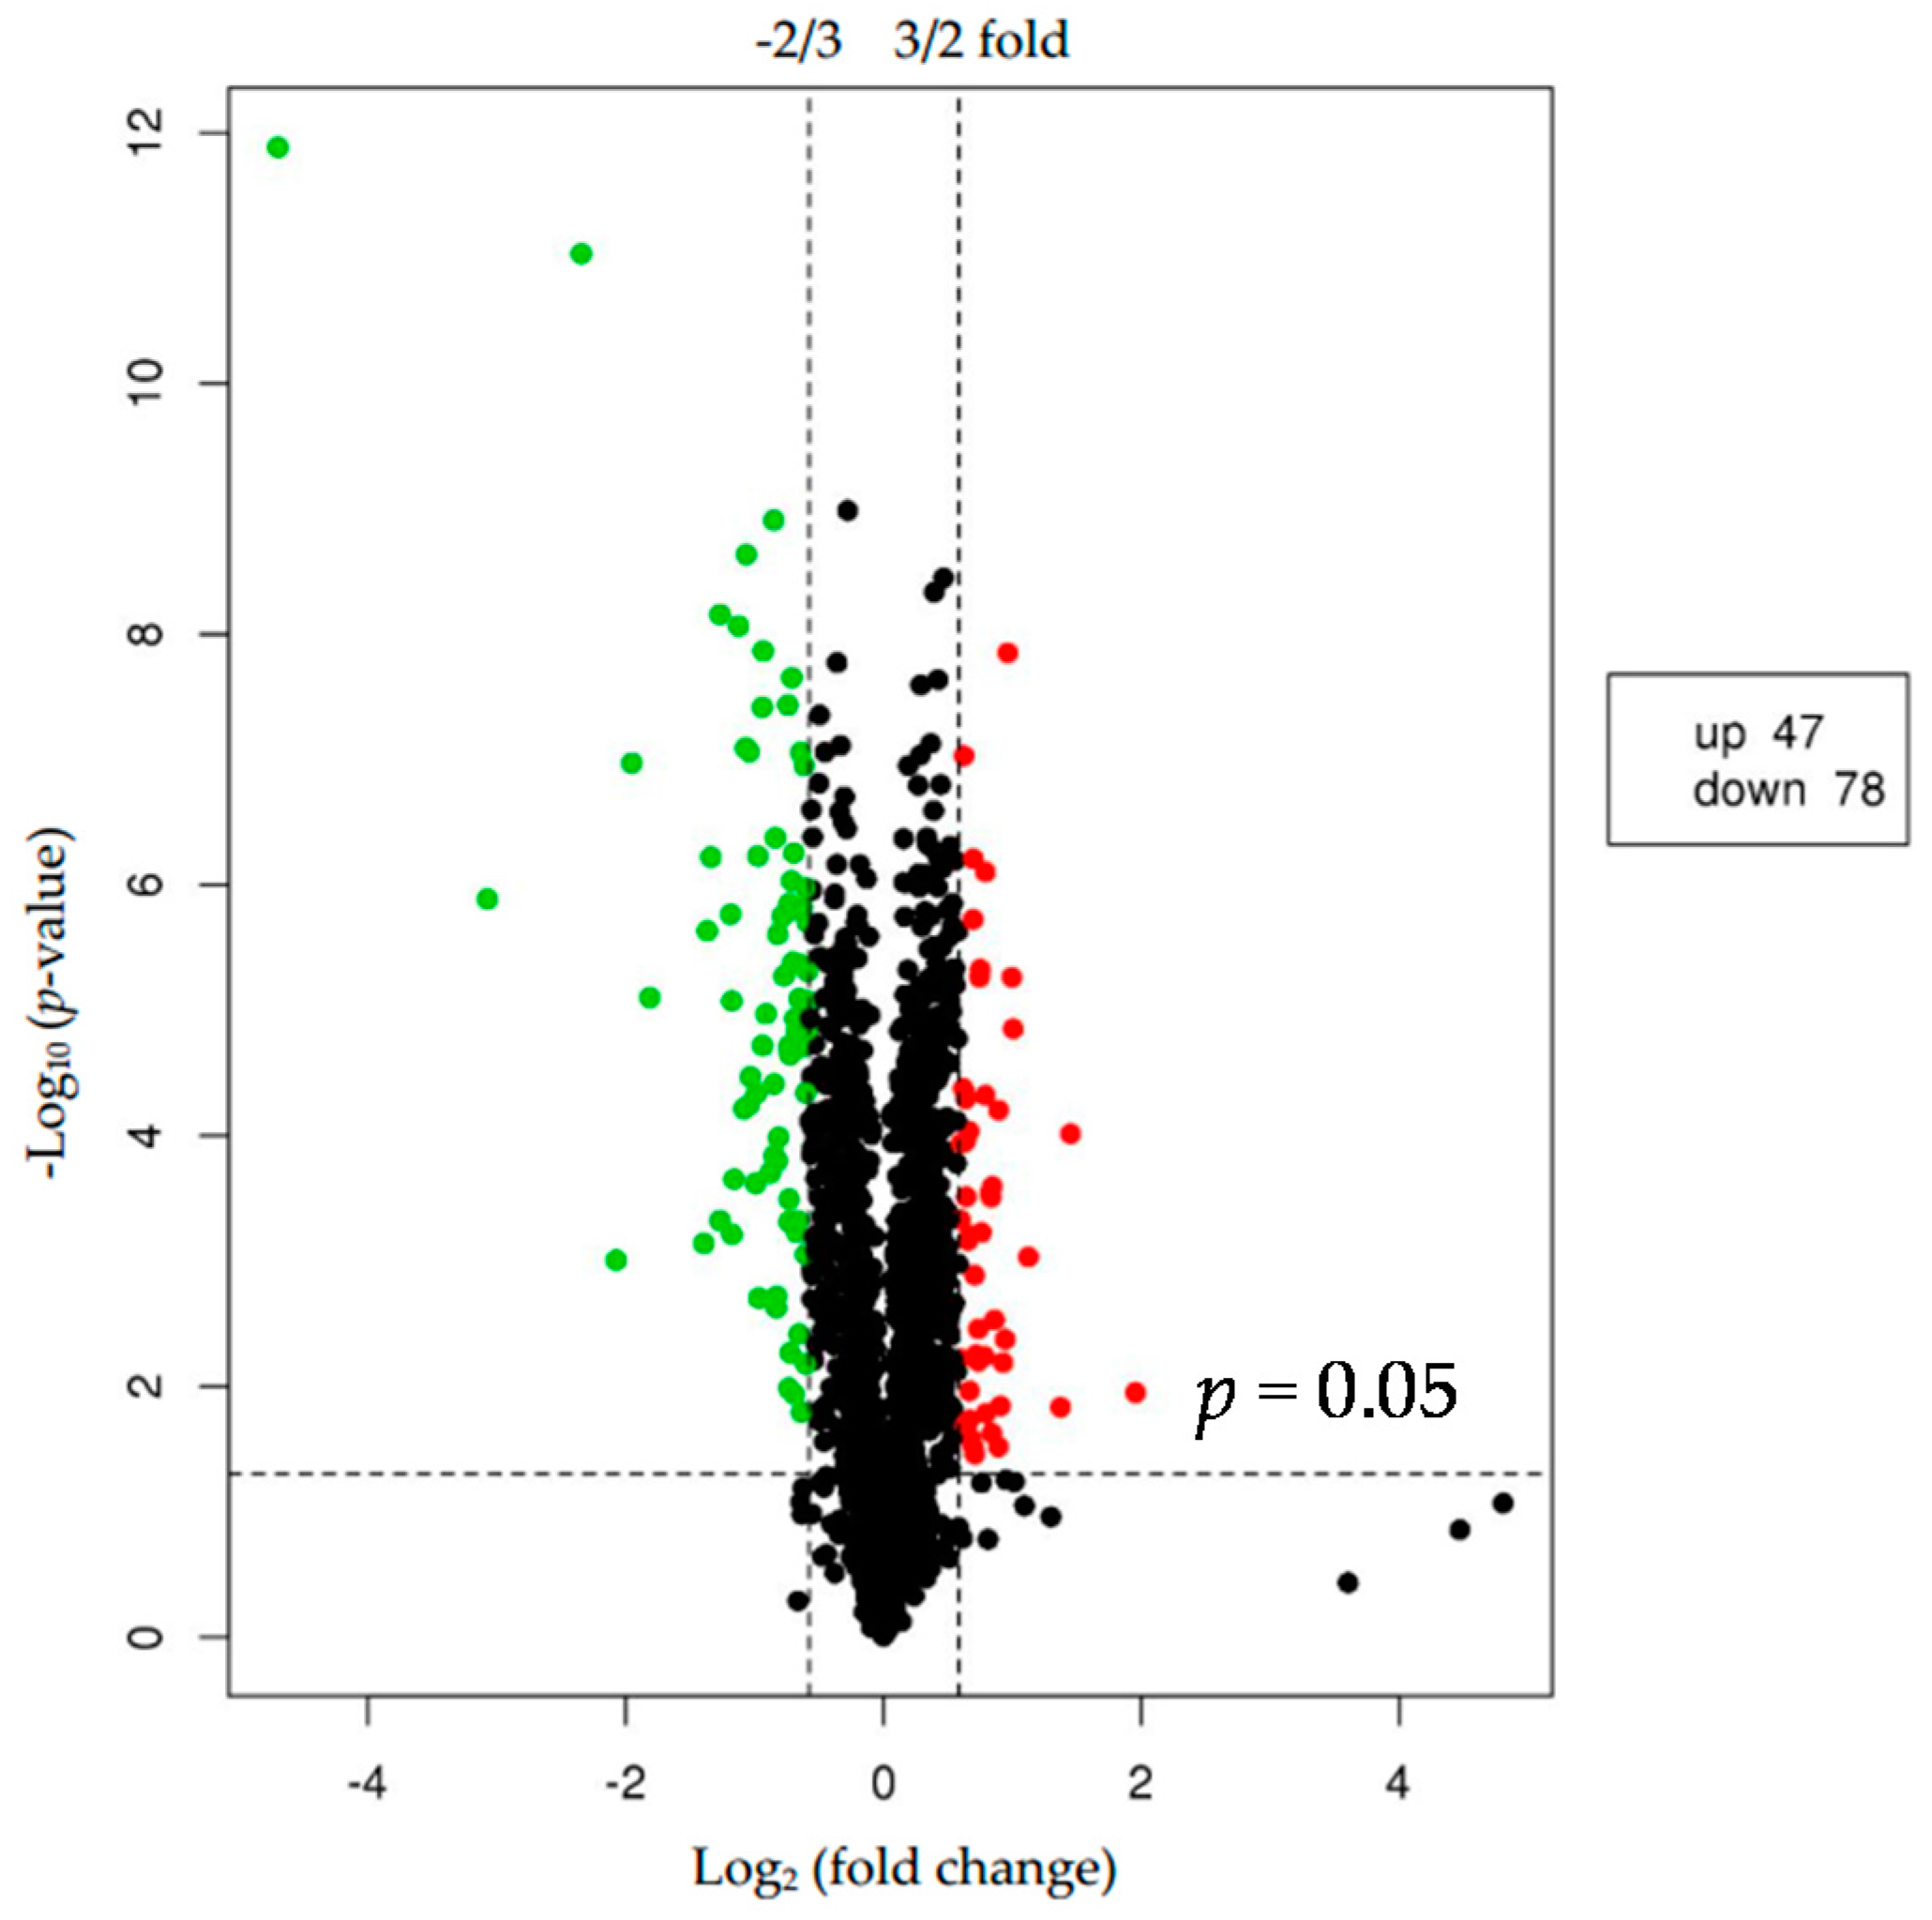
We used p < 0.05 as a threshold indicating a significant alteration in protein expression. We further quantified 125 significant DEPs with iTRAQ (Tables S2 and S3). In the larger abalones, 47 proteins were upregulated, and 78 were downregulated compared to the smaller abalones. Hierarchical clustering analysis based on differences in protein expression recovered a clear distinction between the larger abalones and the smaller ones (Figure 1 and Figure 2).
2.3. GO Functional Classification
Based on our analysis of the GO database, some of our identified proteins are involved in various biological functions: metabolic process (98 proteins), intracellular protein transport (73 proteins), or proteolysis (45 proteins; Figure S1). Others are categorized as cellular components: membrane (73 proteins) or microtubule (70 proteins; Figure S1). The remaining proteins are involved in major molecular functions: protein binding (3240 proteins) and calcium ion binding (614 proteins; Figure S1).
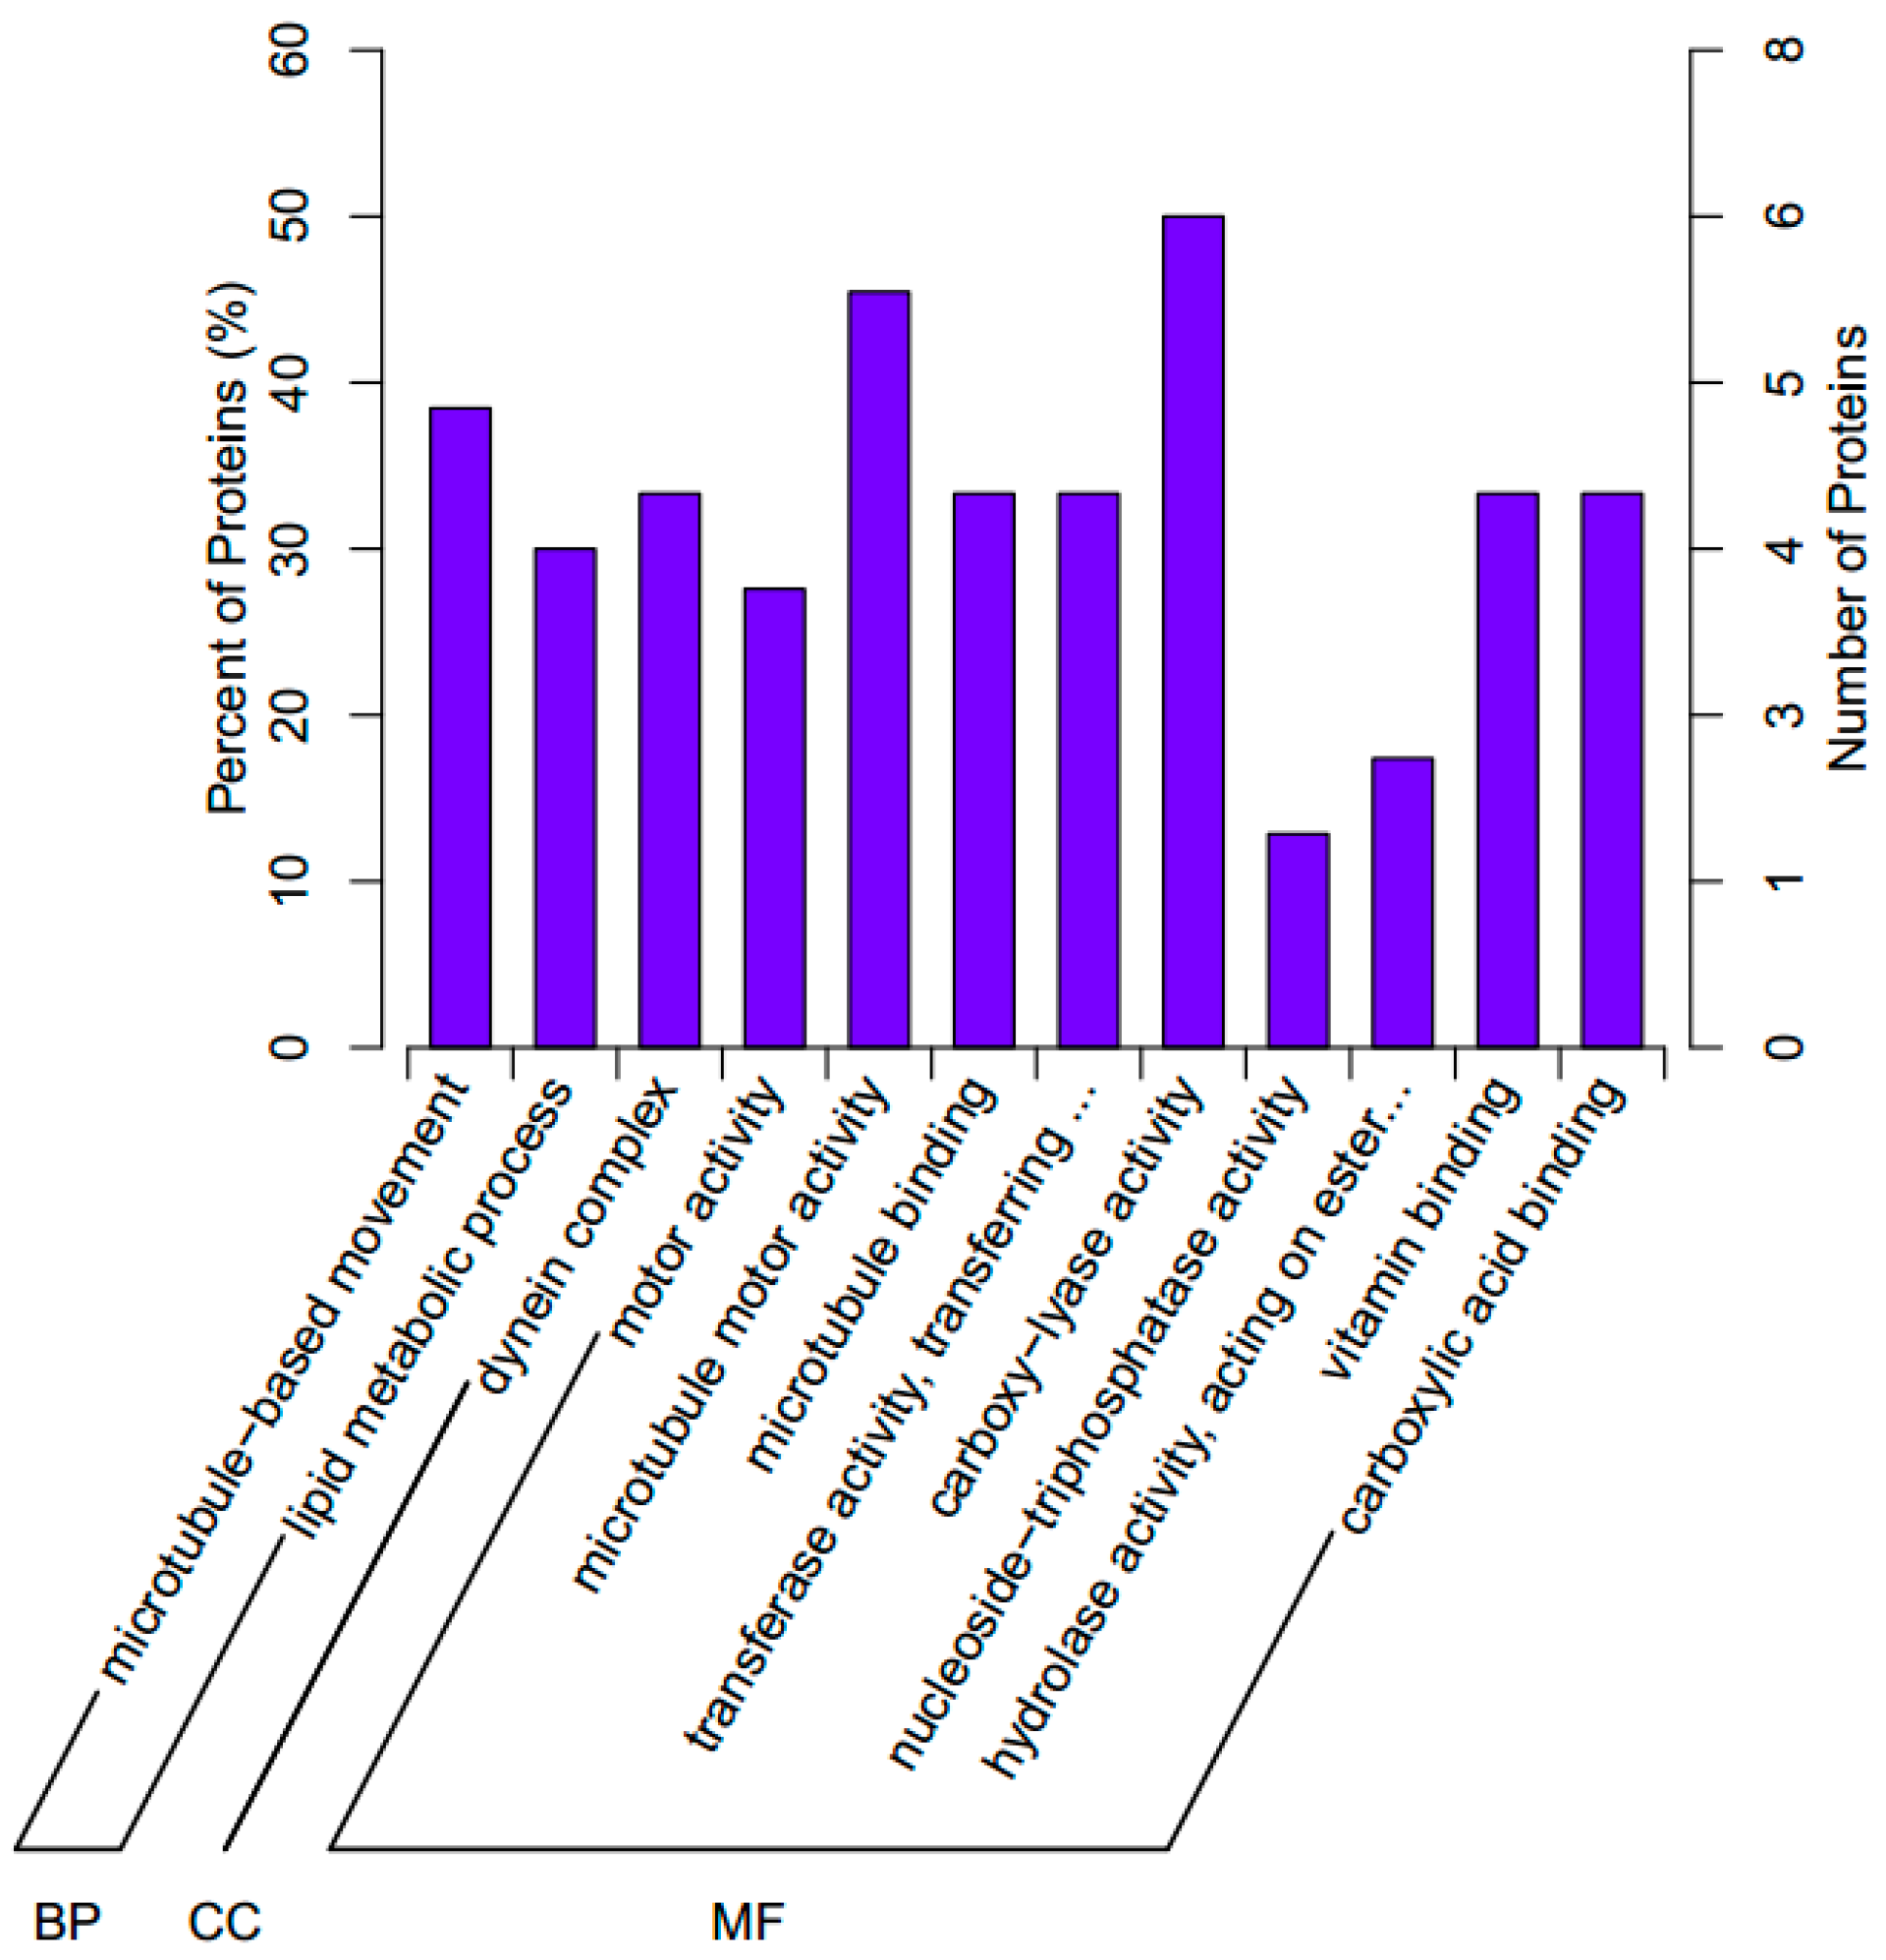
We further investigated the biological processes associated with the significant DEPs. In short, 12 GO terms were assigned to the significant DEPs in three independent ontological categories: biological processes (2 terms), cellular components (1 term), and molecular function (9 terms; Figure 3).
2.4. KEGG Pathway Analysis
Our KEGG pathway enrichment analysis recovered 11 significant pathways (p < 0.05; Table 2), including lysosome (eight proteins), adherens junction (seven proteins), bladder cancer (three proteins), and apoptosis (seven proteins). Two additional significant pathways may be involved in growth regulation in H. discus hannai: the thyroid hormone signaling pathway (six proteins), and the regulation of the actin cytoskeleton (nine proteins).
In the apoptosis KEGG pathway, four proteins (actin A1, myophilin, actin-2, and actin) were upregulated in the larger abalones, and three proteins (CTSC, GDPD1, CTSB) were downregulated. In the thyroid hormone signaling pathway, the majority of the enriched proteins (actin A1, SLC2A3, actin-2, and actin) were upregulated in the larger abalones, although the enriched proteins ACTB and GDPD1 were downregulated. In contrast, in the actin cytoskeleton regulation pathway, the upregulated proteins in the larger abalones were actin A1, actin-2, and actin, while profilin, ACTB, PIP4K2B, EGFR, GDPD1, and the myosin regulatory light chain sqh were downregulated. Across all significant KEGG pathways, more proteins were downregulated in the large specimens of H. discus hannai than in the small specimens.
2.5. qRT-PCR
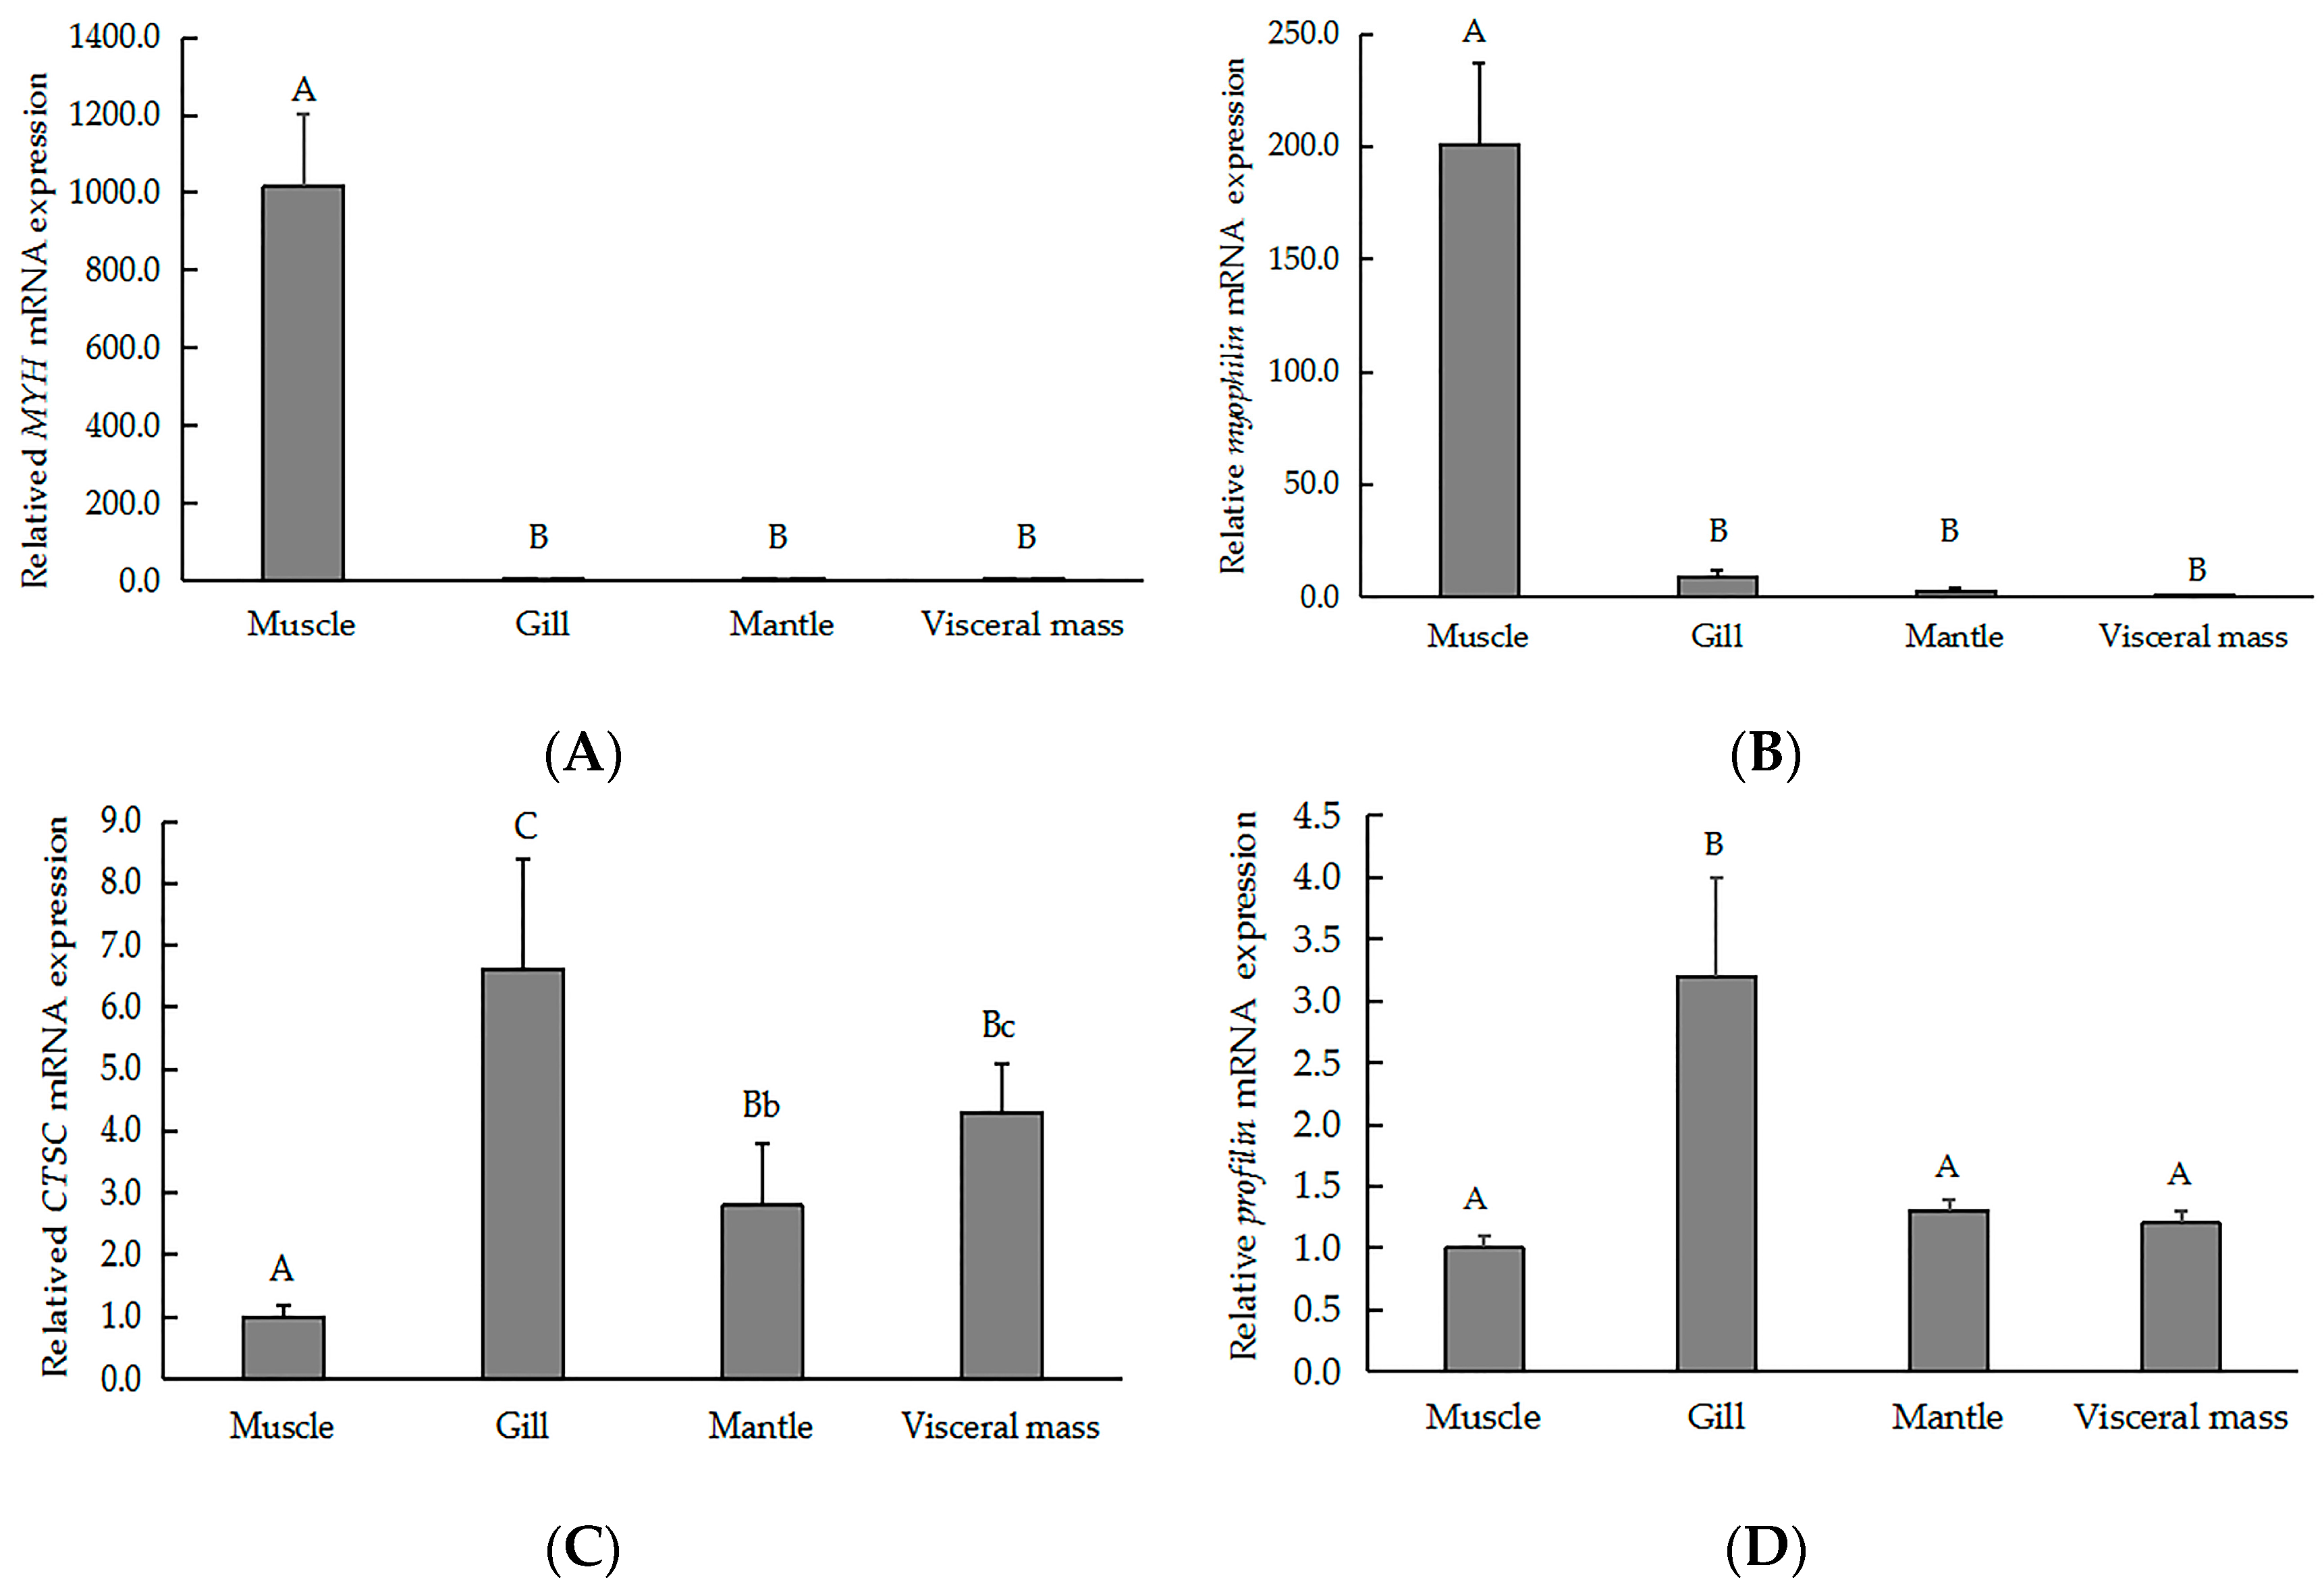
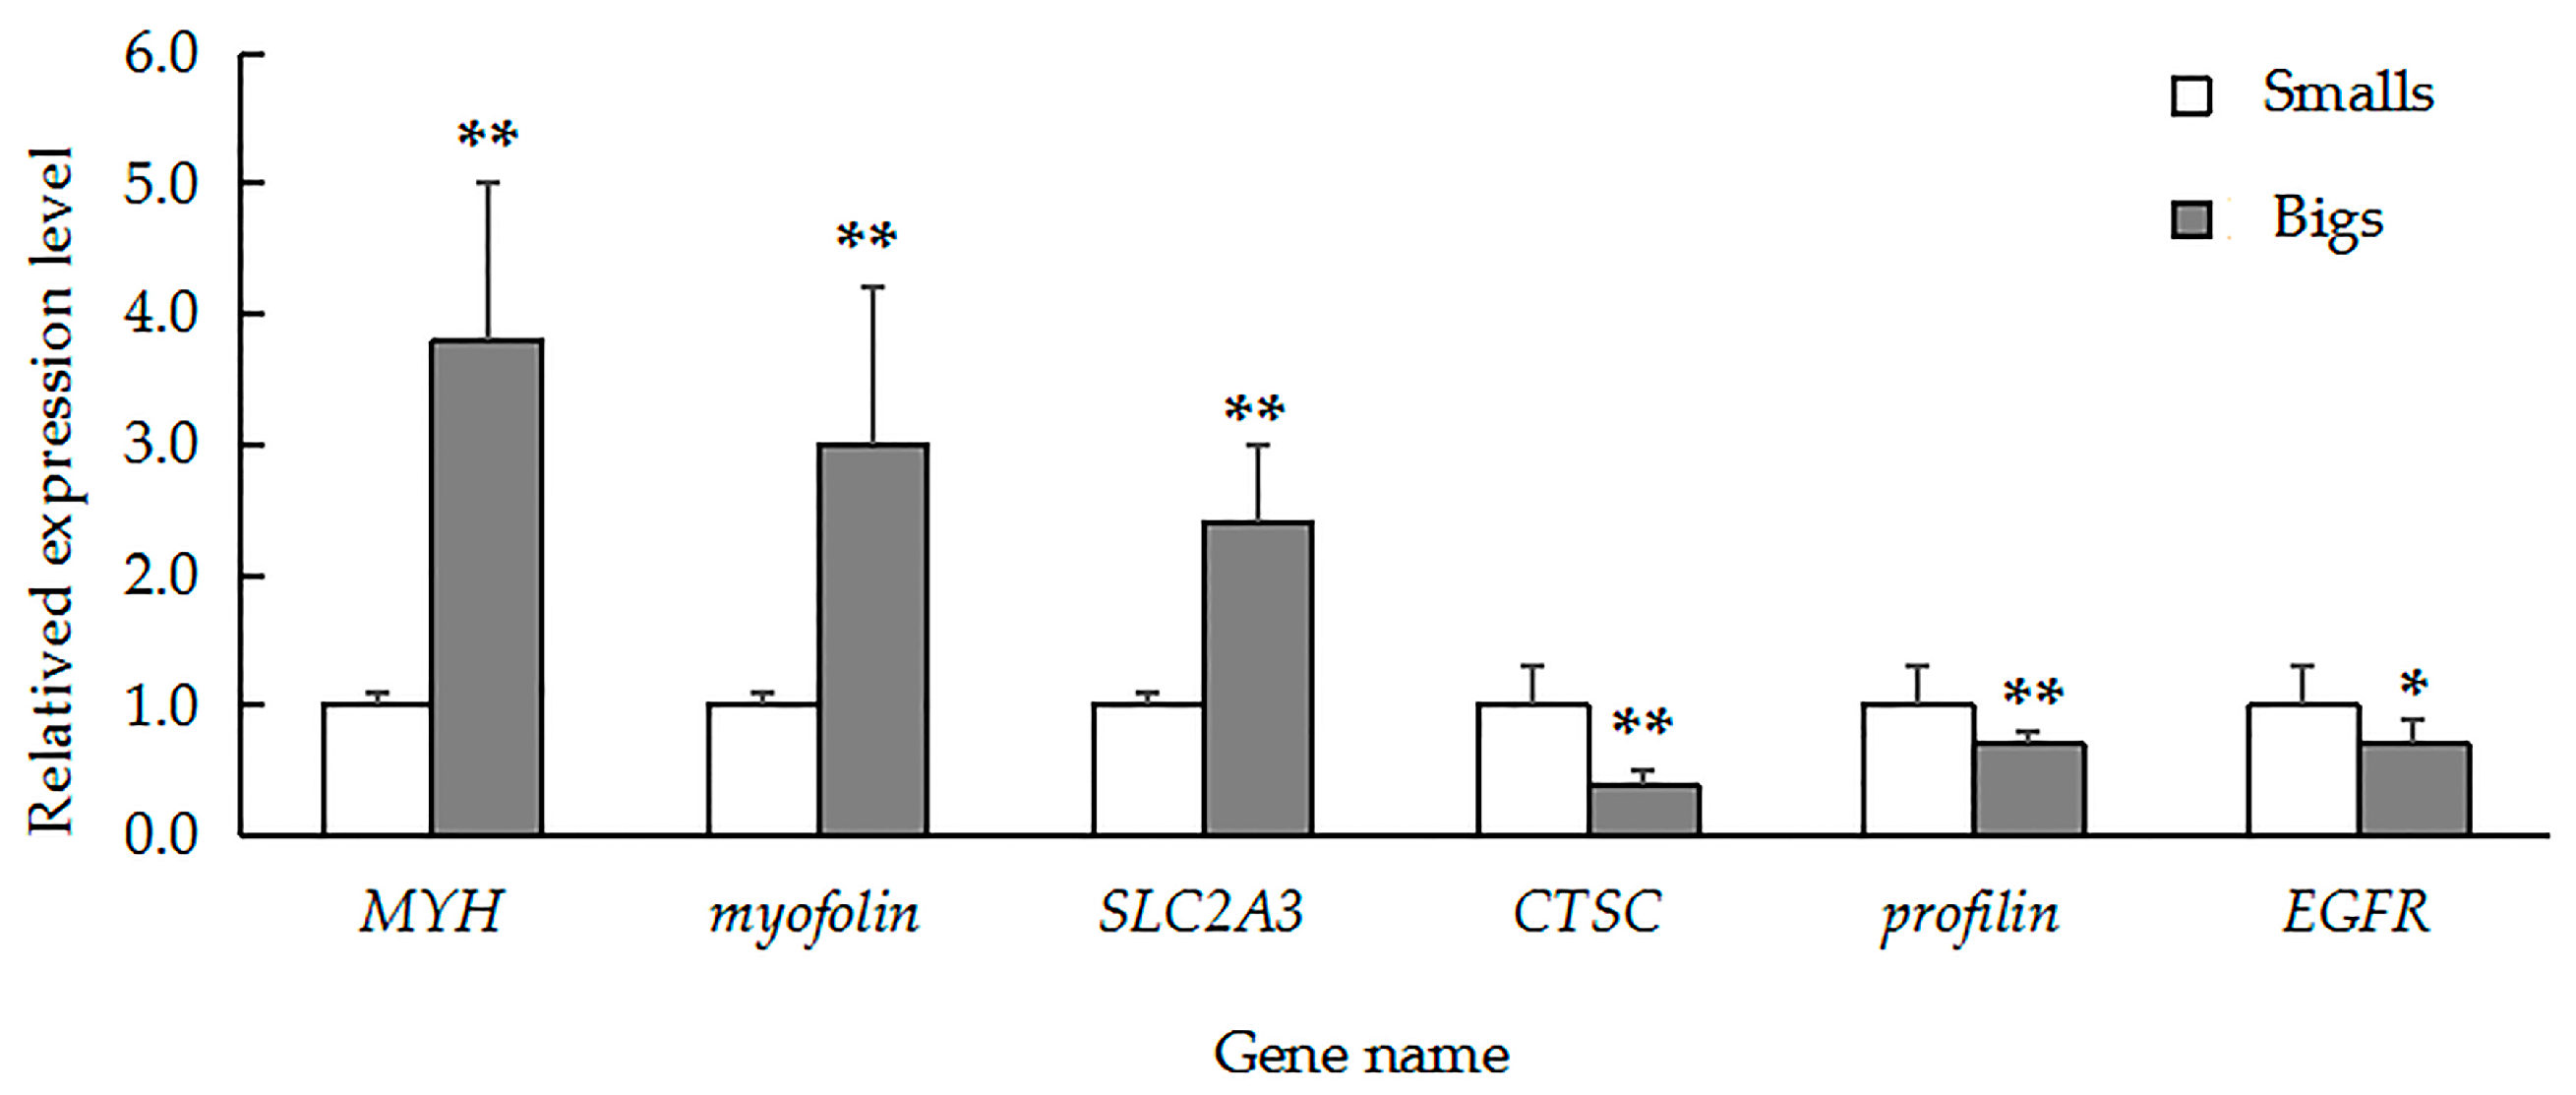
To validate our iTRAQ results and to analyze the correlation between gene and protein expression, we used qRT-PCR to quantify the expression of the genes that encode six previously identified representative DEPs. We selected three genes that encoded upregulated proteins (myophilin, SLC2A3, and MYH) and three genes that encoded downregulated proteins (CTSC, EGFR, and profilin). We found that the level of mRNA expression varied in parallel to the corresponding protein expression (Figure 4). We also found that four gene transcripts were nearly expressed across all of the tissues (muscle, gill, visceral mass, and mantle). The highest levels of MYH (Figure 5A) and myophilin (Figure 5B) gene expression were found the muscle; expression levels of MYH and the myophilin gene were extremely low in the gill, visceral mass, and mantle (Figure 5A,B). However, the expression levels of the genes CTSC (Figure 5C) and profilin (Figure 5D) were lowest in the muscle tissue.
3. Discussion
Body weight is a complex trait that is regulated by the coordinated activity of several proteins. According to the previous study [21], we believe that larger abalones have higher growth rate; on the contrary, smaller individuals with low growth rate. So this provides material for the study of abalone growth. The abalones are divided into small-, medium-, and large-size groups to identify genes associated with high growth rates using RNA sequencing technology [22]. To further clarify the mechanisms underlying growth regulation, we used an iTRAQ-based quantitative proteomic method to compare large and small specimens of the abalone H. discus hannai. To our knowledge, this is the first study to analyze growth mechanisms in the abalone using this method. We identified 125 proteins that were expressed differently in the larger abalones as compared to the smaller abalones: 47 were upregulated and 78 were downregulated. These DEPs were shown to be involved in multiple biological processes and signaling pathways, including apoptosis, thyroid hormone signaling, and the regulation of the actin cytoskeleton. These processes are related to muscle growth.
In molluscs, muscle protein synthesis is very important for growth. Here, we identified several proteins involved in molluscan muscle growth, including the myosin II heavy chain (MYH II) and MYH; previous research has indicated that the myosin gene is positively correlated with muscle development [23,24]. The myosin heavy chain 67 was expressed in many bovine tissues, including the adductor muscle, the longissimus dorsi, the psoas, the atrium, the ventricle, the aorta, and the liver [25]. In the Siniperca chuatsi, a freshwater fish species, the highest level of MYH-7b protein expression is found in red muscle, followed by the skin, pituitary, and eyes, while the lowest levels are found in the myocardium, gills, and gonads [26]. In the Atlantic salmon, the highest MYH expression always contain higher levels of muscle protein [23]. Here, we found the highest level of MYH gene expression in the muscle, suggesting that the MYH protein may play an important role in muscle development in H. discus hannai. The protein expression levels of MYH and MYH II were upregulated in the larger abalones when compared to the smaller abalones, suggesting that differences in size might be correlated with properties of the foot tissue, including glandular or accessory foot organs [27,28]. Together, our results suggest that the proteins MYH and MYH II are important regulatory factors in molluscan muscle growth, and should be the focus of further studies of growth in H. discus hannai.
All actins are globular, microfilament-forming, multi-functional proteins; they are highly conserved among almost all eukaryotes [29]. In vertebrates, muscular and non-muscular actins are distinguished by characteristic differences in amino acid composition [30]. In invertebrates, actins are also classed as muscular or non-muscular, but the two classes are not distinguishable based on amino acid sequence [30]. Members of the actin gene family are involved in various cellular processes, including muscle contraction, cell motility, cell division and cytokinesis, vesicle and organelle movement, cell signaling, and the establishment and maintenance of cell junctions, and cell shape [31]. To date, actin genes have been isolated from several molluscs, including Aplysia californica [32,33], Crassostrea gigas [34], Placopecten magellanicus [30], and Patella vulgata [35]. It is suggest that the actin gene family of the abalone H. iris include at least eight genes; three of these, H. iris A1, H. iris A2, and H. iris A3, are shown to be differentially expressed [36]. Here, we found that four actin proteins (actin A1, actin-2, actin, and ACTB) were differentially expressed in the larger abalones as compared to the smaller abalones. Our KEGG pathway analysis indicated that these DEPs were primarily involved in the adherens junction, in the thyroid hormone signaling pathway, in viral myocarditis, and in the regulation of the actin cytoskeleton. These results were consistent with previous work. However, the functions of the actin proteins that we identified in H. discus hannai were unknown, which is indicative of the complexity of the functions of actin proteins in abalone muscle growth.
Profilin, an actin-binding protein, is involved in the dynamic turnover and restructuring of the actin cytoskeleton [37]. In some cases, profilin binds to monomeric actin, thereby inhibiting polymerization, while under other conditions it stimulates polymerization. Profilin is present in almost all mature mouse tissue, with the exception of skeletal muscle [38]. The binding of profilin to barbed ends inhibits filament branching by both WASP proteins and the Arp2/3 complex, resulting in actin-based motility [39]. The injection of profilin inhibits both lamellipodium motility and the formation of the lamellipodial branched filaments [40,41]. Profilin also reinforces the complex relationships among RTK pathways, membrane lipids, actin-binding proteins, and the actin cytoskeleton [42]. Consistent with previous studies, we found that the protein expression of profilin was downregulated in the larger abalones as compared to the smaller abalones; overall, the lowest profilin expression was found in the muscle [38]. Therefore, we speculate that molluscan profilin may be involved in the regulation of the actin cytoskeleton through dynamic control of actin polymerization, consequently influencing muscle growth.
Metabolic alterations are tightly associated with physiological adaptations [16]. Here, many of the DEPs (Tables S2 and S3) were enzymes implicated in lipid metabolism or other catalytic activities, including both upregulated proteins (e.g., chitin synthase, dynein heavy chain 10, propionyl-CoA carboxylase β chain, and 2-amino-3-carboxymuconate-6-semialdehyde decarboxylase) and downregulated proteins (e.g., N-acetylglucosamine-6-sulfatase, carbohydrate sulfotransferase 11, and thymidine phosphorylase). Some proteins implicated in DNA duplication and protein synthesis (e.g., leucine-rich repeat-containing protein 9, ganglioside-induced differentiation-associated protein 1, and 40S ribosomal protein S12) were upregulated, while others (e.g., glutathione-S-transferase Mu 2, transgelin, lymphocyte cytosolic protein 2, and rho GTPase-activating protein 44) were downregulated. Therefore, our data indicate that, to promote growth in larger specimens of abalone, more energy is conserved than in smaller specimens, and available resources are distributed differently.
A number of apoptosis-related proteins (e.g., myophilin, CTSC, and CTSB). Myophilin is first identified as a muscle-specific protein in E. granulosus and is involved in the regulation of muscle contraction [43,44]. A myophilin-like protein highly similar to myophilin was subsequently identified in E. granulosus. The rsj-myophilin-like protein may be useful as an adjunct immunodiagnostic antigen for schistosomiasis, as well as a marker of drug treatment efficacy [45]. CTSB is a lysosomal cysteine protease in the papain superfamily; it plays an important role in intracellular proteolysis [46]. Upregulation of CTSB was found in various cancers as well as in premalignant lesions and other pathological conditions [47,48,49]. CTSB is produced by the muscle tissue during metabolism [50]. CTSB gene knockout experiments showed that CTSB was involved in epilepsy-related apoptotic cell death [51]. CTSC is a lysosomal exo-cysteine protease and a member of the papain superfamily [52]. The enzyme is first synthesized as procathepsin C, is modified into mature CTSC, and then appears to oligomerize just before entry into the lysosome [53,54,55]. CTSC appears to coordinate the activation of many serine proteases in immune and inflammatory cells. CTSC also activates the granzymes, which are the main effector proteases that are involved in NK cell cytotoxicity [56]. Here, both CTSB and CTSC were downregulated in the larger specimens, while the myophilin protein was upregulated. Both CTSC and myophilin were expressed across all of the examined tissues (muscle, gill, visceral mass, and mantle); these proteins were both involved in the lysosome and the apoptosis pathways. We speculate that the reduced expression of CTSB and CTSC and the overexpression of the myophilin protein not only reflect the decreased levels of cell apoptosis found in the larger specimens, but also indicate that these proteins play important roles in the growth of H. discus hannai.
Here, we detected several proteins that were uncharacterized, as well as proteins with unknown functions in muscle growth. Our results indicate the complexity of growth mechanisms in gastropod molluscs. The DEPs identified in this study may serve as candidate biomarkers for further studies of molluscan muscle growth. However, further studies are needed to confirm our results, and the mechanisms involving muscle growth-related proteins require further clarification.
4. Materials and Methods
4.1. Experimental Tissue
Since 2014, a breeding population of H. discus hannai has produced pedigreed offspring; all of the matings are controlled, and are conducted at Fuda Aquiculture in Jinjiang, Fujian province, China. The six specimens used in this study were obtained from this facility at 2 years of age. Three of the specimens were smaller (“Smalls” group; mean weight, 16.5 ± 1.0 g), and three were larger (“Bigs” group; mean weight, 95.1 ± 7.7 g). All six acclimated in our laboratory for 1 week before dissection. Samples of the muscle, gill, visceral mass, and mantle were collected from each specimen, immediately snap-frozen in liquid nitrogen, and stored at −80 °C.
4.2. Protein Preparation
The muscle tissue samples were individually milled to a power in a mortar with liquid nitrogen. We then mixed 150 mg of the powder from each sample with 1 mL of lysis buffer containing Tris-base (pH 8), 7 M Urea, 2 M Thiourea, 0.1% SDS, 2 mM EDTA, complete protease inhibitor cocktail (Sigma, St. Louis, MO, USA), and 1 mM phenylmethylsulfonyl fluoride in a glass homogenizer. The homogenate was incubated on ice for 20 min and then centrifuged at 12,000× g for 15 min at 4 °C. The supernatant was transferred to a clean tube, and protein concentration was determined with a Bradford assay.
4.3. iTRAQ Labeling of Peptides
The supernatant from each sample, containing precisely 100 μg of protein, was digested with Trypsin Gold (Promega, Madison, WI, USA) at 37 °C for 16 h. After trypsin digestion, peptides were dried by vacuum centrifugation. Desalted peptides were labeled with iTRAQ reagents (iTRAQ® Reagent-8PLEX Multiplex Kit, Sigma), following the manufacturer’s instructions (AB Sciex, Foster City, CA, USA). For 100 μg of peptide, 1 unit of labeling reagent was used. Peptides were dissolved in 20 µL of 0.5 M triethylammonium bicarbonate solution (TEAB, pH 8.5), and the labeling reagent was added to 70 µL of isopropanol. After incubation for 1 h, the reaction was stopped with 50 mM Tris/HCl (pH 7.5). The labeled peptides were incubated at 25 °C for 2 h. Differently labeled peptides were mixed and then desalted in 100 mg SCX columns (strata-x-c, Phenomenex: 8B-S029-EBJ).
4.4. HPLC Fractionation
The first dimension RP separation by microLC was performed on an L-3000 HPLC System (Rigol, Beijing, China) by using a Durashell RP column (5 μm, 150 Å, 250 mm × 4.6 mm i.d., Agela, Wilmington, DE, USA). Mobile phases A (2% acetonitrile plus 20 mM NH4FA; pH adjusted to 10.0 with NH3·H2O) and B (98% acetonitrile plus 20 mM NH4FA; pH adjusted to 10.0 with NH3·H2O) were used to develop a gradient elution. The solvent gradient was as follows: 5–8% B, 2 min; 8–18% B, 11 min; 18–32% B, 9 min; 32–95% B, 1 min; 95% B, 1 min; 95–5% B, 2 min. Tryptic peptides were separated at an eluent flow rate of 1 mL/min and monitored at UV 214 nm. The column oven was set at 37 °C. Eluent was collected every minute and was merged to generate 10 fractions. Samples were vacuum dried and then reconstituted in 15 μL water containing 0.1% (v/v) FA and 5% (v/v) acetonitrile.
4.5. LC-MS/MS Analysis
Fractions from the first dimension RPLC were dissolved with loading buffer and then separated with a C18 column (75 μm inner-diameter, 360 μm outer-diameter × 10 cm, 3 μm C18). Mobile phase A was a solution of 0.1% formic acid in water, and mobile phase B was a solution of 0.1% formic acid in acetonitrile; we applied a series of adjusted linear gradients with a flow rate of 300 nL/min, based on the hydrophobicity of fractions eluted in 1D LC.
We then used an Orbitrap Q-Exactive for MS analysis. The source operated at 1.8 kV. For the full MS survey scan, the AGC target was 3e6, and the scan range was 350 to 1800 with a resolution of 70,000. For iTRAQ-labeled peptide, the top 20 peaks with charge state 2 and above were selected for fragmentation by HCD with normalized collision energy of 30%. The resolutions of the MS2 spectra were set to 17,500.
4.6. Data Analysis
We first searched the raw MS data files generated by Q-Exactive with Mascot 2.6.0 (Matrix Science, London, UK). Mascot was used to search the protein database (H. discus hannai, 29,385 entries) that derived from the annotation of de novo genome assembly, assuming the digestion enzyme trypsin. Carbamidomethyl of cysteine and iTRAQ8plex of lysine and the n-terminus were specified in Mascot as fixed modifications. Oxidation of methionine, acetyl of the n-terminus and iTRAQ8plex of tyrosine were specified in Mascot as variable modifications. Protein identifications were accepted if they contained at least one identified peptide and the probability of an FDR was less than 10.0% in Scaffold software (version Scaffold_4.0.7, Proteome Software Inc., Portland, OR, USA). We only used significant ratios, defined as p < 0.05 and |log2FC| > 0.585. We used the databases GO (http://www.geneontology.org) and KEGG (http://www.genome.jp/kegg/) to predict gene function.
4.7. qRT-PCR
Six genes were selected for confirmation and analysis with qRT-PCR. Gene-specific primers (Table S4) were designed with Primer Premier 3.0. Total RNA was extracted from the previously collected tissues (muscle, gill, visceral mass, and mantle) of all the specimens. Total RNA was then reverse-transcribed into cDNA with a PrimeScript RT Reagent Kit (TaKaRa, Dalian, China). The qRT-PCR reaction was performed in a 20 μL volume using a Faststart Universal SYBR Green Master (Rox) (Roche), 120 nM of each specific primer, and 5 μL of cDNA. We used the following cycling protocol: 95 °C for 10 min; 40 cycles of 95 °C for 15 s and 59 °C for 30 s; followed by a melting curve. All of the qRT-PCRs were run in triplicate. The 2−∆∆Ct method was used to analyze the differences in gene expression [57].
4.8. Statistical Analysis
Statistical analyses were performed with SPSS 19.0. Data shown are the mean ± SD of three replicates. Statistical significance was evaluated using the Student’s t test. A p-value < 0.05 was considered statistically significant.
5. Conclusions
Here we present the first report of differentially expressed proteins in large versus small specimens of H. discus hannai using the iTRAQ technique. Interestingly, we discovered that many of DEPs we identified were involved in apoptosis, thyroid hormone signaling, the regulation of actin cytoskeleton, and other signaling pathways. Some of these DEPs and pathways were closely related to muscle growth. However, further investigation is required to confirm the predicted roles of these identified proteins. Our results deepen our understanding of the mechanisms underlying muscle growth in the abalone.
Supplementary Materials
Supplementary materials can be found at www.mdpi.com/1422-0067/18/11/2237/s1.
Acknowledgments
This work was supported by grants from National Natural Science Foundation of China (No. U1605213; 31472277); Key S & T Program of Fujian Province (No. 2016NZ01010006 and 2016NZ0001-4); Fundamental Research Funds for the Central Universities (No. 20720150077) and Earmarked Fund for Modern Agro-industry Technology Research System (No. CARS-49).
Author Contributions
Jianfang Huang, Weiwei You and Caihuan Ke conceived and designed the experiments; Jianfang Huang and Xuan Luo performed the experiments; Jianfang Huang analyzed the data; Jianfang Huang wrote the paper; Caihuan Ke, Xuan Luo, and Weiwei You revised the manuscript.
Conflicts of Interest
The authors declare no conflict of interest.
References
- Guo, X.M.; Ford, S.E.; Zhang, F.S. Molluscan aquaculture in China. J. Shellfish Res. 1999, 18, 19–31. [Google Scholar]
- Luo, X.; Ke, C.H.; You, W.W.; Wang, D.X.; Chen, F. Molecular identification of interspecific hybrids between Haliotis discus hannai Ino and Haliotis gigantea Gmelin usingamplified fragment-length polymorphism and microsatellite markers. Aquacult. Res. 2010, 41, 1827–1834. [Google Scholar] [CrossRef]
- Chen, N.; Luo, X.; Gu, Y.T.; Han, G.D.; Dong, Y.W.; You, W.W.; Ke, C.H. Assessment of the thermal tolerance of abalone based on cardiac performance in Haliotis discus hannai, H. gigantea and their interspecific hybrid. Aquaculture 2016, 465, 258–264. [Google Scholar] [CrossRef]
- Guo, Y.F.; Zhao, W.W.; Gao, H.Q.; Wang, S.; Yu, P.M.; Yu, H.S.; Wang, D.; Wang, Q.; Wang, J.X.; Wang, Z.F.; et al. China Fishery Statistical Yearbook; China Agriculture Press: Beijing, China, 2017. [Google Scholar]
- Naipil, C.C.; Muñoz, V.V.; Valdés, J.A.; Molina, A.; Escárate, C.G. RNA interference in Haliotis rufescens myostatin evidences upregulation of insulin signaling pathway. Agri Gene 2016, 1, 93–99. [Google Scholar] [CrossRef]
- Elliott, N.G. Genetic improvement programmes in abalone: What is the future? Aquac. Res. 2000, 31, 51–59. [Google Scholar] [CrossRef]
- Di, G.; Luo, X.; You, W.; Zhao, J.; Kong, X.; Ke, C. Proteomic analysis of muscle between hybrid abalone andparental lines Haliotis gigantea Reeve and Haliotis discus hannai Ino. Heredity 2015, 114, 564–574. [Google Scholar] [CrossRef] [PubMed]
- Wang, W.W.; Meng, B.; Chen, W.H.; Ge, X.M.; Liu, S.Q.; Yu, J. A proteomic study on postdiapaused embryonic development of brine shrimp (Artemia franciscana). Proteomics 2007, 7, 3580–3591. [Google Scholar] [CrossRef] [PubMed]
- Martínez-Fernández, M.; Rodríguez-Piñeiro, A.M.; Oliveira, E.; Páez de la Cadena, M.; Rolán-Alvarez, E. Proteomic Comparison between Two Marine Snail Ecotypes Reveals Details about the Biochemistry of Adaptation. J. Proteome Res. 2008, 7, 4926–4934. [Google Scholar] [CrossRef] [PubMed]
- Sun, J.; Zhang, Y.; Thiyagarajan, V.; Qian, P.Y.; Qiu, J.W. Protein expression during the embryonic development of a gastropod. Proteomics 2010, 10, 2701–2711. [Google Scholar] [CrossRef] [PubMed]
- Karp, N.A.; Huber, W.; Sadowski, P.G.; Charles, P.D.; Hester, S.V.; Lilley, K.S. Addressing Accuracy and Precision Issues in iTRAQ Quantitation. Mol. Cell. Proteom. 2010, 9, 1885–1897. [Google Scholar] [CrossRef] [PubMed]
- Dong, Z.; Ba, H.X.; Zhang, W.; Coates, D.; Li, C.Y. iTRAQ-Based Quantitative Proteomic Analysis of the Potentiated and Dormant Antler Stem Cells. Int. J. Mol. Sci. 2016, 17, 1778. [Google Scholar] [CrossRef] [PubMed]
- Pierce, A.; Unwin, R.D.; Evans, C.A.; Griffiths, S.; Carney, L.; Zhang, L.; Jaworska, E.; Lee, C.F.; Blinco, D.; Okoniewski, M.J.; et al. Eight-channel iTRAQ enables comparison of the activity of six leukemogenic tyrosine kinases. Mol. Cell. Proteom. 2008, 7, 853–863. [Google Scholar] [CrossRef] [PubMed] [Green Version]
- Wang, W.S.; Liu, X.H.; Liu, L.X.; Lou, W.H.; Jin, D.Y.; Yang, P.Y.; Wang, X.L. iTRAQ-based quantitative proteomics reveals myoferlin as a novel prognostic predictor in pancreatic adenocarcinoma. J. Proteom. 2013, 91, 453–465. [Google Scholar] [CrossRef] [PubMed]
- Malécot, M.; Marie, A.; Dao, S.P.; Edery, M. iTRAQ-based proteomic study of the effectsof microcystin-LR on medaka fish liver. Proteomics 2011, 11, 2071–2078. [Google Scholar] [CrossRef] [PubMed]
- Marancik, D.P.; Fast, M.D.; Camus, A.C. Proteomic characterization of the acute-phase response of yellow stingrays Urobatis jamaicensis after injection with a Vibrio anguillarum-ordalii bacterin. Fish Shellfish Immunol. 2013, 34, 1383–1389. [Google Scholar] [CrossRef] [PubMed]
- Lü, A.; Hu, X.C.; Wang, Y.; Shen, X.J.; Li, X.; Zhu, A.H.; Tian, J.; Ming, Q.L.; Feng, Z.J. iTRAQ analysis of gill proteins from the zebrafish (Danio rerio) infected with Aeromonas hydrophila. Fish Shellfish Immunol. 2014, 36, 229–239. [Google Scholar] [CrossRef] [PubMed]
- Zhang, Y.; Sun, J.; Mu, H.W.; Li, J.; Zhang, Y.H.; Xu, F.J.; Xiang, Z.M.; Qin, P.Y.; Qiu, J.W.; Yu, Z.N. Proteomic Basis of Stress Responses in the Gills of the Pacific Oyster Crassostrea gigas. J. Proteom. Res. 2015, 14, 304–317. [Google Scholar] [CrossRef] [PubMed]
- Ren, X.Y.; Yu, X.; Gao, B.Q.; Li, J.; Liu, P. iTRAQ-based identification of differentially expressed proteins related to growth in the swimming crab, Portunus trituberculatus. Aquac. Res. 2016, 1–11. [Google Scholar] [CrossRef]
- Xu, D.X.; Sun, L.N.; Liu, S.L.; Zhang, L.B.; Yang, H.S. Understanding the Heat Shock Response in the Sea Cucumber Apostichopus japonicus, Using iTRAQ-Based Proteomics. Int. J. Mol. Sci. 2016, 17, 150. [Google Scholar] [CrossRef] [PubMed]
- Miranda, D.V.; Portilla, M.D.; Escárate, C.G. Characterization of the growth-related transcriptome in California red abalone (Haliotis rufescens) through RNA-Seq analysis. Mar. Genom. 2015, 24, 199–202. [Google Scholar] [CrossRef] [PubMed]
- Choi, M.J.; Kim, G.D.; Kim, J.M.; Lim, H.K. Differentially-Expressed Genes Associated with Faster Growth of the Pacific Abalone, Haliotis discus hannai. Int. J. Mol. Sci. 2015, 16, 27520–27534. [Google Scholar] [CrossRef] [PubMed]
- Hevrøy, E.M.; Jordal, A.E.O.; Hordvik, I.; Espe, M.; Hemre, G.I.; Olsvik, P.A. Myosin heavy chain mRNA expression correlates higher with muscle protein accretion than growth in Atlantic salmon, Salmo salar. Aquaculture 2006, 252, 453–461. [Google Scholar] [CrossRef]
- Gauvry, L.; Fauconneau, B. Cloning of a trout fast skeletal myosin heavy chain expressed both in embryo and adult muscles and in myotubes neoformed in vitro. Comp. Biochem. Physiol. 1996, 115, 183–190. [Google Scholar] [CrossRef]
- Young, R.B.; Hsieh, M.Y.; Hudson, J.R., Jr.; Richter, H.E.; Scott, M. Expression pattern and partial sequence analysis of a fetal bovine myosin heavy chain gene. J. Anim. Sci. 1994, 72, 903–910. [Google Scholar] [CrossRef] [PubMed]
- Chen, Z.; Dong, J.J.; Sun, C.F.; Tian, Y.Y.; Ye, X. cDNA Cloning and Analyses of Two Myosin Heavy Chain Isoforms of Mandarin Fish (Siniperca chuatsi) Based on Transcriptome Sequencing. Prog. Fish. Sci. 2017, 38, 51–61. [Google Scholar] [CrossRef]
- Chen, T.L.; Kowalczyk, P.A.; Ho, G.; Chisholm, R.L. Targeted disruption of the Dictyostelium myosin essential light chain gene produces cells defective in cytokinesis and morphogenesis. J. Cell Sci. 1995, 108, 3207–3218. [Google Scholar] [PubMed]
- Greenfield, N.J.; Montelione, G.T.; Farid, R.S.; Hitchcock-DeGregori, S.E. The structure of the N-terminus of striated muscle α-tropomyosin in a chimeric peptide: Nuclear magnetic resonance structure and circular dichroism studies. Biochemistry 1998, 37, 7834–7843. [Google Scholar] [CrossRef] [PubMed]
- Kabsch, W.; Vandekerckhove, J. Stucture and function of actin. Ann. Rev. Biophys. 1992, 21, 49–76. [Google Scholar]
- Patwary, M.U.; Reith, M.; Kenchington, E.L. Isolation and charcterization of a cDNA encoding an actin gene from sea scallop (Placopecten magellanicus). J. Shellfish Res. 1996, 15, 265–270. [Google Scholar]
- Pollard, T.D.; Cooper, J.A. Actin, a Central Player in Cell Shape and Movement. Science 2009, 326, 1208–1212. [Google Scholar] [CrossRef] [PubMed]
- DesGroseillers, L.; Auclair, D.; Wickham, L. Nucleotide sequence of an actin cDNA gene from Aplysia californica. Nucleic Acids Res. 1990, 18, 3654. [Google Scholar] [CrossRef] [PubMed]
- DesGroseillers, L.; Auclair, D.; Wickham, L.; Maalouf, M. A novel actin cDNA is expressed in the neurons of Aplysia californica. Biochim. Biophys. Acta 1994, 1217, 322–324. [Google Scholar] [CrossRef]
- Miyamoto, H.; Hamaguchi, M.; Okoshi, K. Analysis of genes expressed in the mantle of oyster Crassostreagigas. Fish Sci. 2002, 68, 651–658. [Google Scholar] [CrossRef]
- VanLoon, A.E.; Goedemans, H.J.; Daemen, A.J.J.M.; van de Kamp, A.J.; van den Biggelaar, J.A.M. Actin genes expressed during early development of Patella vulgata. Rouxs Arch. Dev. Biol. 1993, 202, 77–84. [Google Scholar] [CrossRef]
- Bryant, M.J.; Flint, H.J.; Sin, F.Y.T. Isolation, Characterization, and Expression Analysis of Three Actin Genes in the New Zealand Black-Footed Abalone, Haliotis iris. Mar. Biotechnol. 2006, 8, 110–119. [Google Scholar] [CrossRef] [PubMed]
- Gunning, P.W.; Ghoshdastider, U.; Whitaker, S.; Popp, D.; Robinson, R.C. The evolution of compositionally and functionally distinct actin filaments. J. Cell Sci. 2015, 128, 2009–2019. [Google Scholar] [CrossRef] [PubMed]
- Xu, J.T.; Zhang, Y.Z. Progress in Profilin. Chin. J. Cell Biol. 2007, 29, 325–330. [Google Scholar]
- Pernier, J.; Shekhar, S.; Jegou, A.; Guichard, B.; Carlier, M.F. Profilin Interaction with Actin Filament Barbed End Controls Dynamic Instability, Capping, Branching, and Motility. Dev. Cell 2016, 36, 201–214. [Google Scholar] [CrossRef] [PubMed]
- Suarez, C.; Carroll, R.T.; Burke, T.A.; Christensen, J.R.; Bestul, A.J.; Sees, J.A.; James, M.L.; Sirotkin, V.; Kovar, D.R. Profilin Regulates F-Actin Network Homeostasis by Favoring Formin over Arp2/3 Complex. Dev. Cell 2015, 32, 43–53. [Google Scholar] [CrossRef] [PubMed]
- Rotty, J.D.; Wu, C.; Haynes, E.M.; Suarez, C.; Winkelman, J.D.; Johnson, H.E.; Haugh, J.M.; Kovar, D.R.; Bear, J.E. Profilin-1 Serves as a Gatekeeper for Actin Assembly by Arp2/3-Dependent and Independent Pathways. Dev. Cell 2015, 32, 54–67. [Google Scholar] [CrossRef] [PubMed]
- Sohn, R.H.; Clermont, P.J. Profilin: At the crossroads of signal transduction and the actin cytoskeleton. BioEssays 1994, 16, 465–472. [Google Scholar] [CrossRef] [PubMed]
- Martin, R.M.; Gasser, R.B.; Jones, M.K.; Lightowlers, M.W. Identification and characterization of myophilin, a muscle-specific antigen of Echinococcus granulosus. Mol. Biochem. Parasitol. 1995, 70, 139–148. [Google Scholar] [CrossRef]
- Martin, R.M.; Colebrook, A.L.; Gasser, R.B.; Lightowlers, M.W. Antibody responses of patients with cystic hydatid disease to recombinant myophilin of Echinococcus granulosus. Acta Trop. 1996, 61, 307–314. [Google Scholar] [CrossRef]
- Peng, H.L.; Song, K.; Huang, C.Y.; Ye, S.; Song, H.G.; Hu, W.; Han, Z.G.; McManus, D.P.; Zhao, G.P.; Zhang, Q.H. Expression, immunolocalization and serodiagnostic value of a myophilin-like protein from Schistosoma japonicum. Exp. Parasitol. 2008, 119, 117–124. [Google Scholar] [CrossRef] [PubMed]
- Sloane, B.F. Cathepsin B and cystatins: Evidence for a role in cancer progression. Semin. Cancer Biol. 1990, 1, 137–152. [Google Scholar] [PubMed]
- Tong, B.; Wan, B.; Wei, Z.; Wang, T.; Zhao, P.; Dou, Y.; Lv, Z.; Xia, Y.; Dai, Y. Role of cathepsin B in regulating migration and invasion of fibroblast-like synoviocytes into inflamed tissue from patients with rheumatoid arthritis. Clin. Exp. Immunol. 2014, 177, 586–597. [Google Scholar] [CrossRef] [PubMed]
- Ha, S.D.; Ham, B.; Mogridge, J.; Saftig, P.; Lin, S.; Kim, S.O. Cathepsin B-mediated autophagy flux facilitates the anthrax toxin receptor 2-mediated delivery of anthrax lethal factor into the cytoplasm. J. Biol. Chem. 2010, 285, 2120–2129. [Google Scholar] [CrossRef] [PubMed]
- Yang, W.E.; Ho, C.C.; Yang, S.F.; Lin, S.H.; Yeh, K.T.; Lin, C.W.; Chen, M.K. Cathepsin B Expression and the Correlation with Clinical Aspects of Oral Squamous Cell Carcinoma. PLoS ONE 2016, 11. [Google Scholar] [CrossRef] [PubMed]
- Vivar, C.; Potter, M.C.; van Praag, H. All about running: Synaptic plasticity, growth factors and adult hippocampal neurogenesis. Curr. Top. Behav. Neurosci. 2012, 15, 189–210. [Google Scholar] [CrossRef]
- Houseweart, M.K.; Pennacchio, L.A.; Vilaythong, A.; Peters, C.; Noebels, J.L.; Myers, R.M. Cathepsin B but not cathepsins L or S contributes to the pathogenesis of Unverricht-Lundborg progressive myoclonus epilepsy (EPM1). J. Neurobiol. 2003, 56, 315–327. [Google Scholar] [CrossRef] [PubMed]
- Kominami, E.; Ishido, K.; Muno, D.; Sato, N. The primary structure and tissue distribution of cathepsin C. Biol. Chem. 1992, 373, 367–373. [Google Scholar] [CrossRef]
- Dolenc, I.; Turk, B.; Pungerc, G.; Ritonja, A.; Turk, V. Oligomeric structure and substrate induced inhibition of human cathepsin C. J. Biol. Chem. 1995, 270, 21626–21631. [Google Scholar] [CrossRef] [PubMed]
- Muno, D.; Ishidoh, K.; Ueno, T.; Kominami, E. Processing and transport of the precursor of cathepsin C during its transfer into lysosomes. Arch. Biochem. Biophys. 1993, 306, 103–110. [Google Scholar] [CrossRef] [PubMed]
- Wolters, P.J.; Raymond, W.W.; Blount, J.L.; Caughey, G.H. Regulated expression, processing, and secretion of dog mast cell dipeptidyl peptidase I. J. Biol. Chem. 1998, 273, 15514–15520. [Google Scholar] [CrossRef] [PubMed]
- Martínez, D.S.; Krzywinska, E.; Rathore, M.G.; Saumet, A.; Cornillon, A.; Lopez-Royuela, N.; Martínez-Lostao, L.; Ramirez-Labrada, A.; Lu, Z.Y.; Rossi, J.F.; et al. All-trans retinoic acid (ATRA) induces miR-23a expression, decreases CTSC expression and granzyme B activity leading to impaired NK cell cytotoxicity. Int. J. Biochem. Cell Biol. 2014, 49, 42–52. [Google Scholar] [CrossRef] [PubMed]
- Livak, K.J.; Schmittgen, T.D. Analysis of relative gene expression data using real-time quantitative PCR and the 2−∆∆Ct method. Methods 2001, 25, 402–428. [Google Scholar] [CrossRef] [PubMed]
Figure 1.
Hierarchical clustering analysis of the two size classes of abalone analyzed, showing the proteins differentially expressed between small and large specimens of Haliotis discus hannai. Red and blue colored bars indicate up- and down-regulation, respectively.
Figure 1.
Hierarchical clustering analysis of the two size classes of abalone analyzed, showing the proteins differentially expressed between small and large specimens of Haliotis discus hannai. Red and blue colored bars indicate up- and down-regulation, respectively.
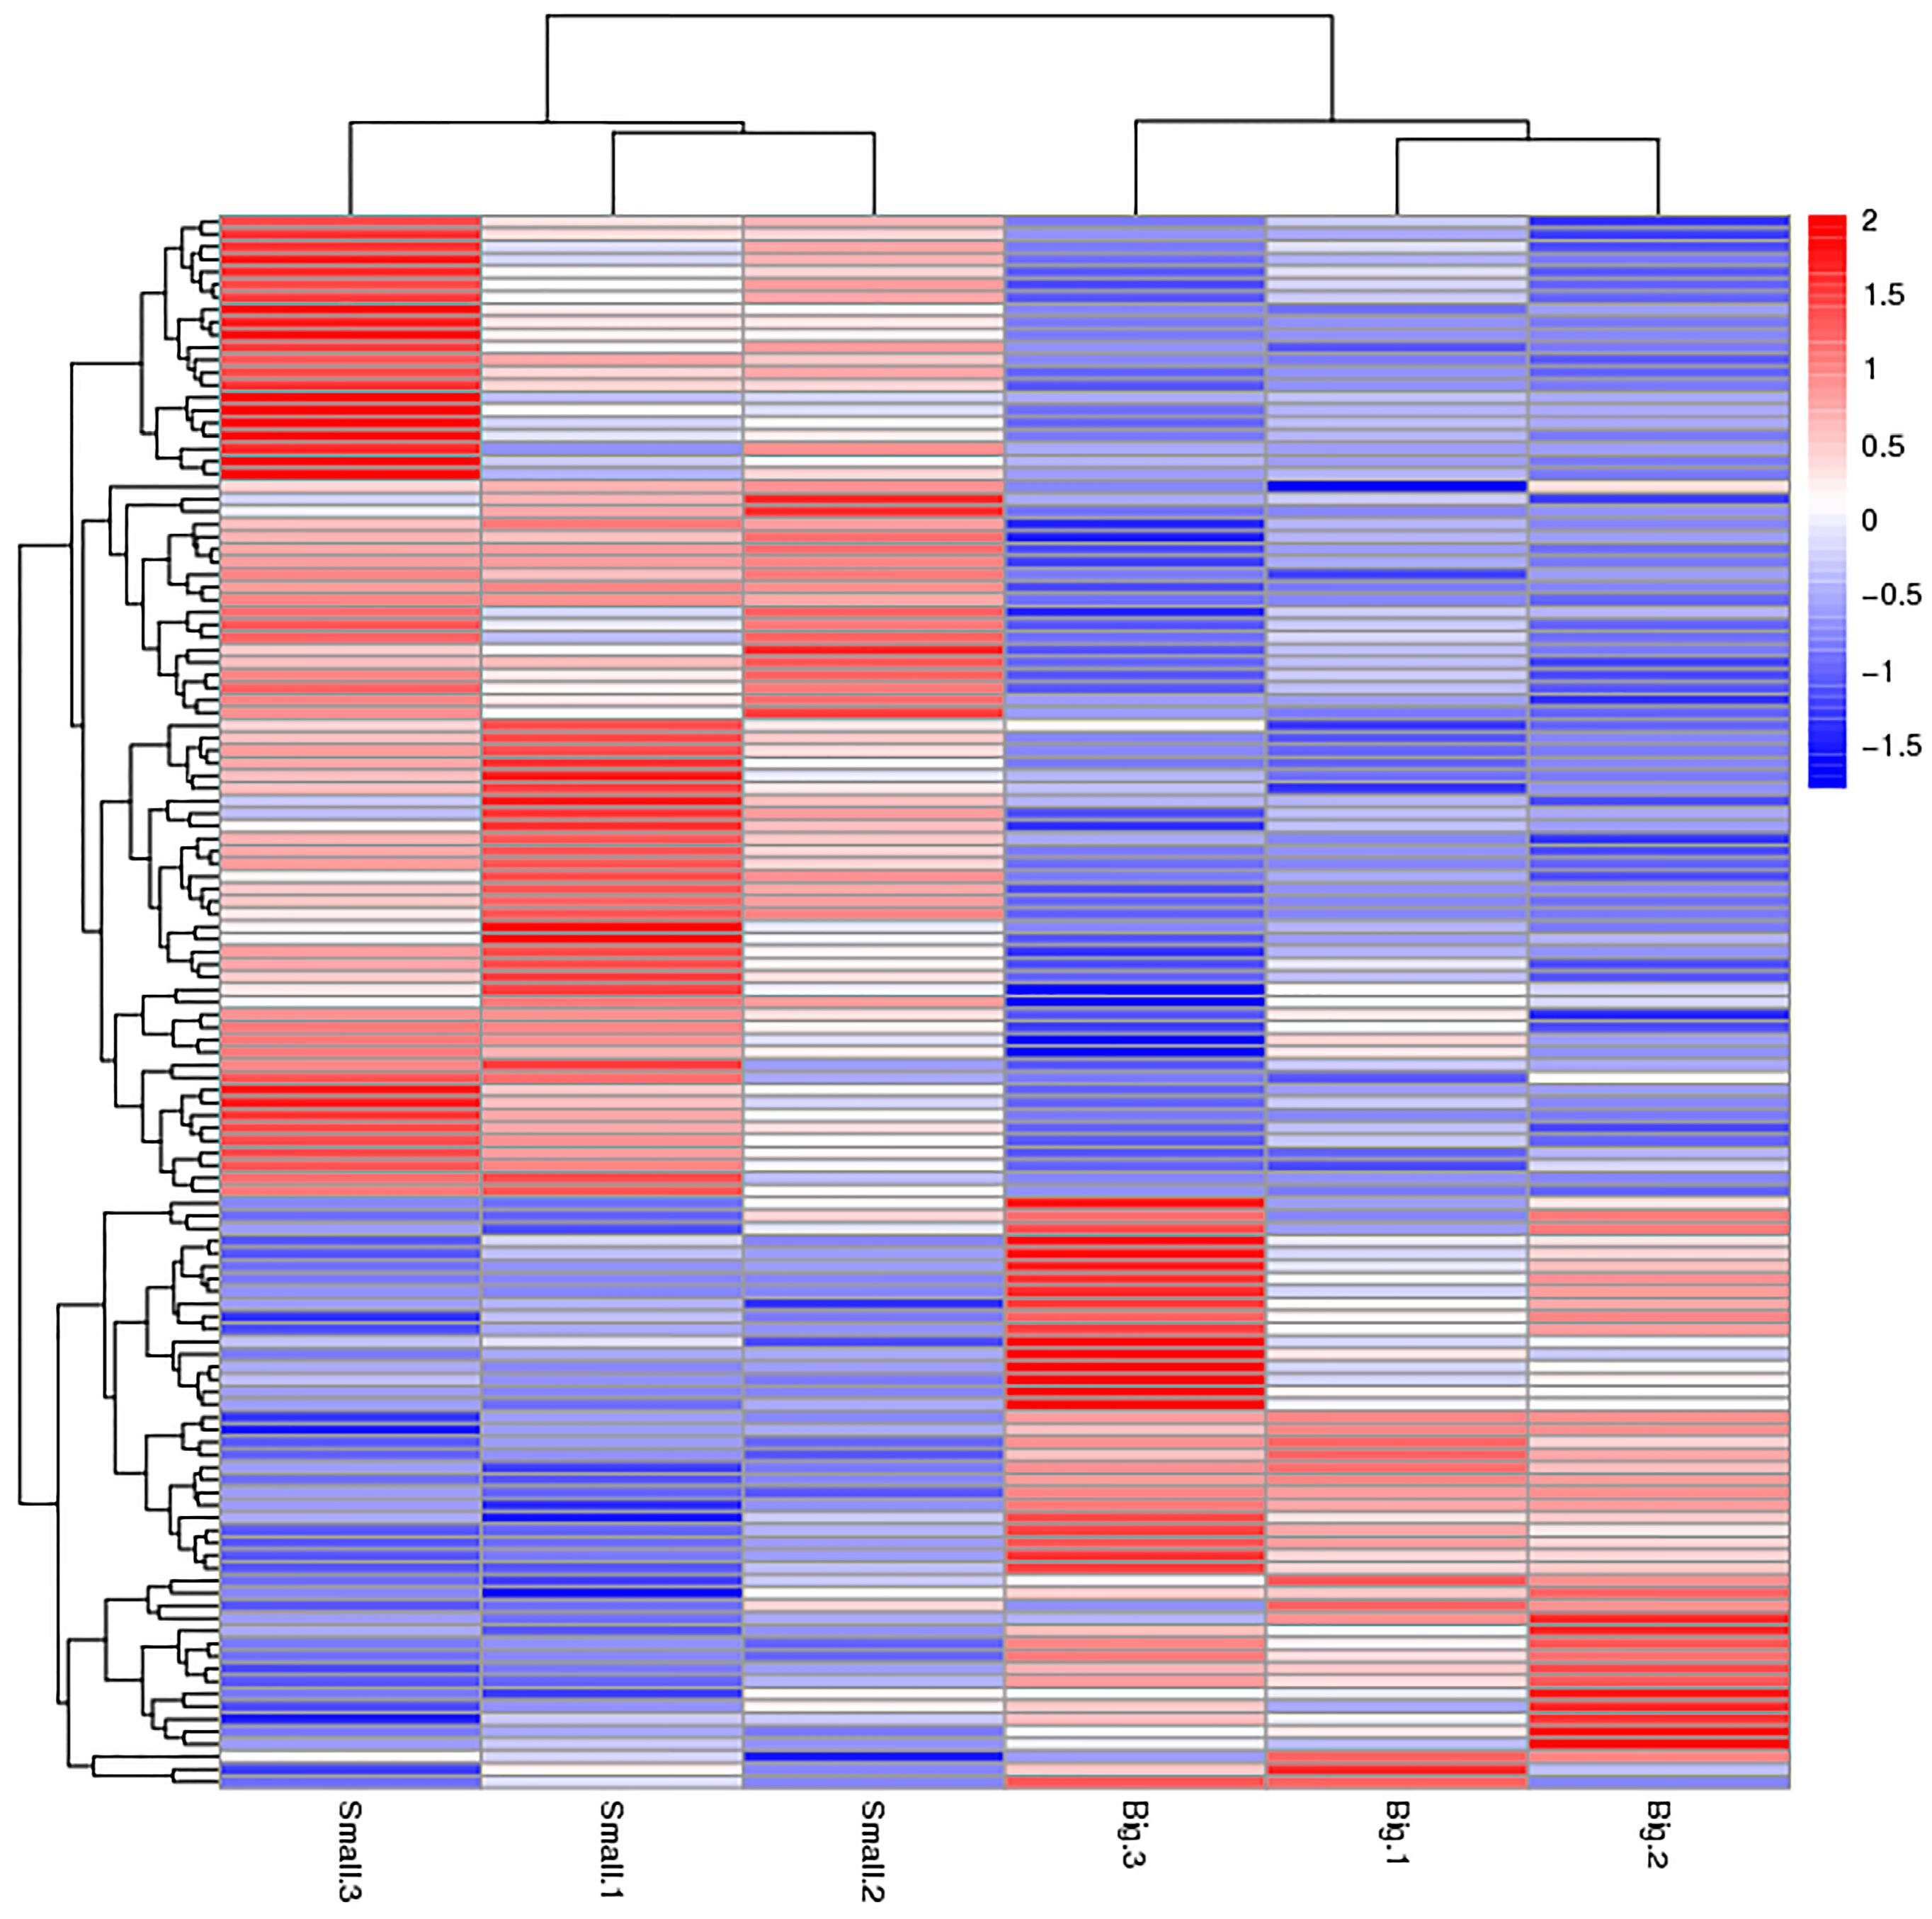
Figure 2.
Volcano plot showing proteins differentially expressed between the two groups of abalone (larger and smaller). The upregulated and downregulated proteins (p < 0.05 for both) are shown in red and green, respectively. Black represents no significant change in expression level.
Figure 2.
Volcano plot showing proteins differentially expressed between the two groups of abalone (larger and smaller). The upregulated and downregulated proteins (p < 0.05 for both) are shown in red and green, respectively. Black represents no significant change in expression level.

Figure 3.
The Gene Ontology (GO) classifications assigned to the significant differentially expressed proteins in the abalone H. discus hannai. BP, biological processes; CC, cellular components; MF, molecular functions.
Figure 3.
The Gene Ontology (GO) classifications assigned to the significant differentially expressed proteins in the abalone H. discus hannai. BP, biological processes; CC, cellular components; MF, molecular functions.

Figure 4.
Quantitative real-time polymerase chain reaction (QRT-PCR) analysis comparing relative gene expression among MYH, myophilin, SLC2A3, CTSC, profilin, and EGFR in large and small specimens of H. discus hannai. Gene expression was normalized to 18S rRNA. The data are expressed as means ± SD (n = 3). Large specimens, grey bars; small specimens, white bars. Asterisks represent statistically significant differences. * and ** indicate p < 0.05 and p < 0.01, respectively.

Figure 5.
QRT-PCR analysis indicating the relative gene expression of (A) MYH, (B) myophilin, (C) CTSC, and (D) profilin across various tissues of the of H. discus hannai. Gene expression levels were normalized to 18S rRNA. Data are expressed as the means ± SD of at three biological replicates. Different letters represent statistically significant differences. Lowercase and capital letters indicate p < 0.05 and p < 0.01, respectively.

Table 1.
Overview of the proteomics sequencing results.
| Group Name | Total Spectra | Spectra | Ratio Identified | Peptides | Proteins |
|---|---|---|---|---|---|
| All | 425,477 | 44,436 | 10.40% | 10,097 | 1904 |
Table 2.
Proteins differentially expressed in the large specimens of H. discus hannai, as compared to the small specimens in various significant Kyoto Encyclopedia of Genes and Genomes (KEGG) pathways.
Table 2.
Proteins differentially expressed in the large specimens of H. discus hannai, as compared to the small specimens in various significant Kyoto Encyclopedia of Genes and Genomes (KEGG) pathways.
| KEGG Pathway | Upregulated Proteins | Downregulated Proteins |
|---|---|---|
| Lysosome | putative inorganic phosphate cotransporter (Picot; Accession Number: O61369), actin (Accession Number: Q93129) | ganglioside GM2 activator (GM2A; Accession Number: Q8HXX6), cathepsin C (CTSC; Accession Number: A0A023PJH7), cathepsin B (CTSB; Accession Number: A1E295), palmitoyl-protein thioesterase 1 (PPT1; Accession Number: Q8HXW6), N-acetylglucosamine-6-sulfatase (GNS; Accession Number: Q8BFR4), α-N-acetylgalactosaminidase (Accession Number: Q90744) |
| Adherens junction | actin A1 (Accession Number: Q5BQE5), actin-2 (Accession Number: P26197), actin | kitasatospora griseola strain MF730-N6 RKJC_4 (Accession Number: A0A0D0PVQ3), β actin (ACTB; Accession Number: G8HY07), epidermal growth factor receptor (EGFR; Accession Number: P0CY46), glycerophosphodiester phosphodiesterase domain-containing protein 1 (GDPD1; Accession Number: Q8N9F7) |
| Bladder cancer | - | thymidine phosphorylase (Tymp; Accession Number: Q5FVR2), EGFR, GDPD1 |
| Apoptosis | actin A1, actin-2, actin, myophilin (Accession Number: Q24799) | CTSC, GDPD1, CTSB |
| Thyroid hormone signaling pathway | actin A1, actin-2, actin, solute carrier family 2 facilitated glucose transporter member 3 (SLC2A3; Accession Number: P47843) | ACTB, GDPD1 |
| Endometrial cancer | - | kitasatospora griseola strain MF730-N6 RKJC_4, EGFR, GDPD1 |
| Shigellosis | actin A1, actin-2, actin | profilin (Accession Number: F4XXT7), ACTB, GDPD1 |
| Regulation of actin cytoskeleton | actin A1, actin-2, actin | profilin, ACTB, EGFR, GDPD1, phosphatidylinositol 5-phosphate 4-kinase type-2 β (PIP4K2B; Accession Number: P78356), myosin regulatory light chain sqh (Accession Number: P40423) |
| Salmonella infection | actin A1, actin-2, actin | profilin, ACTB, GDPD1 |
| Viral myocarditis | actin A1, actin-2, actin, myosin heavy chain (MYH; Accession Number: P24733), MYH II (Accession Number: O96700) | ACTB |
| Hippo signaling pathway-fly | actin A1, actin-2, actin, protocadherin Fat 4 (FAT4; Accession Number: Q6V0I7) | ACTB |
© 2017 by the authors. Licensee MDPI, Basel, Switzerland. This article is an open access article distributed under the terms and conditions of the Creative Commons Attribution (CC BY) license (http://creativecommons.org/licenses/by/4.0/).
Share and Cite
MDPI and ACS Style
Huang, J.; You, W.; Luo, X.; Ke, C. iTRAQ-Based Identification of Proteins Related to Muscle Growth in the Pacific Abalone, Haliotis discus hannai. Int. J. Mol. Sci. 2017, 18, 2237. https://doi.org/10.3390/ijms18112237
AMA Style
Huang J, You W, Luo X, Ke C. iTRAQ-Based Identification of Proteins Related to Muscle Growth in the Pacific Abalone, Haliotis discus hannai. International Journal of Molecular Sciences. 2017; 18(11):2237. https://doi.org/10.3390/ijms18112237
Chicago/Turabian StyleHuang, Jianfang, Weiwei You, Xuan Luo, and Caihuan Ke. 2017. "iTRAQ-Based Identification of Proteins Related to Muscle Growth in the Pacific Abalone, Haliotis discus hannai" International Journal of Molecular Sciences 18, no. 11: 2237. https://doi.org/10.3390/ijms18112237
Note that from the first issue of 2016, this journal uses article numbers instead of page numbers. See further details here.