Article

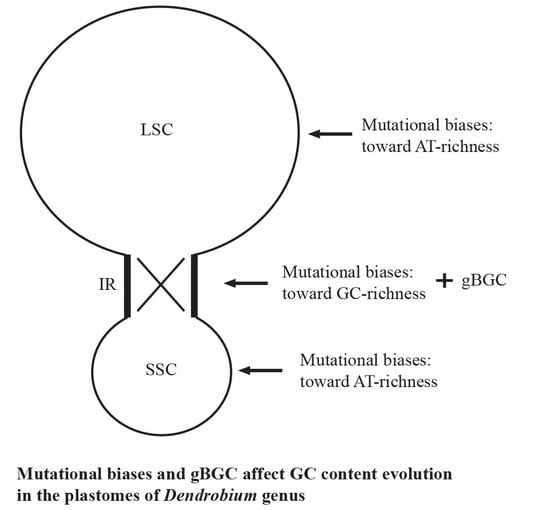
Mutational Biases and GC-Biased Gene Conversion Affect GC Content in the Plastomes of Dendrobium Genus

College of Life Sciences, Nanjing Normal University, Nanjing 210023, China
*
Author to whom correspondence should be addressed.
Int. J. Mol. Sci. 2017, 18(11), 2307; https://doi.org/10.3390/ijms18112307
Submission received: 29 August 2017 / Revised: 27 September 2017 / Accepted: 20 October 2017 / Published: 2 November 2017
(This article belongs to the Special Issue Chloroplast)

Abstract

:
The variation of GC content is a key genome feature because it is associated with fundamental elements of genome organization. However, the reason for this variation is still an open question. Different kinds of hypotheses have been proposed to explain the variation of GC content during genome evolution. However, these hypotheses have not been explicitly investigated in whole plastome sequences. Dendrobium is one of the largest genera in the orchid species. Evolutionary studies of the plastomic organization and base composition are limited in this genus. In this study, we obtained the high-quality plastome sequences of D. loddigesii and D. devonianum. The comparison results showed a nearly identical organization in Dendrobium plastomes, indicating that the plastomic organization is highly conserved in Dendrobium genus. Furthermore, the impact of three evolutionary forces—selection, mutational biases, and GC-biased gene conversion (gBGC)—on the variation of GC content in Dendrobium plastomes was evaluated. Our results revealed: (1) consistent GC content evolution trends and mutational biases in single-copy (SC) and inverted repeats (IRs) regions; and (2) that gBGC has influenced the plastome-wide GC content evolution. These results suggest that both mutational biases and gBGC affect GC content in the plastomes of Dendrobium genus.

Graphical Abstract

1. Introduction

Chloroplasts, responsible for photosynthesis and other biosynthesis processes in plants, have essential effects on plant growth and development. Their own genomes (plastomes) are usually uniparentally inherited and highly conserved in their quadripartite structure, which consists of a pair of inverted repeats (IRs) regions and two single-copy (SC) regions [1]. Comparative studies of the plastome sequence have revealed: (1) a relatively higher GC content in IR regions than that of SC regions and (2) varied GC content in different gene and non-coding loci e.g., [2,3]. The variation of GC content is a key genome feature because it is associated with fundamental elements of genome organization [4,5]. For instance, GC-rich regions exhibit higher gene density, more conserved mutation rates, and higher recombination rates, relative to GC-poor regions. Therefore, resolving the origin and causes of the variation in base composition has practical significance for a better understanding of the plastome organization.
Three major kinds of hypotheses have been proposed to explain the variation of GC content in genome evolution. The first hypothesis, “natural selection hypothesis”, has suggested that high GC content can be selected for by their thermal stability [4,6]. Natural selection also affects the probability of fixation of a mutation based on the mutation fitness advantage or disadvantage of the organism [7,8]. The second hypothesis, the so-called “mutational biases hypothesis”, is that the GC content is driven by the heterogeneous mutational biases along genomes [9]. The third hypothesis involves GC-biased gene conversion (gBGC), a process that takes place during meiotic recombination. The gBGC process prefers repairing DNA mismatches with GC bases and tends to increase the GC content of recombining DNA over evolutionary time [10,11]. This was recently confirmed by a broad range of genome comparison studies in eukaryotes and prokaryotes [12,13,14]. For example, in yeast genomes, gBGC occurred to repair the mismatches located at the extremities of the conversion regions [15]. The gBGC was also demonstrated to affect the GC content of third codon position and intron regions in grasses genomes [16]. Recently, Wu and Chaw, 2015 measured the gene conversion events of non-coding regions in cycads plastomes and reported the first case of plastome GC-biased gene conversion [17].
However, these hypotheses have not been explicitly investigated in whole plastome sequences. Orchids (Orchidaceae) are the largest family in the monocots, including about 25,000 species in 880 genera and five subfamilies [18]. Recent studies showed a diversified evolution of the plastome sequence among different orchid genera [19,20]. Moreover, orchids also present a peculiar plastomic structure: they exhibit variable IRs that caused the drastic reductions in small single-copy (SSC) regions (e.g., the expansion/contraction of IRs has led to the length of the SSC region in Vanilla being only about one-eighth of that in Goodyera) [20]. These features result in a variable GC content among different plastome sequences. However, there is still little known about the GC content evolution of the orchid plastome sequences.
Recently, plastome sequences have been made available for more than 20 orchid genera. However, in this study, we chose to focus on the Dendrobium genus because it is the only genus of orchids for which more than 30 plastome sequences have been sequenced [21,22]. Dendrobium is one of the largest genera in the orchid species. In China, there are about 80 Dendrobium species, some of which are well known for their high horticultural and medicinal value [23,24]. Although many plastome sequences have been published, the research of plastomic structure and base composition remains very limited in the Dendrobium species. In this study, we surveyed 10 plastomes of Dendrobium species, including two newly sequenced ones, and we addressed two key questions: (1) Is the plastome structure conserved among Dendrobium species or variable due to the expansion/contraction of IRs? (2) Which evolutionary forces—selection, mutational biases, or gBGC—have a significant impact on GC content in orchid plastomes?
To address the questions mentioned above, the complete plastome of two more Dendrobium species (D. loddigesii and D. devonianum) were sequenced and assembled by two different methods. The plastomic structures among Dendrobium plastomes were compared. Moreover, we evaluated the selection forces among the plastid protein-coding genes of 10 Dendrobium species. Meanwhile, biased mutations of protein-coding genes and non-coding regions were also measured on the basis of the estimated equilibrium GC content (GCeq). Our results suggest that both mutational biases and gBGC affect GC content in the plastomes of the Dendrobium genus.

2. Results

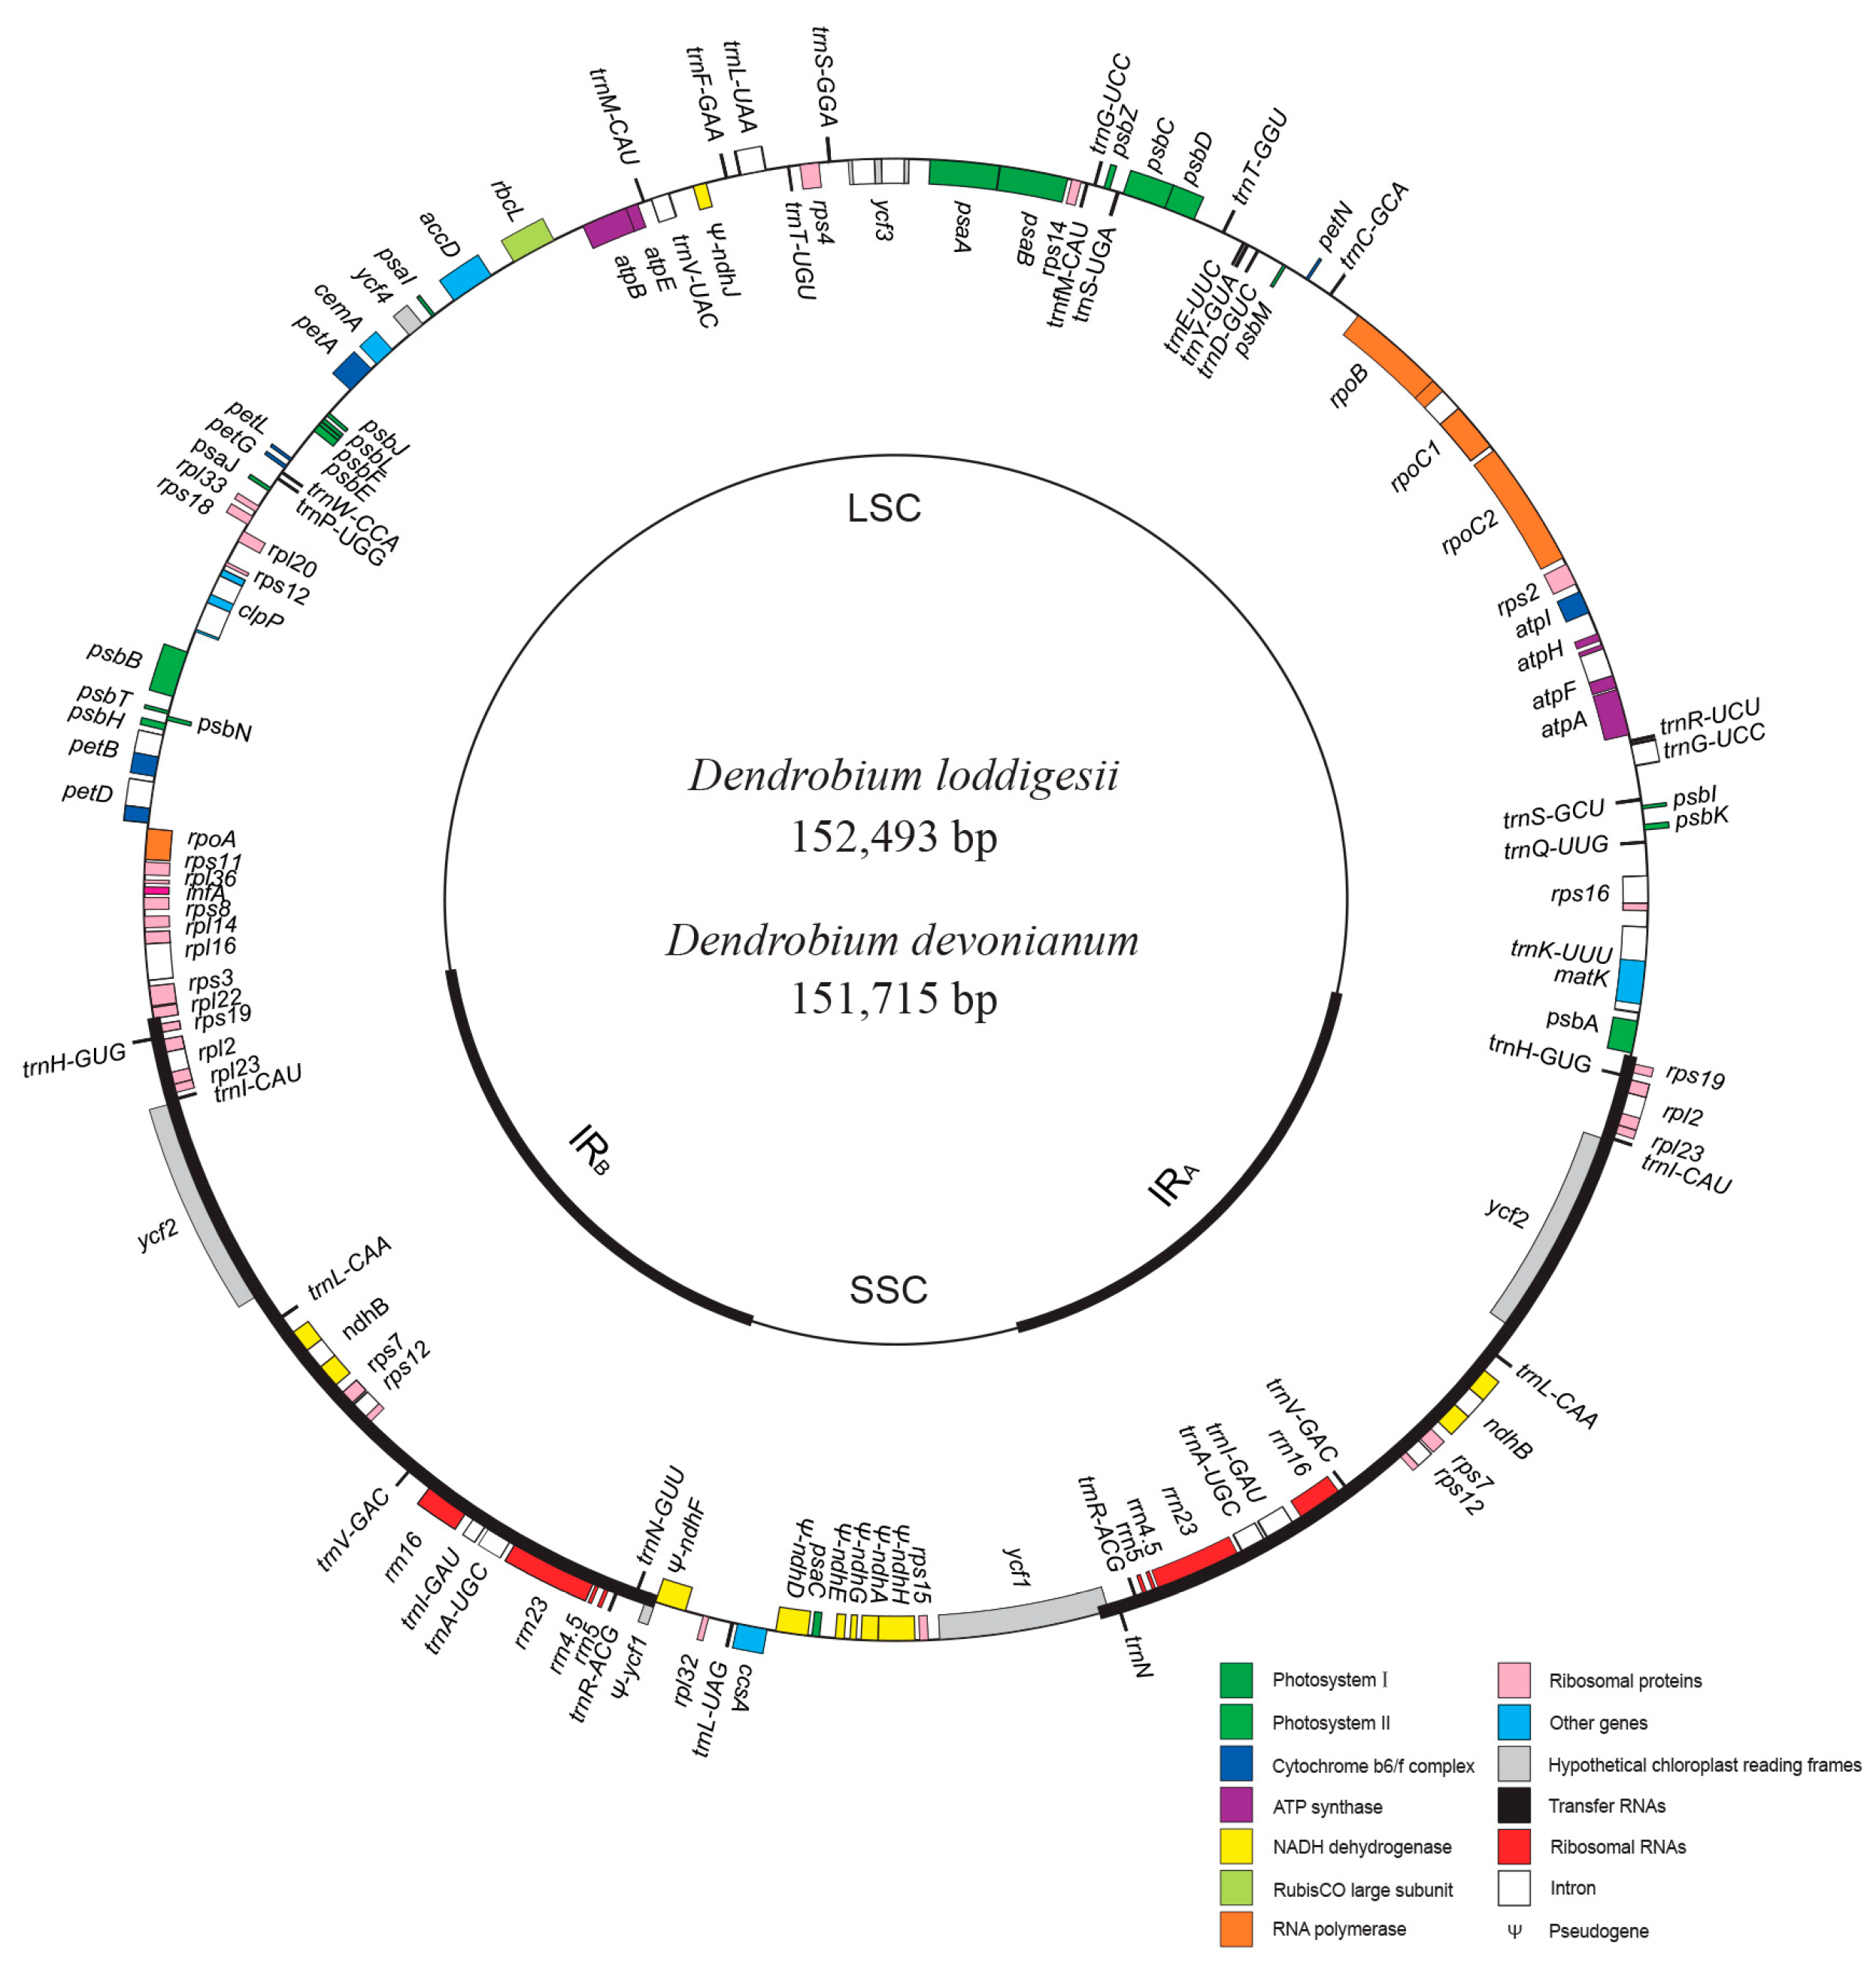
2.1. Plastome Assembly of D. loddigesii and D. devonianum

A total of approximately 3.84 Gb of 150 bp pair-end reads each for D. loddigesii and D. devonianum was obtained from the Illumina paired-end sequencing. Reads with error probability >0.05 were discarded. After that, the plastomes of D. loddigesii and D. devonianum were assembled by two different ways: (1) de novo assembly by using SOAPdenovo version 1.12 and (2) using the reference-guided mapping method with CLC Genomics Workbench 6.0.1. For the de novo assembly analysis, 43,509 contigs of D. loddigesii and 32,667 contigs of D. devonianum were included in the initial assembly. After comparison with plant plastomes, 88 contigs and 67 contigs were obtained with E-values <10−10 and average coverage depth >30× for D. loddigesii and D. devonianum, respectively. Six of these contigs (length >17 kb and coverage depth >117×) resulted in a nearly complete draft genome for D. loddigesii. Four contigs (length >25 kb and coverage depth >172×) were employed for the plastome assembly of D. devonianum. After assembly and gap closure, the plastome sequences of D. loddigesii and D. devonianum were 152,874 bp and 152,215 bp in length, respectively. For the reference-guided mapping analysis, the trimmed reads were mapped to the plastome sequence of D. moniliforme (AB893950), which served as a reference sequence. After gap closure, we obtained the plastome sequences of D. loddigesii and D. devonianum with 149,674 bp and 150,973 bp in length, respectively.
The assembled plastomes of D. loddigesii and D. devonianum were compared and plotted using mVISTA, with D. moniliforme as the reference (Figure S1). The comparison results showed that the differences—including single nucleotide polymorphism (SNP), insertion-deletion (InDel), and sequence repeat—between the plastomes were mainly distributed in the non-coding regions and ndh pseudo genes. Each type of these errors was corrected and validated by PCR amplification and Sanger sequencing. After that, the complete plastomes of D. loddigesii and D. devonianum were obtained with 152,498 bp and 151,715 bp respectively.

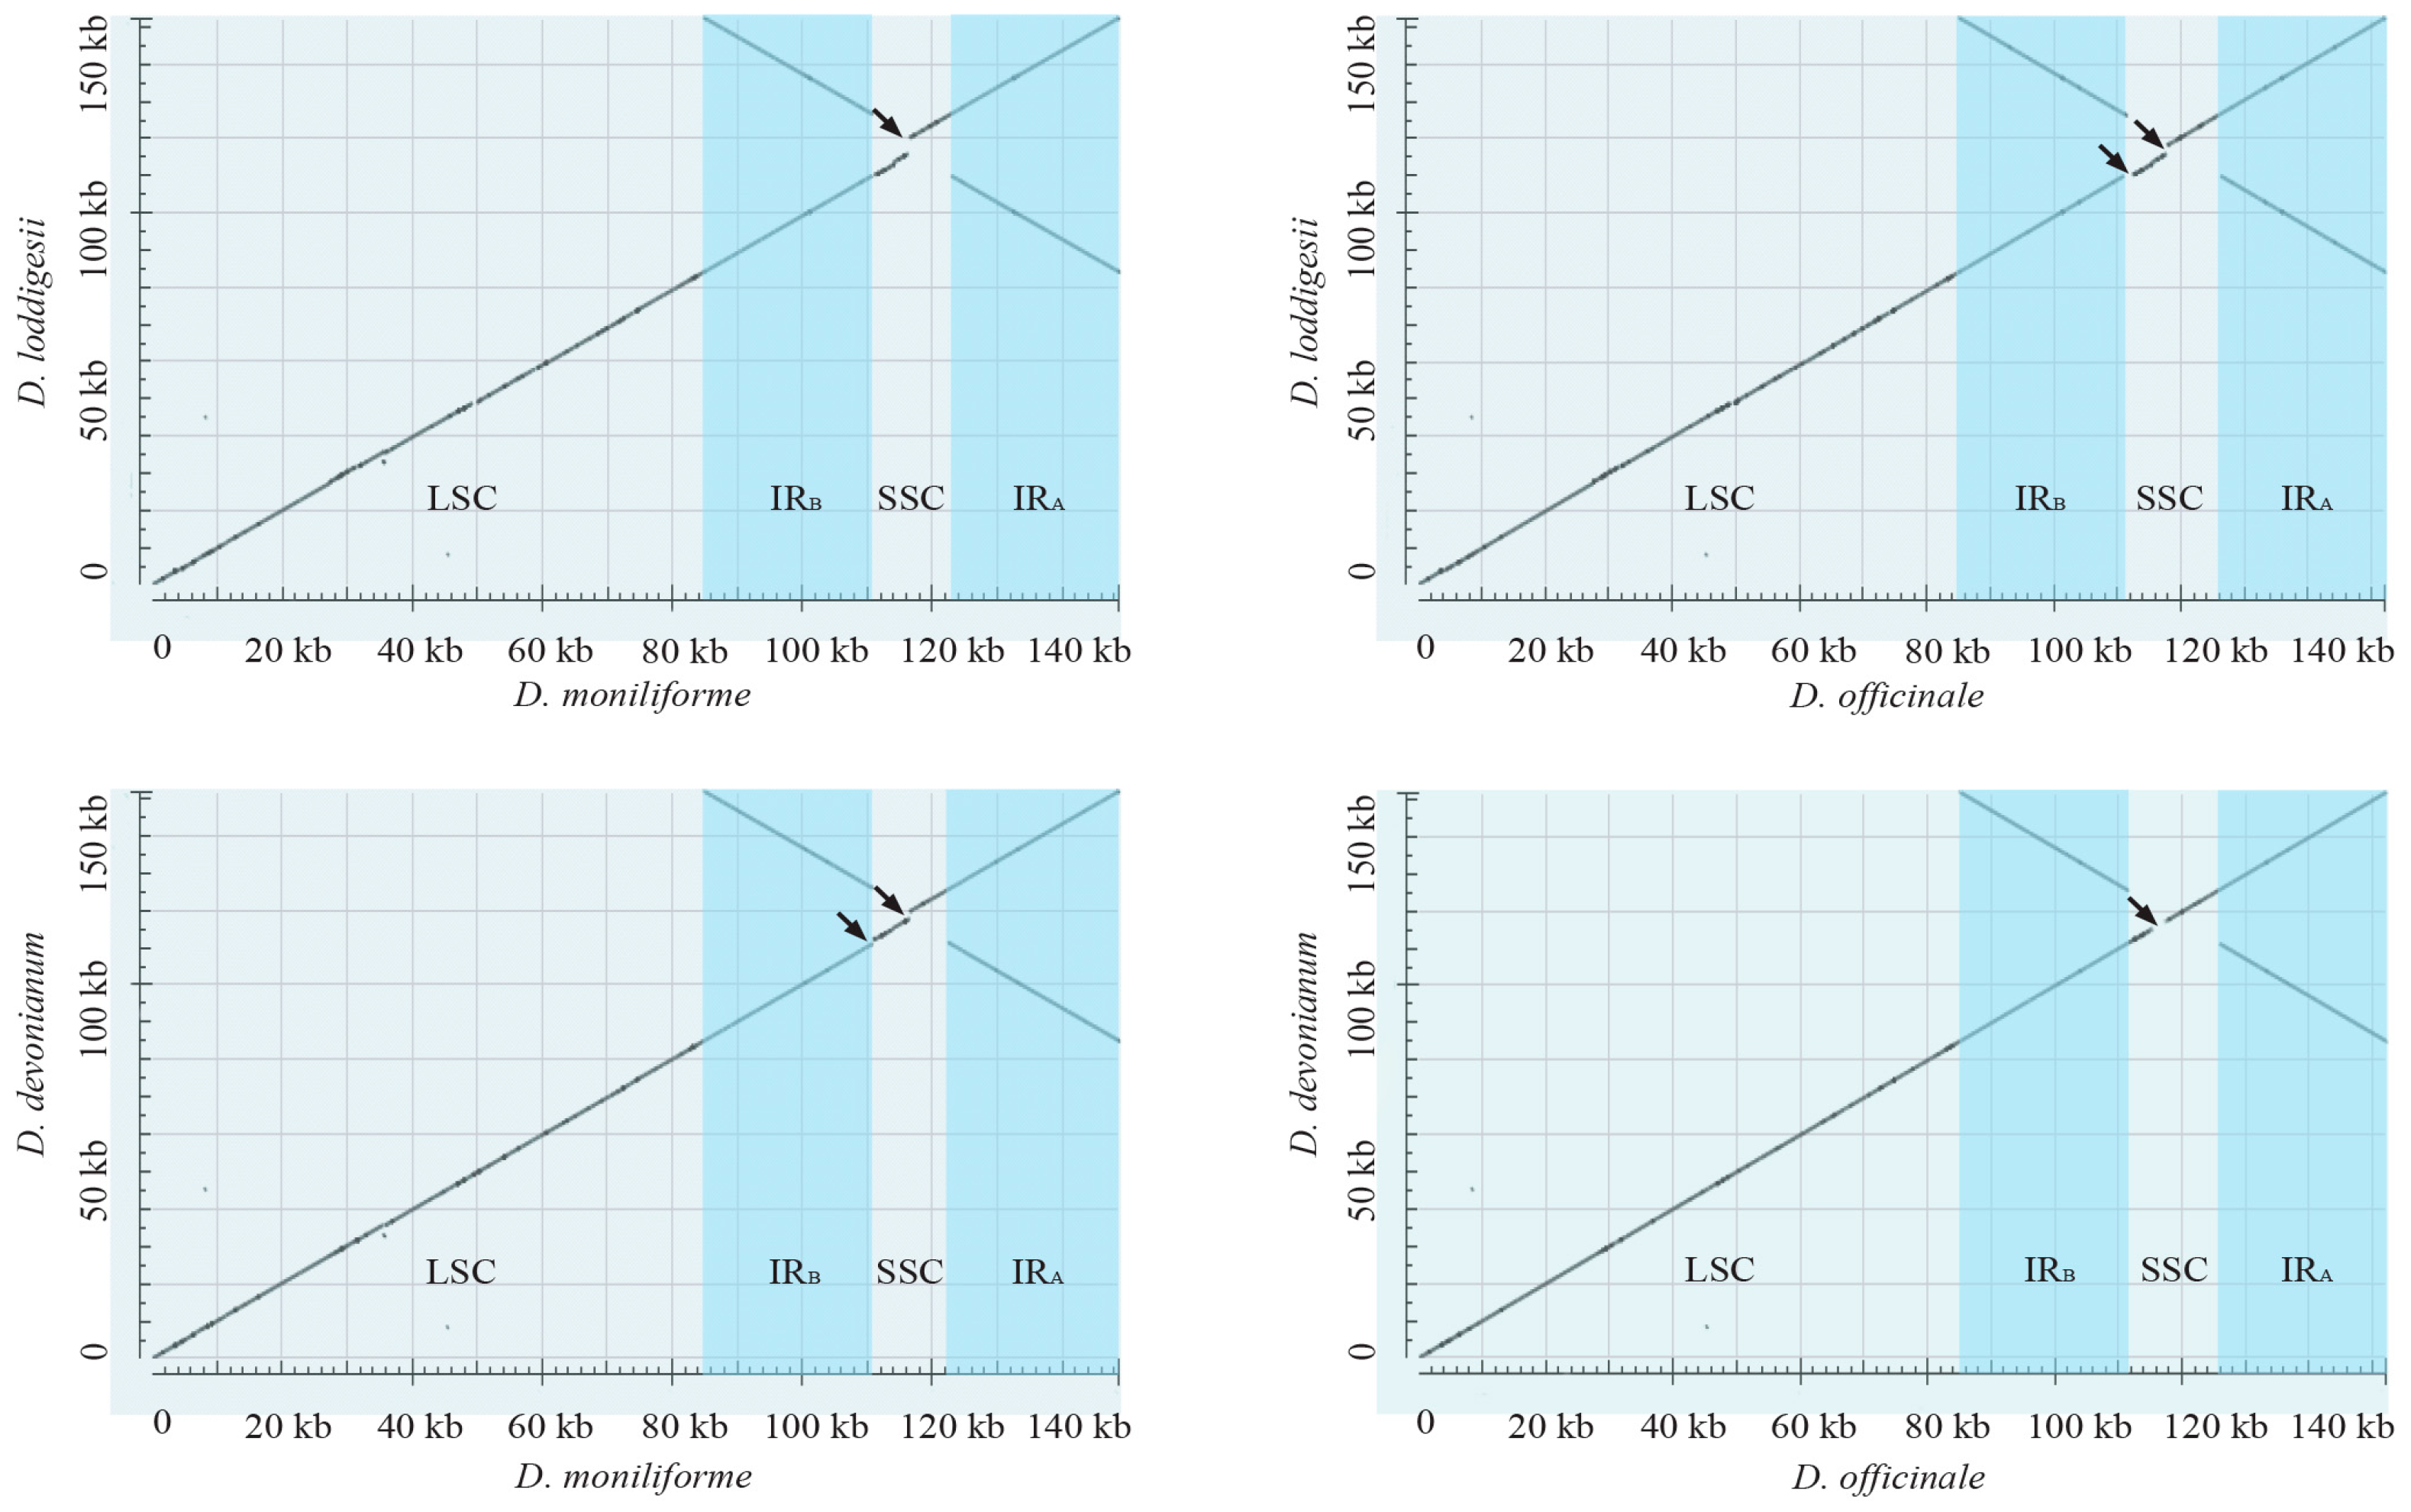
2.2. Highly Conserved Plastomic Structure and Organization in Dendrobium Genus

Genome maps of the newly sequenced two Dendrobium plastomes, including D. loddigesii and D. devonianum, were circular, as shown in Figure 1. The plastome contained a pair of inverted repeat (IR) regions, which separated the single-copy (SC) region into large SC (LSC) and small SC (SSC) regions. The LSC, SSC, and IR regions of D. loddigesii and D. devonianum ranged from 84,089 to 84,897 bp, 14,311 to 16,932 bp, and 25,736 to 25,800 bp, respectively. The overall GC content (37.38–37.56%) was similar with other Dendrobium plastomes [20,22], with 35.12–35.36% and 30.54–30.61% in LSC and SSC regions, respectively, and a higher content of 43.51–43.57% in the IR regions (Table 1). The two Dendrobium plastomes contained 102 unique functional coding genes, including 30 tRNA genes, four rRNA genes, and 68 protein-coding genes.
The plastome sequences of D. loddigesii, D. devonianum, D. officinale, and D. moniliforme were used for the plastome comparison (Figure 2). Comparative plastomes of these four Dendrobium species revealed distinct loss or retention of ndh genes, which indicated that the ndh genes have experienced independent loss during their evolution. Compared to the variable expansion/contraction of IRs in different orchid genera, e.g., [20,21], the IRs of plastomes in the Dendrobium genus were conserved. Overall, these Dendrobium plastomes appeared to have a nearly identical organization reflecting the highly conserved plastomic organization in the Dendrobium genus.

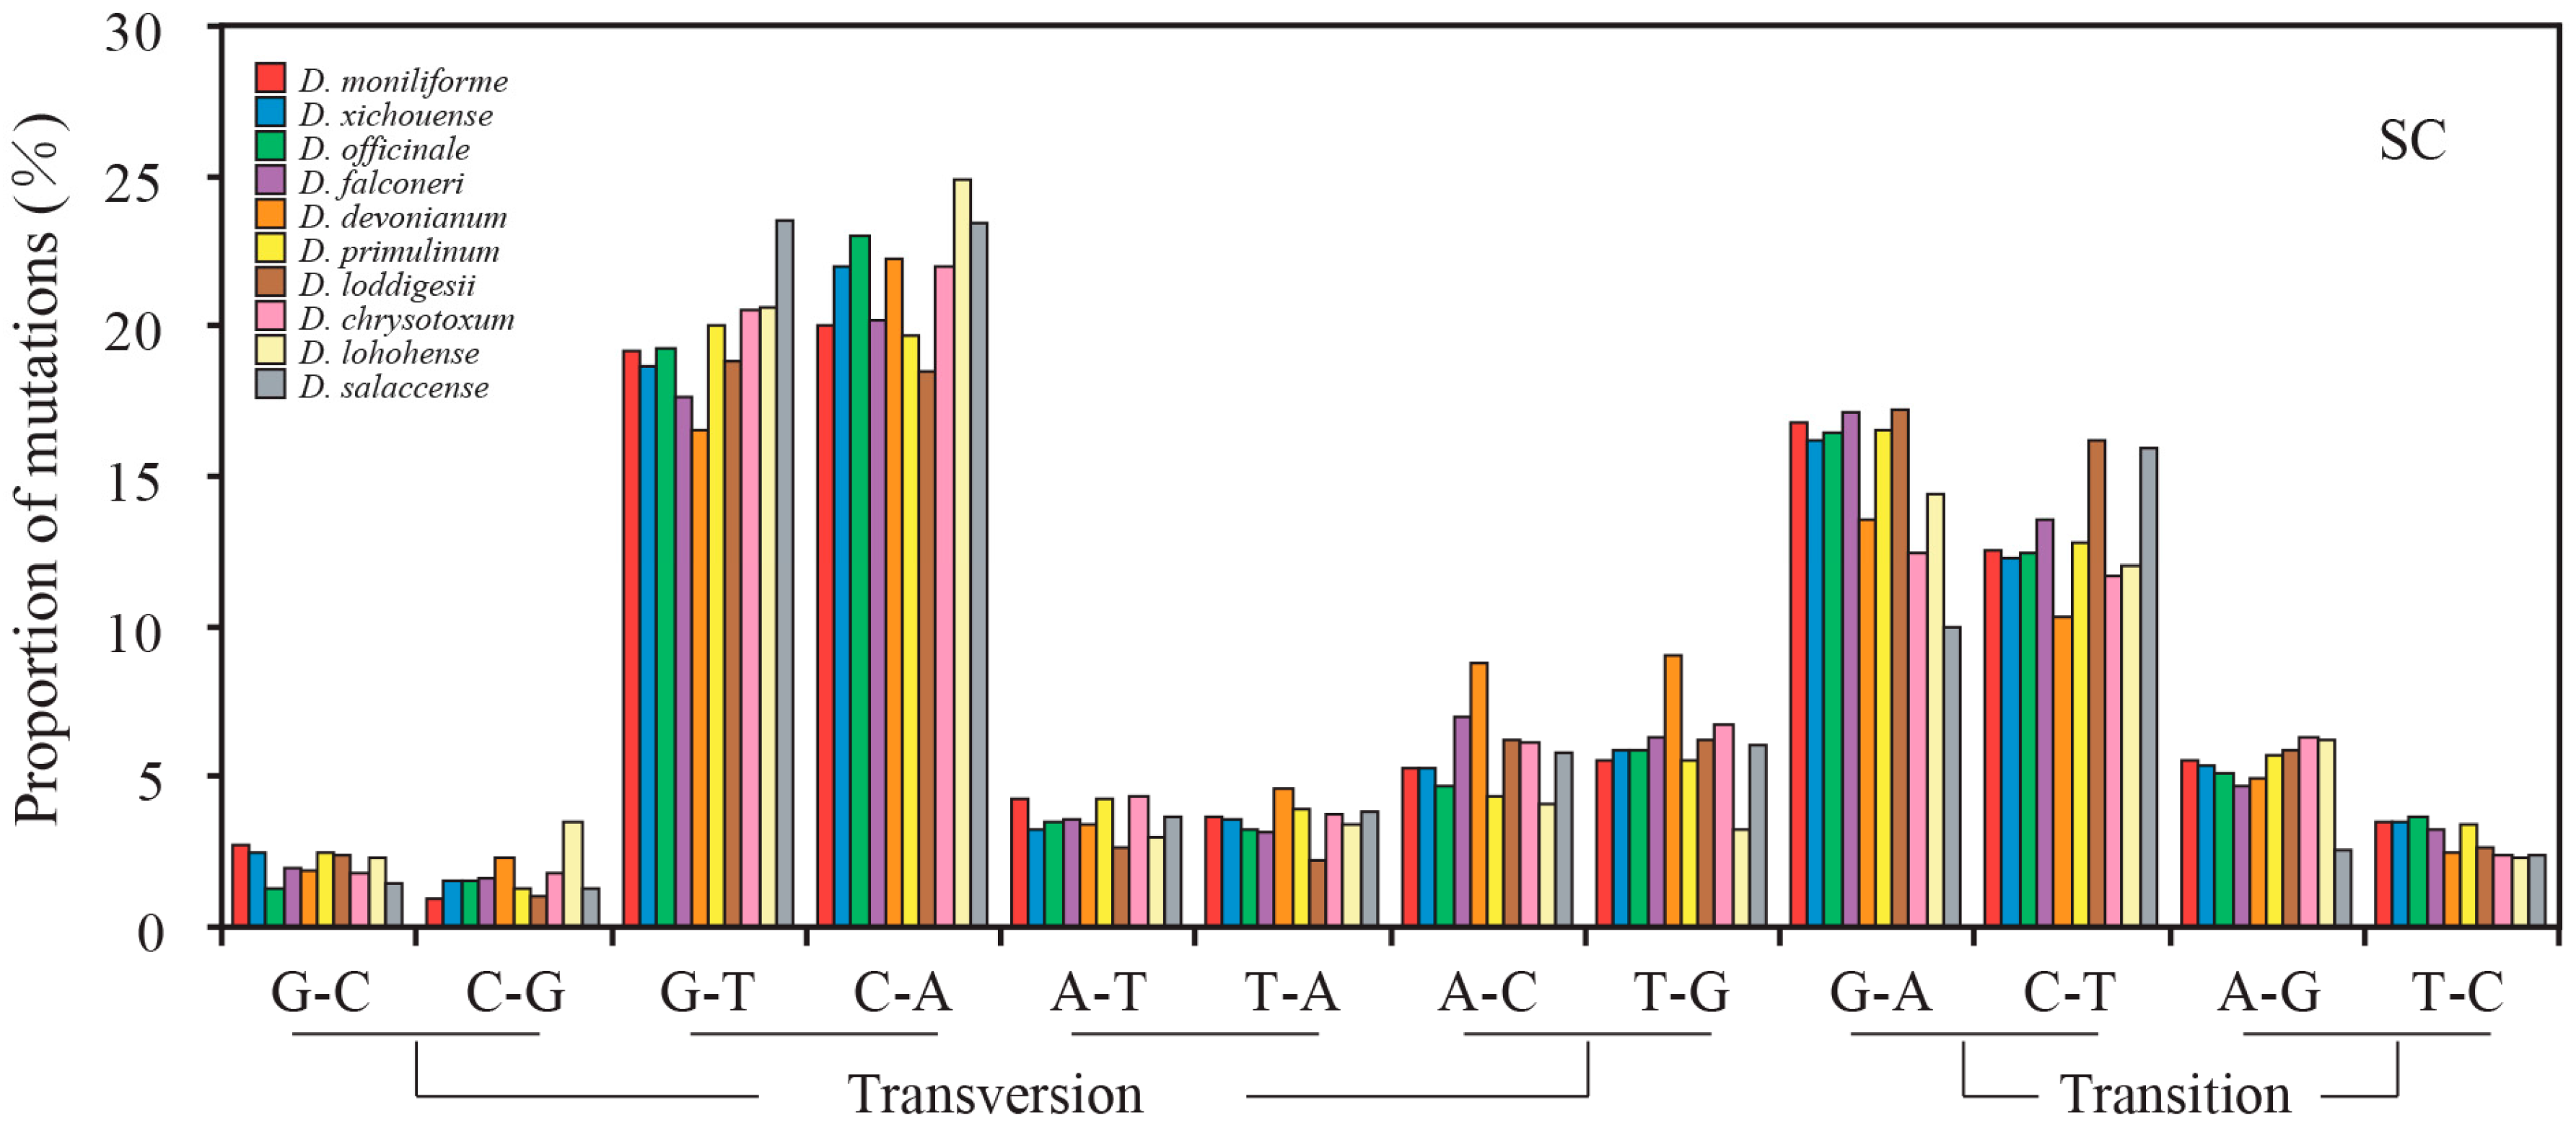
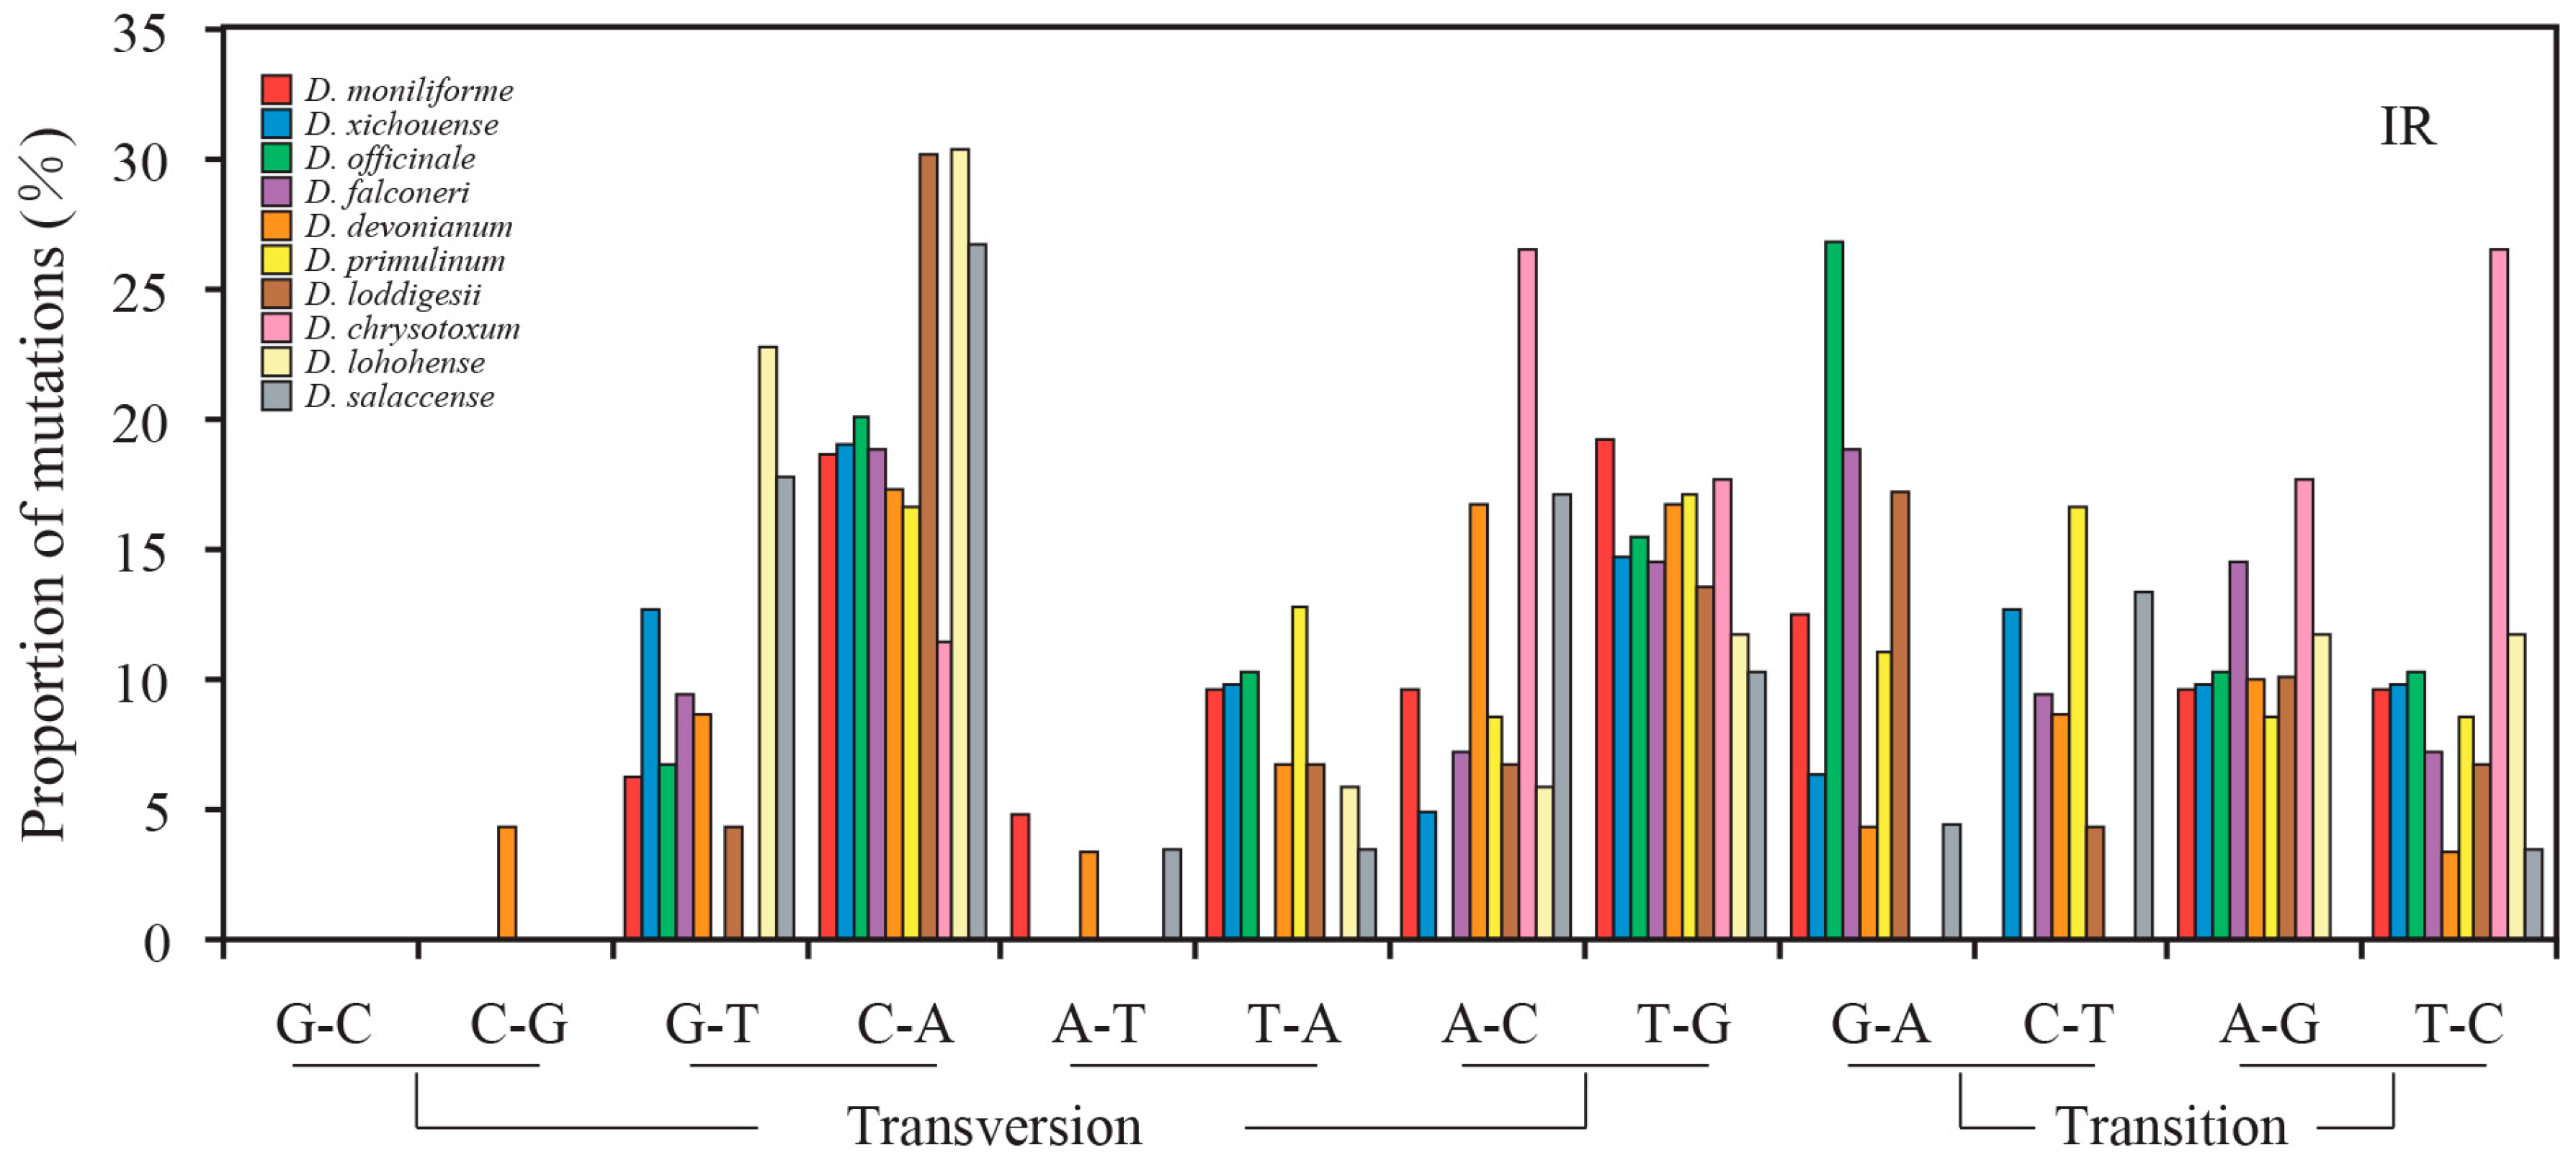
2.3. Mutational Biases of Non-Coding Loci Are Associated with the Plastomic Structure

The phylogenetic relationship of these 10 Dendrobium species was inferred from the whole plastome sequence (Figure 3). The phylogenetic tree was highly resolved with the support value of all nodes = 100%. This tree was utilized to construct the ancestral sequences of non-coding loci, including intergenic and intronic loci for the 10 Dendrobium species. Then, the point mutations between ancestral and current sequences were calculated.
In all examined Dendrobium species, the nucleotide mutations were mainly distributed in the non-coding loci of SC regions. The frequencies of transversions are higher than that of transitions in both SC and IR regions. Figure 4 shows the relative rates of the six nucleotide pair mutations. The most common mutation is G/C to A/T mutations in SC regions. Therefore, we divided the nucleotide mutations into two groups: AT-rich (G/C to A/T) and GC-rich (A/T to G/C) mutations (Table 2). The number of AT-rich mutations was larger than that of GC-rich mutations in the SC regions, while the two types of mutations did not display significant difference in the IR regions. These results indicated that the mutational biases in Dendrobium plastomes are associated with the plastomic structure. Moreover, the contrasting biased mutations between the SC and IR regions were also evident by the GCeq values estimated from the non-coding loci of the SC and IR regions. In line with the counting results shown in Table 2, the GCeq values for the SC regions were remarkably smaller than equilibrium (GCeq = 50%) (Figure 5). However, in the IR regions, GCeq values of all Dendrobium species were greater than 50%, except for D. loddigesii, D. lohohense, and D. salaccense (with GCeq values 44.83%, 42.86% and 33.97%, respectively). This result disagreed with the data shown in Table 2, that the IR regions for Dendrobium species have no significant difference between GC-rich and AT-rich mutations. Because only few mutations were detected in the IR regions, the data shown in Table 1 might not precisely reflect the mutational biases of non-coding loci. Thus, based on the estimated GCeq values, the mutational biases in the IR region were toward GC-richness. Considering the different mutational trends in Dendrobium plastomes: (1) toward AT-richness in SC regions and (2) toward GC-richness in IR regions, we proposed that the mutational biases of non-coding loci are associated with the plastomic structure in Dendrobium species.

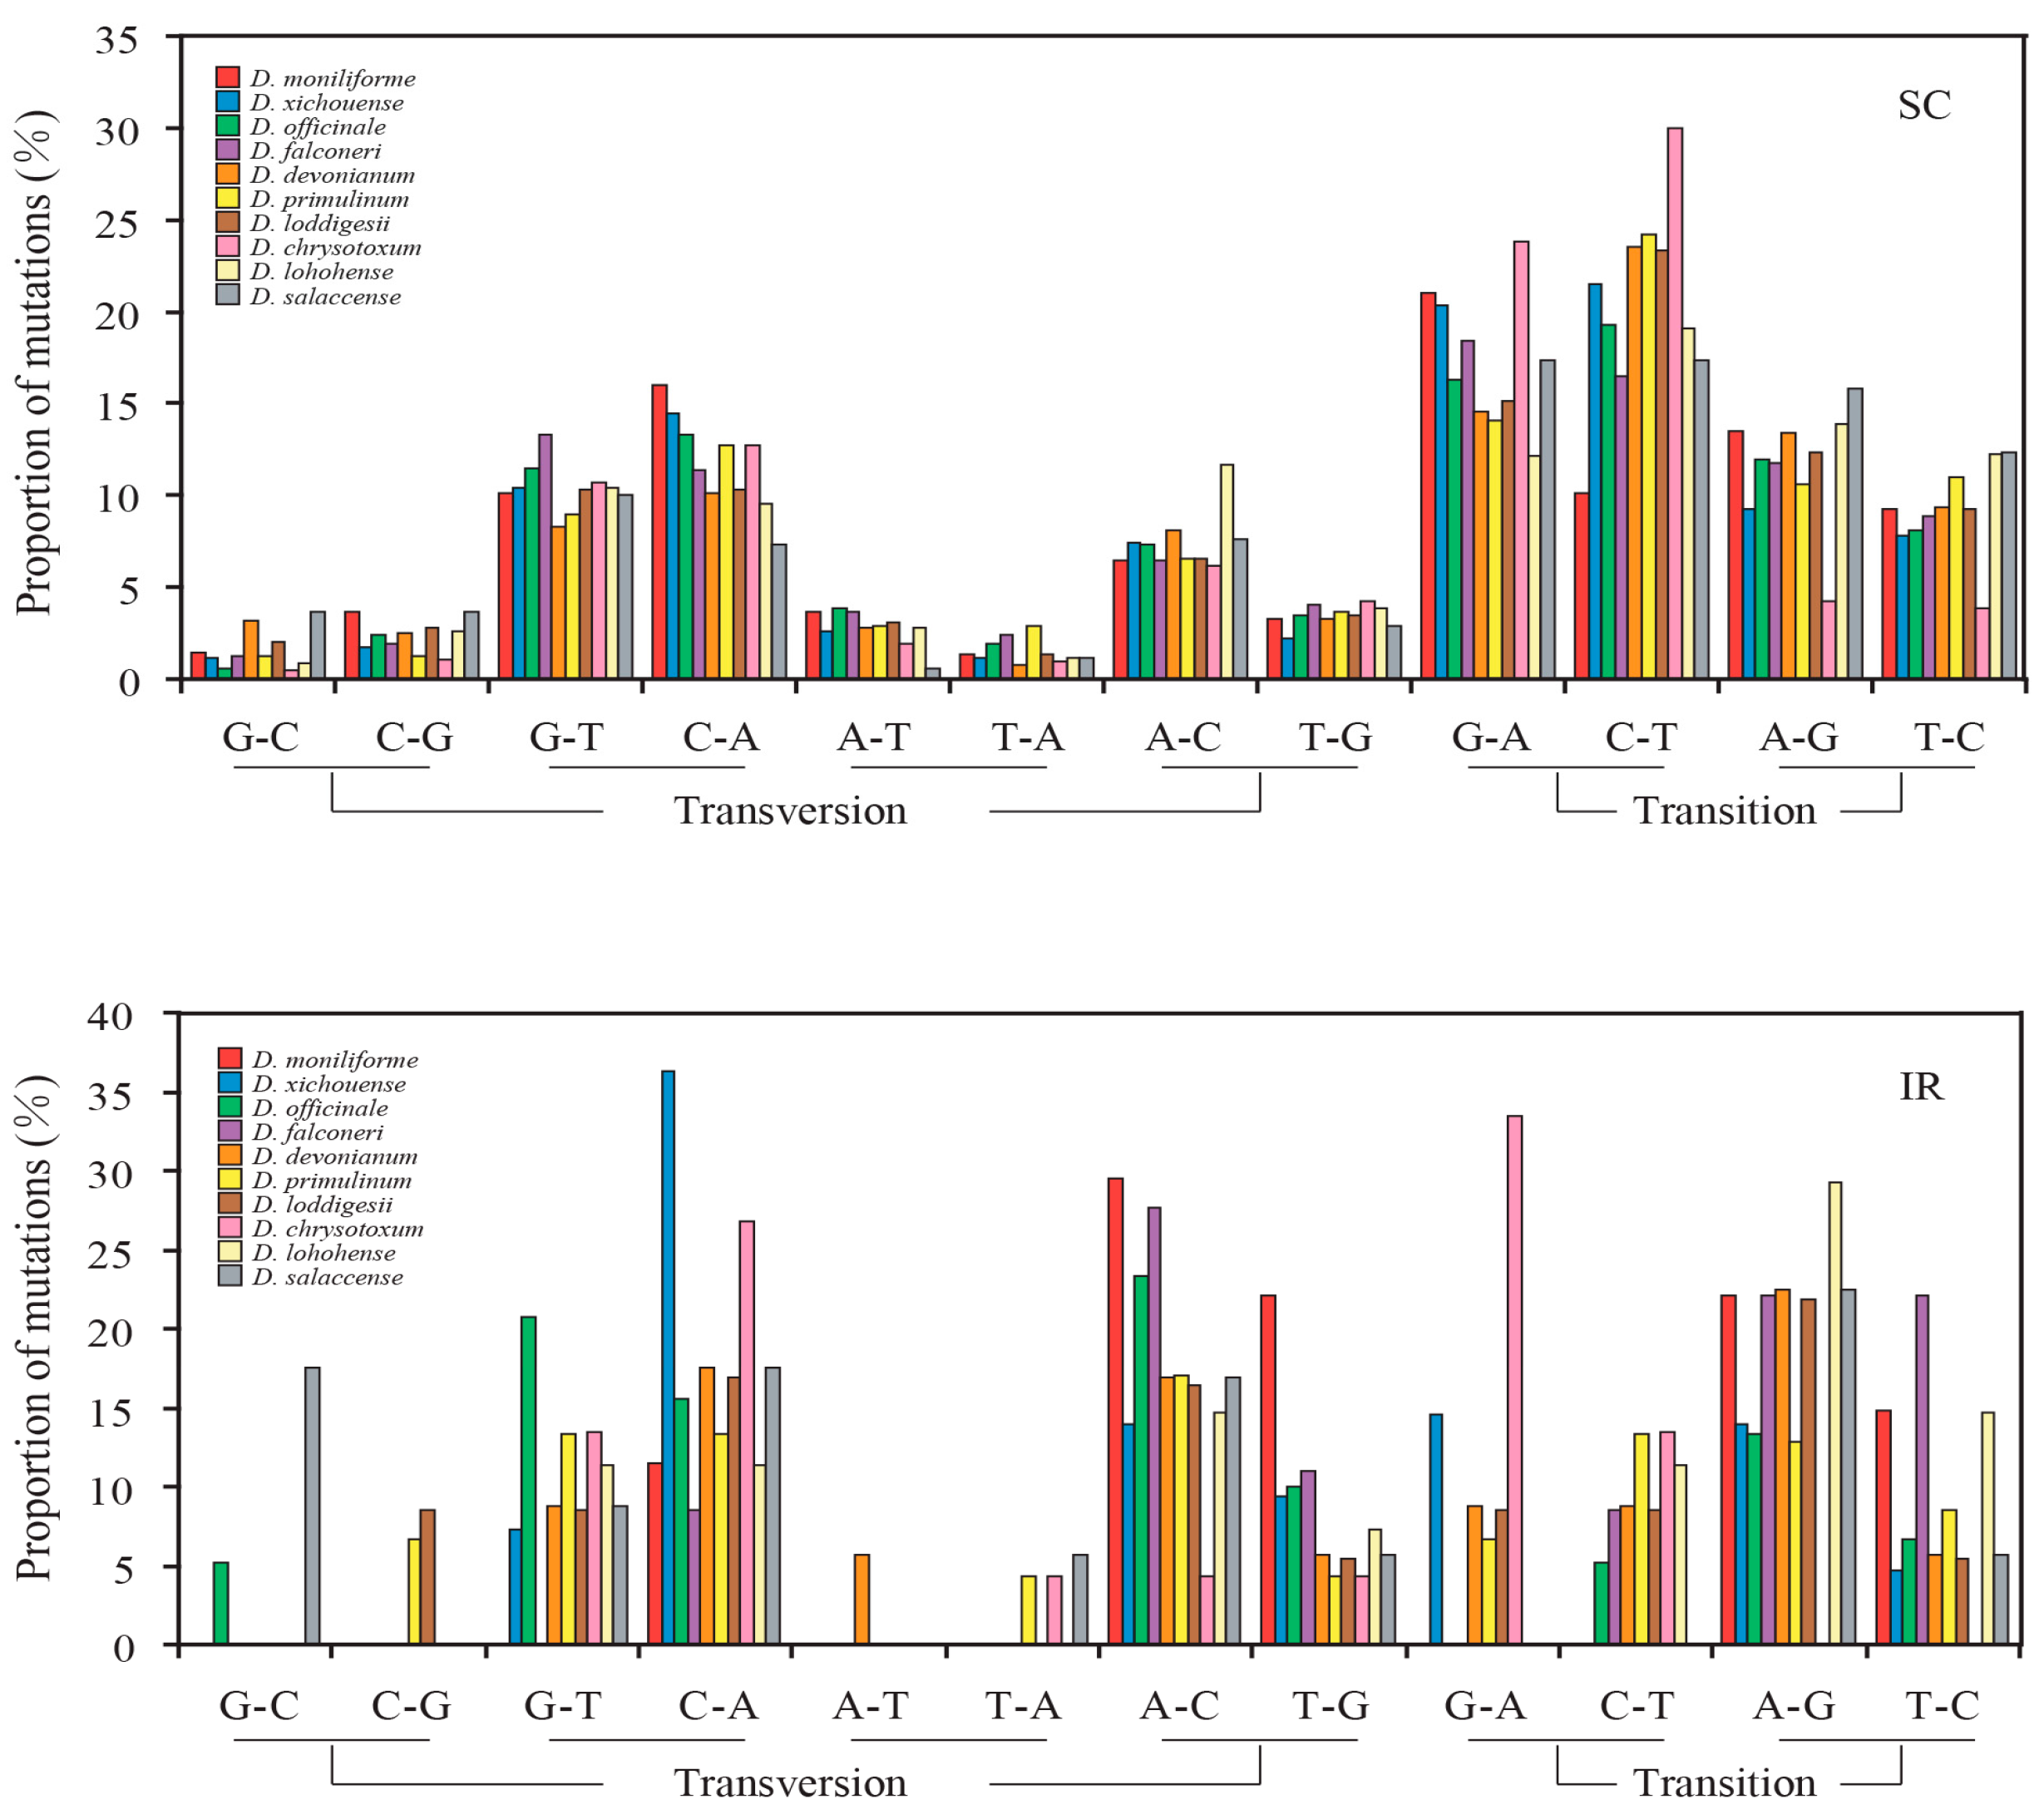
2.4. Contrasting Mutational Biases of Protein-Coding Genes between SC and IR Regions

Three pairs of site models (M0 vs. M3, M1a vs. M2a, and M7 vs. M8) were used to test whether the evolution of plastid protein-coding genes was driven by positive selection. Among 68 plastid protein-coding genes, twelve genes (accD, ccsA, matK, psaB, rbcL, rpl20, rpoC1, rpoC2, rps3, rps16, ycf1 and ycf2) were detected under positive selection (Table S1). The plastid protein-coding genes were classified into two categories, positive selected and non-positive selected data sets. The mutational biases were counted. However, the two data sets showed the same mutational trends: (1) the frequencies of transitions were higher than that of transversions (Figure S2); (2) counts of AT-rich mutations were larger than that of GC-rich mutations (Table S2); and (3) the GCeq values were smaller than equilibrium (GCeq = 50%) (Figure S3). Similar results were also observed in each codon position, which suggests that positive selection has no effect on gene conversions. Therefore, the plastid protein-coding genes were re-divided into SC and IR data sets based on their locations. The genes of rpl22, rps12, and ycf1 were discarded because they were distributed in both SC and IR regions. Consistent with the counting results of non-coding loci, protein-coding genes also showed a contrast mutational bias between SC and IR regions (Table 3 and Figure 6 and Figure 7).

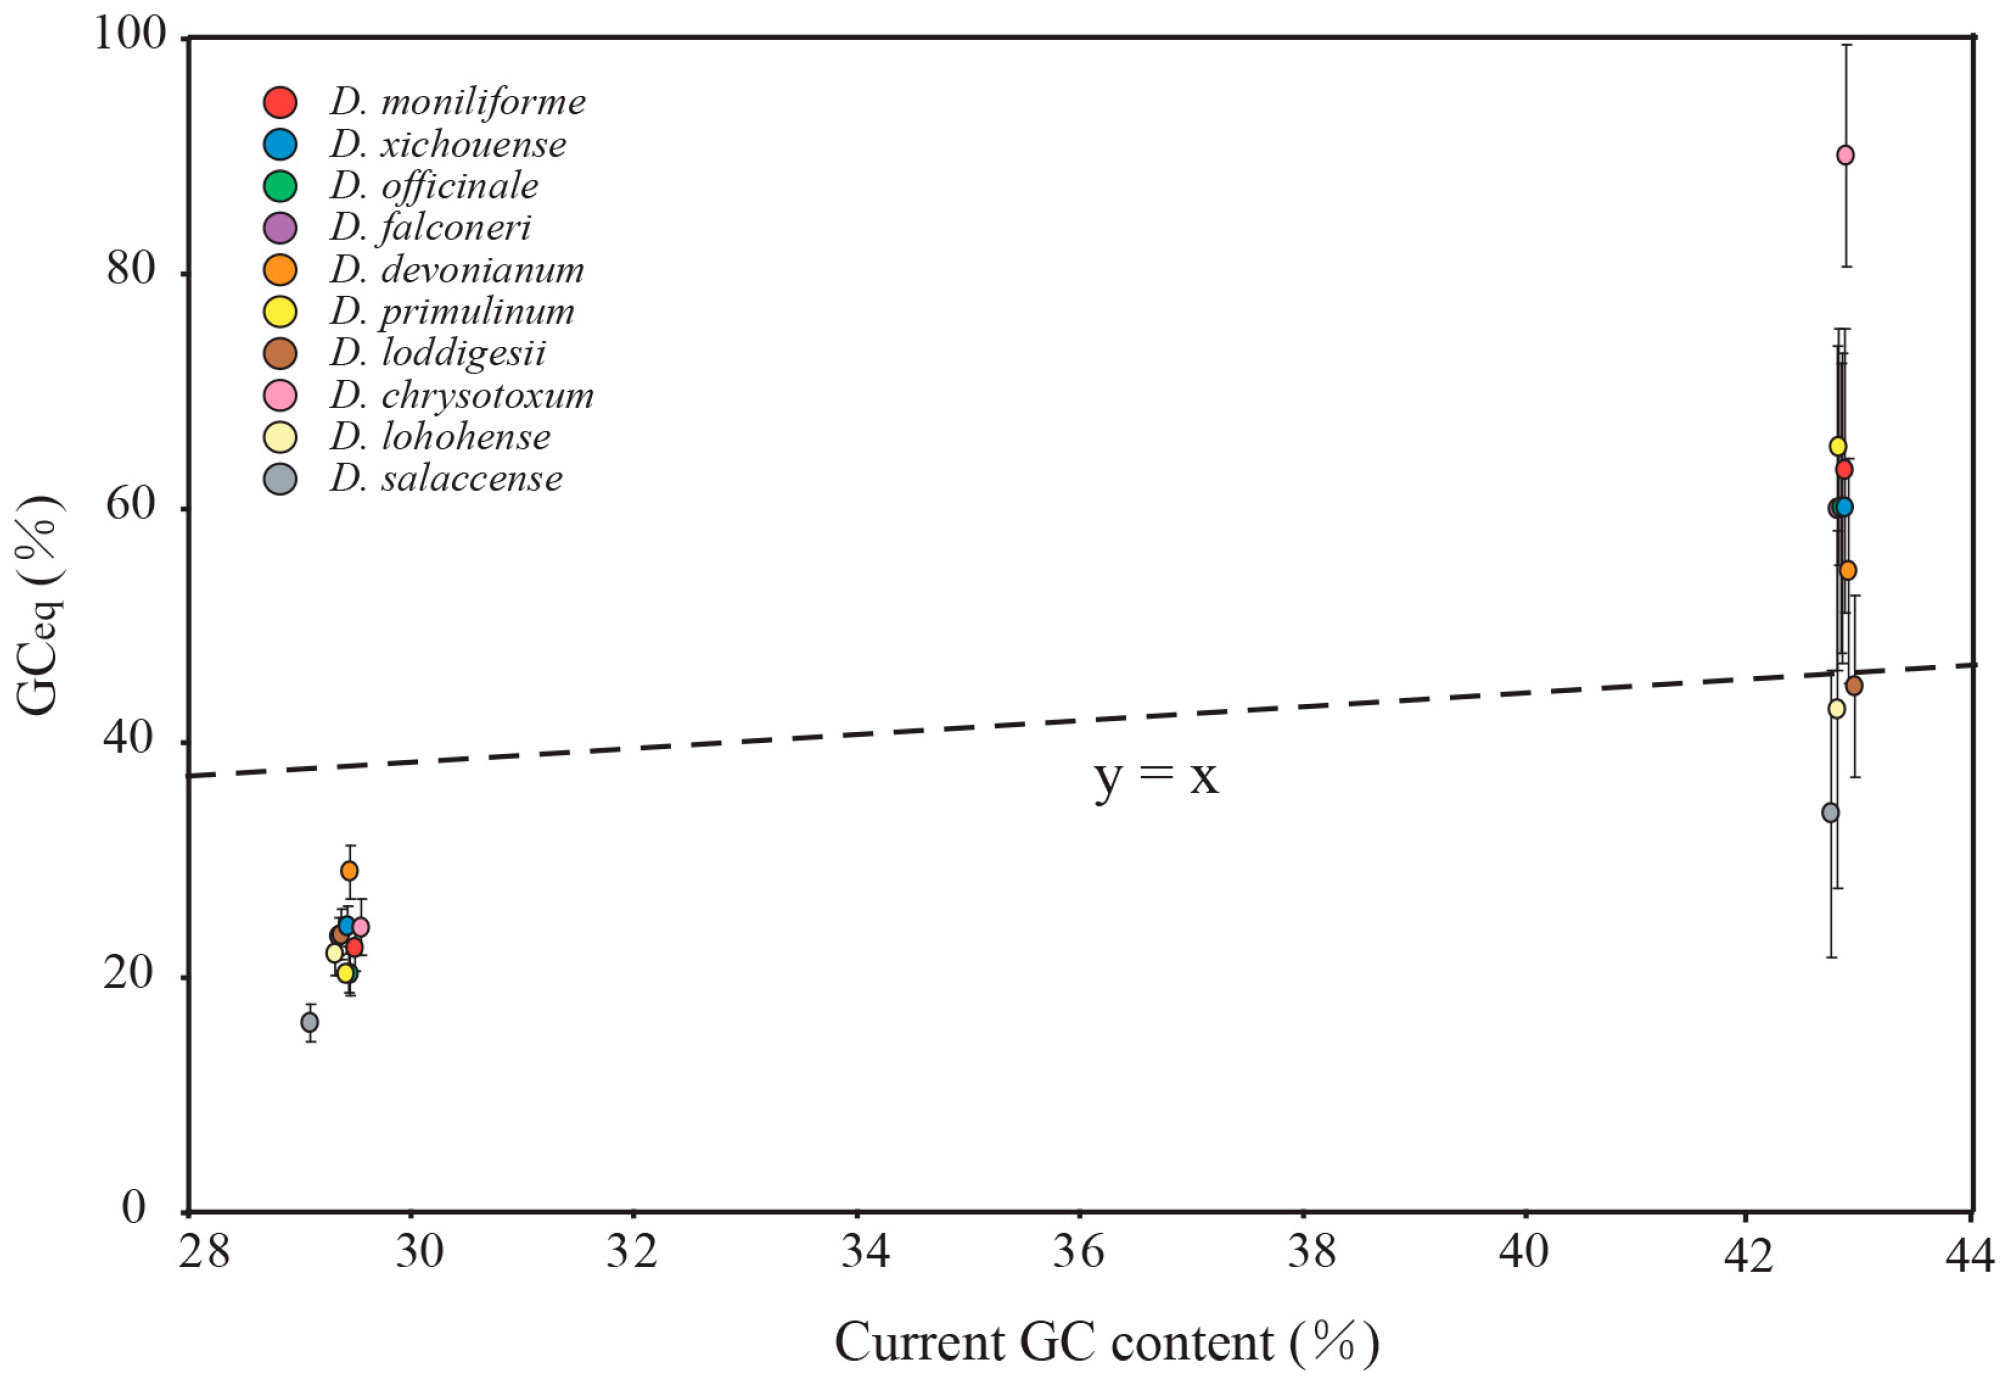
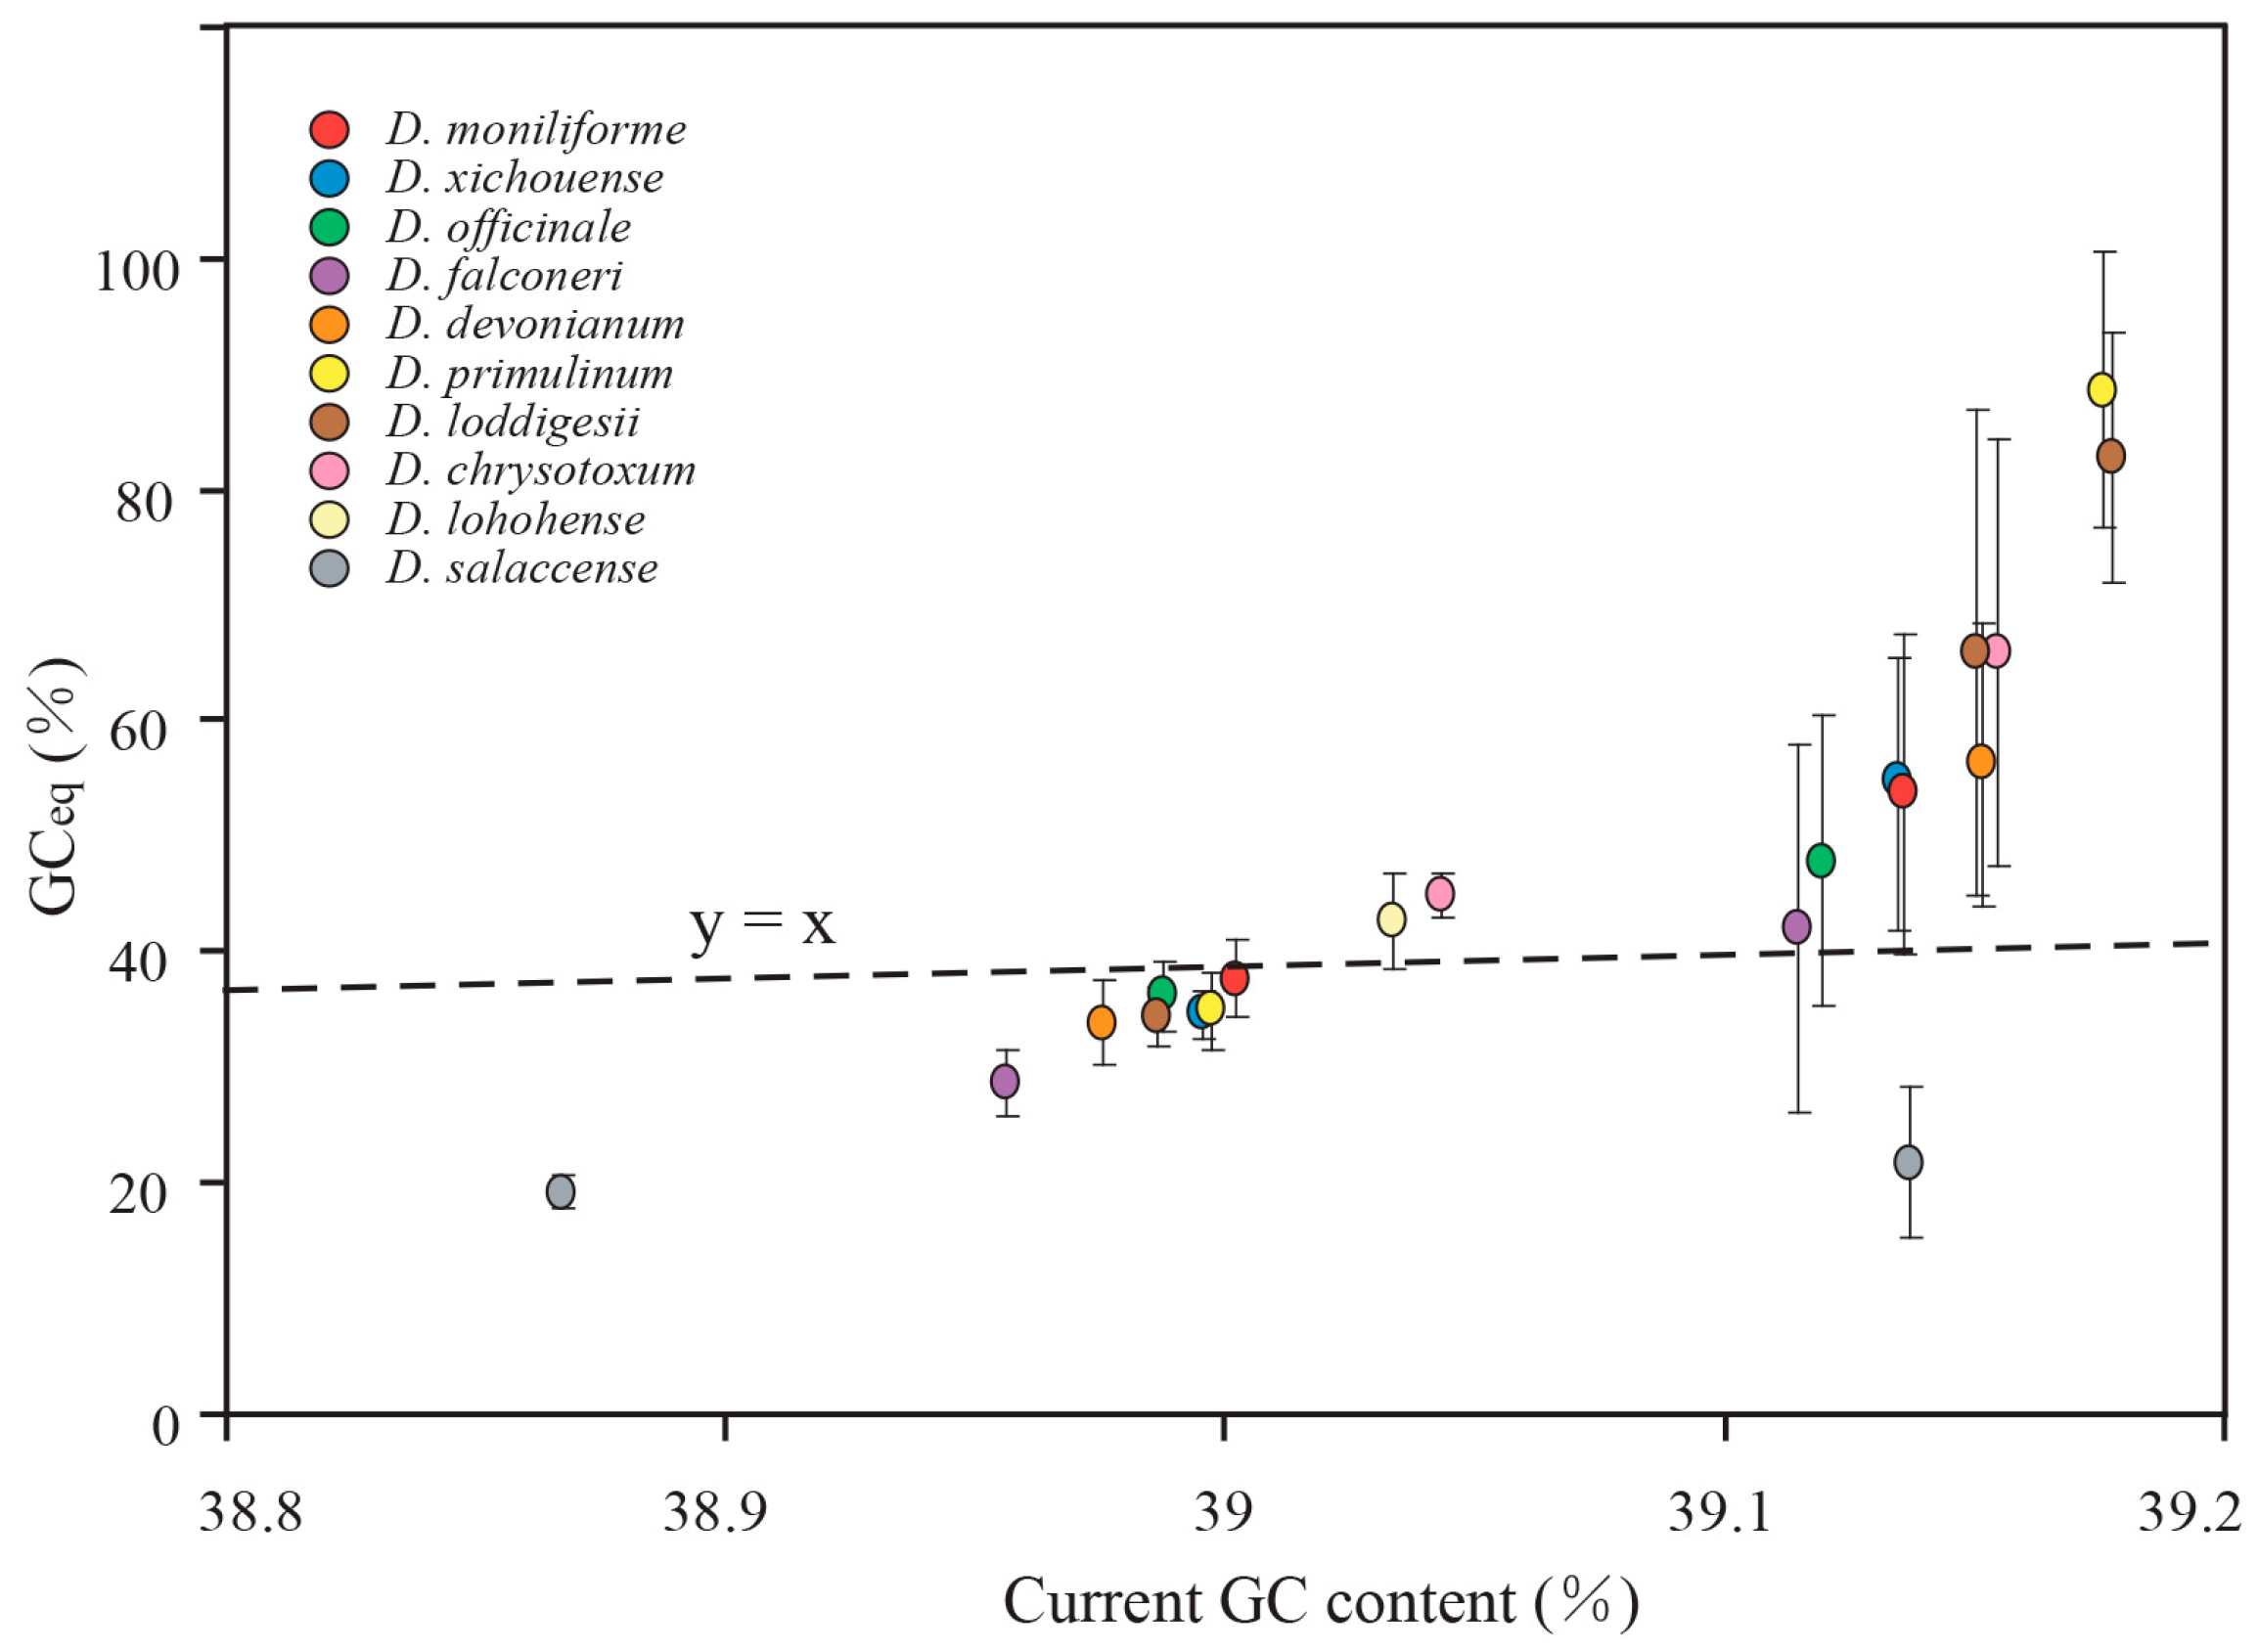
2.5. Mutational Biases Have Directly Impact on the Evolution of GC Content in Dendrobium Plastomes

As mentioned above, our analysis revealed contrast mutational biases between SC and IR regions in both protein-coding genes and non-coding loci. To assess the effect of mutational biases on the evolution of GC content in Dendrobium plastomes, the GCeq values were compared to current GC content. As shown in Figure 5 and Figure 7, the GCeq values of protein-coding genes and non-coding loci in SC regions were estimated to be 19.25–44.88% and 16.05–28.92%, respectively. The estimated GCeq values were lower than current GC content in SC regions indicating that the GC content of SC regions was evolved toward AT-richness. On the contrary, the results show that GCeq values of IRs (42.86–90.02% for protein-coding genes and 21.72–88.54% for non-coding loci) were higher than current GC content, suggesting that the evolution trends of GC content in IRs were toward GC-richness. Considering the consistent evolution trends between mutational biases and the evolution of GC content in SC and IRs, we proposed that mutational biases have directly impact on the evolution of GC content in Dendrobium plastomes.

2.6. gBGC Has an Effect on Maintaining Higher GC Content in IR Regions

Figure S4 illustrated the non-synonymous (dn) and synonymous (ds) substitution rates of protein-coding genes and mutation rates estimated from the syntenic non-coding loci in the SC and IR regions. The two-sided Mann–Whitney test indicated that the substitution rates were higher in SC regions than that in IR regions of Dendrobium plastomes (p < 0.01). The reduced substitution rates of IR regions most likely resulted from gene conversion. The intraplastomic recombination via IR regions frequently occurred in the plastid because of the identical sequences in the two IR regions (Figure S5A). Therefore, the GC-biased mutation and reduced substitution rates in IRs could be caused by gBGC. To determine whether the gBGC has an effect on the evolution of GC content, we compared the GC content of IR regions between the two groups: (1) the one-IR group, including five plastomes from Pinaceae and cupressophytes, which contain only one copy of IR region; and (2) the two-IR group, including 10 Dendrobium plastomes, which contain two copies of IR regions. Our comparison revealed a significantly higher GC content in the IR regions of the two-IR group than that of the one-IR group (Mann–Whitney 2-sides, p < 0.01), which suggested that the gBGC has influenced the GC content in IR regions (Figure S5B). Furthermore, the significant correlation between the GCeq values and current GC content in protein-coding genes and non-coding regions (Spearman’s r = 0.851, 0.841, both p < 0.01) indicated that gBGC has a long-term effect on the GC content in Dendrobium plastomes.

3. Discussion

3.1. The High-Quality Complete Plastome Sequences That Could Represent for Dendrobium Species

Plastome sequences of seed plants, in general, have relatively small sizes, conserved gene contents, dense coding regions, and slower evolutionary rates as compared to nuclear and mitochondrial genomes [1]. These unique features have attracted intense attention from researchers, leading to numerous plastome sequences published, e.g., [20,22,25,26]. The first record of a Dendrobium plastome, Dendrobium officinale, was obtained by sequencing from the isolated chloroplast DNA [21]. However, it is extremely hard to extract the chloroplast from Dendrobium species due to their high percentage of polysaccharides, e.g., [27,28]. The plant whole genome sequencing data always contains high copy numbers of plastome sequence reads, which provide an opportunity for the complete plastome sequence assembly. Thus, a lot of methods were established to assemble the plastome sequence from the genome sequencing resources [29,30,31]. Among them, the reference-guided mapping method is a good approach for studies of related species with known reference sequences. Recently, more than 30 Dendrobium plastomes have been sequenced and assembled by using this approach [22]. However, tentative errors, such as SNP, InDel, and repeat sequences, may generate by using different assembly tools or mapping data to different references [31]. As shown in Figure S1, the sequences in the non-coding regions and ndh genes of D. loddigesii and D. devonianum were distinct from different assembly methods. Therefore, the high-quality plastome sequence that could be representing for Dendrobium species was urgently needed. In this study, two different methods were employed for the plastome assembly of Dendrobium species. According to the mVISTA analysis, the mis-assembled error sequences were detected, which indicated that at least two different methods should be used in the plastome assembly analysis to avoid assembling errors. After correcting and validating these errors by PCR amplification and Sanger sequencing, the complete plastomes of D. loddigesii and D. devonianum were obtained. Therefore, we proposed that the high-quality complete plastome sequences of D. loddigesii and D. devonianum were obtained in this study, which could represent for Dendrobium species for the future studies.

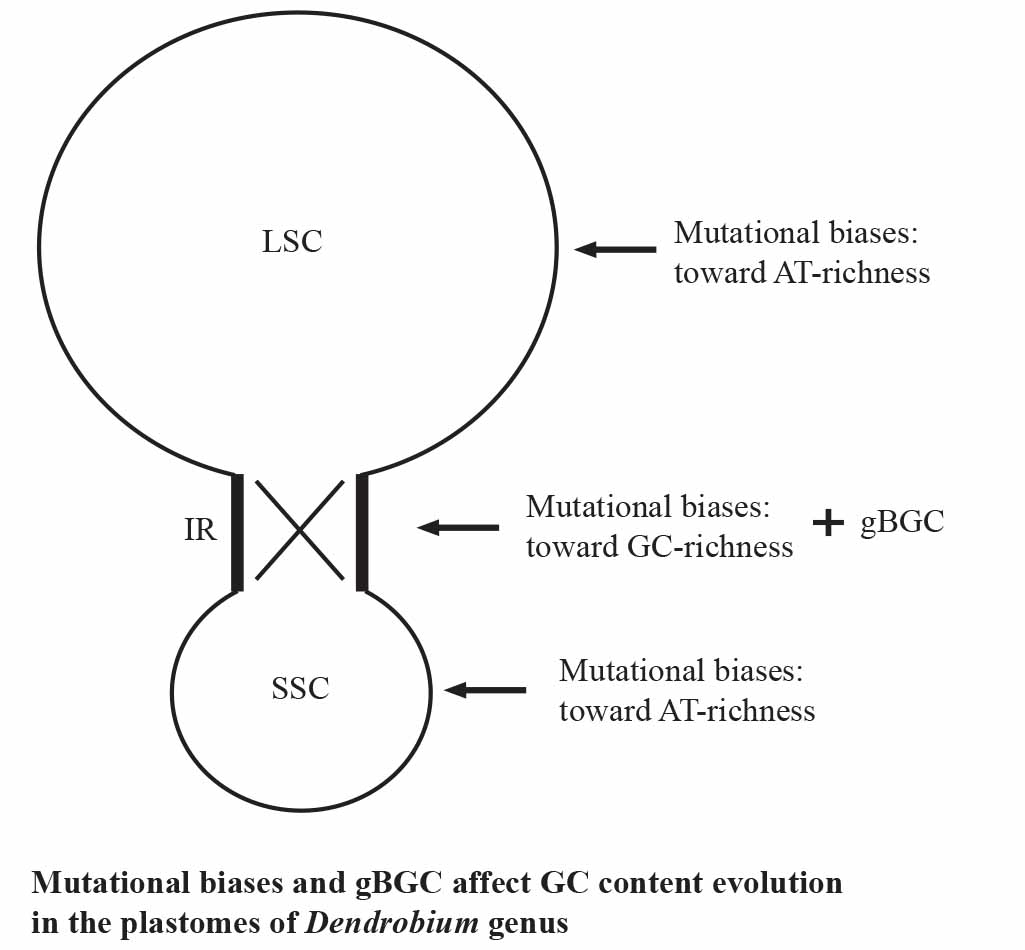
3.2. Both Mutational Biases and gBGC Affect GC Content in the Plastomes of Dendrobium Genus

The causes of GC content variation in plastome sequences were less clearly established than in nuclear genome sequences, and the role of gene conversion has only been investigated in non-coding regions more recently [17]. Previously, more than 30 plastomes of Dendrobium species have been published, which provides a huge resource for exploring the evolutionary mechanism of the variation of GC content in Dendrobium plastomes. Niu et al., (2017) proposed that evolutionary stasis should use at least 10 plastome sequences [22]. Here, we examined and discussed the three major hypotheses based on our newly sequenced data coupled with other eight Dendrobium plastomes.

3.2.1. Natural Selection

Natural selection has great impact on the variations in base composition. For example, in plastomes, the codon-usage of the psbA gene was proposed to be associated with positive selection for maintaining the translation efficiency [32]. Moreover, several studies have suggested a correlation between GC content and the function and expression of genes e.g., [5,33,34], which enhanced the hypothesis that natural selection has a direct impact on GC content. The “natural selection hypothesis” was also supported by the study of Shi et al., (2007), who found that the selection is the primary cause of the GC content variation in rice genes [35]. In this study, positive selection analysis was performed for the 68 plastid protein-coding genes. The higher GC content in the IRs than that in SC regions leads us to expect that genes located in IRs have a higher proportion under positive selection. However, only one protein-coding gene (ycf2) was identified under positive selection in the IR regions. Moreover, the same mutational trends were observed in both positive selected and non-positive selected data sets. These results suggested that natural selection does not appear to contribute significantly to the varied GC content of plastid protein-coding genes. Therefore, we ruled out the effect of natural selection, which leaves the mutational bias and gBGC as potential determinants for the evolution of GC content in the Dendrobium plastomes.

3.2.2. Mutational Bias

In this study, our analysis revealed a contrast mutational bias in Dendrobium plastomes that: (1) toward AT-richness in SC and (2) toward GC-richness in IR regions. The contrast mutational biases would lead to a lower GC content in SC regions. Indeed, the GC contents of LSC and SSC regions are lower than that of IRs. Moreover, the result estimated GCeq values lower than current GC content in SC regions and higher than that of IRs, indicating that the GC content variation in SC regions is primarily determined by the mutational biases. Therefore, we proposed that mutational biases have direct impact on the variation of GC content in Dendrobium plastomes. Mutational biases toward AT-richness have been reported in gnetophytes [3]. Their plastomes were discovered to be compacting with enriched AT content, which was thought to have many advantages for resource consumption. For example, an A/T nucleotide contains seven atoms of nitrogen, one less than the G/C nucleotide. Moreover, AT-richness in base composition would benefit the rapid replication of plastomes [36]. Therefore, the sequence feature that mutated toward AT-richness would be favored in the plastome.

3.2.3. gBGC

The variation in base composition is proven to be affected by gene conversion, e.g., [37,38]. The gene conversion of the plastome sequences is typically modeled as an independent process, in which changes at any one site are independent of changes at any other site [39]. However, gene conversion is not an entirely stochastic process, as it acts according to certain deterministic biases that affect the GC content evolution. Over the past 10 years, GC-biased gene conversion (gBGC) has been clearly established as the main process affecting GC content evolution in the nuclear genome [40,41,42,43]. However, whether the gBGC affects the GC content in plastome sequences is poorly understood. In this study, although no direct evidence is detected, we cannot ignore the impact of gBGC to the GC content evolution in Dendrobium genus. Based on the comparison results of 10 Dendrobium plastomes, we proposed that the gBGC has influenced the plastome wide GC content evolution due to three reasons. Firstly, the higher GC content in IR regions could be explained by gBGC. In this study, the reduced substitution rates and GC-biased mutation indicated that gBGC occurred in IRs. The gBGC would affect GC/AT heterozygous sites yields more frequently to GC than to AT alleles, which lead to increasing the GC content over evolutionary time [13]. Secondly, the recombination of IRs provides an opportunity for gBGC to occur. IRs are the recombination hotspots in plastome sequence, which favors the gBGC [44,45,46]. Moreover, a gBGC model during recombination has been put forth to interpret the GC-biased mutations observed in the IR regions [17]. Through that model, GC to AT mutations were unfavored, whereas AT to GC ones were fixed after gBGC. After loss of one IR region, the GC content of IR regions in Pinaceae and cupressophytes species was evolved toward AT-richness. Thirdly, the significant correlation between the GCeq values and GC content values in protein-coding genes and non-coding regions (Spearman’s r = 0.851, 0.841, both p < 0.01) indicated that in Dendrobium, gBGC has shaped plastome-wide mutations and GC content. Therefore, we proposed that both mutational biases and gBGC affect GC content in the plastomes of the Dendrobium genus.

4. Materials and Methods

4.1. DNA Extraction and Plastome Sequencing

Two grams each of fresh leaves were harvested from individuals of D. loddigesii (voucher specimen: Niu14007) and D. devonianum (voucher specimen: Niu15008). They were cultivated in the greenhouse of Nanjing Normal University. The total DNA of each species was extracted using the Qiagen DNeasy Plant Mini Kit (Qiagen, Hilden, Germany), according to the manufacturer’s instructions. DNA samples that met the quality of concentrations >300 ng/mL, A260/A280 ratio = 1.8–2.0, and A260/A230 ratio >1.7, were used for next-generation sequencing. The sequencing depth was 3.84 GB of 150 bp paired-end reads for each species.

4.2. Plastome Assembly, Annotation and Comparison

To obtain high-quality complete plastome sequences of D. loddigesii and D. devonianum, two different assembly methods: (1) de novo assembly methods and (2) reference-guided mapping method, were employed in this study. For the de novo assembly, raw reads were first trimmed with error probability <0.05, then de novo assembled using SOAPdenovo version 1.12 with the default parameters [47]. The de Bruijn graph approach was applied to assembly with an optimal K-mer size of 79. Contigs with length <200 bp were discarded. The remaining contigs were compared with the plastome sequences of D. moniliforme (AB893950) using BLAST searches. Matched contigs with E-values of <10−10 were designated as plastomic contigs. The gaps between plastomic contigs were closed by PCR amplification with specific primers and Sanger sequencing. For reference-guided assembly, the trimmed reads were mapped to the reference plastome sequence of D. moniliforme (AB893950) using CLC Genomics Workbench 6.0.1 (CLC Bio, Aarhus, Denmark). The four junctions between LSC/SSC and IRs and the regions with uncertain nucleotide “N” were validated with PCR amplification.
Protein-coding genes and ribosomal RNA genes were annotated using DOGMA [48]. The boundaries of each annotated gene were confirmed by their alignment with their orthologous genes from other Dendrobium plastomes. Genes of tRNA were predicted using tRNAscan-SE 1.21 [49]. The differences between plastome sequences of D. loddigesii and D. devonianum that assembled from different methods were compared by using the mVISTA software [50]. The plastome sequence of D. moniliforme (AB893950) was used as an outgroup.

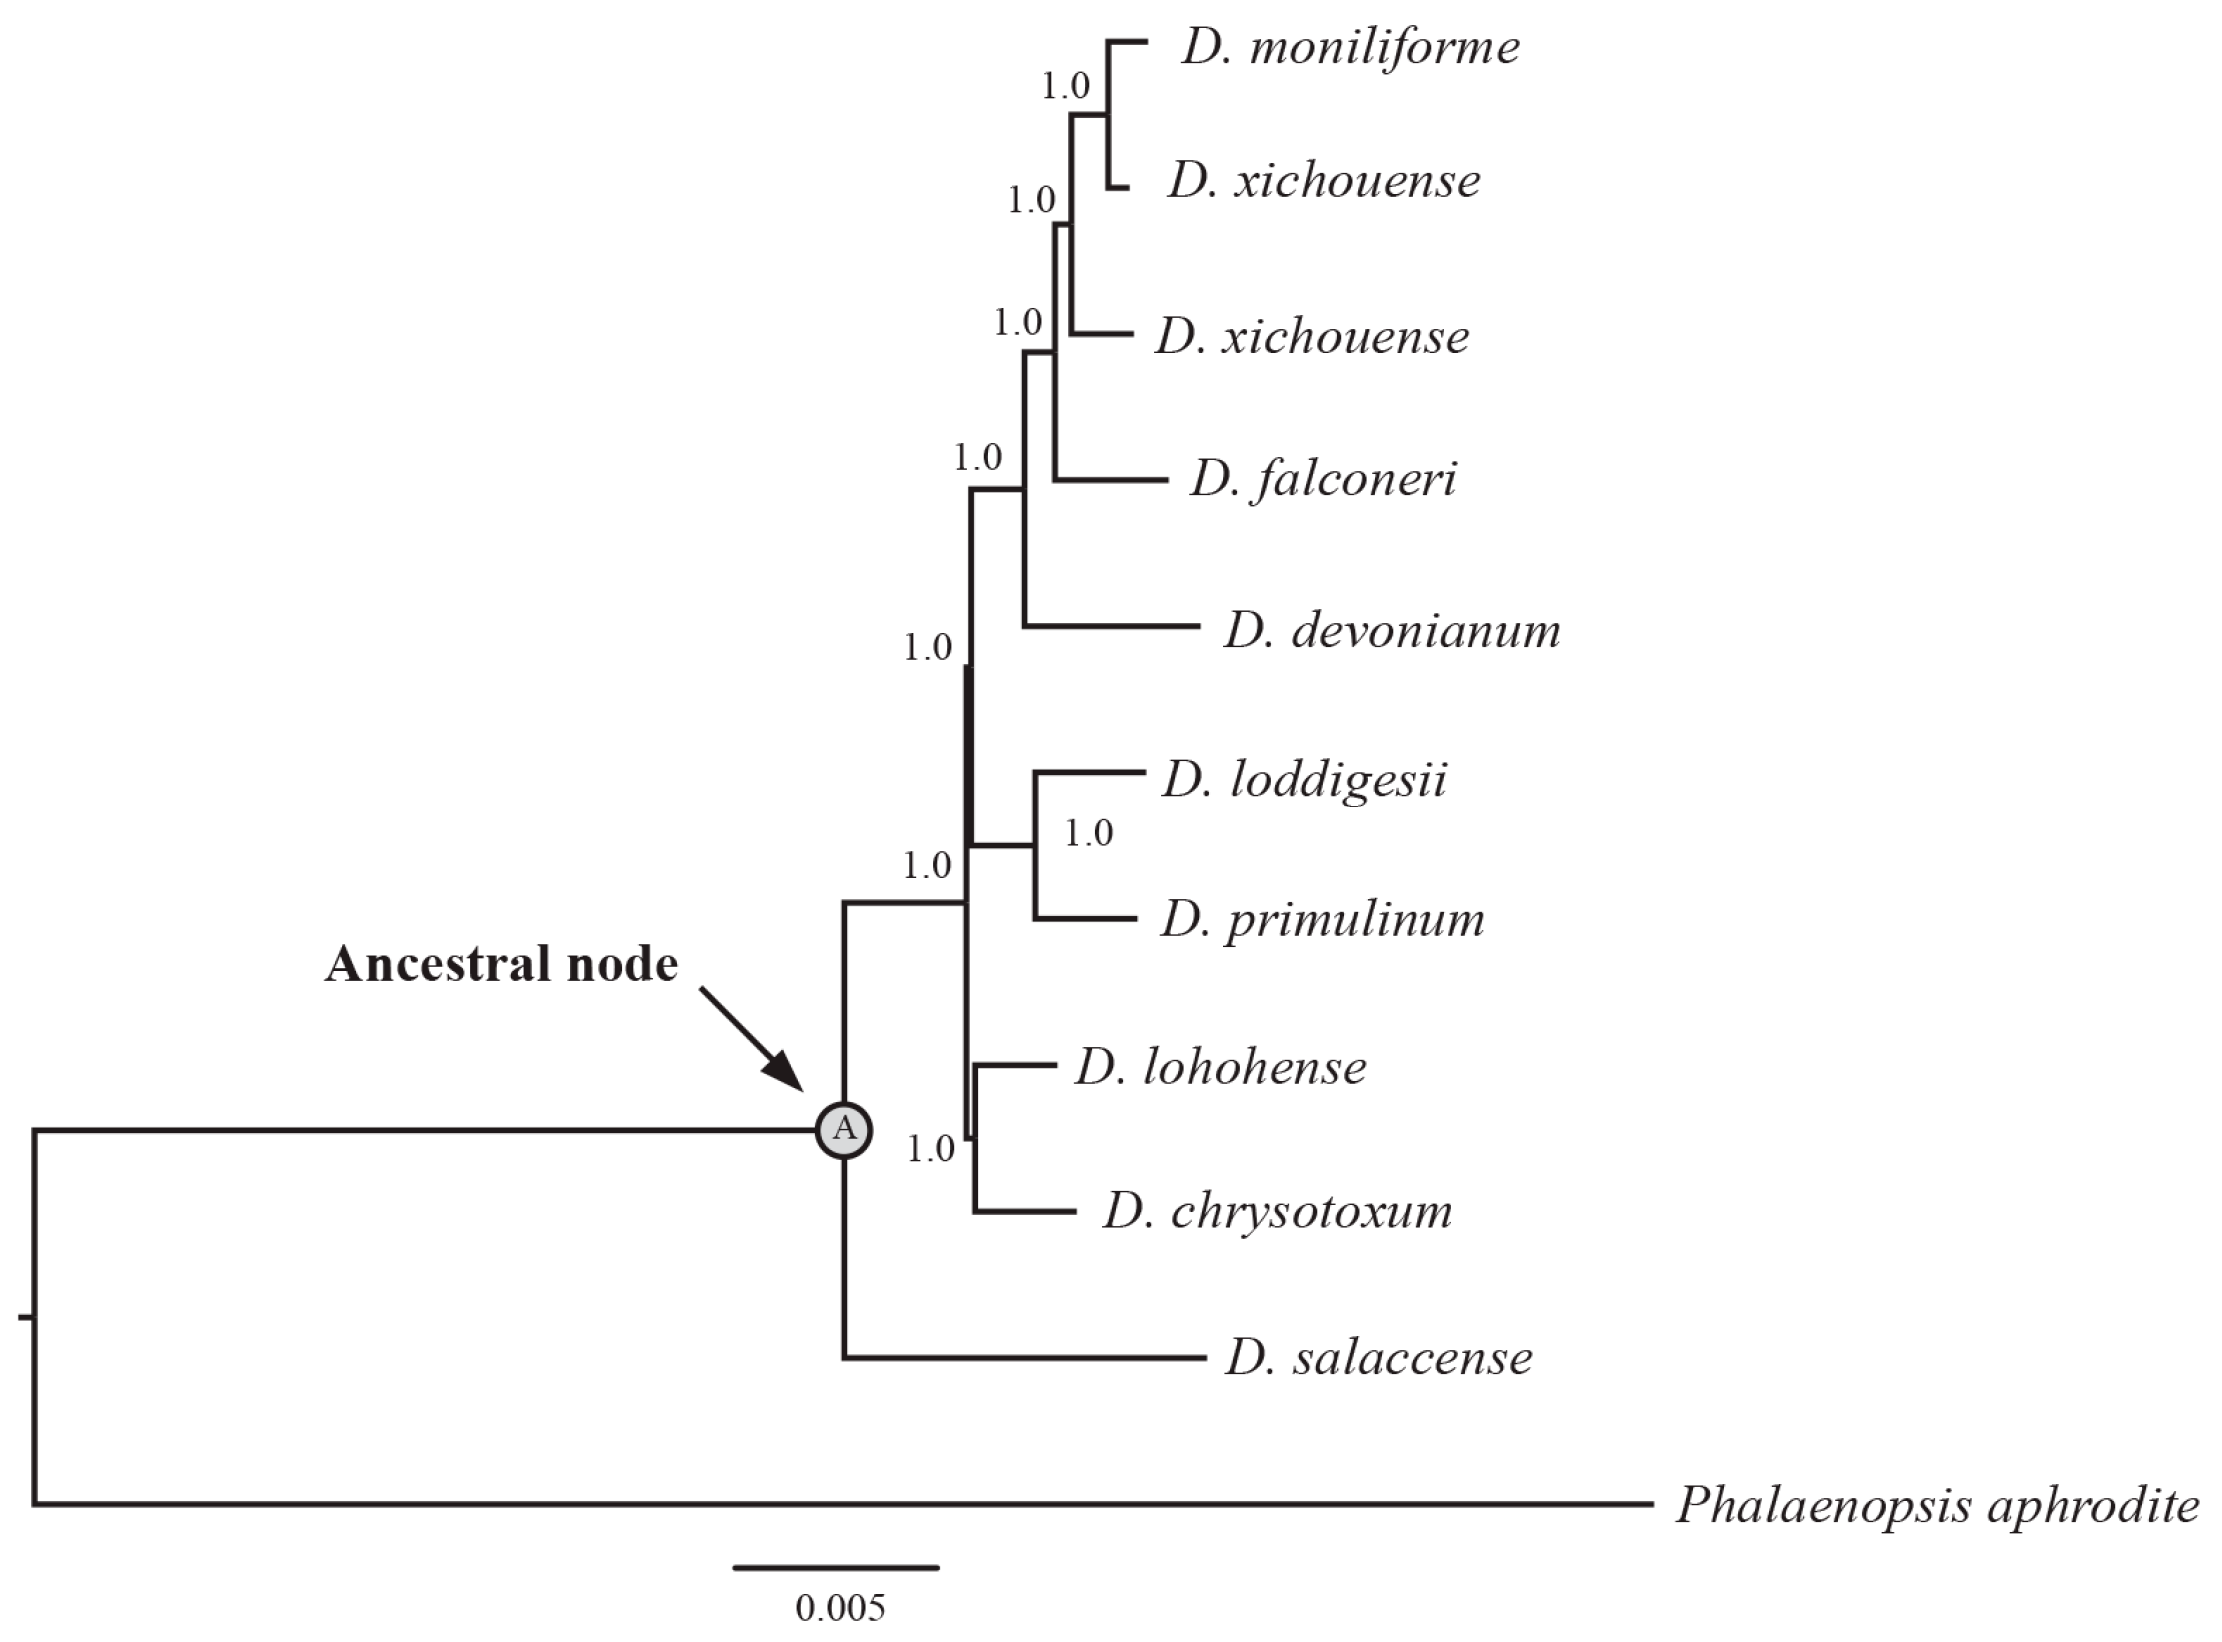
4.3. Phylogenetic Analysis

The plastome sequences of 10 Dendrobium species and Phalaenopsis aphrodite were aligned based on the MAFFT method [51]. The gaps within alignment were excluded. The phylogenetic tree was constructed using MrBayes 3.2 [52]. For the Bayesian inference (BI) analysis, two simultaneous runs were conducted, each consisting of four chains. The parameters were set as “lset nst = 6 rates = γ”. In total, chains were run for 2,000,000 generations, with topologies sampled every 100 generations. The first 25% of our sampled trees were discarded. The remaining trees were used to construct a majority-rule consensus tree and calculate posterior probabilities (PPs) for each node.

4.4. Ancestral Non-Coding Sequences Reconstruction and Calculation of the Relative Rates of the Six Nucleotide Pair Mutations

The non-coding loci, including intergenic and intronic loci, were manually retrieved from the 10 Dendrobium plastome sequences (Table S3). The loci were aligned by using MUSCLE [53] with the “Refining” option implemented in Mega 5.2 [54]. Gaps located at the 5′- and 3′-ends of alignments were excluded, and then concatenated using SequenceMatrix 1.8 [55]. The alignment of non-coding loci was divided into SC and IR data sets based on their locations. The ancestral non-coding sequences of 10 Dendrobium species were reconstructed using the maximum likelihood (ML) method with GTR + G model in Mega 5.2. The BI tree inferred from whole plastome sequences was designated as the “user tree”. DAMBE 5 [56] was used to count the nucleotide changes between ancestral and current sequences. After that, we calculated the relative rates of the six nucleotide pair mutations. Firstly, we normalized the counts of the mutations from A/T to G/C, C/G, or T/A, and followed Hershberg and Petrov’s method (2010) by multiplying them with current genome wide number of GC sites/AT sites [57]. For example, the normalized number of A to G mutations in D. loddigesii = the number of A to G changes between ancestral sequence and the current sequence of D. loddigesii × the current number of GC sites/AT sites. In this way, we could determine the expected number of mutations under equal GC and AT contents. Then, the relative rates of each nucleotide mutation were calculated with the formula = the number of mutations from G/C or the normalized number of mutations from A/T/(the total number of mutations from G/C + the normalized total number of mutations from A/T) × 100.

4.5. Estimation of GCeq

The GCeq values were estimated according to the method of Hershberg and Petrov (2010) [57] and Wu et al., 2015 [17]. The GCeq values were calculated as: rate of AT to GC/(rate of AT to GC + rate of GC to AT). The rate of AT to GC = the total number of AT to GC changes/the current number of AT sites, while the rate of GC to AT = the total number of GC to AT changes/the current number of GC sites. The SC and IR data sets including ancestral and current sequences were bootstrapped with 100 replications using PHYLIP 3.695 [58]. Then, the GCeq values were recalculated 100 times and the resulting values were used to estimate the 95% confidence intervals for GCeq.

4.6. Natural Selection Analysis and Evolutionary Stasis of Protein-Coding Genes

Except for the 11 ndh genes, positive selection analysis was performed for the other 68 protein-coding genes using the codeml program in PAML vs. 4.9 [59]. The natural selection at the codon level was detected using the three pairs of site models (M0 vs. M3, M1a vs. M2a, and M7 vs. M8) as implemented in codeml. The likelihood ratio tests (LRTs) were used to compare the site models. The relative rates of the six nucleotide pair mutations and GCeq values of protein-coding genes were also counted.

4.7. Estimation of Substitution Rates

The synonymous (ds) and non-synonymous (dn) substitution rates were estimated with the codeml program of PAML [59]. The parameters were set to the following: seqtype = 1, runmodel = −2, and CodonFreq = 3. The protein-coding genes of Phalaenopsis aphrodite were used as the reference. The non-coding loci that flanked by the same genes/exons were identified as syntenic. The loci with sequence lengths less than 150 bp were discarded. The mutation rates between P. aphrodite and the 10 Dendrobium species were estimated with the baselml program of PAML using the REV model [59].

4.8. Statistical Analysis

Statistical analyses were performed using SPSS Statistics 20.0.

5. Conclusions

In conclusion, this study is the first to observe the impact of evolutionary forces, selection, mutational biases, and GC-biased gene conversion (gBGC) on the variation of GC content in the whole plastome sequences. The high-quality complete plastomes of D. loddigesii and D. devonianum were obtained and compared with eight other Dendrobium plastomes. The results indicate that the plastomes of Dendrobium species are highly conserved in plastomic organization. Because tentative errors generated by different assembly methods can lead to low quality of plastome sequence, we thus strongly suggest using two different assembly methods in the plastome assembly analysis. Furthermore, we examined three major hypotheses based on the plastome sequences of 10 Dendrobium species. Our results demonstrated that both mutational biases and gBGC affect GC content in the plastomes of the Dendrobium genus.

Supplementary Materials

Supplementary materials can be found at www.mdpi.com1422-0067/18/11/2307/s1.

Acknowledgments

This work was supported by the National Natural Science Foundation of China (Grant No. 31170300 and No. 31670330) and the Priority Academic Program Development of Jiangsu Higher Education Institutions to Xiaoyu Ding.

Author Contributions

Xiaoyu Ding and Zhitao Niu designed the study topic. Zhitao Niu, Hui Wang, Xuezhu Xie, and Shuying Zhu performed the experiments. Zhitao Niu, Qingyun Xue, and Wei Liu analyzed data. Zhitao Niu wrote the manuscript. Xiaoyu Ding, Zhitao Niu, and Qingyun Xue revised the final version of manuscript. All authors read and approved the final manuscript.

Conflicts of Interest

The authors declare no conflict of interest.

References

  1. Raubeson, L.A.; Jansen, R.K. Chloroplast genomes of plants. In Plant Diversity and Evolution: Genotypic and Phenotypic Variation in Higher Plants; Henry, R.J., Ed.; CAB International: London, UK, 2005; pp. 45–68. [Google Scholar]
  2. Wolfe, K.H.; Li, W.H.; Sharp, P.M. Rates of nucleotide substitution vary greatly among plant mitochondrial, chloroplast, and nuclear DNAs. Proc. Natl. Acad. Sci. USA 1987, 84, 9054–9058. [Google Scholar] [CrossRef] [PubMed]
  3. Wu, C.S.; Lai, Y.T.; Lin, C.P.; Wang, Y.N.; Chaw, S.M. Evolution of reduced and compact chloroplast genomes (cpDNAs) in gnetophytes: Selection toward a lower-cost strategy. Mol. Phylogenet. Evol. 2009, 52, 115–124. [Google Scholar] [CrossRef] [PubMed]
  4. Eyre-Walker, A.; Hurst, L.D. The evolution of isochores. Nat. Rev. Genet. 2001, 2, 549–555. [Google Scholar] [CrossRef] [PubMed]
  5. Mukhopadhyay, P.; Basak, S.; Ghosh, T.C. Nature of selective constraints on synonymous codon usage of rice differs in GC-poor and GC-rich genes. Gene 2007, 400, 71–81. [Google Scholar] [CrossRef] [PubMed]
  6. Bernardi, G. Isochores and the evolutionary genomics of vertebrates. Gene 2000, 241, 3–17. [Google Scholar] [CrossRef]
  7. Wang, H.C.; Singer, G.A.C.; Hickey, D.A. Mutational bias affects protein evolution in flowering plants. Mol. Biol. Evol. 2004, 21, 90–96. [Google Scholar] [CrossRef] [PubMed]
  8. Günther, T.; Lampei, C.; Schmid, K.J. Mutational bias and gene conversion affect the intraspecific nitrogen stoichiometry of the Arabidopsis thaliana transcriptome. Mol. Biol. Evol. 2013, 30, 561–568. [Google Scholar] [CrossRef] [PubMed]
  9. Fryxell, K.J.; Zuckerkandl, E. Cytosine deamination plays a primary role in the evolution of mammalian isochores. Mol. Biol. Evol. 2000, 17, 1371–1383. [Google Scholar] [CrossRef] [PubMed]
  10. Marais, G. Biased gene conversion: Implications for genome and sex evolution. Trends Genet. 2003, 19, 330–338. [Google Scholar] [CrossRef]
  11. Duret, L.; Galtier, N. Biased gene conversion and the evolution of mammalian genomic landscapes. Annu. Rev. Genom. Hum. Genet. 2009, 10, 285–311. [Google Scholar] [CrossRef] [PubMed]
  12. Smith, D.R.; Lee, R.W. Mitochondrial genome of the colorless green alga Polytomella capuana: A linear molecule with an unprecedented GC content. Mol. Biol. Evol. 2008, 25, 487–496. [Google Scholar] [CrossRef] [PubMed]
  13. Pessia, E.; Popa, A.; Mousset, S.; Rezvoy, C.; Duret, L.; Marais, G.A.B. Evidence for widespread GC-biased gene conversion in eukaryotes. Genome Biol. Evol. 2012, 4, 675–682. [Google Scholar] [CrossRef] [PubMed]
  14. Lassalle, F.; Périan, S.; Bataillon, T.; Nesme, X.; Duret, L.; Daubin, V. GC-content evolution in bacterial genomes: The biased gene conversion hypothesis expands. PLoS Genet. 2015, 11, e1004941. [Google Scholar] [CrossRef] [PubMed]
  15. Lesecque, Y.; Mouchiroud, D.; Duret, L. GC-biased gene conversion in yeast is specifically associated with crossovers: Molecular mechanisms and evolutionary significance. Mol. Biol. Evol. 2013, 30, 1409–1419. [Google Scholar] [CrossRef] [PubMed]
  16. Muyle, A.; Serres-Giardi, L.; Ressayre, A.; Escobar, J.; Glémin, S. GC-biased gene conversion and selection affect GC content in the oryza genus (rice). Mol. Biol. Evol. 2011, 28, 2695. [Google Scholar] [CrossRef] [PubMed]
  17. Wu, C.S.; Chaw, S.M. Evolutionary stasis in cycad plastomes and the first case of plastome GC-biased gene conversion. Genome Biol. Evol. 2015, 7, 2000–2009. [Google Scholar] [CrossRef] [PubMed]
  18. Givnish, T.J.; Spalink, D.; Ames, M.; Lyon, S.P.; Hunter, S.J.; Zuluaga, A.; Iles, W.J.D.; Clements, M.A.; Arroyo, M.T.K.; Leebens-Mack, J.; et al. Orchid phylogenomics and multiple drivers of their extraordinary diversification. Proc. Biol. Sci. B 2015, 282, 2108–2111. [Google Scholar] [CrossRef] [PubMed]
  19. Shaw, J.; Shafer, H.L.; Leonard, O.R.; Kovach, M.J.; Schorr, M.; Morris, A.B. Chloroplast DNA sequence utility for the lowest phylogenetic and phylogeographic inferences in angiosperms: The tortoise and the hare IV. Am. J. Bot. 2014, 101, 1987–2004. [Google Scholar] [CrossRef] [PubMed]
  20. Niu, Z.; Xue, Q.; Zhu, S.; Sun, J.; Liu, W.; Ding, X. The complete plastome sequences of four orchid species: Insights into the evolution of the Orchidaceae and the utility of plastomic mutational hotspots. Front. Plant. Sci. 2017, 8, 715. [Google Scholar] [CrossRef] [PubMed]
  21. Luo, J.; Hou, B.W.; Niu, Z.T.; Liu, W.; Xue, Q.Y.; Ding, X.Y. Comparative chloroplast genomes of photosynthetic orchids: Insights into evolution of the Orchidaceae and development of molecular markers for phylogenetic applications. PLoS ONE 2014, 9, e99016. [Google Scholar] [CrossRef] [PubMed]
  22. Niu, Z.; Zhu, S.; Pan, J.; Li, L.; Sun, J.; Ding, X. Comparative analysis of Dendrobium plastomes and utility of plastomic mutational hotspots. Sci. Rep. 2017, 7, 2073. [Google Scholar]
  23. Wood, H.P. The Dendrobiums; Timber Press: Portland, OR, USA, 2006. [Google Scholar]
  24. Feng, S.; Jiang, Y.; Wang, S.; Jiang, M.; Chen, Z.; Ying, Q.; Wang, H. Molecular identification of Dendrobium species (Orchidaceae) based on the DNA barcode ITS2 region and its application for phylogenetic study. Int. J. Mol. Sci. 2014, 16, 21975–21988. [Google Scholar] [CrossRef] [PubMed]
  25. Niu, Z.; Pan, J.; Zhu, S.; Li, L.; Xue, Q.; Liu, W.; Ding, X. Comparative analysis of the complete plastomes of Apostasia wallichii and Neuwiedia singapureana (Apostasioideae) reveals different evolutionary dynamics of IR/SSC boundary among photosynthetic orchids. Front. Plant. Sci. 2017, 8, 1713. [Google Scholar] [CrossRef] [PubMed]
  26. Wu, C.S.; Chaw, S.M. Large-scale comparative analysis reveals the mechanisms driving plastomic compaction, reduction, and inversions in conifers II (cupressophytes). Genome Biol. Evol. 2016, 8, 3740–3750. [Google Scholar] [CrossRef] [PubMed]
  27. Xu, H.; Hou, B.; Zhang, J.; Min, T.; Yuan, Y.; Niu, Z.; Ding, X. Detecting adulteration of Dendrobium officinale by real-time PCR coupled with ARMS. Int. J. Food Sci. Technol. 2012, 47, 1695–1700. [Google Scholar] [CrossRef]
  28. Yan, W.J.; Zhang, J.Z.; Zheng, R.; Sun, Y.L.; Ren, J.; Ding, X.Y. Combination of SYBR Green II and TaqMan Probe in the adulteration detection of Dendrobium devonianum by fluorescent quantitative PCR. Int. J. Food Sci. Technol. 2016, 50, 2572–2578. [Google Scholar] [CrossRef]
  29. Straub, S.C.; Fishbein, M.; Livshultz, T.; Foster, Z.; Parks, M.; Weitemier, K.; Cronn, R.C.; Liston, A. Building a model: Developing genomic resources for common milkweed (Asclepias syriaca) with low coverage genome sequencing. BMC Genom. 2011, 12, 211. [Google Scholar] [CrossRef] [PubMed]
  30. Wysocki, W.P.; Clark, L.G.; Kelchner, S.A.; Burke, S.V.; Pires, J.C.; Edger, P.P.; Mayfield, D.R.; Triplett, J.K.; Columbus, J.T.; Ingram, A.L.; et al. A multi-step comparison of short-read full plastome sequence assembly methods in grasses. Taxon 2014, 63, 899–910. [Google Scholar]
  31. Kim, K.; Lee, S.C.; Lee, J.; Yu, Y.; Yang, T.J.; Choi, B.S.; Koh, H.; Waminal, N.E.; Choi, H.; Kim, N.; et al. Complete chloroplast and ribosomal sequences for 30 accessions elucidate evolution of Oryza AA genome species. Sci. Rep. 2015, 5, 15655. [Google Scholar] [CrossRef] [PubMed]
  32. Morton, B.R. Chloroplast DNA codon use: Evidence for selection at the psbA locus based on tRNA availability. J. Mol. Evol. 1993, 3, 273–280. [Google Scholar] [CrossRef]
  33. Tatarinova, T.V.; Alexandrov, N.N.; Bouck, J.B.; Feldmann, K.A. GC3 biology in corn, rice, sorghum and other grasses. BMC Genom. 2010, 11, 308. [Google Scholar] [CrossRef] [PubMed]
  34. Tatarinova, T.; Elhaik, E.; Pellegrini, M. Cross-species analysis of genic GC3 content and DNA methylation patterns. Genome Biol. Evol. 2013, 5, 1443–1456. [Google Scholar] [CrossRef] [PubMed]
  35. Shi, X.; Wang, X.; Li, Z.; Zhu, Q.; Yang, J.; Ge, S. Evidence that natural selection is the primary cause of the guanine-cytosine content variation in rice genes. J. Integr. Plant Biol. 2007, 49, 1393–1399. [Google Scholar] [CrossRef]
  36. McCoy, S.R.; Kuehl, J.V.; Boore, J.L.; Raubeson, L.A. The complete plastid genome sequence of Welwitschia mirabilis: An unusually compact plastome with accelerated divergence rates. BMC Evol. Biol. 2008, 8, 130. [Google Scholar] [CrossRef] [PubMed]
  37. Glémin, S.; Clément, Y.; David, J.; Ressayre, A. GC content evolution in coding regions of angiosperm genomes: A unifying hypothesis. Trends Genet. 2014, 30, 263. [Google Scholar] [CrossRef] [PubMed]
  38. Zhu, A.; Guo, W.; Gupta, S.; Fan, W.; Mower, J.P. Evolutionary dynamics of the plastid inverted repeat: The effects of expansion, contraction, and loss on substitution rates. New Phytol. 2016, 209, 1747–1756. [Google Scholar] [CrossRef] [PubMed]
  39. Drouin, G.; Daoud, H.; Xia, J. Relative rates of synonymous substitutions in the mitochondrial, chloroplast, and nuclear genomes of seed plants. Mol. Phylogenet. Evol. 2008, 49, 827–831. [Google Scholar] [CrossRef] [PubMed]
  40. Galtier, N.; Duret, L.; Glémin, S.; Ranwez, V. GC-biased gene conversion promotes the fixation of deleterious amino acid changes in primates. Trends Genet. 2009, 25, 1–5. [Google Scholar] [CrossRef] [PubMed]
  41. Escobar, J.S.; Glémin, S.; Galtier, N. GC-biased gene conversion impacts ribosomal DNA evolution in vertebrates, angiosperms, and other eukaryotes. Mol. Biol. Evol. 2011, 28, 2561–2575. [Google Scholar] [CrossRef] [PubMed]
  42. Gotea, V.; Elnitski, L. Ascertaining regions affected by GC-biased gene conversion through weak-to-strong mutational hotspots. Genomics 2014, 103, 349–356. [Google Scholar] [CrossRef] [PubMed]
  43. Goubert, C.; Modolo, L.; Vieira, C.; Valientemoro, C.; Mavingui, P.; Boulesteix, M. De novo assembly and annotation of the Asian tiger mosquito (Aedes albopictus) repeatome with dnaPipeTE from raw genomic reads and comparative analysis with the yellow fever mosquito (Aedes aegypti). Genome Biol. Evol. 2015, 7, 1192–1205. [Google Scholar] [CrossRef] [PubMed]
  44. Glémin, S.; Arndt, P.F.; Messer, P.W.; Petrov, D.; Galtier, N.; Duret, L. Quantification of GC-biased gene conversion in the human genome. Genome Res. 2015, 25, 1215–1228. [Google Scholar] [CrossRef] [PubMed]
  45. Palmer, J.D. Chloroplast DNA exists in two orientations. Nature 1983, 301, 92–93. [Google Scholar] [CrossRef]
  46. Khakhlova, O.; Bock, R. Elimination of deleterious mutations in plastid genomes by gene conversion. Plant J. 2006, 46, 85–94. [Google Scholar] [CrossRef] [PubMed]
  47. Li, R.; Fan, W.; Tian, G.; Zhu, H.; He, L. The sequence and de novo assembly of the giant panda genome. Nature 2010, 463, 311–317. [Google Scholar] [CrossRef] [PubMed]
  48. Wyman, S.K.; Jansen, R.K.; Boore, J.L. Automatic annotation of organellar genomes with DOGMA. Bioinformatics 2004, 20, 3252–3255. [Google Scholar] [CrossRef] [PubMed]
  49. Schattner, P.; Brooks, A.N.; Lowe, T.M. The tRNAscan-SE, snoscan and snoGPS web servers for the detection of tRNAs and snoRNAs. Nucleic Acids Res. 2005, 33, W686–W689. [Google Scholar] [CrossRef] [PubMed]
  50. Frazer, K.A.; Pachter, L.; Poliakov, A.; Rubin, E.M.; Dubchak, I. VISTA: Computational tools for comparative genomics. Nucleic Acids Res. 2004, 32, W273–W279. [Google Scholar] [CrossRef] [PubMed]
  51. Katoh, K.; Kuma, K.; Toh, H.; Miyata, T. MAFFT version 5: Improvement in accuracy of multiple sequence alignment. Nucleic Acids Res. 2005, 33, 511–518. [Google Scholar] [CrossRef] [PubMed]
  52. Ronquist, F.; Teslenko, M.; Mark, P.V.D.; Ayres, D.L.; Darling, A.; Höhna, S.; Larget, B.; Liu, L.; Suchard, M.A.; Huelsenbeck, J.P. MrBayes 3.2: Efficient Bayesian phylogenetic inference and model choice across a large model space. Syst. Biol. 2012, 61, 539–542. [Google Scholar] [CrossRef] [PubMed]
  53. Edgar, R.C. MUSCLE: Multiple sequence alignment with high accuracy and high throughput. Nucleic Acids Res. 2004, 32, 1792–1797. [Google Scholar] [CrossRef] [PubMed]
  54. Tamura, K.; Peterson, D.; Peterson, N.; Stecher, G.; Nei, M.; Kumar, S. MEGA5: Molecular evolutionary genetics analysis using maximum likelihood, evolutionary distance, and maximum parsimony methods. Mol. Biol. Evol. 2011, 28, 2731–2739. [Google Scholar] [CrossRef] [PubMed]
  55. Vaidya, G.; Lohman, D.J.; Meier, R. SequenceMatrix: Concatenation software for the fast assembly of multi-gene datasets with character set and codon information. Cladistics 2011, 27, 171–180. [Google Scholar] [CrossRef]
  56. Xia, X. DAMBE5: A comprehensive software package for data analysis in molecular biology and evolution. Mol. Biol. Evol. 2013, 30, 1720–1728. [Google Scholar] [CrossRef] [PubMed]
  57. Hershberg, R.; Petrov, D.A. Evidence that mutation is universally biased towards AT in bacteria. PLoS Genet. 2010, 6, e1001115. [Google Scholar] [CrossRef] [PubMed]
  58. Felsenstein, J. PHYLIP (Phylogeny Inference Package) Version 3.6; Department of Genome Sciences, University of Washington: Seattle, DC, USA, 2005. [Google Scholar]
  59. Yang, Z. PAML 4: Phylogenetic analysis by maximum likelihood. Mol. Biol. Evol. 2007, 24, 1586–1591. [Google Scholar] [CrossRef] [PubMed]
Figure 1. Genome map of two newly sequenced Dendrobium plastomes. Only the plastome of D. loddigesii is shown because it has an identical structure with D. devonianum. Genes outside and inside the circle are transcribed clockwise and counterclockwise, respectively. LSC: large single-copy; SSC: small single-copy; IRA and IRB: two identical inverted repeats.
Ijms 18 02307 g001
Figure 2. Dot-plot analysis of the four Dendrobium plastomes. The Dendrobium plastomes appear to have a nearly identical organization, which indicates that their plastomic organization is highly conserved. The black arrows indicate the different loss/retention of ndh genes.
Ijms 18 02307 g002
Figure 3. The BI tree inferred from whole plastome sequences of Dendrobium species. Tree node labeled with “A” denotes to the ancestor for each Dendrobium species. The values of posterior probabilities are showed for each node.
Ijms 18 02307 g003
Figure 4. Proportion of the six nucleotide-pair mutations estimated from non-coding loci of the SC and IR regions of 10 Dendrobium species. The numbers of A to G mutations are normalized for the unequal nucleotide content of Dendrobium species. The frequencies of transversions are higher than that of transitions in both SC and IR regions.
Ijms 18 02307 g004aIjms 18 02307 g004b
Figure 5. Comparison of equilibrium GC content (GCeq) values between the SC and IR regions for the non-coding regions. Error bars depict 95% confidence intervals for GCeq. Note that, the non-coding regions showed contrast GCeq values (<50% in SC and >50% in IR) in SC and IR regions. Moreover, the estimated GCeq values are lower than current GC content in SC regions, but higher than current GC content in IR regions.
Ijms 18 02307 g005
Figure 6. Proportion of the six nucleotide-pair mutations estimated from protein-coding genes. In contrast to the counting results of non-coding loci, the frequencies of transitions are higher than that of transversions in both SC and IR regions.
Ijms 18 02307 g006
Figure 7. Comparison of GCeq values between the SC and IR regions for the protein-coding genes. Error bars depict 95% confidence intervals for GCeq. The protein-coding genes showed the same evolution trends with the non-coding loci.
Ijms 18 02307 g007
Table 1. Genome feature of the two newly sequenced Dendrobium plastomes.
SpeciesPlastome Length (bp)LSC Length (bp)SSC Length (bp)IR Length (bp)GC Content (%)GC Content of LSC (%)GC Content of SSC (%)GC Content of IR (%)Accession
Dendrobium loddigesii152,49384,08916,93225,73637.3835.6330.5443.57LC317044
Dendrobium devonianum151,71584,89714,31125,80037.5635.1230.6143.51LC317045
Abbreviations: LSC, large single-copy; SSC, small single-copy; IR, inverted repeats.
Table 2. Summary of mutations in non-coding loci.
SpeciesSCIR
Numbers of GC-AT MutationsNumbers of Normalized AT-GC MutationsNumbers of GC-AT MutationsNumbers of Normalized AT-GC Mutations
D. moniliforme22966.6567.74
D. xichouense22665.5886.18
D. officinale22961.9385.39
D. falconeri24876.5464.63
D. devonianum273109.66910.84
D. primulinum22160.7887.71
D. loddigesii21062.25138.62
D. chrysotoxum18861.1017.74
D. lohohense18540.7775.40
D. salaccense452104.40146.92
Table 3. Summary of mutations in protein-coding loci.
SpeciesSCIR
Numbers of GC-AT MutationsNumbers of Normalized AT-GC MutationsNumbers of GC-AT MutationsNumbers of Normalized AT-GC Mutations
D. moniliforme7944.7317.73
D. xichouense11545.9585.78
D. officinale10051.09810.29
D. falconeri9449.2029.66
D. devonianum8953.7155.79
D. primulinum9449.8676.43
D. loddigesii8646.0355.79
D. chrysotoxum15236.24131.28
D. lohohense5948.0435.79
D. salaccense5742.2635.79

