Article

Secondary Metabolic Profiles of Two Cultivars of Piper nigrum (Black Pepper) Resulting from Infection by Fusarium solani f. sp. piperis

by
Shirlley F. M. Da Luz
1,
Lydia F. Yamaguchi
2,
Massuo J. Kato
2,
Oriel F. De Lemos
3,
Luciana P. Xavier
1,
José Guilherme S. Maia
4,
Alessandra De R. Ramos
5,
William N. Setzer
6 and
Joyce Kelly do R. Da Silva
1,*
1
Programa de Pós-Graduação em Biotecnologia, Universidade Federal do Pará, Belém 66075-900, Brazil
2
Laboratório de Química de Produtos Naturais, Instituto de Química, Universidade de São Paulo, São Paulo 05508-000, Brazil
3
Centro de Pesquisa Agroflorestal da Amazônia Oriental, Empresa Brasileira de Pesquisa Agropecuária, Belém 66095-903, Brazil
4
Programa de Pós-Graduação em Recursos Naturais da Amazônia, Universidade Federal do Oeste do Pará, Santarém 68035-110, Brazil
5
Instituto de Estudos em Saúde e Biológicas, Universidade Federal do Sul e Sudeste do Pará, Marabá 68501-970, Brazil
6
Department of Chemistry, University of Alabama in Huntsville, Huntsville, AL 35899, USA
*
Author to whom correspondence should be addressed.
Int. J. Mol. Sci. 2017, 18(12), 2434; https://doi.org/10.3390/ijms18122434
Submission received: 6 October 2017 / Revised: 3 November 2017 / Accepted: 8 November 2017 / Published: 7 December 2017
(This article belongs to the Section Biochemistry)

Abstract

:
Bragantina and Cingapura are the main black pepper (Piper nigrum L.) cultivars and the Pará state is the largest producer in Brazil with about 90% of national production, representing the third largest production in the world. The infection of Fusarium solani f. sp. piperis, the causal agent of Fusarium disease in black pepper, was monitored on the cultivars Bragantina (susceptible) and Cingapura (tolerant), during 45 days’ post infection (dpi). Gas Chromatography-Mass spectrometry (GC-MS) analysis of the volatile concentrates of both cultivars showed that the Bragantina responded with the production of higher contents of α-bisabolol at 21 dpi and a decrease of elemol, mostly at 30 dpi; while Cingapura displayed an decrease of δ-elemene production, except at 15 dpi. The phenolic content determined by the Folin Ciocalteu method showed an increase in the leaves of plants inoculated at 7 dpi (Bragantina) and 7–15 dpi (Cingapura); in the roots, the infection caused a phenolic content decrease in Bragantina cultivar at 45 dpi and an increase in the Cingapura cultivar at 15, 30 and 45 dpi. High Performance Liquid Chromatography-Mass spectrometry (HPLC-MS) analysis of the root extracts showed a qualitative variation of alkamides during infection. The results indicated that there is a possible relationship between secondary metabolites and tolerance against phytopathogens.

Graphical Abstract

1. Introduction

Black pepper (Piper nigrum L.) is by far one of the most important spices and has been used for centuries in food, to treat many ailments, and as cosmeceutical products. It is cultivated in Asian countries such as Malaysia, India, Indonesia, Thailand, Vietnam, China and Sri Lanka, in addition to Madagascar and Brazil [1,2]. In Brazil, the cultivation of P. nigrum started in the 17th century and since 1933, it has been economically explored by Japanese immigrants [3]. Pará state is the largest producer in Brazil, with about 90% of national production, representing the third largest production in the world. Bragantina and Cingapura are the main black pepper cultivars in Brazil. The Bragantina cultivar is a hybrid obtained from South India, also known as “Panniyur”, exhibiting large leaves, heart-shaped and long spikes with an approximate length of 14.0 cm. The Cingapura cultivar, also known as “Kuching”, has small and narrow leaves, short spikes on average of 7.0 cm length. The average production per plant is 3 kg and 2.5 kg of black pepper for Bragantina and Cingapura cultivars, respectively. The amount of the amide piperine, the pungent principle of black pepper, is higher in the fruits of Cingapura (69.1%) cultivar than Bragantina (41.6%) cultivar [4,5].
The phytopathogens Phytophthora capsici (India) and Fusarium solani f. sp. piperis (Brazil) are the causative agents of root rot or Fusarium disease (fusariosis) to the crop of black pepper [6]. The first symptoms of fusariosis start at the roots or branches and promote falling leaves, root rot, and plant death [3]. Pathogens that cause wilting, such as Fusarium solani f. sp. piperis, have a hemibiotrophic life cycle. This and other similar pathogens initially colonize living tissue and, at a later stage, colonize dead tissue [7].
Despite the studies for controlling fusariosis in black pepper, there are no reports on secondary metabolites involved in this plant-pathogen interaction. In general, the plant presents specific defense mechanisms to respond to the attack of pathogens and herbivores, which include the mediation of terpenoid and polyphenolic compounds in the biologic systems [8]. Metabolomics provides a means for comparison between different species, and it can assist in identification of key genes and enzymes involved in various physiological processes, such as biotic and abiotic stresses [9]. The approach is emerging as a promising means of development of biomarkers for the early diagnosis of diseases, interaction mechanism, identification of resistance and susceptibility in various cultures [10]. For example, the infection of mango (Mangifera indica) by Fusarium moniliforme var. subglutinans has increased the production of phenolic compounds [11]; and the volatile compounds of wheat (Triticum aestivum) have been mentioned as the specific biomarkers involved in resistance against Fusarium graminearum infection [12]. Study of metabolomic profiles involved in host-pathogen interaction has revealed significant differences in the composition of secondary metabolites in leaves and roots, indicating that these organs employ distinct chemical defense systems [13]. The analysis by Gas Chromatography-Mass Spectrometry (GC-MS) of the volatile compounds emitted in the interaction between eucalyptus (Eucalyptus globulus) and the pathogen Teratosphaeria nubilosa identified about 40 biomarkers that can diagnose the disease before the observation of symptoms [14].
The understanding of these functions in the defense system of plants is important for obtaining resistant cultivars by biotechnological breeding [15]. Thus, the aim of this study was to identify the volatile constituents produced by the cultivars of Bragantina and Cingapura, during infection by F. solani f. sp. piperis, in order to contribute to the discovery of potentially useful secondary metabolites in the black pepper defense system.

2. Results

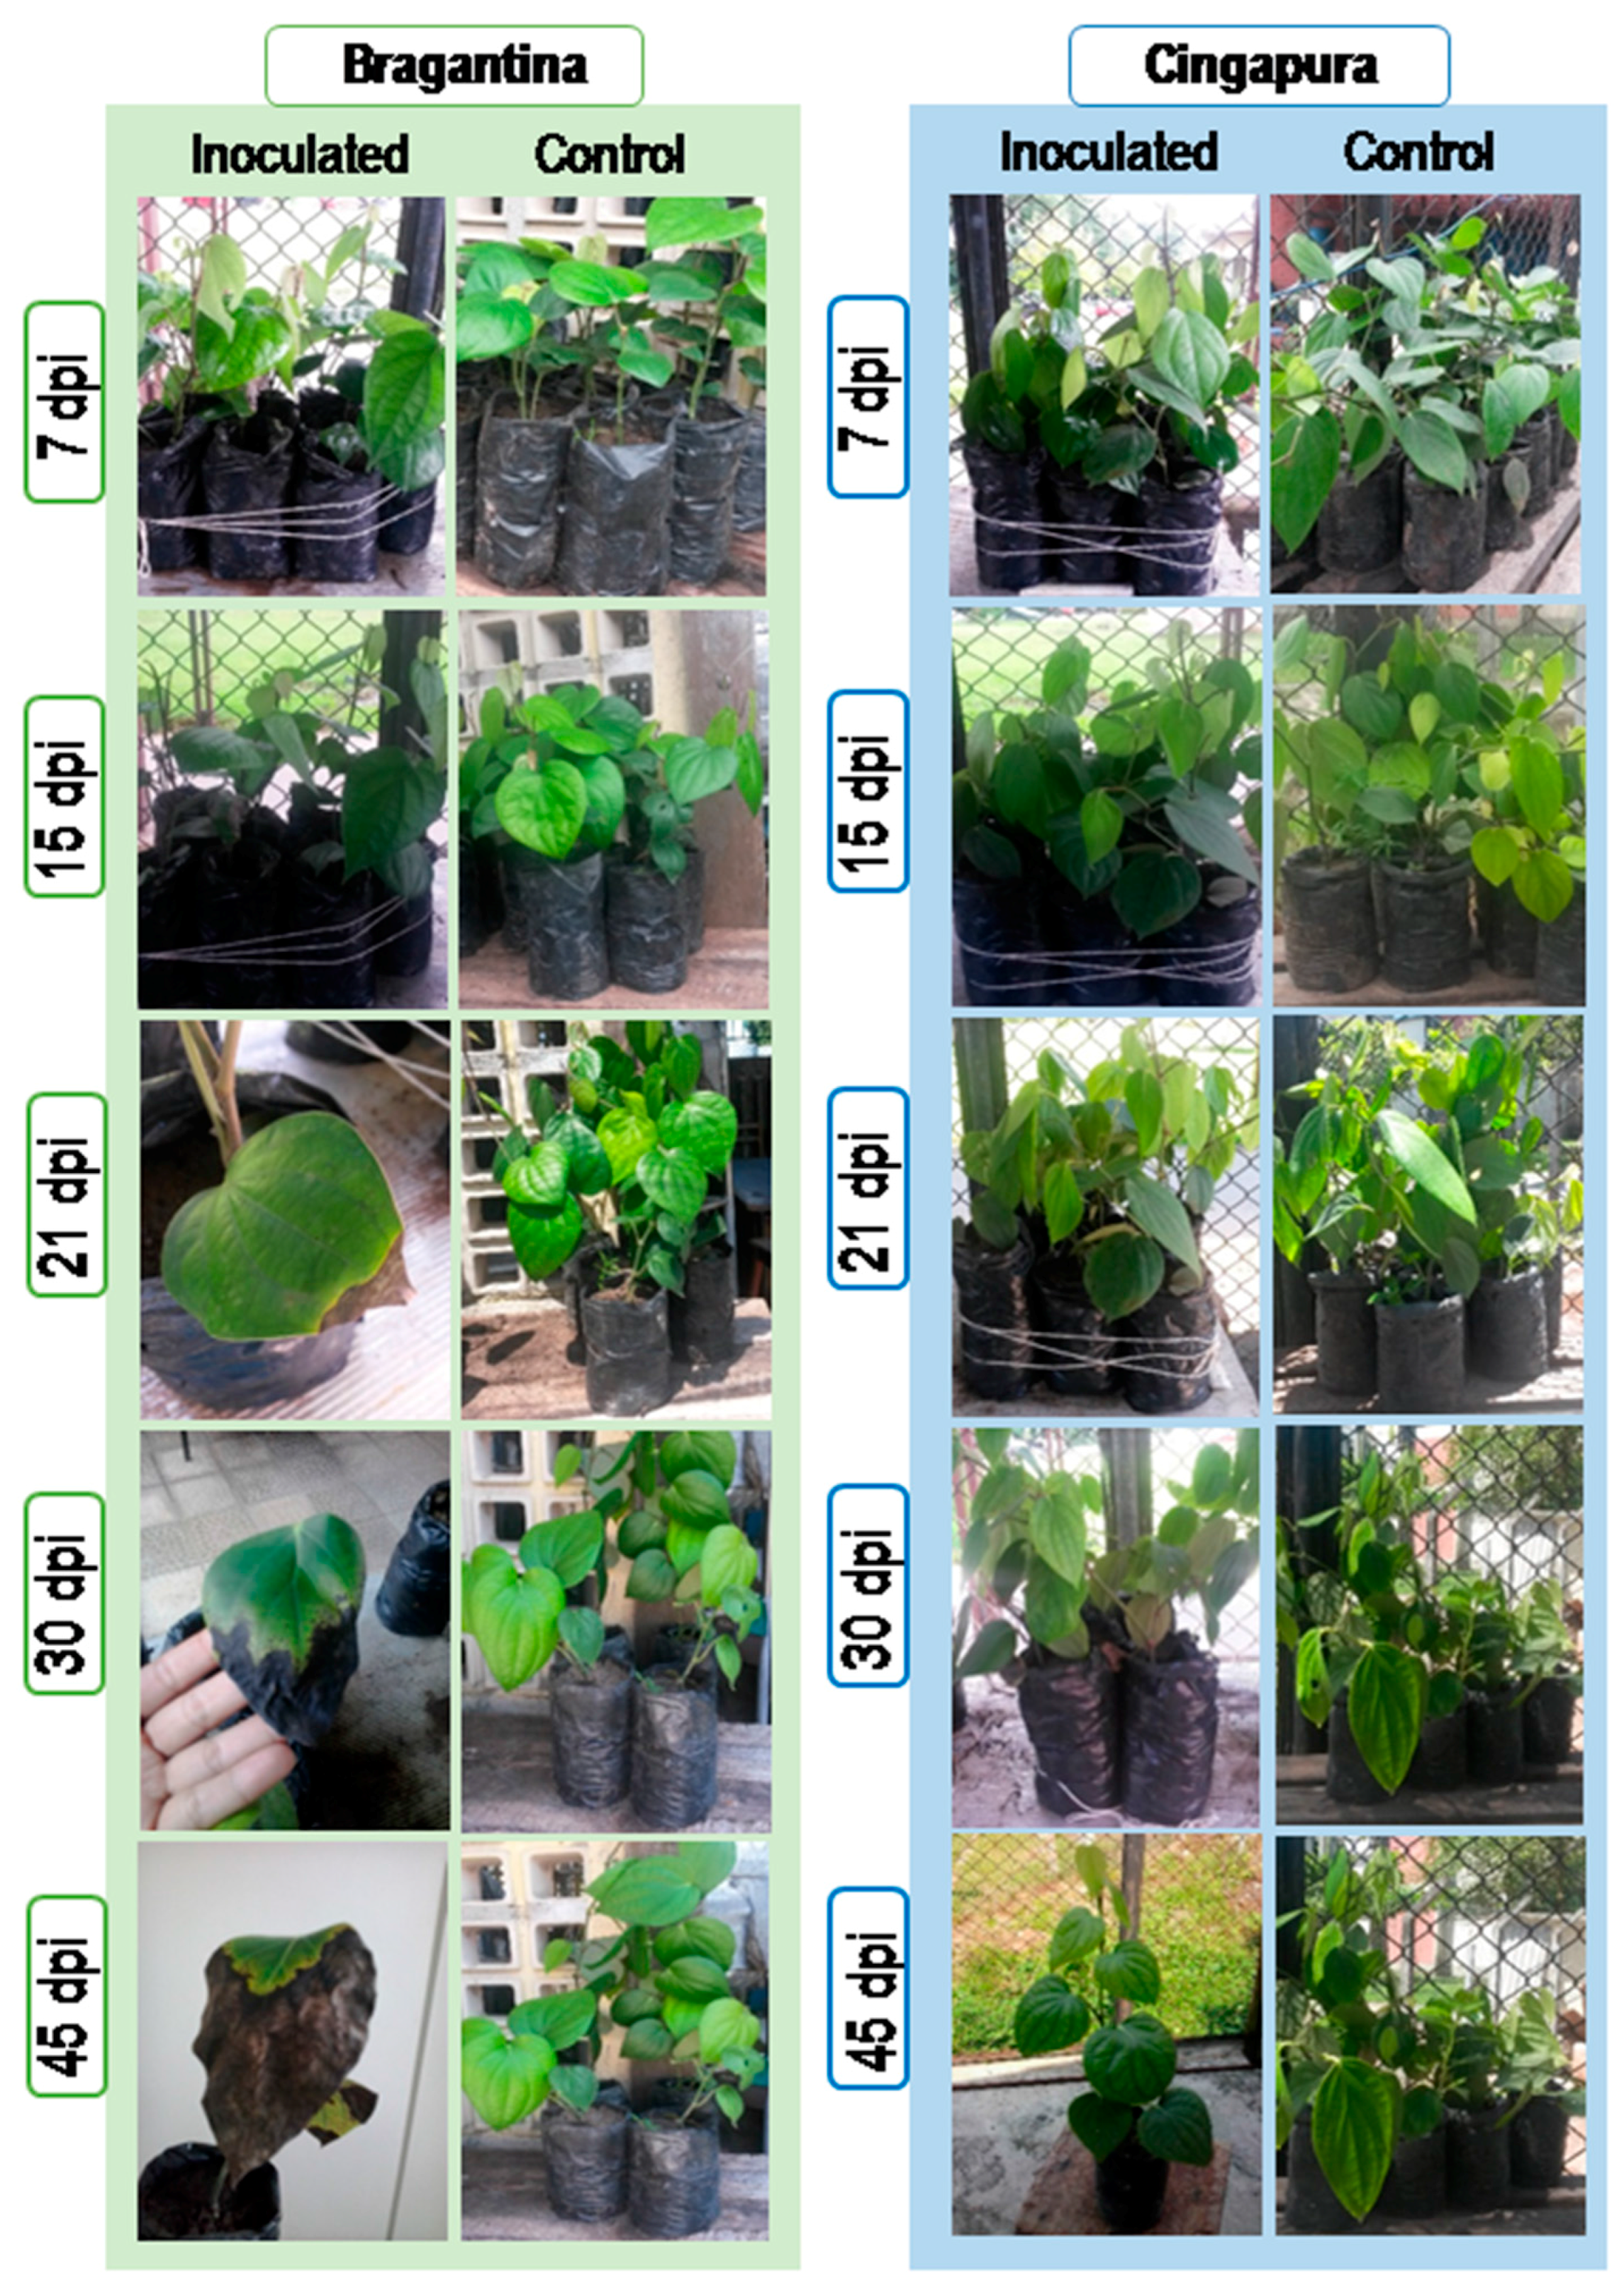
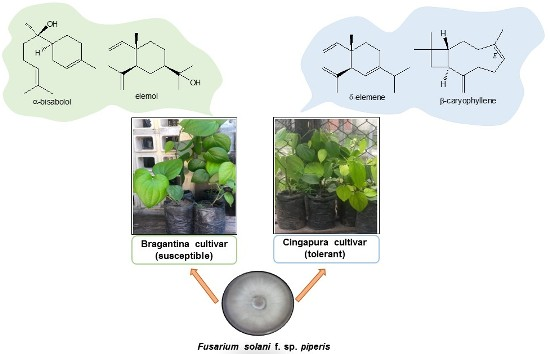
2.1. Evaluation of Susceptibility and Tolerance Of Black Pepper Cultivars after Inoculation with Fusarium solani f. sp. piperis

Progression of the host-pathogen interaction was monitored visually in the periods of 7, 15, 21, 30 and 45 days’ post infection (dpi) (Figure 1). For both cultivars inoculated, no visible foliar symptoms were observed at 7 and 15 dpi. The first symptoms of Fusarium disease were observed at 21 dpi, when the leaves turned yellow in the susceptible Bragantina cultivar (Figure 1, 21 dpi). Disease symptoms progressed rapidly in the Bragantina cultivar, with the partial necrosis of leaves and the total drying of branches (Figure 1, 30 and 45 dpi). On the other hand, the plants of Cingapura cultivar did not display foliar symptoms at all during the 45-day period.

2.2. Profiles of Volatile Compounds of the Black Pepper Cultivars

The P. nigrum leaves, from the Bragantina and Cingapura cultivars, after Fusarium infection, were submitted to simultaneous distillation and extraction to obtain their volatile concentrates. Individual components were identified by comparison of both mass spectrum and gas chromatography (GC) retention data with authentic compounds, previously analyzed and stored in the data system. Commercial libraries, which contained retention indices and mass spectra of volatile compounds commonly found in essential oils were used [16,17]. The GC and GC-MS analysis of the volatile concentrates from inoculated plants (IP) and control plants (CP) allowed the identification of 30 constituents in Bragantina cultivar and 54 components in Cingapura cultivar (Table 1 and Table 2). In the volatile concentrates of Bragantina cultivar, the identified constituents presented an average of 91.6%, with the predominance of oxygenated sesquiterpenes (IP, 77.4%; CP, 82.0%), where α-bisabolol (IP, 56.3%; CP, 51.5%), elemol (IP, 12.6%; CP, 24.0%) were the main compounds, followed by a smaller amount of germacrene D (IP, 3.6%; CP, 4.4%), a sesquiterpene hydrocarbon. For volatile concentrates of Cingapura cultivar the identified constituents showed a median composition of 95.2%, with prevalence of sesquiterpene hydrocarbons (IP, 76.2%; CP, 72.6%), where δ-elemene (IP, 57.1%; CP, 53.3%), α-zingiberene (IP, 4.3%; CP, 5.1%) and β-caryophyllene (IP, 4.2%; CP, 4.7%) were the major components, followed by muurola-4,10(14)-dien-1-β-ol (IP, 4.1%; CP, 4.9%), an oxygenated sesquiterpene.

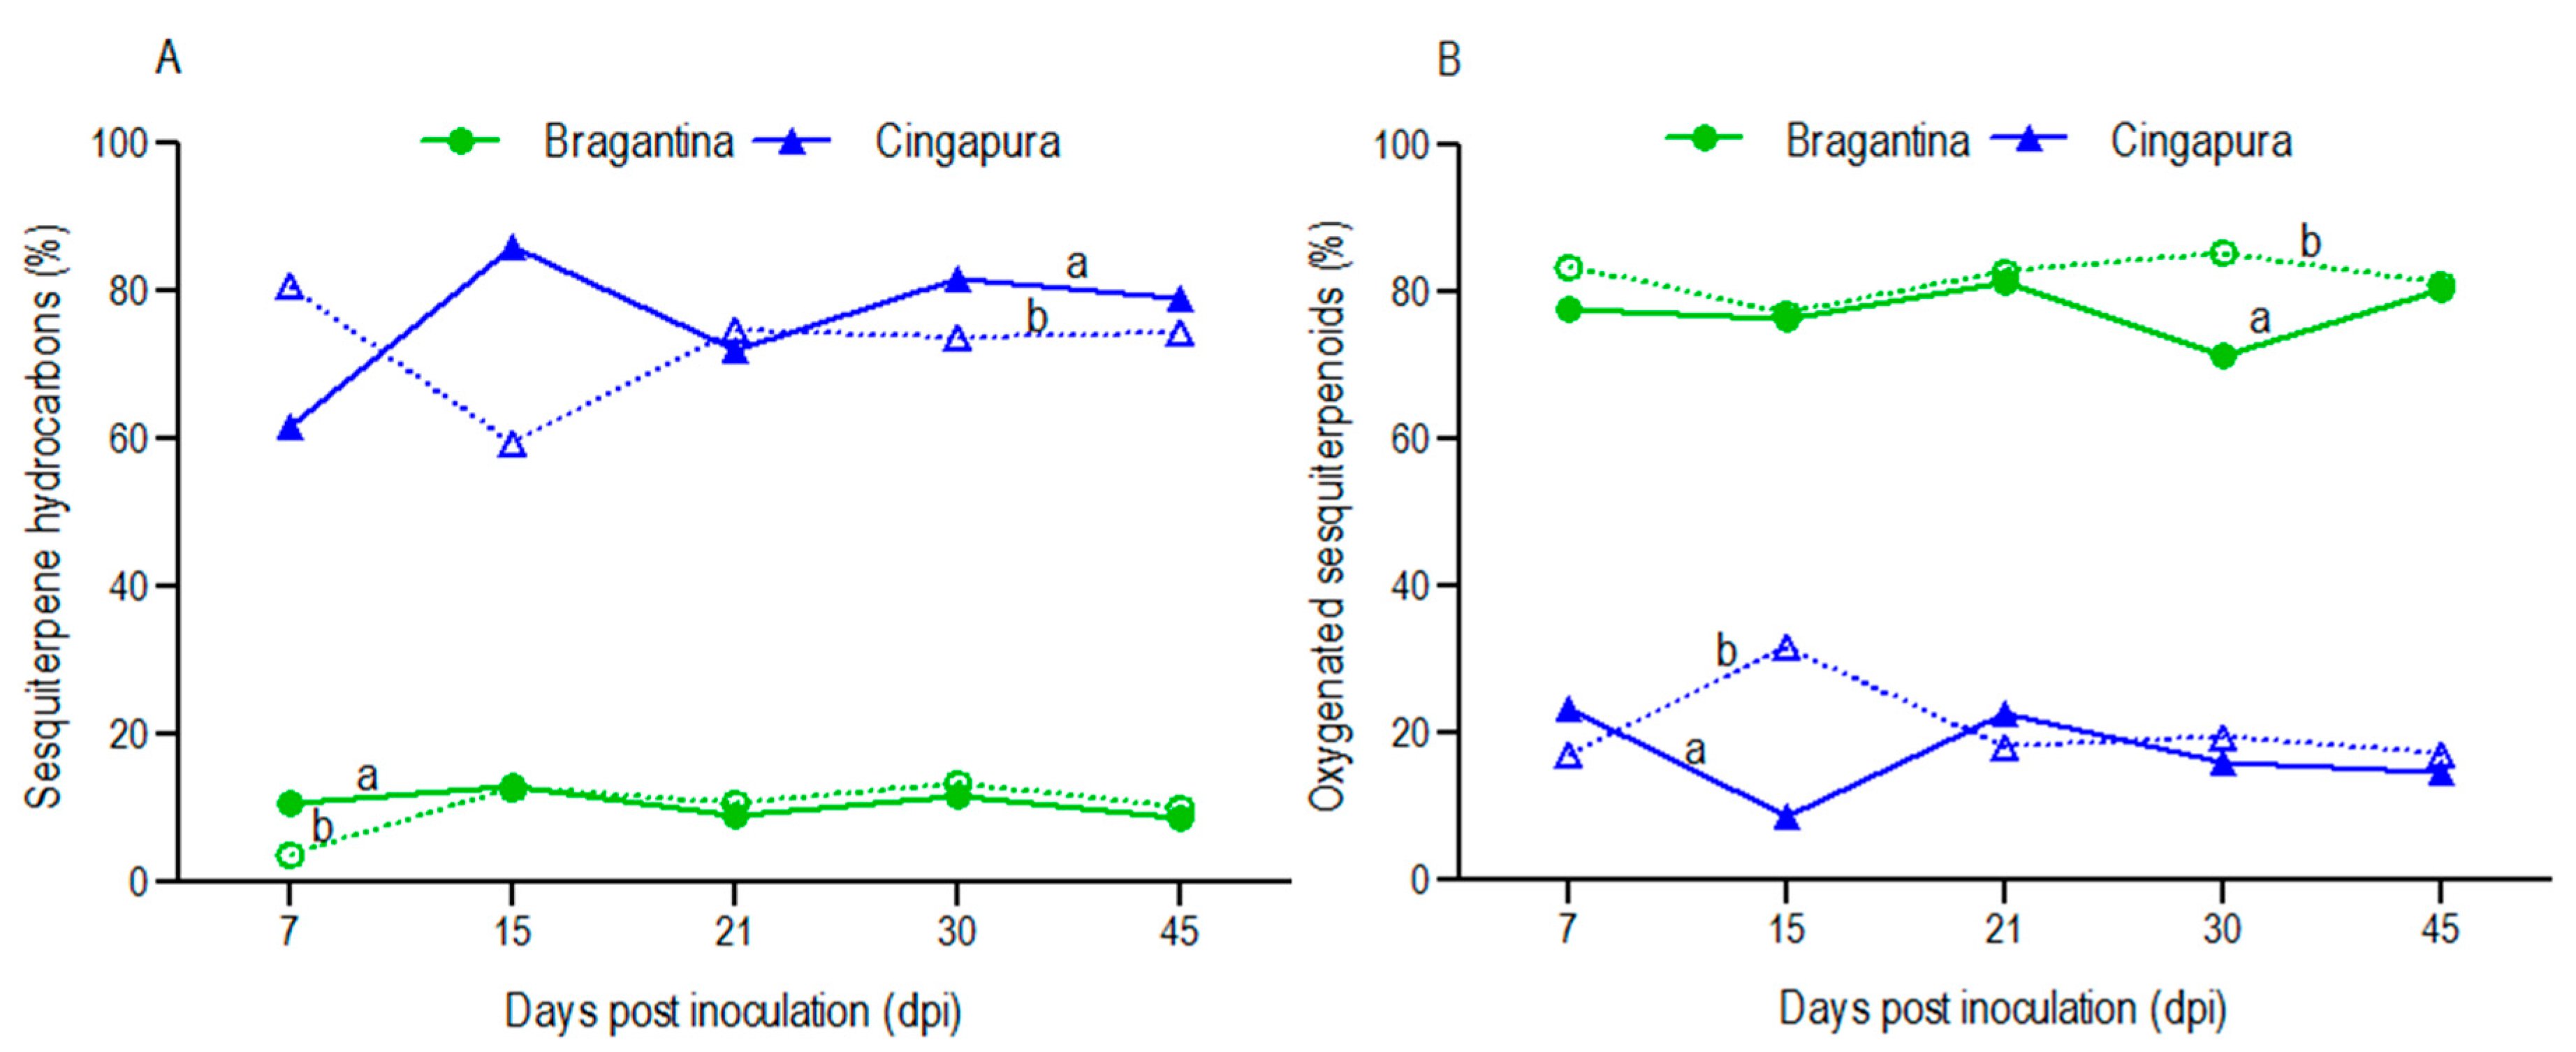
2.3. Variation in Volatile Profiles of the Black Pepper Cultivars, after Fusarium Infection

The volatile concentrates of Bragantina cultivar were dominated by oxygenated sesquiterpenes (IP, 77.4%; CP, 82.0%), followed by sesquiterpene hydrocarbons (IP, 10.7%; CP, 10.2%) as minor compounds (Table 1, Figure 2). The production of oxygenated sesquiterpenes showed a drastic decrease (71.5%) in the inoculated plants, just at 30 dpi, which can be associated with the progress of Fusarium disease during that cultivation period. In contrast, the Cingapura cultivar showed sesquiterpene hydrocarbons as main compounds (IP, 76.2%; CP, 72.6%) and oxygenated sesquiterpenes in minor proportions (IP, 17.1%; CP, 20.7%) (Table 2, Figure 2). An increase in production of sesquiterpene hydrocarbons was observed with inoculated plants at 15, 30 and 45 dpi. On the other hand, the sesquiterpene hydrocarbons content was equivalent in the inoculated and control plants at the 21 dpi.
Inoculated plants (IP) of Bragantina cultivar showed quantitative difference for α-bisabolol and elemol, the main compounds, when compared to control plants (CP) for the duration of cultivation (from 7 to 45 dpi). The production of α-bisabolol was higher at 21 dpi (IP, 64.3%; CP, 51.4%), 30 dpi (IP, 60.1%; CP, 49.8%), and 45 dpi (IP, 60.7%; CP, 54.6%). With respect to elemol, however, the situation was reversed. There was a reduction of its percentage in the inoculated plants when compared to the control plants: 7 dpi (IP, 19.0%; CP, 27.3%), 21 dpi (IP, 15.3%; CP, 28.4%), 30 dpi (IP, 0.7%; CP, 32.9%), and 45 dpi (IP, 3.4%; CP, 9.2%). The content of minor compounds also showed significant variation in the inoculated plant, after the appearance of the symptoms of Fusarium disease. For example, increase of β-bisabolene and E-β-ocimene, decrease of germacrene D, variation for the isomers β-, γ- and δ-elemene, as well as a large production of β-eudesmol at 30 dpi (10.7%) and 45 dpi (14.9%). Other alterations can also be observed in the inoculated Bragantina cultivar. E-β-Ocimene (1.2%), β-caryophyllene (1.0%), germacrene D (4.2%), β-bisabolene (3.6%) (2Z,6Z)-farnesol (1.6%) and (2Z,6E)-farnesol (3.2%) increased above 1%.
Similarly, inoculated plants of Cingapura cultivar also showed qualitative and quantitative differences in the volatile profiles, due to infection, particularly for δ-elemene and β-caryophyllene, their main compounds. δ-Elemene production was higher at 15 dpi (IP, 73.6%; CP, 48.7%), 30 dpi (IP, 61.2%; CP, 57.1%) and 45 dpi (IP, 55.8%; CP, 48.1%). However, β-caryophyllene increased only at 30 dpi (IP, 3.9%; CP, 3.0%) and 45 dpi (IP, 5.4%; CP, 4.9%). The sesquiterpenes α-ylangene (1.2%), β-atlantol (3.4%), 1,10-di-epi-cubebol (1.6%) and eudesma-4,11-dien-2α-ol (1.2%) were produced above 1%, only by inoculated plants at 7 dpi. E-Nerolidol showed a decrease at 7 dpi (IP, 2.7%; CP, 4.8%), 15 dpi (IP, 1.3%; CP, 8.5%), 21 dpi (IP, 3.9%; CP, 6.6%) and 30 dpi (IP, 2.7%; CP, 4.0%).

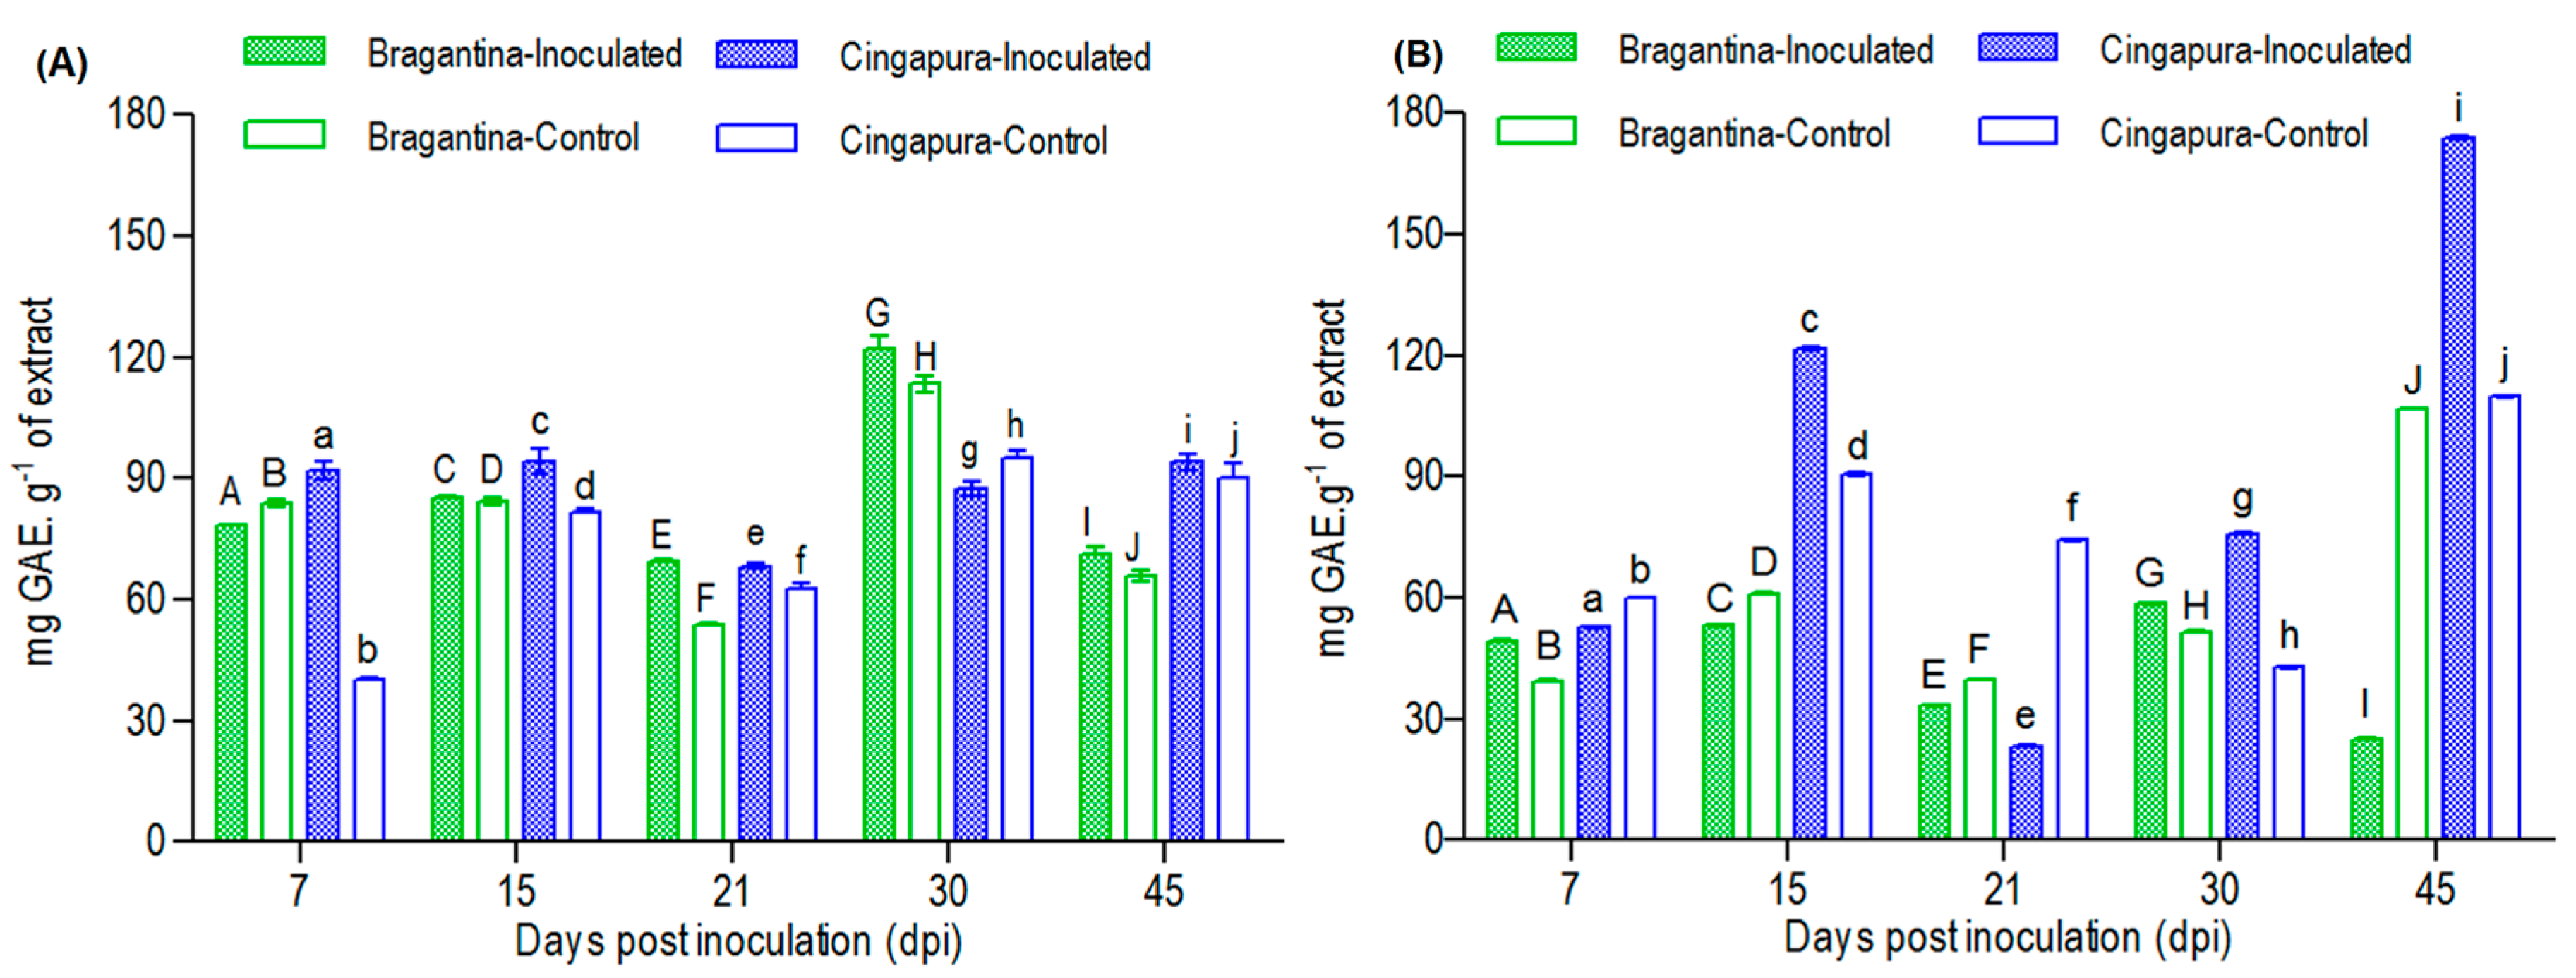
2.4. Variation in Total Phenolic Compounds Profiles of the Black Pepper Cultivars, after the Fusarium Infection

The variation in total phenolic compounds was evaluated in the leaves and roots of Bragantina and Cingapura cultivars, after the inoculation, and expressed as milligrams of gallic acid equivalents per gram of gram of extract (mg GAE·g−1). Bragantina cultivar leaves showed no significant variation, while the Cingapura cultivar presented a significant production in the inoculated plants at 7 dpi, which can be associated as a response to the infection in the early days (Figure 3). Root total phenolic compounds showed different behavior in comparison to the leaves. In the Bragantina cultivar (susceptible to Fusarium) the only significant change was observed at 45 dpi, which was a dramatic decrease of total phenolic compounds in the inoculated plants, when compared to control plants (IP, 39.9 mg GAE·g−1; CP, 91.9 mg GAE·g−1). On the other hand, Cingapura cultivar (tolerant to Fusarium) produced higher content of total phenolic compounds in the inoculated plants at 15 (IP, 91.9 mg GAE·g−1; CP, 39.9 mg GAE·g−1), 30 (IP, 75.8 mg GAE·g−1; CP, 42.6 mg GAE·g−1) and 45 dpi (IP, 173.8 mg GAE·g−1; CP, 108.7 mg GAE·g−1) (Figure 3). Conversely, there was a decrease in total phenolic compounds at 21 dpi (IP, 23.2 mg GAE·g−1; CP, 74.1 mg GAE·g−1), which could be related to the beginning of the development cycle of Fusarium, since the first symptoms for the susceptible cultivars were observed in this period.

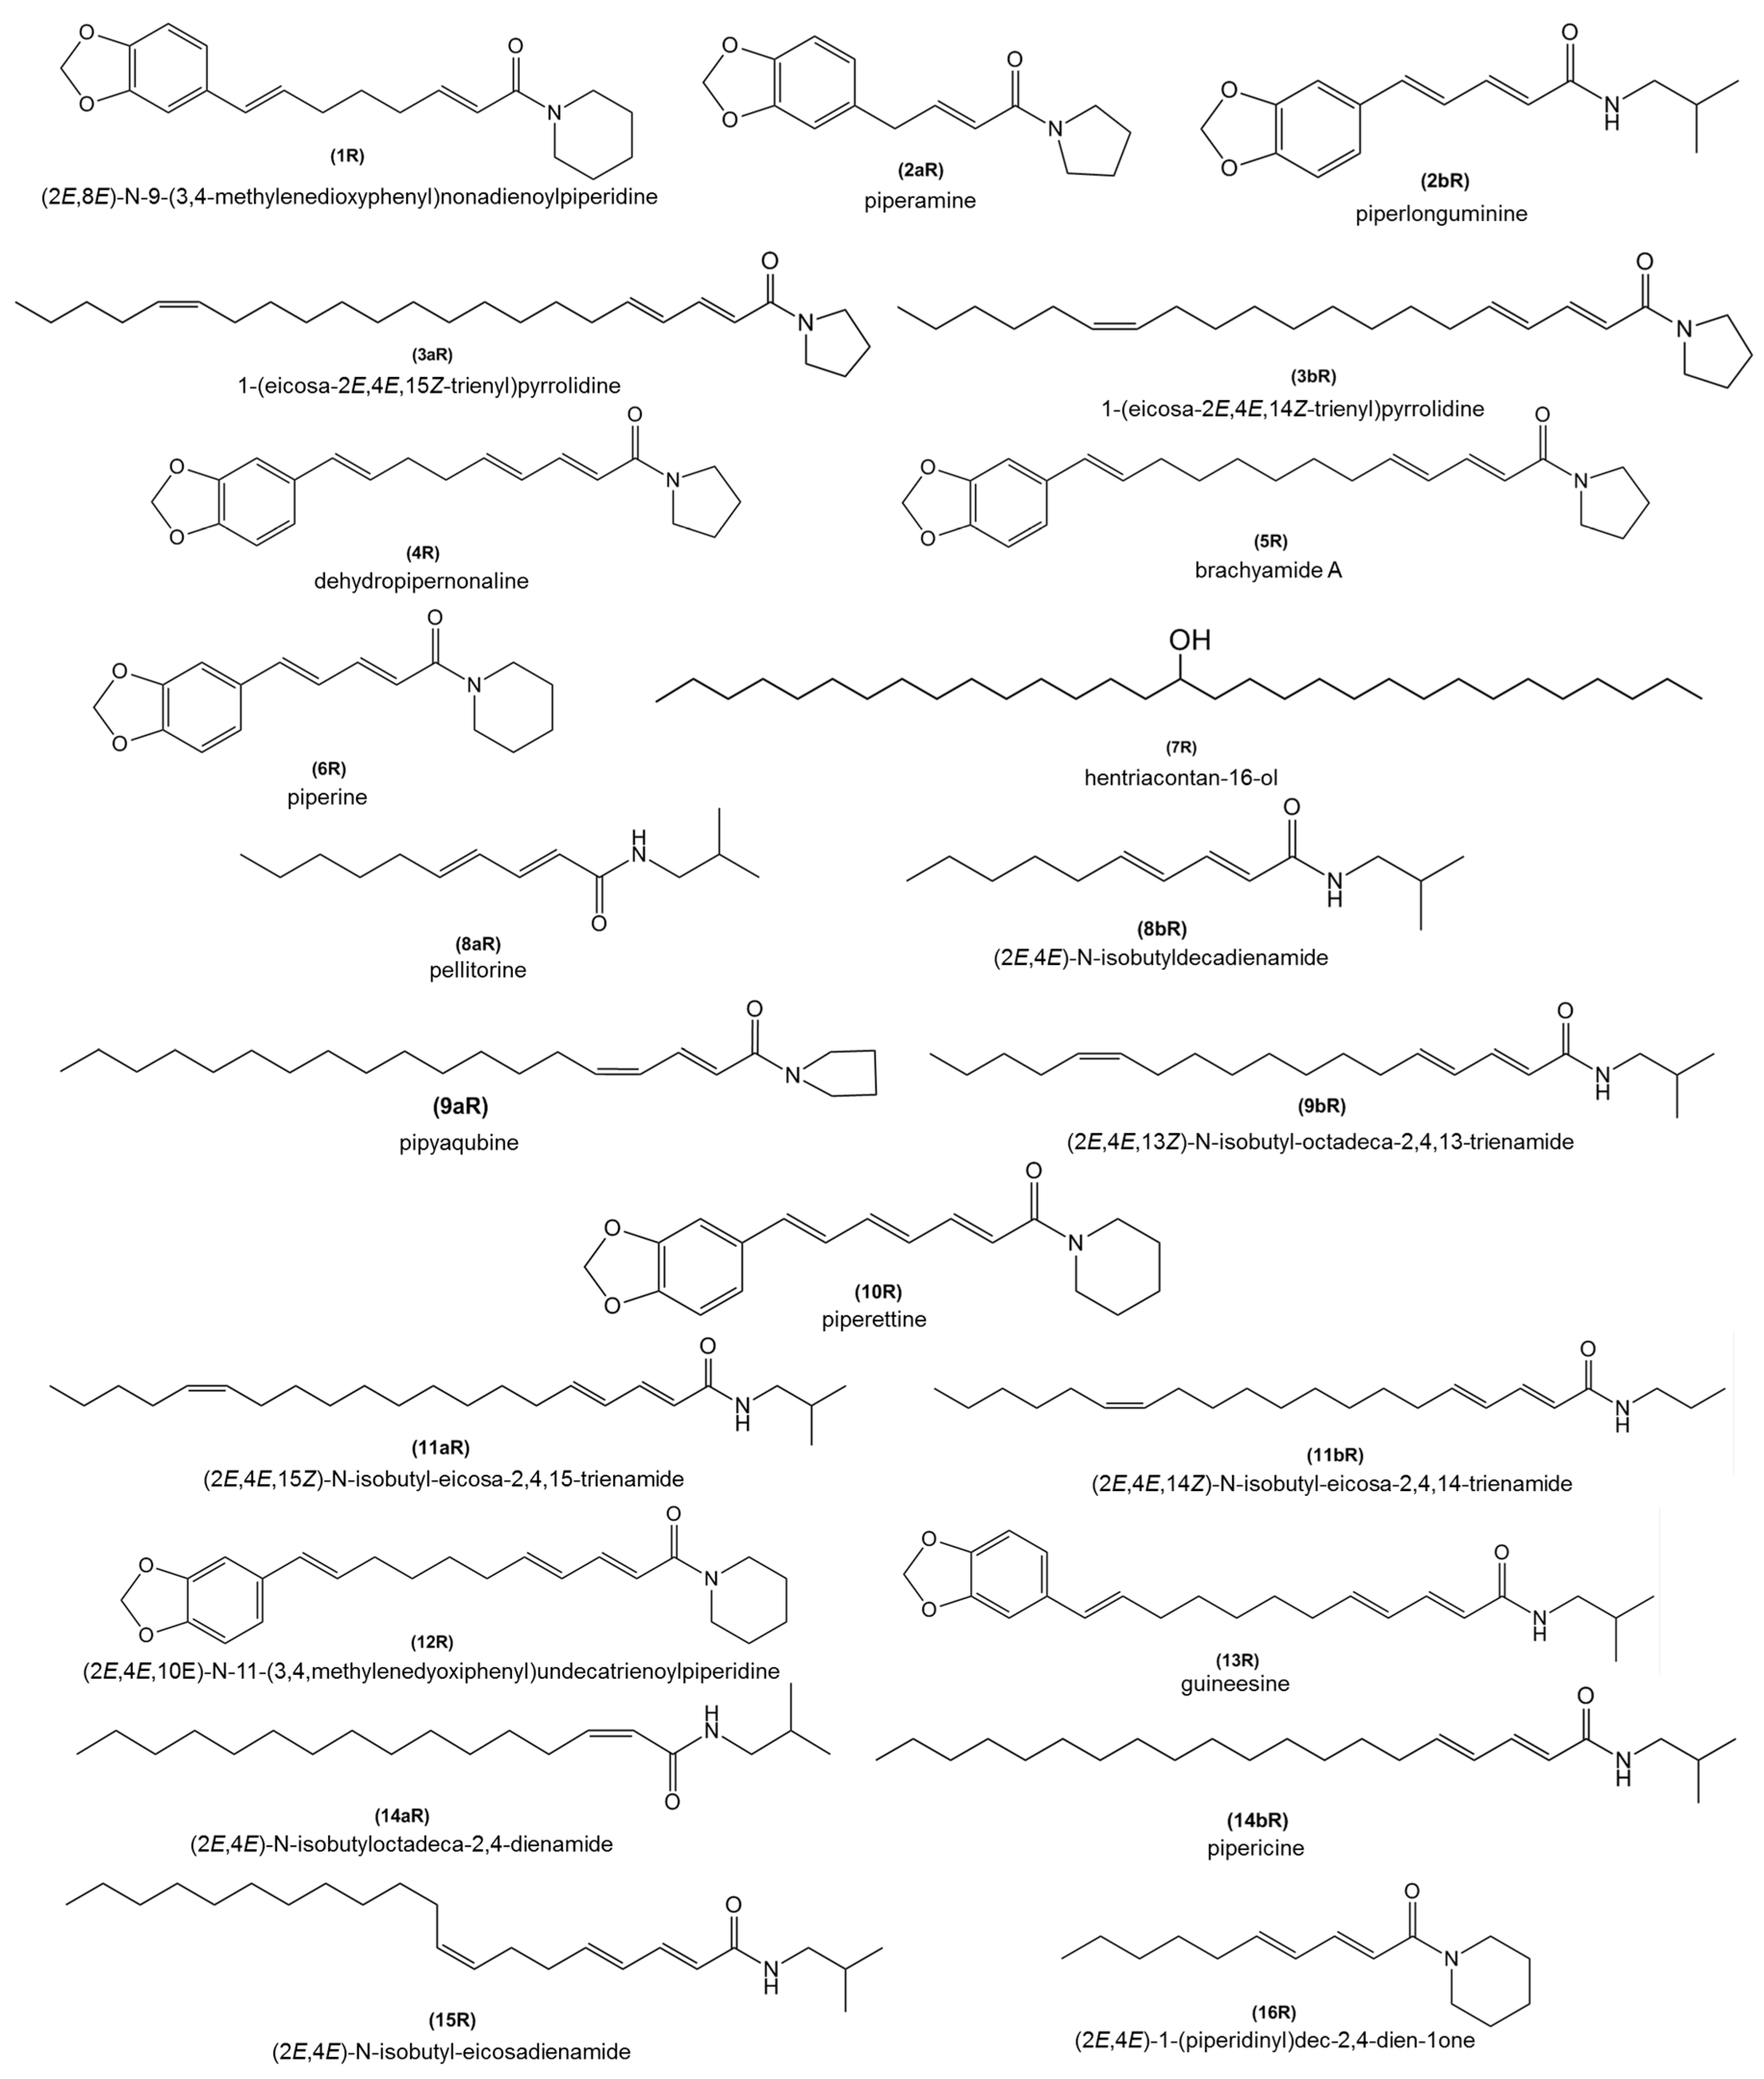
2.5. Chemical Profiles of the Root Extracts from Bragantina and Cingapura Cultivars, after Fusarium Infection
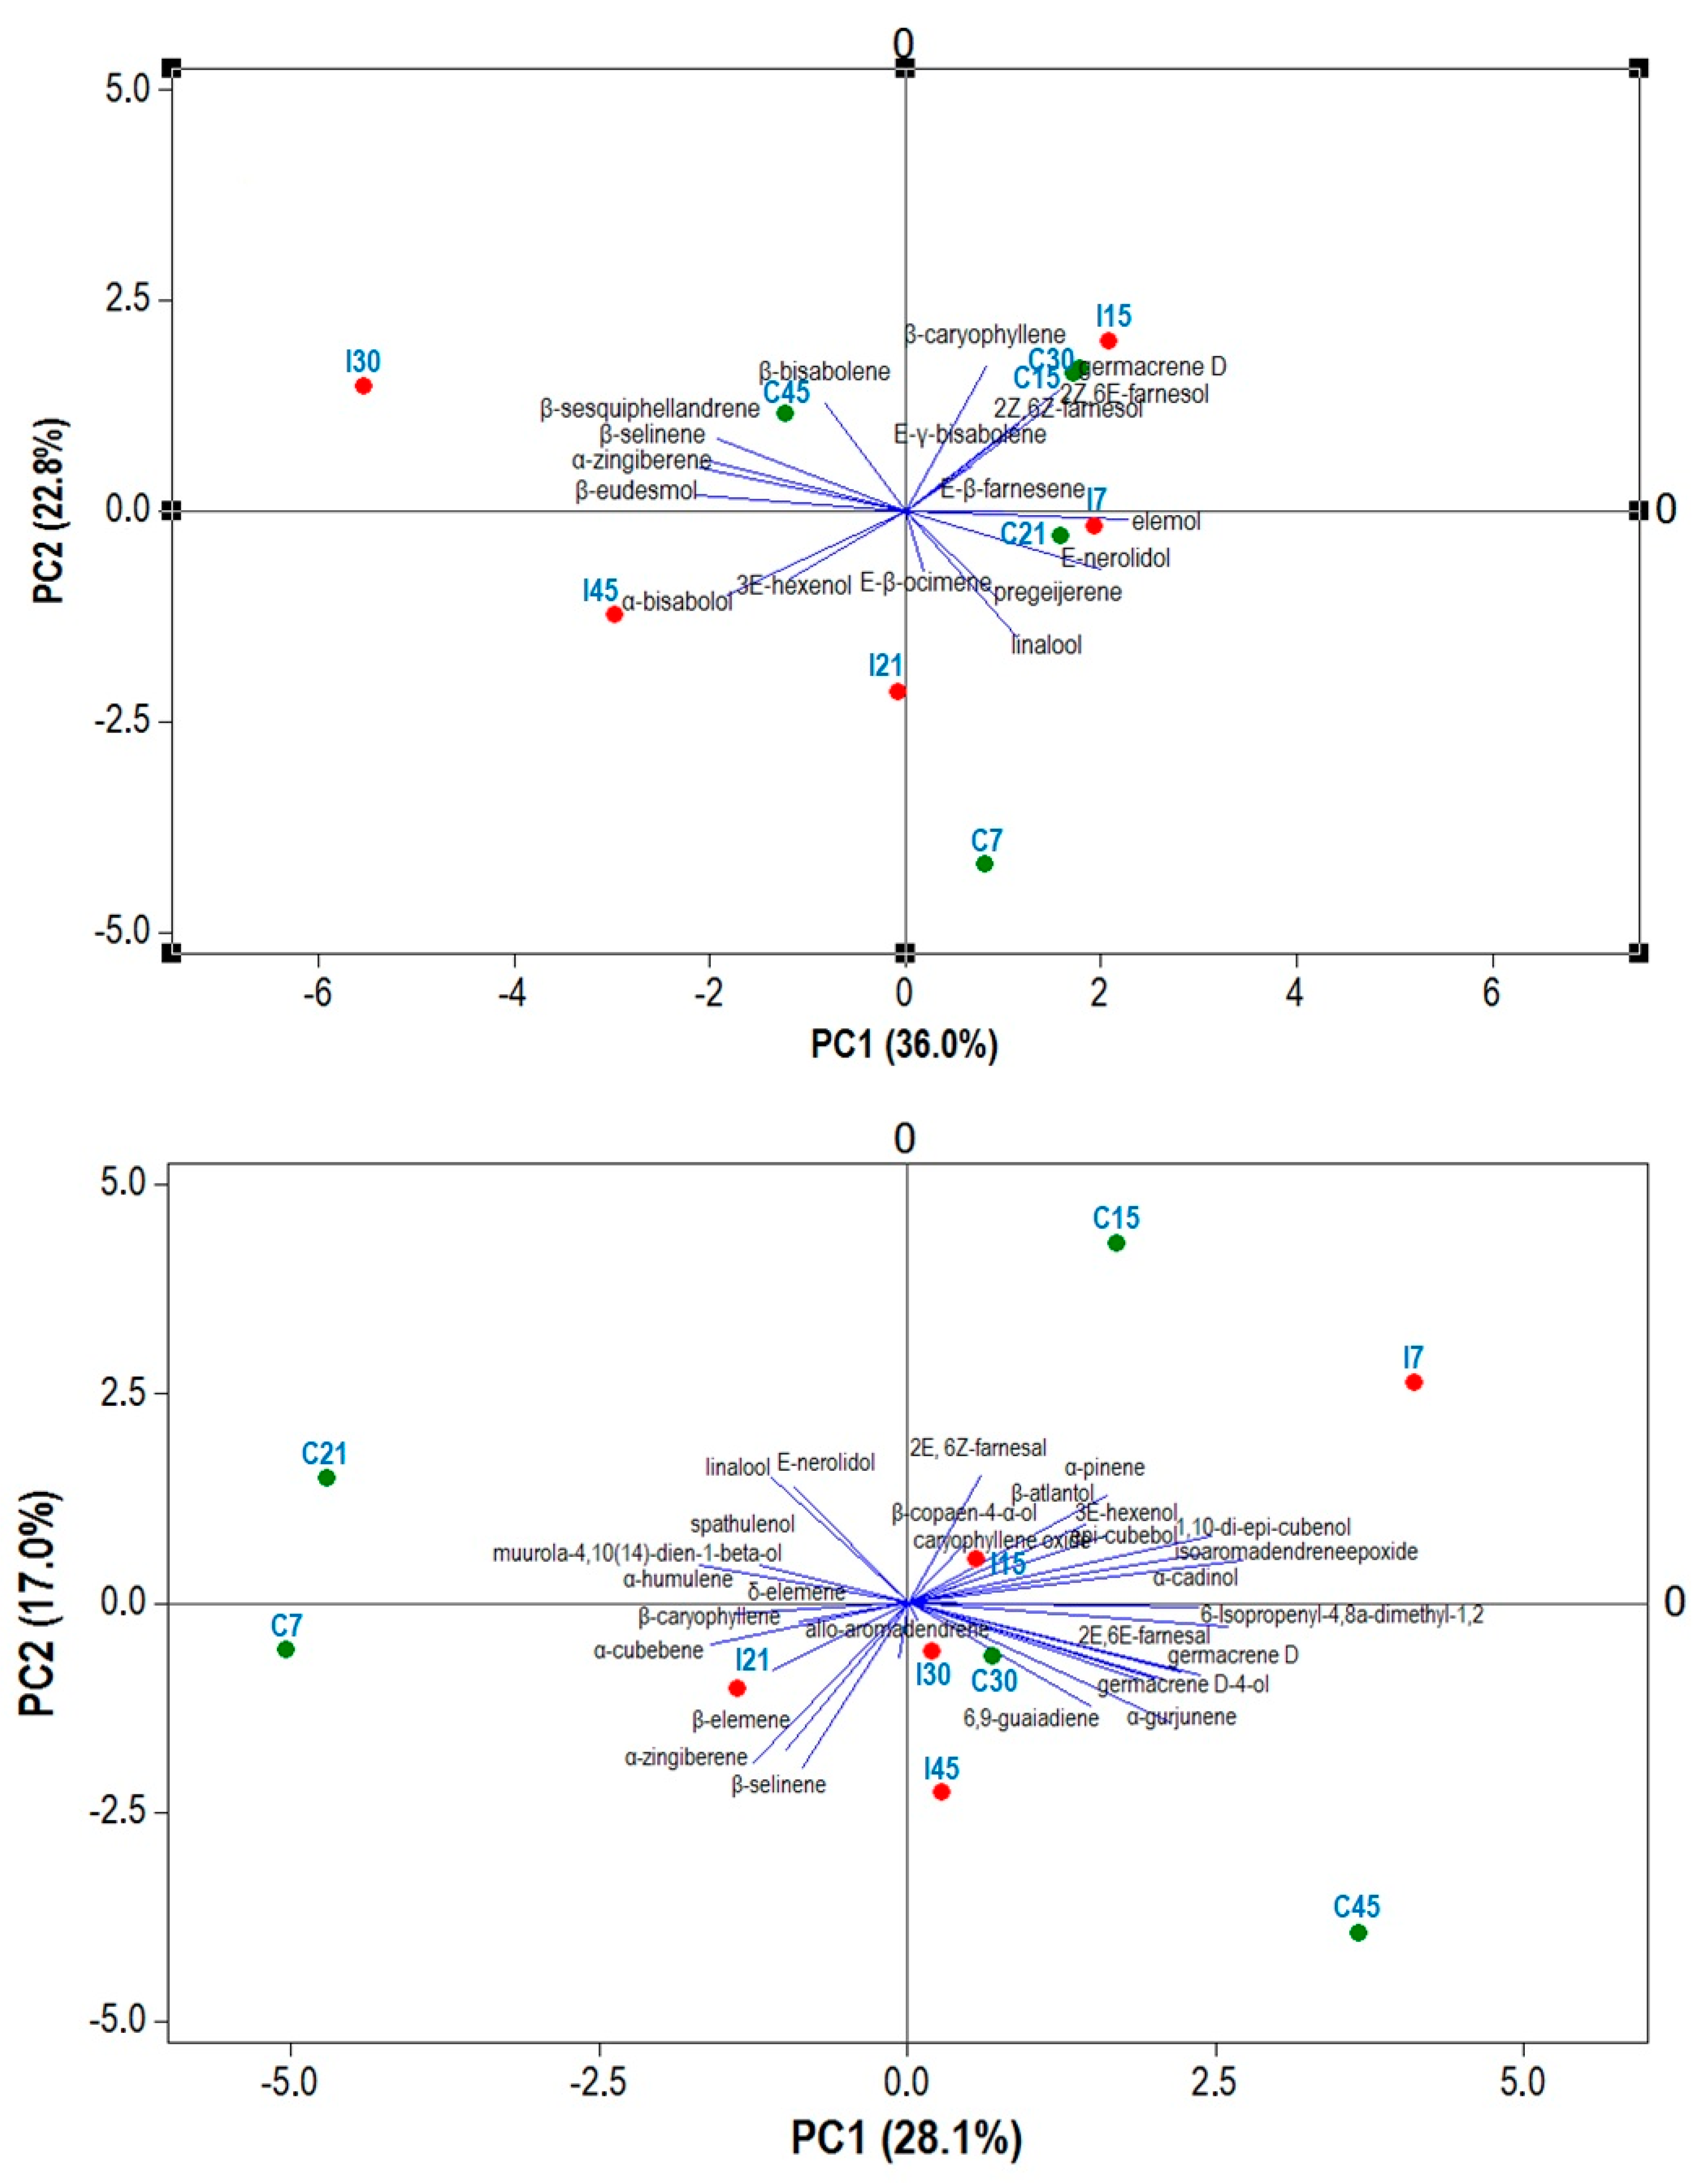
High Performance Liquid Chromatography-Mass Spectrometry (HPLC-MS) analysis of root extracts of Bragantina and Cingapura cultivars resulted in the identification of various alkamide compounds (Figure 4). Individual compounds were identified by comparison of their mass spectra with those previously reported for P. nigrum samples. The alkamides compounds, such as piperine (6R), pellitorine/(2E,4E)-N-isobutyldecadienamide (8aR/8bR), pipyaqubine/(2E,4E,13Z)-N-isobutyl-octadeca-2,4,13-trienamide (9aR/9bR), (2E,4E)-N-isobutyloctadeca-2,4-dienamide/pipericine (14aR/14bR), (2E,4E,10E)-N-11-(3,4,methylenedyoxiphenyl)undecatrienoylpiperidine 12R and guineesine (13R) were identified in both cultivars. The inoculated Bragantina cultivar produced the compounds piperamine/piperlonguminine (2aR/2bR) and pipyaqubine/(2E,4E,13Z) -N-isobutyl-octadeca-2,4,13-trienamide (9aR/9bR) only at 7 dpi and 15 dpi. Higher qualitative difference can be observed at 21 dpi, in which the alkamides (2E,8E)-N-9-(3,4-methylenedioxyphenyl)nonadienoylpiperidine (1R), 1-(eicosa-2E,4E,15Z-trienyl)pyrrolidine/1-(eicosa-2E,4E,14Z-trienyl)pyrrolidine (3aR/3bR), pipyaqubine/(2E,4E,13Z)-N-isobutyl-octadeca-2,4,13-trienamide (9aR/9bR) and (2E,4E)-N-isobutyl-eicosadienamide (15R) were absent. The chemical profile of Cingapura cultivar did not display qualitative changes, which could be attributed to its tolerance. The compounds (2E,4E)-N-isobutyloctadeca-2,4-dienamide/pipericine (14aR/14bR) and pipyaqubine/(2E,4E,13Z) -N-isobutyl-octadeca-2,4,13-trienamide (9aR/9bR) were identified in the inoculated plants at 7 dpi and 15 dpi, respectively (Table 3 and Table 4).

2.6. PCA Analysis

The components first Principal Component (PC1) and second Principal Component (PC2). displayed the patterns found in Bragantina (58.8%) and Cingapura (45.2%) cultivars. Bragantina cultivar showed a positive PC1 correlation mostly with elemol (0.351), E-nerolidol (0.307), germacrene D (0.243) and (2Z,6E)-farnesol (0.232) and its including the samples C7, C15, C21, C30, I7 and I15. Compounds with more positive loadings in PC2 were β-caryophyllene (0.417), germacrene D (0.347), β-bisabolene (0.313), (2Z,6E)-farnesol (0.307) and grouped the samples C15, C30, C45, I15 and I30 (Figure 5A). PC1 of the Cingapura cultivar showed higher positive correlation with isoaromadendrene epoxide (0.293), eudesma-4,11-dien-2α-ol (0.279), 1,10-di-epi-cubenol (0.256), germacrene D (0.255) and α-gurjunene (0.229). PC2 of the Cingapura cultivar presented a positive correlation with (2E,6Z)-farnesal (0.269), E-nerolidol (0.266), linalool (0.246), α-gurjunene (0.229) and α-pinene (0.228) (Figure 5B).

3. Discussion

For populations of an agricultural crop and its associated pathogens, it has been seen that the genetic variation for its resistance and infectivity is ubiquitous [18,19]. Although P. nigrum cultivars are not completely resistant to Fusarium, no contrary evidence has been reported yet [20].
The main compounds that make up the aroma of black pepper are α- and β-pinene, sabinene, myrcene, limonene and β-caryophyllene, followed by minute quantities of δ-3-carene, β-phellandrene, elemicin, muurolol, cubenol and bulsenol [21,22]. Normally, the P. nigrum cultivars have shown variability in their essential oil constituents [23,24,25]. For example, the main compounds identified in 26 different cultivars of black pepper collected in Kerala, India, were elemol and germacrene D in the leaf oils, and β-caryophyllene in the fruit oils [26].
The essential oil of Cingapura cultivar was dominated by sesquiterpenes hydrocarbons (61.8–86.1%), as δ-elemene (57.6%) and β-caryophyllene (3.8%), in contrast with a specimen collected in Cameroon that showed low concentrations of δ-elemene (2.6%) and β-caryophyllene (7.3%) [21]. Inoculated plants activate signal transduction cascades mediated by plant hormones, which lead to higher expression of genes related to defense [27]. There are many chemical compounds involved in interactions between plants, which include aldehydes and low molecular weight alcohols such as 2E-hexenal, 3Z-hexen-1-ol, terpenes such as myrcene and ocimene consisting of mixtures of E-β-ocimene, Z-β-ocimene and allo-ocimene [28].
The response to infections of Bragantina and Cingapura cultivars promotes the production of 3E-hexenol, which is considered a volatile produced in green leaves in response to a herbivore attack. Cingapura inoculated plants produced 3E-hexenol (7 and 15 dpi), which indicated a response in the early stages. However, in the Bragantina cultivar their emission was observed from 21 to 45 dpi only in inoculated plants. In the oxidation of linoleic acid by the action of lipoxygenase enzymes (LOX), 3Z-hexenal is the first product formed followed by isomerization reactions resulting in the formation of 2E-hexenal. These aldehydes are converted to the corresponding alcohols by dehydrogenase action [29,30].
Among minor compounds, E-β-ocimene was frequent and showed higher concentrations in Bragantina inoculated plants at 7, 21 and 45 dpi and Cingapura plants at 7 dpi. This compound has been reported as important in plant-plant interactions, pathogen resistance and changes in abiotic factors [31]. The emission of E-β-ocimene was correlated during interaction of tobacco and peanut, inoculated by Pseudomonas syringae and Sclerotium rolfsii, respectively [32,33,34,35,36]. The plants present direct and indirect defense responses when they are damaged by herbivores, or inoculated by fungal and bacterial pathogens [37]. The significant change in the production of α-bisabolol observed in Bragantina cultivar at 21 dpi and δ-elemene in Cingapura cultivar at 15 dpi may be a response to plant-pathogen interactions, since some sesquiterpenes are produced as phytoalexins by the plant defense system [38]. PCA analysis of volatile compounds from each cultivar discriminated the cultivar in two groups. For the Bragantina cultivar, the negative loadings in the PC1 were observed for inoculated samples after 21 dpi, such as I30, I45 and I21, except the sample C45. However, the groups in the Cingapura samples did not display a response after the infection.
Oxygenated sesquiterpenes were dominant in Bragantina cultivar (susceptible) and sesquiterpene hydrocarbons in Cingapura cultivar (tolerant). The Bragantina cultivar did not display a direct influence of oxygenated sesquiterpenes during the infection. In general, sesquiterpene levels decreased in inoculated plants as initial response to disease (from 7 to 15 dpi) and after 21 dpi, this difference decreased. However, in Cingapura cultivar, sesquiterpene hydrocarbons showed a direct correlation with infection, because a high production was observed in early stages (7–15 dpi). From 30 dpi, a decrease in this difference was observed (Figure 2). The increase in concentration of sesquiterpene hydrocarbons was determined as a marker of infection by Fusarium in corn. Inoculated grains produced high concentrations of β-selinene, α-selinene, β-macrocarpene, β-bisabolene and trichodiene during infection by F. graminearum, F. verticillioides and F. subglutinans, while uninoculated grains showed high levels of cycloisosativene and α-ylangene [39]. These results are in contrast with the earlier reports on response of two lines of P. nigrum inoculated by Phytophthora capsici, which the higher accumulation of phenolic compounds in the roots and stem were observed with the susceptible line (Sreekara) in comparison to the tolerant (04-P24) [40].
Plants submitted to stress displace the energy invested in primary metabolism to secondary metabolism and consequently there is a reduction in the growth rate, reproduction and competitiveness. Subsequently, the synthesis of secondary metabolites is altered for survival and results in regulation of carbon flow between primary and secondary metabolism [41]. Resistance to pests or diseases of certain species could be related to the concentration and variety of phenolic compounds [42,43]. Due to their toxicity, compounds such as flavonoids and hydroxycinnamic acids act as passive or inducing barriers against microorganisms and herbivores [43,44].
The infection by Colletotrichum nymphaea, the causal agent of anthracnose in strawberry (Fragaria sp.) in two cultivars “Elsanta” (susceptible) and “Honeoye” (resistant) promoted an increase in the concentration of phenolic compounds as ellagic acid derivatives, flavonols and flavan-3-ols [45]. Furthermore, multivariate analysis of phenolic compounds of different mango cultivars (Mangifera indica) allowed the identification of biomarkers in the groups as tolerant and susceptible to Fusarium infection. The larger levels of phenolic compounds were observed in more tolerant cultivars “Nam docmai” and “Roza” [46]. These results support the hypothesis that phenolic compounds play an important role in host-resistance in inoculated tissue during plant-pathogen interactions [43]. Despite the variation in total phenolic contents in the roots of both cultivars, they displayed a wide diversity of alkamides. Additionally, it is important to emphasize the low selectivity of phenolic compounds by Folin-Ciocalteu assay, once it displays false positives to non-phenolic reducing species, such as vitamin C, amino acids and thiol derivatives [47]. In addition, many nitrogen-containing compounds showed considerable reactivity toward Folin Ciocalteu reagent. These classes include hydrazines, hydroxylamines, guanidines, tertiary amines, aromatic amines, pyrroles, and indoles [48].
The plant with the highest levels of alkamides (AAs) are found in species of Asteraceae, Piperaceae, Solanaceae and Rutaceae [49,50]. There are numerous studies on antimicrobial activities of AAs by different test methods in vitro, e.g., dilution, disk diffusion and bioautography [51]. The antifungal activity of AAs has been reported against Cladosporium species [52,53]. In plants, these compounds play an important role in seedling development in physiological or stress conditions [54]. Kim et al. (2010) [55] described two hypothetical mechanisms of their protective role: (1) NAE (N-acylethanolamines) accumulation could modulate the level of other lipids (e.g., phosphatidic acid) in response to pathogens or (2) NAEs might interfere with the quorum sensing mechanism (i.e., inter-pathogen communication to coordinate their activities) of pathogen.

4. Materials and Methods

4.1. Plant Materials

Plants of black pepper, from Brangatina and Cingapura cultivars, were provided by Empresa Brasileira de Pesquisa Agropecuária (EMBRAPA)—Campus of Amazônia Oriental, city of Belém, state of Pará, Brazil. Twenty-eight plants of each cultivar, with three months of cultivation, were used in the experiment.

4.2. Fungal Strains and Inoculation on Black Pepper

The origin and identification of the fungal strain used to infection experiments are not clear, nor reference given. F. solani f. sp. piperis isolates were collected from black pepper commercial planting located in Baião city (Pará State). The fungal identification was performed based on morphological characteristics of conidia and microconidia in the inoculant solution, which present an oval shape and fusoid, respectively. The fungus was cultured on potato dextrose agar (PDA) for 10 days, at 27 °C, before starting the experiment. The fungi spores were collected in sterile water and the inoculant solution was prepared at a concentration of 1.43 × 10⁵ spores/mL. The roots of each plant of black pepper cultivars were inoculated with the spore solution according to Meireles, while plants of the control group were treated with distilled water [7]. The Fusarium infection and the production of secondary metabolites were monitored at 7, 15, 21, 30 and 45 days post inoculation (dpi). After the experimentation, the phytopathogen was again isolated from the roots of the black pepper cultivars under study.

4.3. Volatile Concentrates and Extracts Preparation

The volatile constituents were extracted from the leaves (3 g) of each treated plant by simultaneous distillation-extraction process using a Likens-Nickerson apparatus and n-pentane (3 mL) as solvent. After 2 h, the organic fraction was removed. Fresh leaves and roots (5 g) were extracted by percolation (96 h) with ethyl acetate and the residual solvent was removed under reduced pressure.

4.4. Volatile Concentrates Analysis

An aliquot (1 μL) of organic fraction of each sample was submitted for analysis of volatile components. The analyses were carried on a GC-MS Thermo Focus DSQ II (Thermo Fisher Scientific, Austin, TX, USA), under the following conditions: DB-5ms (30 m × 0.25 mm; 0.25 mm film thickness, Agilent, Santa Clara, CA, USA) fused-silica capillary column; programmed temperature, 60–240 °C (3 °C/min); injector temperature, 250 °C; carrier gas, helium, adjusted to a linear velocity of 32 cm/s (measured at 100 °C); injection type, split (2 μL); split flow was adjusted to yield 20:1 ratio; septum sweep was a constant 10 mL/min; EIMS (Electron Impact Mass Spectrometry), electron energy, 70 eV; temperature of the ion source and connection parts, 200 °C. The quantitative data regarding the volatile constituents were obtained by peak area normalization using a FOCUS GC/FID (Thermo Fisher Scientific, Austin, TX, USA) operated under similar conditions of the GC-MS, except the carrier gas, which was nitrogen. The retention indices were calculated for all the volatile constituents using a homologous series of n-alkanes (C8–C32, Sigma-Aldrich, St. Louis, MO, USA) [56].

4.5. Total Phenolics Content

The amount of total phenolics (TP) of the ethyl acetate extract was determined using the Folin-Ciocalteu procedure (Sigma-Aldrich, St. Louis, MO, USA) [57,58]. The extracts were dissolved in methanol at an initial concentration of 40 mg/mL and then diluted in water. Aliquots (500 μL) of the aqueous solution was mixed with 250 μL of Folin-Ciocalteu reagent (1.0 N, Sigma-Aldrich, St. Louis, MO, USA) and 1250 μL of sodium carbonate (75 g/L). The absorbance was measured after 30 min, at 760 nm and 25 °C (UV-Vis spectrophotometer, Biosystems RA2708, Costa Brava, Barcelona, Spain). The experimental calibration curve was prepared using gallic acid at concentrations of zero, 0.5, 1, 2, 4, 6, 8 and 10 mg/L, which were submitted to the same procedure. The total phenolics content are expressed as gallic acid equivalents (GAE) in milligrams per gram of extract (mg GAE/g).

4.6. Extract Samples Analysis

The ethyl acetate extracts were analyzed by a liquid phase chromatograph coupled to a mass spectrometer detector (HPLC-ESI-MS, Shimadzu, Tokyo, Japan), which was equipped with analytical pumps LC-20AD (HPLC-ESI-MS, Shimadzu, Tokyo, Japan) (2), sampler SIL-20AHT (HPLC-ESI-MS, Shimadzu, Tokyo, Japan), detector UV/Vis SPD-20A (HPLC-ESI-MS, Shimadzu, Tokyo, Japan), oven CTO-20A (HPLC-ESI-MS, Shimadzu, Tokyo, Japan) and controller CBM-20A (HPLC-ESI-MS, Shimadzu, Tokyo, Japan). The mobile phase was methanol (MeOH) (plus 0.1% formic acid) and water (plus 0.1% formic acid) in a gradient of 30% of MeOH maintained for 2 min, then, from 2 to 25 min the percentage of MeOH was increased to 100% and kept for an additional 5 min. The column was Luna 5u PFP (2) 100 A, 150 × 2 mm (Phenomenex, Torrance, CA, USA). The UV detector was kept in 254 and 280 nm, the oven was in 40 °C. The flow was 200 µL/min and it was injected directly in the mass spectrometer. The mass spectrometer Bruker micrOTOF-QII (Bruker, Billerica, MA, USA) was in positive mode with nebulizer and dry gas (N2, 8 L/min), at 4 Bar. The dry temperature was 200 °C and the collision and quadrupole energy was 12 and 6 eV, respectively. The funnels RF1 and RF2 were set to 200 Vpp.

4.7. Statistical Analysis

Samples were assayed in triplicate in phenolic content assay and the results are shown as means ± standard deviation. Analysis of variance was conducted and the differences between variables were tested for significance by one-way analysis of variance (ANOVA) with Tukey’s post hoc test using GraphPad version 5.0. (GraphPad Software, San Diego, CA, USA) Differences at p < 0.05 were considered statistically significant. The identified volatile compounds were used as variables in the Principal Component Analysis (PCA) to classify and group the inoculated and control plants. These data were analyzed using the Minitab software (free version, Minitab software, State College, PA, USA).

Acknowledgments

The authors are grateful to Conselho Nacional de Desenvolvimento Científico e Tecnológico (Brazilian Council for Scientific and Technological Development) for financial support.

Author Contributions

Joyce Kelly do R. da Silva and Alessandra de R. Ramos conceived and designed the experiments; Shirlley F. M. da Luz, Luciana P. Xavier and Lydia F. Yamaguchi performed the experiments; Shirlley F. M. da Luz., J.K.d.R.d.S., Joyce Kelly do R. da Silva, José Guilherme S. Maia, Massuo J. Kato and Oriel F. de Lemos analyzed the data; Joyce Kelly do R. da Silva, José Guilherme S. Maia, Massuo J. Kato, Oriel F. de Lemos and William N. Setzer contributed reagents/materials/analysis tools; Shirlley F. M. da Luz, Joyce Kelly do R. da Silva, Alessandra de R. Ramos, William N. Setzer and José Guilherme S. Maia wrote the paper.

Conflicts of Interest

The authors declare no conflict of interest. The founding sponsors had no role in the design of the study; in the collection, analyses, or interpretation of data and in the decision to publish the results.

References

  1. Joy, N.; Abraham, Z.V.; Soniya, E. A preliminary assessment of genetic relationships among agronomically important cultivars of black pepper. BMC Genet. 2007, 8, 42. [Google Scholar] [CrossRef] [PubMed]
  2. Damanhouri, Z.A.; Ahmad, A. A Review on Therapeutic Potential of Piper nigrum L. (Black Pepper): The King of Spices. Med. Aromat. Plants 2014, 3, 161. [Google Scholar] [CrossRef]
  3. Nascimento, S.B.; Cascardo, J.C.M.; Menezes, I.C.; Duarte, M.L.R.; Darnet, S.; Harada, M.L.; Souza, C.R.B. Identifying Sequences Potentially Related to Resistance Response of Piper tuberculatum to Fusarium solani f. sp. piperis by Suppression Subtractive Hybridization. Protein Pept. Lett. 2009, 16, 1429–1434. [Google Scholar] [CrossRef] [PubMed]
  4. Poltronieri, M.C.; Lemos, O.F.; Albuquerque, F.C. Pimenta-do-Reino (Piper nigrum L.), Empresa Brasileira de Pesquisa Agropecuária. In Programa de Melhoramento Genético e de Adaptação de Espécies Vegetais Para a Amazônia Oriental; Embrapa (Coleção Documentos, 16): Belém, Brazil, 1999; pp. 127–137. [Google Scholar]
  5. Lemos, O.F.; Poltronieri, M.C.; Rodrigues, S.M.; Menezes, I.C.; Mondin, M. Conservação e Melhoramento Genético da Pimenteira do Reino (Piper nigrum L.) em Associação com as Técnicas de Biotecnologia; Embrapa Amazônia Oriental: Belém, Brazil, 2011; ISSN 1983-0513. [Google Scholar]
  6. Gordo, S.M.C.; Pinheiro, D.G.; Moreira, E.C.O.; Rodrigues, S.M.; Poltronieri, M.C.; Lemos, O.F.; da Silva, I.T.; Ramos, R.T.J.; Silva, A.; Schneider, H.; et al. High-throughput sequencing of black pepper root transcriptome. BMC Plant Biol. 2012, 12, 168. [Google Scholar] [CrossRef] [PubMed] [Green Version]
  7. Meireles, E.N.; Xavier, L.P.; Ramos, A.R.; Maia, J.G.S.; Setzer, W.N.; da Silva, J.K.R. Phenylpropanoids Produced by Piper divaricatum, A Resistant Species to Infection by Fusarium solani f. sp. piperis, the Pathogenic Agent of Fusariosis in Black Pepper. J. Plant Pathol. Microbiol. 2016, 7, 2. [Google Scholar] [CrossRef]
  8. Wishart, D.S. Quantitative metabolomics using NMR. Trac-Trends Anal. Chem 2008, 27, 228–237. [Google Scholar] [CrossRef]
  9. Davies, H.V.; Shepherd, L.V.T.; Stewart, D.; Frank, T.; Röhlig, R.M.; Engel, K.H. Metabolome variability in crop plant species—When, where, how much and so what? Regul. Toxicol. Pharmacol. 2010, 58, 54–61. [Google Scholar] [CrossRef] [PubMed]
  10. Nadella, K.D.; Marla, S.S.; Kumar, P.A. Metabolomics in Agriculture. J. Int. Biol. 2012, 16, 4. [Google Scholar] [CrossRef] [PubMed]
  11. Kumar, P.; Misra, A.K.; Modi, D.R. Current status of mango malformation in India. Asian J. Plant Sci. 2011, 10, 1–23. [Google Scholar] [CrossRef]
  12. Hamzehzarghani, H.; Paranidharan, V.; Abu-Nada, Y.; Kushalappa, A.C.; Dion, Y.; Rioux, S.; Comeau, A.; Yaylayan, V.; Marshall, W.D. Metabolite profiling coupled with statistical analyses for potential high-throughput screening of quantitative resistance to fusarium head blight in wheat. Can. J. Plant Pathol. 2008, 30, 24–36. [Google Scholar] [CrossRef]
  13. Balmer, D.; Papajewski, D.V.; Planchamp, C.; Glauser, G.; Mauch-Mani, B. Induced resistance in maize is based on organ-specific defence responses. Plant J. 2013, 74, 213–225. [Google Scholar] [CrossRef] [PubMed]
  14. Hantao, L.W.; Aleme, H.G.; Passador, M.M.; Furtado, E.L.; Ribeiro, F.A.L.; Poppi, R.J.; Augusto, F. Determination of disease biomarkers in Eucalyptus by comprehensive two-dimensional gas chromatography and multivariate data analysis. J. Chromatogr. A 2013, 1279, 86–91. [Google Scholar] [CrossRef] [PubMed]
  15. Kliebenstein, D.J. Plant Defense Compounds: Systems Approaches to Metabolic Analysis. Annu. Rev. Phytopathol. 2012, 50, 155–173. [Google Scholar] [CrossRef] [PubMed]
  16. Ralchenko, Y. NIST Atomic Spectra Database; Mem. Sait. Suppl: Gaithersburg, MD, USA, 2005; pp. 96–102. Available online: http://physics.nist.gov/PhysRefData/ASD/index.html (accessed on 17 May 2016).
  17. Adams, R.P. Identification of Essential Oil Components by gas Chromatography—Mass Spectrometry; Allured Publishing Corporation: DuPage County, IL, USA, 2007. [Google Scholar]
  18. Laine, A.; Burdon, J.J.; Dodds, P.N.; Thrall, P.H. Spatial variation in disease resistance: From molecules to metapopulations. J. Ecol. 2011, 99, 96–112. [Google Scholar] [CrossRef] [PubMed]
  19. Tack, A.J.M.; Thrall, P.H.; Barrett, L.G.; Burdon, J.J.; Laine, A. Variation in infectivity and aggressiveness in space and time in wild host-pathogen systems—Causes and consequences. J. Evol. Biol. 2012, 25, 1918–1936. [Google Scholar] [CrossRef] [PubMed]
  20. Castro, G.L.S.; Lemos, O.F.; Tremacoldi, C.R.; Moraes, F.K.C.; Santos, L.R.R.; Pinheiro, H.A. Susceptibility of in vitro black pepper plant to the filtrate from a Fusarium solani f. sp. piperis culture. Plant Cell Tissue Organ Cult. 2016, 127, 263–268. [Google Scholar] [CrossRef]
  21. Gopalakrishnan, M.; Padmakumari, K.P.; Jayalekshmy, A.; Narayanan, C.S. Gas chromatographic analysis and odour profiles of few Indian genotypes of Piper nigrum L. J. Essent. Oil Res. 1993, 5, 247–253. [Google Scholar] [CrossRef]
  22. Jirovetz, L.; Buchbauer, G.; Ngassoum, M.B.; Geissler, M. Aroma compound analysis of Piper nigrum and Piper guineense essential oils from Cameroon using solid-phase micro extraction-gas chromatography, solid-phase micro extraction gas chromatography–mass spectrometry and olfactometry. J. Chromatogr. A 2002, 976, 265–275. [Google Scholar] [CrossRef]
  23. Menon, A.N.; Padmakumari, K.P.; Jayalekshmy, A.; Gopalakrishnan, M.; Narayanan, C.S. Essential oil composition of four popular Indian cultivars of black pepper (Piper nigrum L.). J. Essent. Oil Res. 2000, 12, 431–434. [Google Scholar] [CrossRef]
  24. Menon, A.N.; Padmakumari, K.P.; Jayalekshmy, A.J. Essential oil composition of four major cultivars of black pepper (Piper nigrum L.). J. Essent. Oil Res. 2002, 14, 84–86. [Google Scholar] [CrossRef]
  25. Menon, A.N.; Padmakumari, K.P.; Jayalekshmy, A. Essential oil composition of four major cultivars of black pepper (Piper nigrum L.) III. J. Essent. Oil Res. 2003, 15, 155–157. [Google Scholar] [CrossRef]
  26. Zachariah, T.J.; Safeer, A.L.; Jayarajan, K.; Leela, N.K.; Vipin, T.M.; Saji, K.V.; Shiva, K.N.; Parthasarathy, V.A.; Mammootty, K.P. Correlation of metabolites in the leaf and berries of selected black pepper varieties. Sci. Hortic. 2010, 123, 418–422. [Google Scholar] [CrossRef]
  27. Quaglia, M.; Fabrizi, M.; Zazzerini, A.; Zadra, C. Role of pathogen-induced volatiles in the Nicotiana tabacume Golovinomyces cichoracearum interaction. Plant Physiol. Biochem. 2012, 52, 9–20. [Google Scholar] [CrossRef] [PubMed]
  28. Godard, K.; White, R.; Bohlmann, J. Monoterpene-induced molecular responses in Arabidopsis thaliana. Phytochemistry 2008, 69, 1838–1849. [Google Scholar] [CrossRef] [PubMed]
  29. Matsui, K.; Kurishita, S.; Hisamitsu, A.; Kajiwara, T. A lipid-hydrolysing activity involved in hexenal formation. Biochem. Soc. Trans. 2000, 28, 857–860. [Google Scholar] [CrossRef] [PubMed]
  30. Shiojiri, K.; Ozawa, R.; Matsui, K.; Kishimoto, K.; Kugimiya, S.; Takabayashi, J. Role of the lipoxygenase/lyase pathway of host-food plants in the host searching behavior of two parasitoid species, Cotesia glomerata and Cotesia plutellae. J. Chem. Ecol. 2006, 32, 969–979. [Google Scholar] [CrossRef] [PubMed]
  31. Gouinguené, S.P.; Turlings, T.C.J. The effects of abiotic factors on induced volatile emissions in corn plants. Plant Physiol. 2002, 129, 1296–1307. [Google Scholar] [CrossRef] [PubMed]
  32. Halitschke, R.; Kessler, A.; Kahl, J.; Lorenz, A.; Baldwin, I.T. Ecophysiological comparison of direct and indirect defenses in Nicotiana attenuate. Oecologia 2000, 124, 408–417. [Google Scholar] [CrossRef] [PubMed]
  33. Loreto, F.; Nascetti, P.; Graverini, A.; Mannozzi, M. Emission and content of monoterpenes in intact and wounded needles of the mediterranean pine, Pinus pinea. Funct. Ecol. 2000, 14, 589–595. [Google Scholar] [CrossRef]
  34. Singsaas, E. Terpenes and the thermotolerance of photosynthesis. New Phytol. 2000, 146, 1–4. [Google Scholar] [CrossRef]
  35. Huang, J.; Cardoza, Y.J.; Schmelz, E.A.; Raina, R.; Engelberth, J.; Tumlinson, J.H. Differential volatile emissions and salicylic acid levels from tobacco plants in response to different strains of Pseudomonas syringae. Planta 2003, 217, 767–775. [Google Scholar] [CrossRef] [PubMed]
  36. Cardoza, Y.J.; Alborn, H.T.; Tumlinson, J.H. In-vivo volatile emissions from peanut plants induced by simultaneous fungal infection and insect damage. J. Chem. Ecol. 2002, 28, 161–174. [Google Scholar] [CrossRef] [PubMed]
  37. War, A.R.; Paulraj, M.G.; Ahmad, T.; Buhroo, A.A.; Hussain, B.; Ignacimuthu, S.; Sharma, H.C. Mechanisms of Plant Defense against Insect Herbivores. Plant Signal. Behav. 2012, 7, 10. [Google Scholar] [CrossRef] [PubMed]
  38. Cheng, A.X.; Xiang, C.Y.; Li, J.X.; Yang, C.Q.; Hu, W.L.; Wang, L.J. The rice (E)-β-caryophyllene synthase (Os TPS3) accounts for the major inducible volatile sesquiterpenes. Phytochemistry 2007, 68, 1632–1641. [Google Scholar] [CrossRef] [PubMed]
  39. Becker, E.M.; Herrfurth, C.; Irmisch, S.; Köllner, T.G.; Feussner, I.; Karlovsky, P.; Splivallo, R. Infection of corn ears by Fusarium spp. induces the emission of volatile sesquiterpenes. J. Agric. Food Chem. 2014, 62, 5226–5236. [Google Scholar] [CrossRef] [PubMed]
  40. Vandana, V.V.; Bhai, R.S.; Azeez, S. Biochemical defense responses of black pepper (Piper nigrum L.) lines to Phytophthora capsici. Physiol. Mol. Plant 2014, 88, 18–27. [Google Scholar] [CrossRef]
  41. Cheynier, V.; Comte, G.; Davies, K.M.; Lattanzio, V.; Martens, S. Plant phenolics: Recent advances on their biosynthesis, genetics, and ecophysiology. Plant Physiol. Biochem. 2013, 72, 1–20. [Google Scholar] [CrossRef] [PubMed]
  42. Rusjan, D.; Halbwirth, H.; Stich, K.; Mikulic-Petkovsek, M.; Veberic, R. Biochemical response of grapevine variety ‘Chardonnay’ (Vitis vinifera L.) to infection with grapevine yellows (Bois noir). Eur. J. Plant Pathol. 2012, 134, 231–237. [Google Scholar] [CrossRef]
  43. Mikulic-Petkovsek, M.; Tampar, F.S.; Veberic, R. Accumulation of phenolic compounds in apple in response to infection by the scab pathogen, Venturia inaequalis. Physiol. Mol. Plant Pathol. 2009, 74, 60–67. [Google Scholar] [CrossRef]
  44. Treutter, D.; Feucht, W. Accumulation of flavan-3-ols in fungus-inoculated leaves of Rosaceae. Pflanzen 1990, 97, 634–641. [Google Scholar]
  45. Mikulic-Petkovsek, M.; Schmitzer, V.; Slatnar, A.; Weber, N.; Veberic, R.; Stampar, F.; Munda, A.; Koron, D. Alteration of the Content of Primary and Secondary Metabolites in Strawberry Fruit by Colletotrichum nymphaeae Infection. J. Agric. Food Chem. 2013, 61, 5987–5995. [Google Scholar] [CrossRef] [PubMed]
  46. Augustyn, W.A.; Regnier, T.; Combrinck, S.; Botha, B.M. Metabolic profiling of mango cultivars to identify biomarkers for resistance against Fusarium infection. Phytochem. Lett. 2014, 10, 104–110. [Google Scholar] [CrossRef]
  47. Everette, J.D.; Bryant, Q.M.; Green, A.M.; Abbey, Y.A.; Wangila, G.W.; Walker, R.B. Thorough study of reactivity of various compound classes toward the Folin-ciocalteu reagent. J. Agric. Food Chem. 2010, 58, 8139–8144. [Google Scholar] [CrossRef] [PubMed]
  48. Ikawa, M.; Schafer, T.; Dollard, C.; Sasner, J. Utilization of Folin-Ciocalteu reagent for the detection of certain nitrogen compounds. J. Agric. Food Chem. 2003, 51, 1811–1815. [Google Scholar] [CrossRef] [PubMed]
  49. Boonen, J.; Bronselaer, A.; Nielandt, J.; Veryser, L.; Tre, G.D.; Spiegeleer, B.D. Alkamid database: Chemistry, occurrence and functionality of plant N-alkylamides. J. Ethnopharmacol. 2012, 142, 563–590. [Google Scholar] [CrossRef] [PubMed]
  50. Rios, M.Y. Natural Alkamides: Pharmacology, Chemistry and Distribution, Drug Discovery Research in Pharmacognosy; Vallisuta, O., Ed.; InTech: Rijeka, Croatia, 2012; ISBN 978-953-51-0213-7. [Google Scholar]
  51. Rahalison, L.; Hamburger, M.; Monod, M.; Frenk, E.; Hostettmann, K. Antifungal tests in phytochemical investigations: Comparison of bioautographic methods using phytopathogenic and human pathogenic fungi. Planta Med. 1994, 60, 41–44. [Google Scholar] [CrossRef] [PubMed]
  52. Da Silva, R.V.; Navickiene, H.M.D.; Kato, M.J.; Bolzani, V.S.; Méda, C.I.; Young, M.C.M.; Furlan, M. Antifungal amides from Piper arboreum and Piper tuberculatum. Phytochemistry 2002, 59, 521–527. [Google Scholar] [CrossRef]
  53. Navickiene, H.M.D.; Alécio, A.C.; Kato, M.J.; Bolzani, V.S.; Young, M.C.M.; Cavalheiro, A.J.; Furlan, M. Antifungal amides from Piper hispidum and Piper tuberculatum. Phytochemistry 2000, 55, 621–626. [Google Scholar] [CrossRef]
  54. Coulon, D.; Faure, L.; Salmon, M.; Wattelet, V.; Bessoule, J.J. N-Acylethanolamines and related compounds: Aspects of metabolism and functions. Plant Sci. 2012, 184, 129–140. [Google Scholar] [CrossRef] [PubMed]
  55. Kim, S.C.; Chapman, K.D.; Blanca Flor, E.B. Fatty acid amide lipid mediators in plants. Plant Sci. 2010, 178, 411–419. [Google Scholar] [CrossRef]
  56. Van den Dool, H.; Kratz, P.D. Generalization of the retention index system including linear temperature programmed gas–liquid partition chromatography. J. Chromatogr. A 1963, 11, 463–471. [Google Scholar] [CrossRef]
  57. Singleton, V.L.; Rossi, J.A. Colorimetry of Total Phenolics with Phosphomolybdic-Phosphotungstic Acid Reagents. Am. J. Enol. Vitic. 1965, 16, 144–158. [Google Scholar]
  58. Da Silva, J.K.R.; Sousa, P.J.C.; Andrade, E.H.A.; Maia, J.G.S. Antioxidant Capacity and Cytotoxicity of Essential Oil and Methanol Extract of Aniba canelilla (H.B.K.) Mez. J. Agric. Food Chem. 2007, 55, 9422–9426. [Google Scholar] [CrossRef] [PubMed]
Figure 1. Visual evaluation of Fusariosis symptoms in P. nigrum cultivars during inoculation by F. solani f. sp. piperis. dpi: days post infection.
Ijms 18 02434 g001
Figure 2. Sesquiterpenes variation in P. nigrum cultivars during infection by F. solani f. sp. piperis. (A) Sesquiterpenes hydrocarbons; (B) Oxygenated sesquiterpenes; (a) inoculated plants; (b) control plants. dpi: days post infection.
Ijms 18 02434 g002
Figure 3. Phenolic content variation in P. nigrum cultivars during infection by F. solani f. sp. piperis. (A) Leaves (B) Roots, mg GAE·g−1 (mg of gallic acid equivalent per gram of extract). A, a, B, b, C, c, D, d, E, e, F, f, G, g, H, h, I, i, J, j values with different letters are statistically different at the p < 0.05 level (Tukey’s test).
Ijms 18 02434 g003
Figure 4. Identified compounds in roots of P. nigrum cv. Bragantina and Cingapura during infection with F. solani f. sp. piperis.
Ijms 18 02434 g004
Figure 5. Bidimensional plot of first two components obtained by Principal Component Analysis (PCA) of P. nigrum cultivars based on Essential Oil (EO) chemical composition. Inoculated plants: I7, I15, I21, I30 and I45. Control Plants: C7, C15, C21, C30 and C45. (A) Bragantina; and (B) Cingapura. PC1: First Principal Component, PC2: Second Principal Component.
Ijms 18 02434 g005
Table 1. Volatile compounds (%) of the leaves of Bragantina cultivar: inoculated plants (IP) and control plants (CP).
Bragantina Cultivar7 dpi15 dpi21 dpi30 dpi45 dpi
ConstituentsRIaRIbIPCPIPCPIPCPIPCPIPCP
3E-Hexenol8458440.30.50.3 +0.10.6 *0.7 *0.2 *
Limonene102210240.10.10.10.10.1
E-β-Ocimene102910441.2 +0.10.51.10.81.0 +0.5
Linalool109110950.50.70.30.40.40.30.3 +0.1
Pregeijerene126912850.30.50.20.20.30.20.2
2-Undecanone128512930.1 *0.10.10.10.1
δ-Elemene132513350.10.10.10.10.1
α-Ylangene135913730.1 *0.10.10.1
β-Bourbonene137413870.1 *
β-Elemene138013890.2 +0.10.20.20.1
β-Caryophyllene140714171.0 +0.41.11.20.70.90.90.90.60.8
γ-Elemene141814340.10.10.2 +0.10.1
Geranyl acetone144014530.10.10.10.10.1 *
E-β-Farnesene144314540.7 +0.20.80.80.70.70.70.5
Germacrene D147014844.2 +1.45.75.13.44.32.2 6.92.54.1
β-Selinene147614890.10.10.1 0.20.5 *0.20.2
α-Zingiberene148314930.2 +0.10.2 0.40.20.9 *0.90.7
α-Muurolene149015000.1 *0.10.10.4 *0.2 +0.1
β-Bisabolene149715053.6 *1.14.34.14.24.26.0 +3.63.02.8
β-Sesquiphellandrene151415210.1 *0.30.40.7 *0.60.5
E-γ-Bisabolene151715290.10.12.0
Elemol1535154819.027.324.422.315.328.40.7 32.93.4 9.2
Germacrene B154515590.3 *0.30.10.1
E-Nerolidol155115611.81.71.52.01.71.21.11.21.0
Caryophyllene oxide156915820.20.20.1 *0.1
Longiborneol159115990.10.10.1 *0.10.1
β-Eudesmol164016490.30.30.30.310.7 *14.912.2
α-Bisabolol1679168551.453.944.847.964.351.460.149.860.754.6
(2Z,6Z)-Farnesol169616981.6 *1.91.50.51.5
(2Z,6E)-Farnesol170417223.2 *3.53.21.11.52.5
Monoterpene hydrocarbons1.40.30.10.71.10.81.20.6
Oxygenated monoterpenes0.91.20.60.70.40.60.60.4
Sesquiterpene hydrocarbons10.93.713.212.89.010.711.613.48.810.2
Oxygenated sesquiterpenes77.683.576.377.281.382.971.585.380.381.2
Others0.30.50.30.10.60.70.2
Total91.189.290.591.592.495.083.898.791.192.4
RIa: Retention index calculated; RIb: Retention Index of Literature [17]; * Compounds produced only by inoculated plants; + Compounds that increased more than 50% in inoculated plants, Compounds that reduced more than 50% in inoculated plants.
Table 2. Volatile compounds (%) of the leaves of Cingapura cultivar: inoculated plants (IP) and control plants (CP).
Cingapura Cultivar7 dpi15 dpi21 dpi30 dpi45 dpi
ConstituentsRIaRIbIPCPIPCPIPCPIPCPIPCP
3E-Hexenol8468441.6 *0.3 *0.2 +0.1
α-Pinene9289320.5 *0.10.1
β-Pinene9709740.1
Myrcene9839880.1
δ-2-Carene100410010.2 *0.1 *
Limonene102310240.2 *
E-β-Ocimene104010440.4 *0.20.2
Linalool109210952.62.01.01.41.2 2.51.5 +0.60.50.8
Methyl citronellate125012570.1
Carvenone125212550.1 *0.10.10.10.1
2-Undecanone128512930.1
δ-Elemene1322133545.957.673.6 +48.748.855.161.257.155.848.1
δ-Cubebene13370.6 *
α-Cubebene136513450.4 2.10.40.30.6 *0.50.90.7
α-Copaene136513741.0 *
α-Ylangene136713731.2 *0.8 +0.41.1 *1.21.21.4
β-Elemene137913892.74.12.11.63.13.03.22.73.13.9
α-Gurjunene139614090.7 *0.40.30.80.80.71.01.1
β-Caryophyllene140714173.03.82.33.16.68.73.93.05.44.9
6,9-Guaiadiene143014420.1 *0.5 *0.71.2
α-Humulene144314520.6 2.20.20.50.9 *0.8 *0.9 *
Thujopsadiene144914650.3 *0.30.5 *0.4 *0.3 *
allo-Aromadendrene146114580.1 *0.1 *0.5 *0.4 *
9-epi-E-Caryophyllene146514640.2 *0.1 0.20.4
Germacrene D147014840.6 *0.6 +0.30.6 *0.70.60.50.7
β-Selinene147614892.24.21.81.33.32.93.42.53.64.4
α-Zingiberene148214932.9 6.92.92.35.25.05.24.35.56.8
Z- Cycloisolongifol-5-ol149815130.3
epi-Cubebol150314930.3 *0.1 0.70.9 *0.30.4
δ-Amorphene150715110.7 *0.3 *0.7 +0.40.40.7
γ-Vetivenene153415310.2 *0.10.1
γ-Elemene154514650.1
E-Nerolidol154915612.94.81.3 8.53.96.62.74.02.72.2
Germacrene D-4-ol156415740.2 *0.10.30.3 *0.40.40.5
Caryophyllene oxide157615826.66.32.93.93.63.8
Spathulenol157715773.16.16.13.64.50.3 *
β-Copaen-4α-ol159515902.81.5 *1.71.70.8 *
β-Atlantol159616083.4 *
Ledol160216020.4
1,10-di-epi-Cubenol160716181.6 *0.6 1.21.0 *0.81.31.1
Muurola-4,10(14)-dien-1β-ol161316304.35.92.0 4.96.55.53.75.33.83.1
α-Cadinol164216520.5 *0.2 0.40.4 *0.3 *0.30.5
allo-Aromadendrene epoxide164916390.2 *0.1 *0.1 0.2
Khusinol165916790.7 *0.3 0.60.4 *0.20.5
Germacra-4(15),5,10(14)-trien-1α-ol167216850.2 *0.10.30.1
2Z,6Z-Farnesal168416840.2 *0.1 *0.10.1
2E, 6Z-Farnesal169617130.6
2Z,6E-Farnesal169617150.2 *0.4 *
Eudesma-4,11-dien-2α-ol170417041.2 *0.6 1.90.9 *1.21.11.1 2.2
E, E, E-7,10,13-Hexadecatrienal171818240.8 *
iso-Aromadendrene epoxide171917190.6 *0.3 0.60.40.50.30.5
2E,6E-Farnesal172517250.4 *1.00.80.70.8 2.0
Monoterpene hydrocarbons1.30.40.7
Oxygenated monoterpenes2.72.01.11.71.22.51.50.60.60.9
Sesquiterpene hydrocarbons61.880.686.159.572.074.781.973.779.074.4
Oxygenated sesquiterpenes23.317.08.731.722.818.216.019.514.817.2
Others1.60.30.20.1
Total90.799.996.493.495.795.499.493.894.692.6
RIa: Retention index calculated; RIb: Retention Index of Literature [17]. * Compounds produced only by inoculated plants, + Compounds that increased more than 50% in inoculated plants, Compounds that reduced more than 50% in inoculated plants.
Table 3. Chemical profile of root extracts of Bragantina cultivar: inoculated plants (IP) and control plants (CP).
RTAlkamidesMWMF7 dpi15 dpi21 dpi30 dpi45 dpi
(min)(Figure 4)(Molecular Weight)(Molecular Formula)IPCPIPCPIPCPIPCPIPCP
17.11R341.4402C21H27NO3XXXX
18.82aR/2bR273.3243C16H19NO3+XX
19.73aR/3bR359.5827C24H41NOXXX
20.54R339.4246C21H25NO3XXX
21.45R381.5035C24H31NO3XXXXXXXX
22.26R285.3350C17H19NO3XXXXXXXXXX
22.67R452.8303C31H64O+
23.38aR/8bR224.3587C14H26NOXXXXXXXXXX
23.89aR/9bR333.5457C22H39NOXX+
24.110R311.3720C19H21NO3+
25.611aR/11bR361.5983C24H43NOXXX
26.212R367.4772C23H29NO3XXXXXXXXXX
26.813R383.5191C24H33NO3XXXXXXXXXX
27.79aR/9bR333.5457C22H39NOXX+XXXXX
28.314aR/14bR335.5613C22H41NOXXXXXXXXXX
29.015aR/15bR363.6139C24H45NOX
RT: Retention time; MW: Molecular weight; MF: Molecular formula; Alkamides in bold represent changes in function of the infection; (X): Alkamides present in inoculated and control plants; (−) Alkamides present in control plants and absent in inoculated plants; (+) Alkamide present only in inoculated plants.
Table 4. Chemical profile of root extracts of Cingapura cultivar: inoculated plants (IP) and control plants (CP).
RTAlkamidesMWMF7 dpi15 dpi21 dpi30 dpi45 dpi
(min)(Figure 4)(Molecular Weight)(Molecular Formula)IPCPIPCPIPCPIPCPIPCP
22.26R285.3350C17H19NO3XXXXXXXXX
23.38aR/8bR224.3587C14H26NOXXXXXXXXXX
23.99aR/9bR333.5457C22H39NOXXXXXXXX
24.014aR/14bR335.5613C22H41NO+XXXXX
24.19aR/9bR333.5457C22H39NOXXXXXXX
24.416R235.3616C15H25NOXXXXXXXXX
26.312R367.4772C23H29NO3XXXXXXXXXX
26.813R383.5191C24H33NO3XXXXXXXXXX
RT: Retention time; MW: Molecular weight; MF: Molecular formula; Alkamides in bold represent changes in function of the infection; (X): Alkamides present in inoculated plants and control plants; (−): Alkamides present in control plants and absent in inoculated plants; (+): Alkamides present only in inoculated plants.

