Selection on the Major Color Gene Melanocortin-1-Receptor Shaped the Evolution of the Melanocortin System Genes

 and
and
Abstract
:
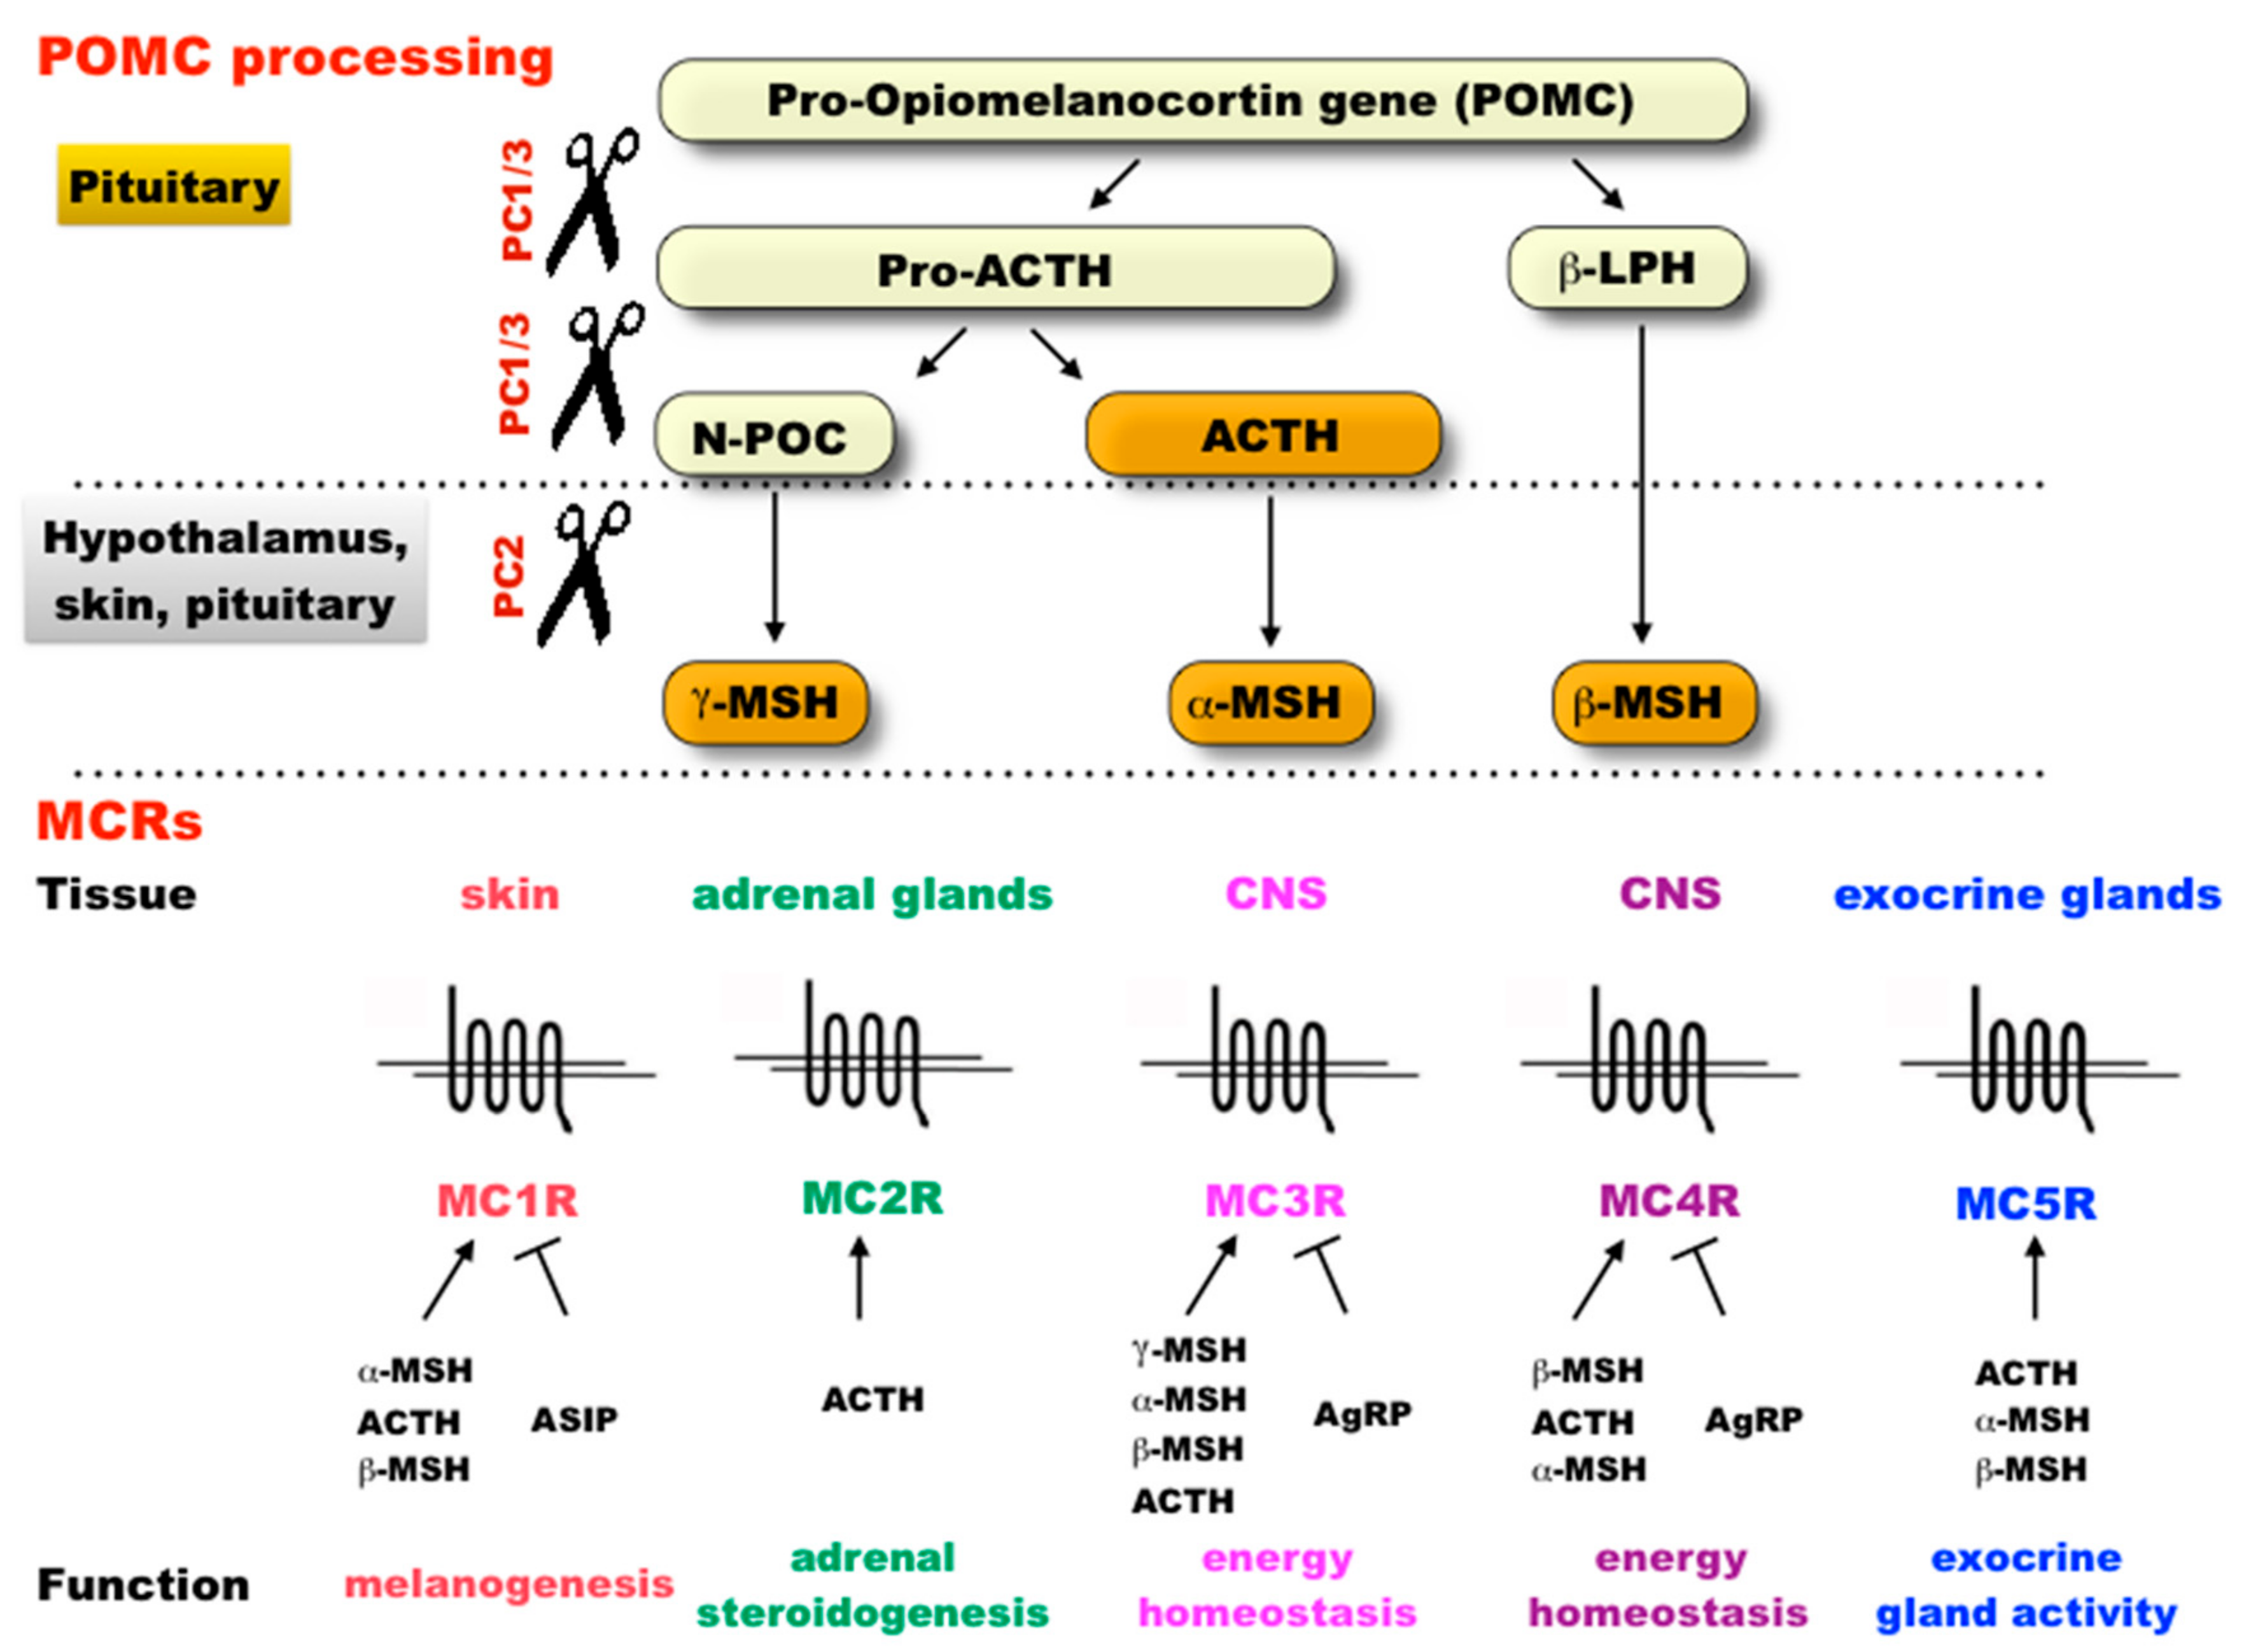
1. Background
2. Results and Discussion
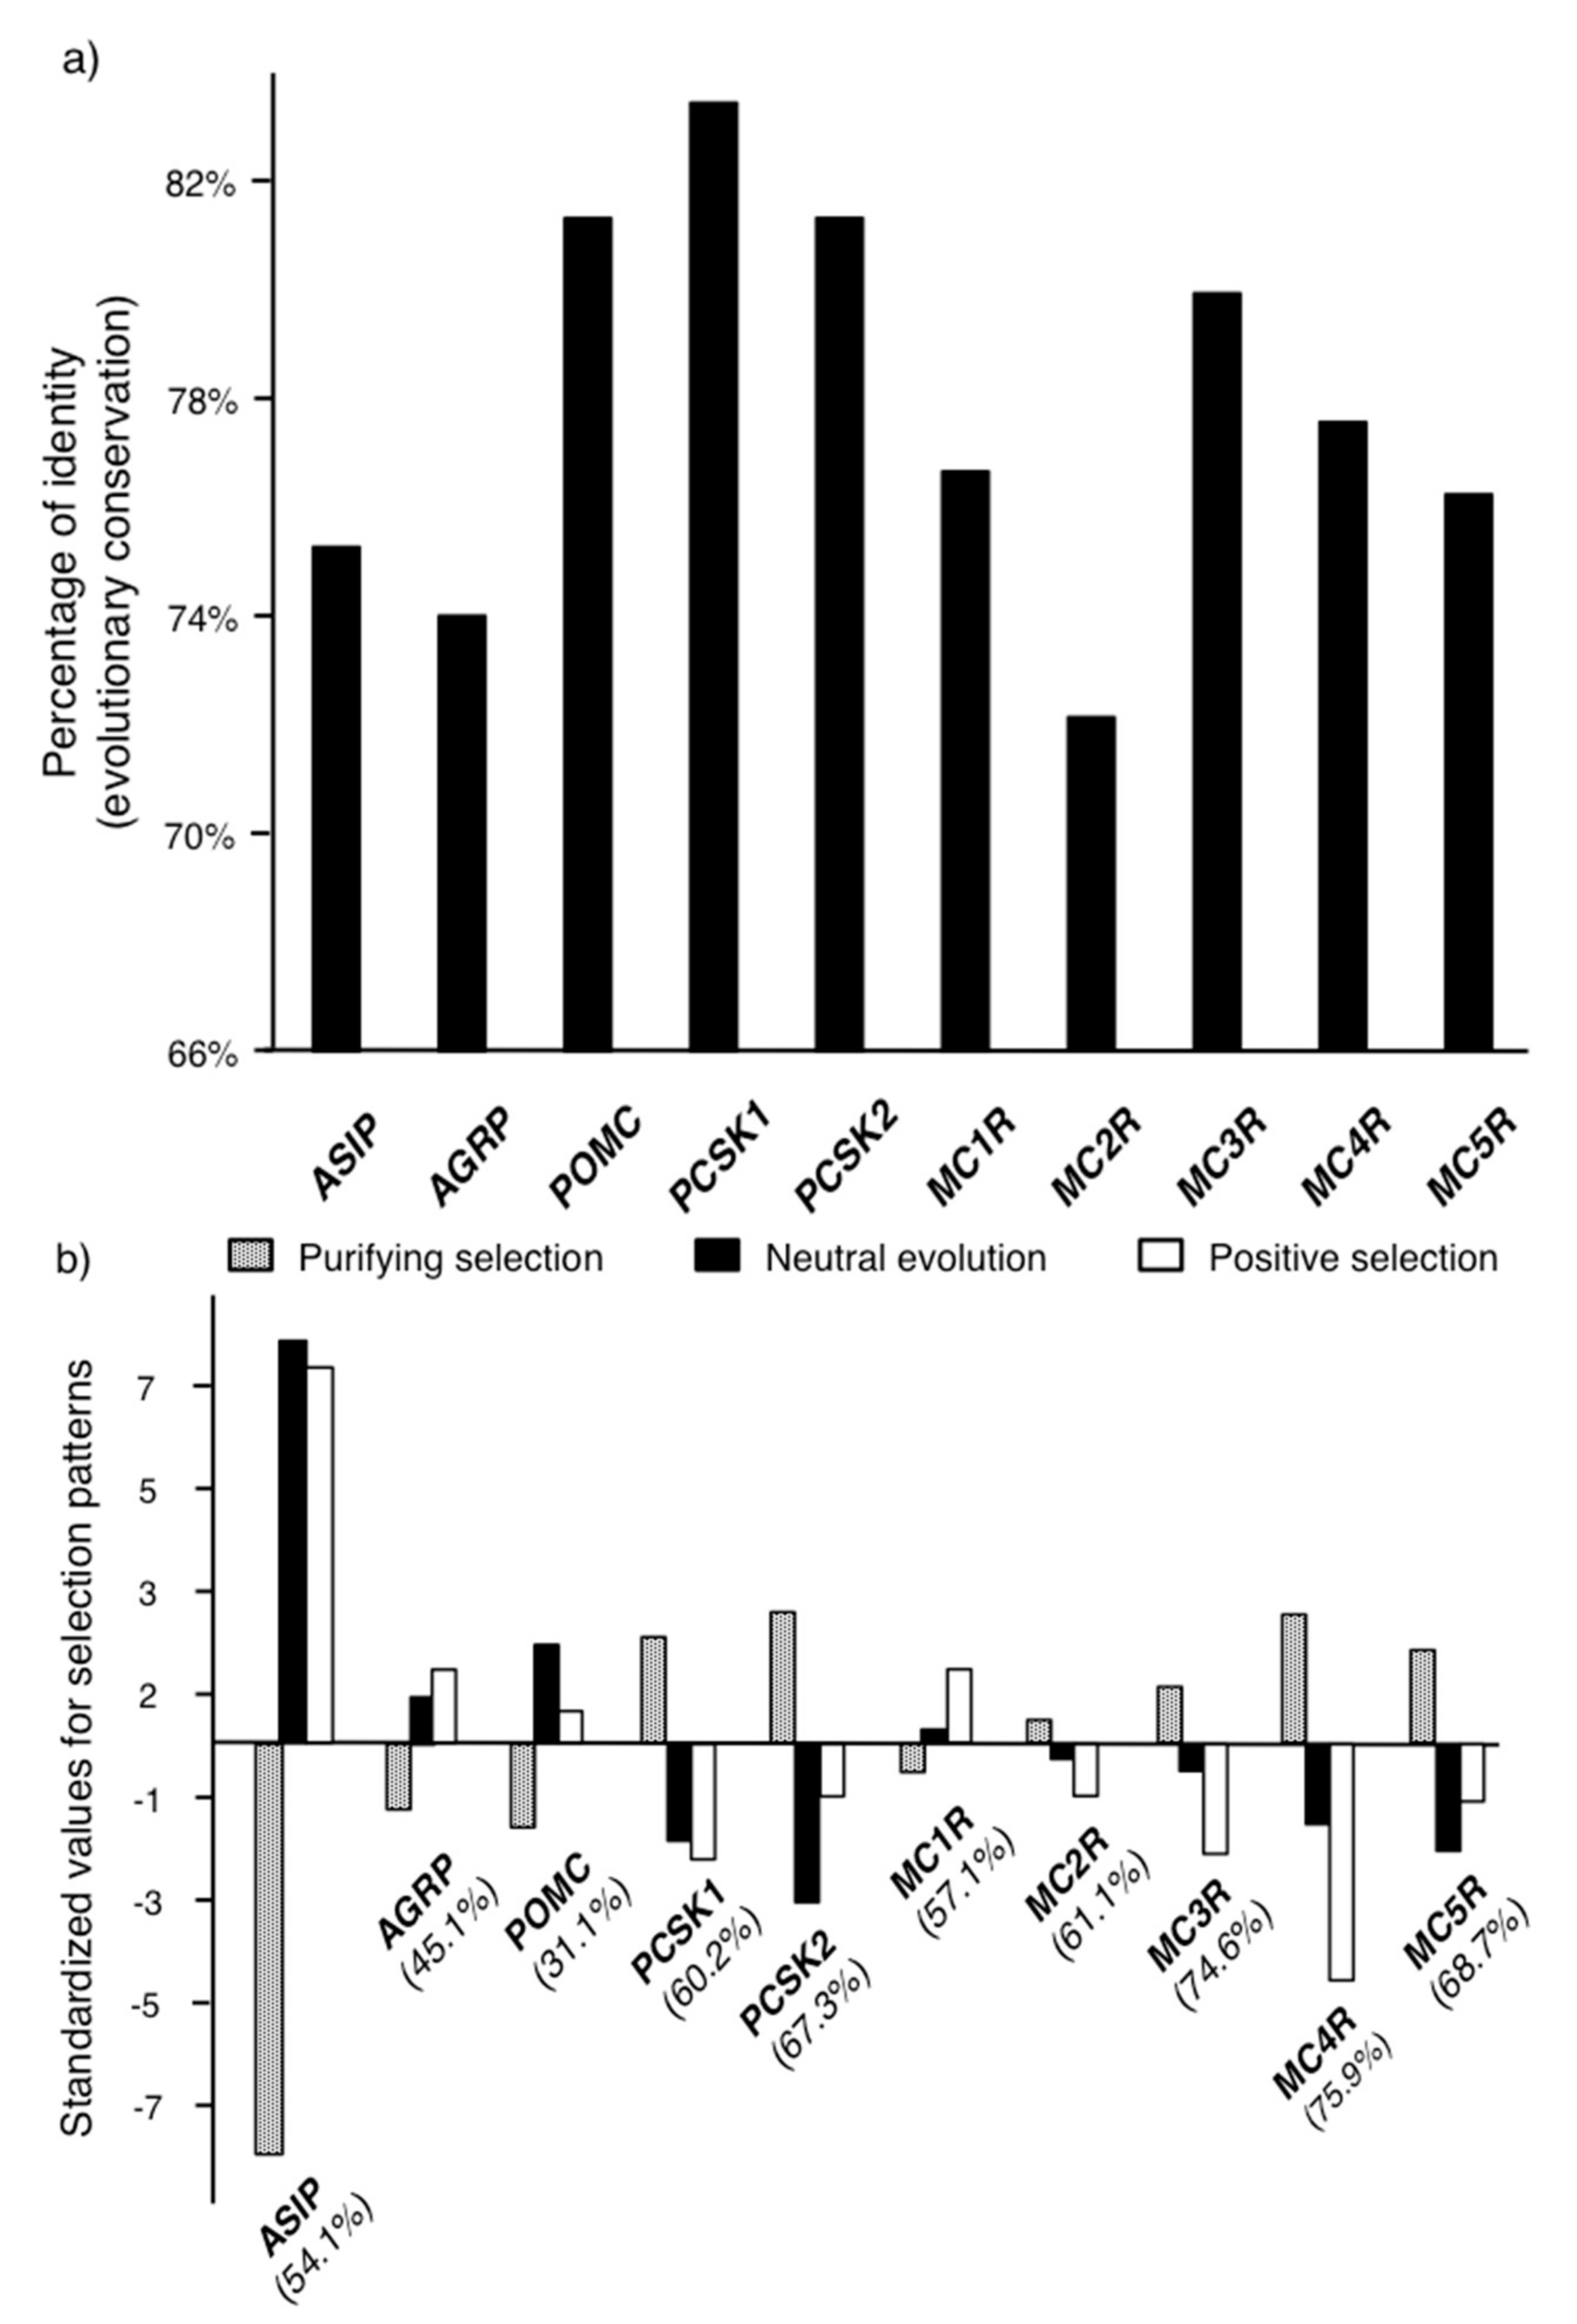
2.1. Molecular Evolution of the Genes in the Melanocortin System
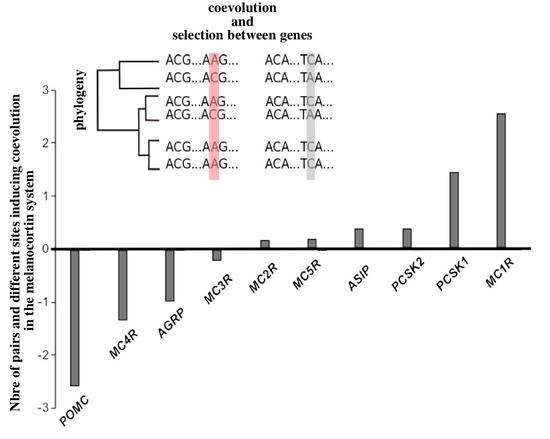
2.2. Molecular Coevolution among the Melanocortin System Genes
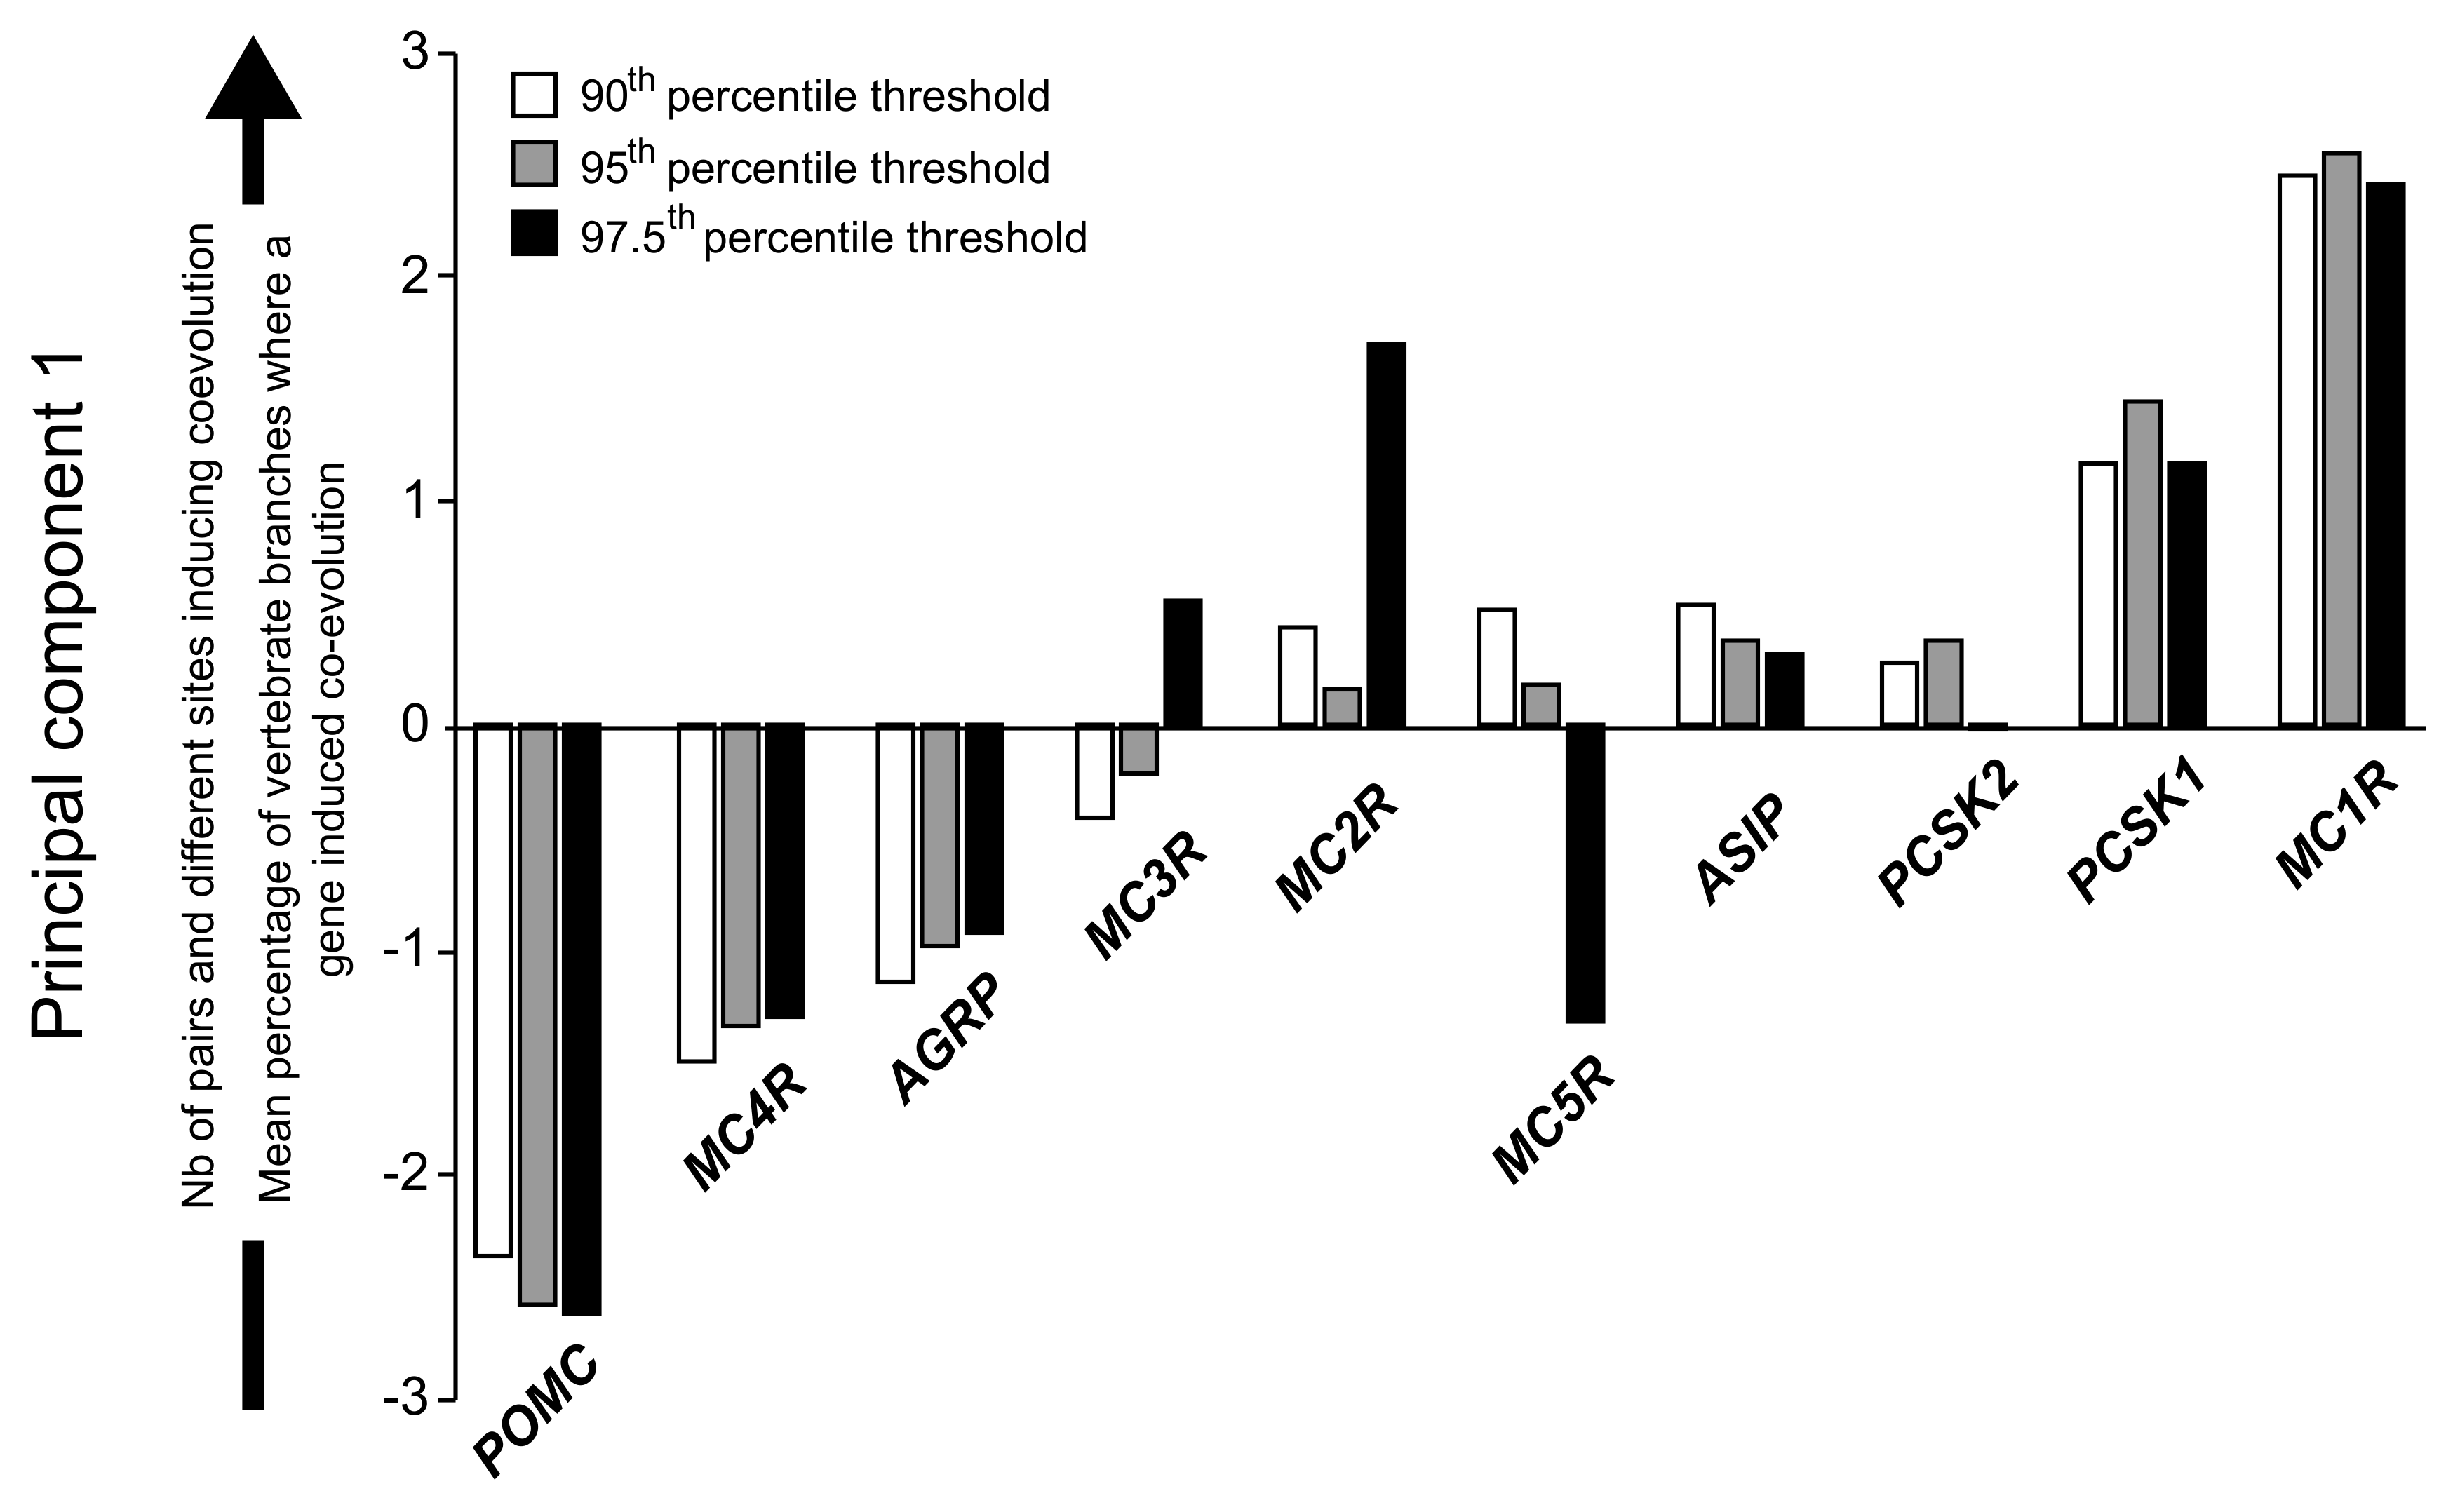
2.3. Coevolution of the Melanocortin System
3. Material and Methods
3.1. Data Set
3.2. Phylogeny
3.3. Estimation of Evolutionary Constraint and Selective Pressure
3.4. Estimation of Coevolution
3.5. Evolutionary Response in the Melanocortin System
4. Conclusions
Supplementary Materials
Acknowledgments
Author Contributions
Conflicts of Interest
Funding
Availability of Data
References
- Wagner, G.P.; Pavlicev, M.; Cheverud, J.M. The road to modularity. Nat. Rev. Genet. 2007, 8, 921–931. [Google Scholar] [CrossRef] [PubMed]
- Melo, D.; Porto, A.; Cheverud, J.M.; Marroig, G. Modularity: Genes, Development, and Evolution. Annu. Rev. Ecol. Evol. Syst. 2016, 47. [Google Scholar] [CrossRef] [PubMed]
- Melo, D.; Marroig, G. Directional selection can drive the evolution of modularity in complex traits. Proc. Natl. Acad. Sci. USA 2014, 112, 470–475. [Google Scholar] [CrossRef] [PubMed]
- Greenwood, A.; Wark, A.; Yoshida, K.; Peichel, C. Genetic and Neural Modularity Underlie the Evolution of Schooling Behavior in Threespine Sticklebacks. Curr. Biol. 2013, 23, 1884–1888. [Google Scholar] [CrossRef] [PubMed]
- Fisher, R.A. The Genetical Theory of Natural Selection; Clarendon Press: Oxford, UK, 1930. [Google Scholar]
- Orr, H.A. Adaptation and the cost of complexity. Evolution 2000, 54, 13–20. [Google Scholar] [CrossRef] [PubMed]
- Wagner, G.P.; Zhang, J. Fundamental concepts in genetics: The pleiotropic structure of the genotype–phenotype map: The evolvability of complex organisms. Nat. Rev. Genet. 2011, 12, 204–213. [Google Scholar] [CrossRef] [PubMed]
- Dib, L.; Meyer, X.; Artimo, P.; Ioannidis, V.; Stockinger, H.; Salamin, N. Coev-web: A web platform designed to simulate and evaluate coevolving positions along a phylogenetic tree. BMC Bioinform. 2015, 16, 394. [Google Scholar] [CrossRef] [PubMed]
- Dib, L.; Silvestro, D.; Salamin, N. Evolutionary footprint of coevolving positions in genes. Bioinformatics 2014, 30, 1241–1249. [Google Scholar] [CrossRef] [PubMed]
- Dutheil, J.; Galtier, N. Detecting groups of coevolving positions in a molecule: A clustering approach. BMC Evol. Biol. 2007, 7, 242. [Google Scholar] [CrossRef] [PubMed]
- Dores, R.M.; Londraville, R.L.; Prokop, J.; Davis, P.; Dewey, N.; Lesinski, N. Molecular evolution of GPCRs: Melanocortin/melanocortin receptors. J. Mol. Endocrinol. 2014, 52, T29–T42. [Google Scholar] [CrossRef] [PubMed]
- Boswell, T.; Takeuchi, S. Recent developments in our understanding of the avian melanocortin system: Its involvement in the regulation of pigmentation and energy homeostasis. Peptides 2005, 26, 1733–1743. [Google Scholar] [CrossRef] [PubMed]
- Ducrest, A.-L.; Keller, L.; Roulin, A. Pleiotropy in the melanocortin system, coloration and behavioural syndromes. Trends Ecol. Evol. 2008, 23, 502–510. [Google Scholar] [CrossRef] [PubMed]
- Gantz, I.; Fong, T. The melanocortin system. Am. J. Physiol. Endocrinol. Metab. 2003, 682, E468–E474. [Google Scholar] [CrossRef] [PubMed]
- Cortés, R.; Navarro, S.; Agulleiro, M.J.; Guillot, R.; García-Herranz, V.; Sánchez, E.; Cerdá-Reverter, J.M. Evolution of the melanocortin system. Gen. Comp. Endocrinol. 2014, 209, 3–10. [Google Scholar] [CrossRef] [PubMed]
- Cone, R.D. Anatomy and regulation of the central melanocortin system. Nat. Neurosci. 2005, 8, 571–578. [Google Scholar] [CrossRef] [PubMed]
- Cal, L.; Suarez-Bregua, P.; Cerdá-Reverter, J.M.; Braasch, I.; Rotllant, J. Fish pigmentation and the melanocortin system. Comp. Biochem. Physiol. Part A Mol. Integr. Physiol. 2017, 211, 26–33. [Google Scholar] [CrossRef] [PubMed]
- Getting, S.J. Melanocortin peptides and their receptors: New targets for anti-inflammatory therapy. Trends Pharmacol. Sci. 2002, 23, 447–449. [Google Scholar] [CrossRef]
- Benjannet, S.; Rondeau, N.; Day, R.; Chrétien, M.; Seidah, N.G. PC1 and PC2 are proprotein convertases capable of cleaving proopiomelanocortin at distinct pairs of basic residues. Proc. Natl. Acad. Sci. USA 1991, 88, 3564–3568. [Google Scholar] [CrossRef] [PubMed]
- Böhm, M.; Luger, T.A.; Tobin, D.J.; García-Borrón, J.C. Melanocortin receptor ligands: New horizons for skin biology and clinical dermatology. J. Investig. Dermatol. 2006, 126, 1966–1975. [Google Scholar] [CrossRef] [PubMed]
- Rouzaud, F.; Kadekaro, A.L.; Abdel-Malek, Z.A.; Hearing, V.J. MC1R and the response of melanocytes to ultraviolet radiation. Mutat. Res. 2005, 571, 133–152. [Google Scholar] [CrossRef] [PubMed]
- Ollmann, M.M. Antagonism of Central Melanocortin Receptors in Vitro and in Vivo by Agouti-Related Protein. Science 1997, 278, 135–138. [Google Scholar] [CrossRef] [PubMed]
- Danielson, P.B.; Dores, R.M. Molecular evolution of the opioid/orphanin gene family. Gen. Comp. Endocrinol. 1999, 113, 169–186. [Google Scholar] [CrossRef] [PubMed]
- Baron, A.; Veo, K.; Angleson, J.; Dores, R.M. Modeling the evolution of the MC2R and MC5R genes: Studies on the cartilaginous fish, Heterondotus francisci. Gen. Comp. Endocrinol. 2009, 161, 13–19. [Google Scholar] [CrossRef] [PubMed]
- Dores, R.M.; Baron, A.J. Evolution of POMC: Origin, phylogeny, posttranslational processing, and the melanocortins. Ann. N. Y. Acad. Sci. 2011, 1220, 34–48. [Google Scholar] [CrossRef] [PubMed]
- Pazos, F.; Valencia, A. Protein co-evolution, co-adaptation and interactions. EMBO J. 2008, 27, 2648–2655. [Google Scholar] [CrossRef] [PubMed] [Green Version]
- Lovell, S.C.; Robertson, D.L. An integrated view of molecular coevolution in protein-protein interactions. Mol. Biol. Evol. 2010, 27, 2567–2575. [Google Scholar] [CrossRef] [PubMed]
- Galis, F.; Van Dooren, T.J.M.; Metz, J.A.J. Conservation of the segmented germband stage: Robustness or pleiotropy? Trends Genet. 2002, 18, 504–509. [Google Scholar] [CrossRef]
- Gratten, J.; Wilson, A.J.; McRae, A.F.; Beraldi, D.; Visscher, P.M.; Pemberton, J.M.; Slate, J. A localized negative genetic correlation constrains microevolution of coat color in wild sheep. Science 2008, 319, 318–320. [Google Scholar] [CrossRef] [PubMed]
- Woolfe, A.; Goodson, M.; Goode, D.K.; Snell, P.; McEwen, G.K.; Vavouri, T.; Smith, S.F.; North, P.; Callaway, H.; Kelly, K.; et al. Highly conserved non-coding sequences are associated with vertebrate development. PLoS Biol. 2005, 3. [Google Scholar] [CrossRef] [PubMed] [Green Version]
- Santini, S.; Santini, S.; Boore, J.L.; Boore, J.L.; Meyer, A.; Meyer, A. Evolutionary Conservation of Regulatory Elements in Vertebrate. Genome Res. 2003, 1111–1122. [Google Scholar] [CrossRef] [PubMed]
- Mundy, N.I. A window on the genetics of evolution: MC1R and plumage colouration in birds. Proc. R. Soc. B Biol. Sci. 2005, 272, 1633–1640. [Google Scholar] [CrossRef] [PubMed]
- Manceau, M.; Domingues, V.S.; Mallarino, R.; Hoekstra, H.E.; Barsh, G.S.; Jackson, I.J.; Mills, M.G.; Patterson, L.B.; Candille, S.I.; Rawls, J.F.; et al. The developmental role of Agouti in color pattern evolution. Science 2011, 331, 1062–1065. [Google Scholar] [CrossRef] [PubMed] [Green Version]
- Steiner, C.C.; Weber, J.N.; Hoekstra, H.E. Adaptive variation in beach mice produced by two interacting pigmentation genes. PLoS Biol. 2007, 5, 1880–1889. [Google Scholar] [CrossRef] [PubMed] [Green Version]
- San-Jose, L.M.; Ducrest, A.-L.; Ducret, V.; Béziers, P.; Simon, C.; Wakamatsu, K.; Roulin, A. Effect of the MC1R gene on sexual dimorphism in melanin-based colorations. Mol. Ecol. 2015, 24, 2794–2808. [Google Scholar] [CrossRef] [PubMed]
- Rosenblum, E.B.; Römpler, H.; Schöneberg, T.; Hoekstra, H.E. Molecular and functional basis of phenotypic convergence in white lizards at White Sands. Proc. Natl. Acad. Sci. USA 2010, 107, 2113–2117. [Google Scholar] [CrossRef] [PubMed] [Green Version]
- Gonzalez-Rey, E.; Chorny, A.; Delgado, M. Regulation of immune tolerance by anti-inflammatory neuropeptides. Nat. Rev. Immunol. 2007, 7, 52–63. [Google Scholar] [CrossRef] [PubMed]
- Voisey, J.; van Daal, A. Agouti: From mouse to man, from skin to fat. Pigment Cell Res. 2002, 15, 10–18. [Google Scholar] [CrossRef] [PubMed]
- Mogil, J.S.; Wilson, S.G.; Chesler, E.J.; Rankin, A.L.; Nemmani, K.V.S.; Lariviere, W.R.; Groce, M.K.; Wallace, M.R.; Kaplan, L.; Staud, R.; et al. The melanocortin-1 receptor gene mediates female-specific mechanisms of analgesia in mice and humans. Proc. Natl. Acad. Sci. USA 2003, 100, 4867–4872. [Google Scholar] [CrossRef] [PubMed]
- Gangoso, L.; Grande, J.; Ducrest, A.-L.; Figuerola, J.; Bortolotti, G.; Andrés, J.; Roulin, A. MC1R-dependent, melanin-based colour polymorphism is associated with cell-mediated response in the Eleonora’s falcon. J. Evol. Biol. 2011, 24, 2055–2063. [Google Scholar] [CrossRef] [PubMed]
- Quinn, G.P.; Keough, M.J. Experimental Design and Data Analysis for Biologist; Cambridge University Press: Cambridge, UK, 2002. [Google Scholar]
- García-Borrón, J.C.; Sánchez-Laorden, B.L.; Jiménez-Cervantes, C. Melanocortin-1 receptor structure and functional regulation. Pigment Cell Res. 2005, 18, 393–410. [Google Scholar] [CrossRef] [PubMed]
- Chen, W.; Li, J.; Qu, H.; Song, Z.; Yang, Z.; Huo, J.; Jiang, H.; Huang, Q.; Huo, M.; Liu, B.; et al. The melanocortin 1 receptor (MC1R) inhibits the inflammatory response in Raw 264.7 cells and atopic dermatitis (AD) mouse model. Mol. Biol. Rep. 2013, 40, 1987–1996. [Google Scholar] [CrossRef] [PubMed]
- Dessinioti, C.; Antoniou, C.; Katsambas, A.; Stratigos, A.J. Melanocortin 1 receptor variants: Functional role and pigmentary associations. Photochem. Photobiol. 2011, 87, 978–987. [Google Scholar] [CrossRef] [PubMed]
- Lindgren, J.; Sjövall, P.; Carney, R.M.; Uvdal, P.; Gren, J.A.; Dyke, G.; Schultz, B.P.; Shawkey, M.D.; Barnes, K.R.; Polcyn, M.J. Skin pigmentation provides evidence of convergent melanism in extinct marine reptiles. Nature 2014, 506, 484–488. [Google Scholar] [CrossRef] [PubMed]
- Roulin, A.; Ducrest, A.-L. Genetics of colouration in birds. Semin. Cell Dev. Biol. 2013, 24, 594–608. [Google Scholar] [CrossRef] [PubMed]
- Wagner, G.P.; Altenberg, L. Complex adaptations and the evolution of evolvability. Evolution (N. Y.) 1996, 50, 967–976. [Google Scholar] [CrossRef]
- Kobayashi, Y.; Hamamoto, A.; Takahashi, A.; Saito, Y. Dimerization of melanocortin receptor 1 (MC1R) and MC5R creates a ligand-dependent signal modulation: Potential participation in physiological color change in the flounder. Gen. Comp. Endocrinol. 2016, 230, 103–109. [Google Scholar] [CrossRef] [PubMed]
- Mandrika, I.; Petrovska, R.; Wikberg, J. Melanocortin receptors form constitutive homo- and heterodimers. Biochem. Biophys. Res. Commun. 2005, 326, 349–354. [Google Scholar] [CrossRef] [PubMed]
- Västermark, Å.; Schiöth, H.B. The early origin of melanocortin receptors, agouti-related peptide, agouti signalling peptide, and melanocortin receptor-accessory proteins, with emphasis on pufferfishes, elephant shark, lampreys, and amphioxus. Eur. J. Pharmacol. 2011, 660, 61–69. [Google Scholar] [CrossRef]
- Haitina, T.; Klovins, J.; Takahashi, A.; Löwgren, M.; Ringholm, A.; Enberg, J.; Kawauchi, H.; Larson, E.T.; Fredriksson, R.; Schiöth, H.B. Functional characterization of two melanocortin (MC) receptors in lamprey showing orthology to the MC1 and MC4 receptor subtypes. BMC Evol. Biol. 2007, 7, 101. [Google Scholar] [CrossRef] [PubMed]
- Klovins, J.; Haitina, T.; Fridmanis, D.; Kilianova, Z.; Kapa, I.; Fredriksson, R.; Gallo-Payet, N.; Schiöth, H.B. The Melanocortin System in Fugu: Determination of POMC/AGRP/MCR Gene Repertoire and Synteny, As Well As Pharmacology and Anatomical Distribution of the MCRs. Mol. Biol. Evol. 2004, 21, 563–579. [Google Scholar] [CrossRef] [PubMed]
- Ringholm, A.; Fredriksson, R.; Poliakova, N.; Yan, Y.L.; Postlethwait, J.H.; Larhammar, D.; Schiöth, H.B. One melanocortin 4 and two melanocortin 5 receptors from zebrafish show remarkable conservation in structure and pharmacology. J. Neurochem. 2002, 82, 6–18. [Google Scholar] [CrossRef] [PubMed]
- Salzet, M.; Salzet-Raveillon, B.; Cocquerelle, C.; Verger-Bocquet, M.; Pryor, S.C.; Rialas, C.M.; Laurent, V.; Stefano, G.B. Leech immunocytes contain proopiomelanocortin: Nitric oxide mediates hemolymph proopiomelanocortin processing. J. Immunol. 1997, 159, 5400–5411. [Google Scholar] [PubMed]
- Malagoli, D.; Accorsi, A.; Ottaviani, E. The evolution of pro-opiomelanocortin: Looking for the invertebrate fingerprints. Peptides 2011, 32, 2137–2140. [Google Scholar] [CrossRef] [PubMed]
- Edgar, R.C. MUSCLE: Multiple sequence alignment with high accuracy and high throughput. Nucleic Acids Res. 2004, 32, 1792–1797. [Google Scholar] [CrossRef] [PubMed]
- Yang, Z.; Dos Reis, M. Statistical properties of the branch-site test of positive selection. Mol. Biol. Evol. 2011, 28, 1217–1228. [Google Scholar] [CrossRef] [PubMed]
- Guindon, S.; Dufayard, J.F.; Lefort, V.; Anisimova, M.; Hordijk, W.; Gascuel, O. New algorithms and methods to estimate maximum-likelihood phylogenies: Assessing the performance of PhyML 3.0. Syst. Biol. 2010, 59, 307–321. [Google Scholar] [CrossRef] [PubMed]
- Murrell, B.; Wertheim, J.O.; Moola, S.; Weighill, T.; Scheffler, K.; Kosakovsky Pond, S.L. Detecting individual sites subject to episodic diversifying selection. PLoS Genet. 2012, 8. [Google Scholar] [CrossRef] [PubMed]
- Dabney, A.; Storey, J.D.; Warnes, G.R. Qvalue: Q-Value Estimation for False Discovery Rate Control. 2010. Available online: ftp://ftp.uni-bayreuth.de/pub/math/statlib/R/CRAN/src/contrib/Descriptions/qvalue.html (accessed on 18 January 2016).
- Yang, Z. PAML 4: Phylogenetic analysis by maximum likelihood. Mol. Biol. Evol. 2007, 24, 1586–1591. [Google Scholar] [CrossRef] [PubMed]
- R Development Core Team. R: A Language and Environment for Statistical Computing; R Foundation for Statistical Computing: Vienna, Austria, 2011; ISBN 3-900051-07-0-2008. [Google Scholar]


| Coevolutionary Response to Positive Selection on Target Genes | |||||||||||||||
|---|---|---|---|---|---|---|---|---|---|---|---|---|---|---|---|
| ASIP | AGRP | POMC | PCSK1 | PCSK2 | MC1R | MC2R | MC3R | MC4R | MC5R | Nucleotide Sequence Length | Nb Pairs | Nb Different Sites | % Nb Different Sites | ||
| Positive selection on target genes | ASIP | - | 4 | 1 | 6 | 6 | 3 | 14 | 9 | 2 | 3 | 396 | 176 a | 22 a | 5.6% |
| AGRP | 2 | - | 4 | 4 | 4 | 0 | 7 | 2 | 4 | 6 | 396 | 141 a | 9 | 2.3% | |
| POMC | 0 | 2 | - | 2 | 0 | 0 | 3 | 0 | 0 | 1 | 801 | 33 b | 8 | 1.0% | |
| PCSK1 | 6 | 8 | 9 | - | 10 | 4 | 13 | 5 | 8 | 6 | 2256 | 322 b | 25 b | 1.1% | |
| PCSK2 | 3 | 1 | 0 | 10 | - | 3 | 6 | 2 | 4 | 3 | 1914 | 208 b | 13 b | 0.7% | |
| MC1R | 5 | 3 | 1 | 1 | 3 | - | 11 | 8 | 7 | 13 | 951 | 311 a | 34 a | 3.6% | |
| MC2R | 3 | 4 | 3 | 0 | 1 | 4 | - | 1 | 12 | 5 | 891 | 135 | 21 | 2.4% | |
| MC3R | 0 | 3 | 0 | 0 | 3 | 8 | 12 | - | 5 | 3 | 969 | 209 a | 17 | 1.8% | |
| MC4R | 0 | 2 | 0 | 0 | 2 | 5 | 3 | 1 | - | 0 | 996 | 85 b | 10 | 1.0% | |
| MC5R | 6 | 8 | 2 | 4 | 3 | 15 | 3 | 3 | 2 | - | 972 | 192 | 30 a | 3.1% | |
| Coevolving Pairs | |||||||||||
|---|---|---|---|---|---|---|---|---|---|---|---|
| ASIP | AGRP | POMC | PCSK1 | PCSK2 | MC1R | MC2R | MC3R | MC4R | MC5R | Average | |
| ASIP | - | 181 | 101 | 519 | 170 | 643 | 913 | 631 | 105 | 323 | 398 |
| AGRP | - | - | 276 | 761 | 714 | 477 | 511 | 364 | 299 | 352 | 428 |
| POMC | - | - | - | 1348 | - | 606 | 682 | 104 | 340 | 192 | 405 |
| PCSK1 | - | - | - | - | 4012 | 2672 | 3105 | 927 | 2704 | 1137 | 1909 |
| PCSK2 | - | - | - | - | - | 2088 | 2207 | 1025 | 1410 | 1754 | 1487 |
| MC1R | - | - | - | - | - | - | 1253 | 1203 | 1636 | 1519 | 1344 |
| MC2R | - | - | - | - | - | - | - | 1336 | 1662 | 2011 | 1520 |
| MC3R | - | - | - | - | - | - | - | - | 1281 | 1454 | 925 |
| MC4R | - | - | - | - | - | - | - | - | - | 1250 | 1187 |
| MC5R | - | - | - | - | - | - | - | - | - | - | 1110 |
© 2017 by the authors. Licensee MDPI, Basel, Switzerland. This article is an open access article distributed under the terms and conditions of the Creative Commons Attribution (CC BY) license (http://creativecommons.org/licenses/by/4.0/).
Share and Cite
Dib, L.; San-Jose, L.M.; Ducrest, A.-L.; Salamin, N.; Roulin, A. Selection on the Major Color Gene Melanocortin-1-Receptor Shaped the Evolution of the Melanocortin System Genes. Int. J. Mol. Sci. 2017, 18, 2618. https://doi.org/10.3390/ijms18122618
Dib L, San-Jose LM, Ducrest A-L, Salamin N, Roulin A. Selection on the Major Color Gene Melanocortin-1-Receptor Shaped the Evolution of the Melanocortin System Genes. International Journal of Molecular Sciences. 2017; 18(12):2618. https://doi.org/10.3390/ijms18122618
Chicago/Turabian StyleDib, Linda, Luis M. San-Jose, Anne-Lyse Ducrest, Nicolas Salamin, and Alexandre Roulin. 2017. "Selection on the Major Color Gene Melanocortin-1-Receptor Shaped the Evolution of the Melanocortin System Genes" International Journal of Molecular Sciences 18, no. 12: 2618. https://doi.org/10.3390/ijms18122618