
A Systematic Study of Dysregulated MicroRNA in Type 2 Diabetes Mellitus

Abstract
:1. Introduction
2. Results
2.1. Study Characteristics
2.2. Quality Assessment
2.3. Alterations of Specific miRNAs’ Levels among Different Tissues in T2DM
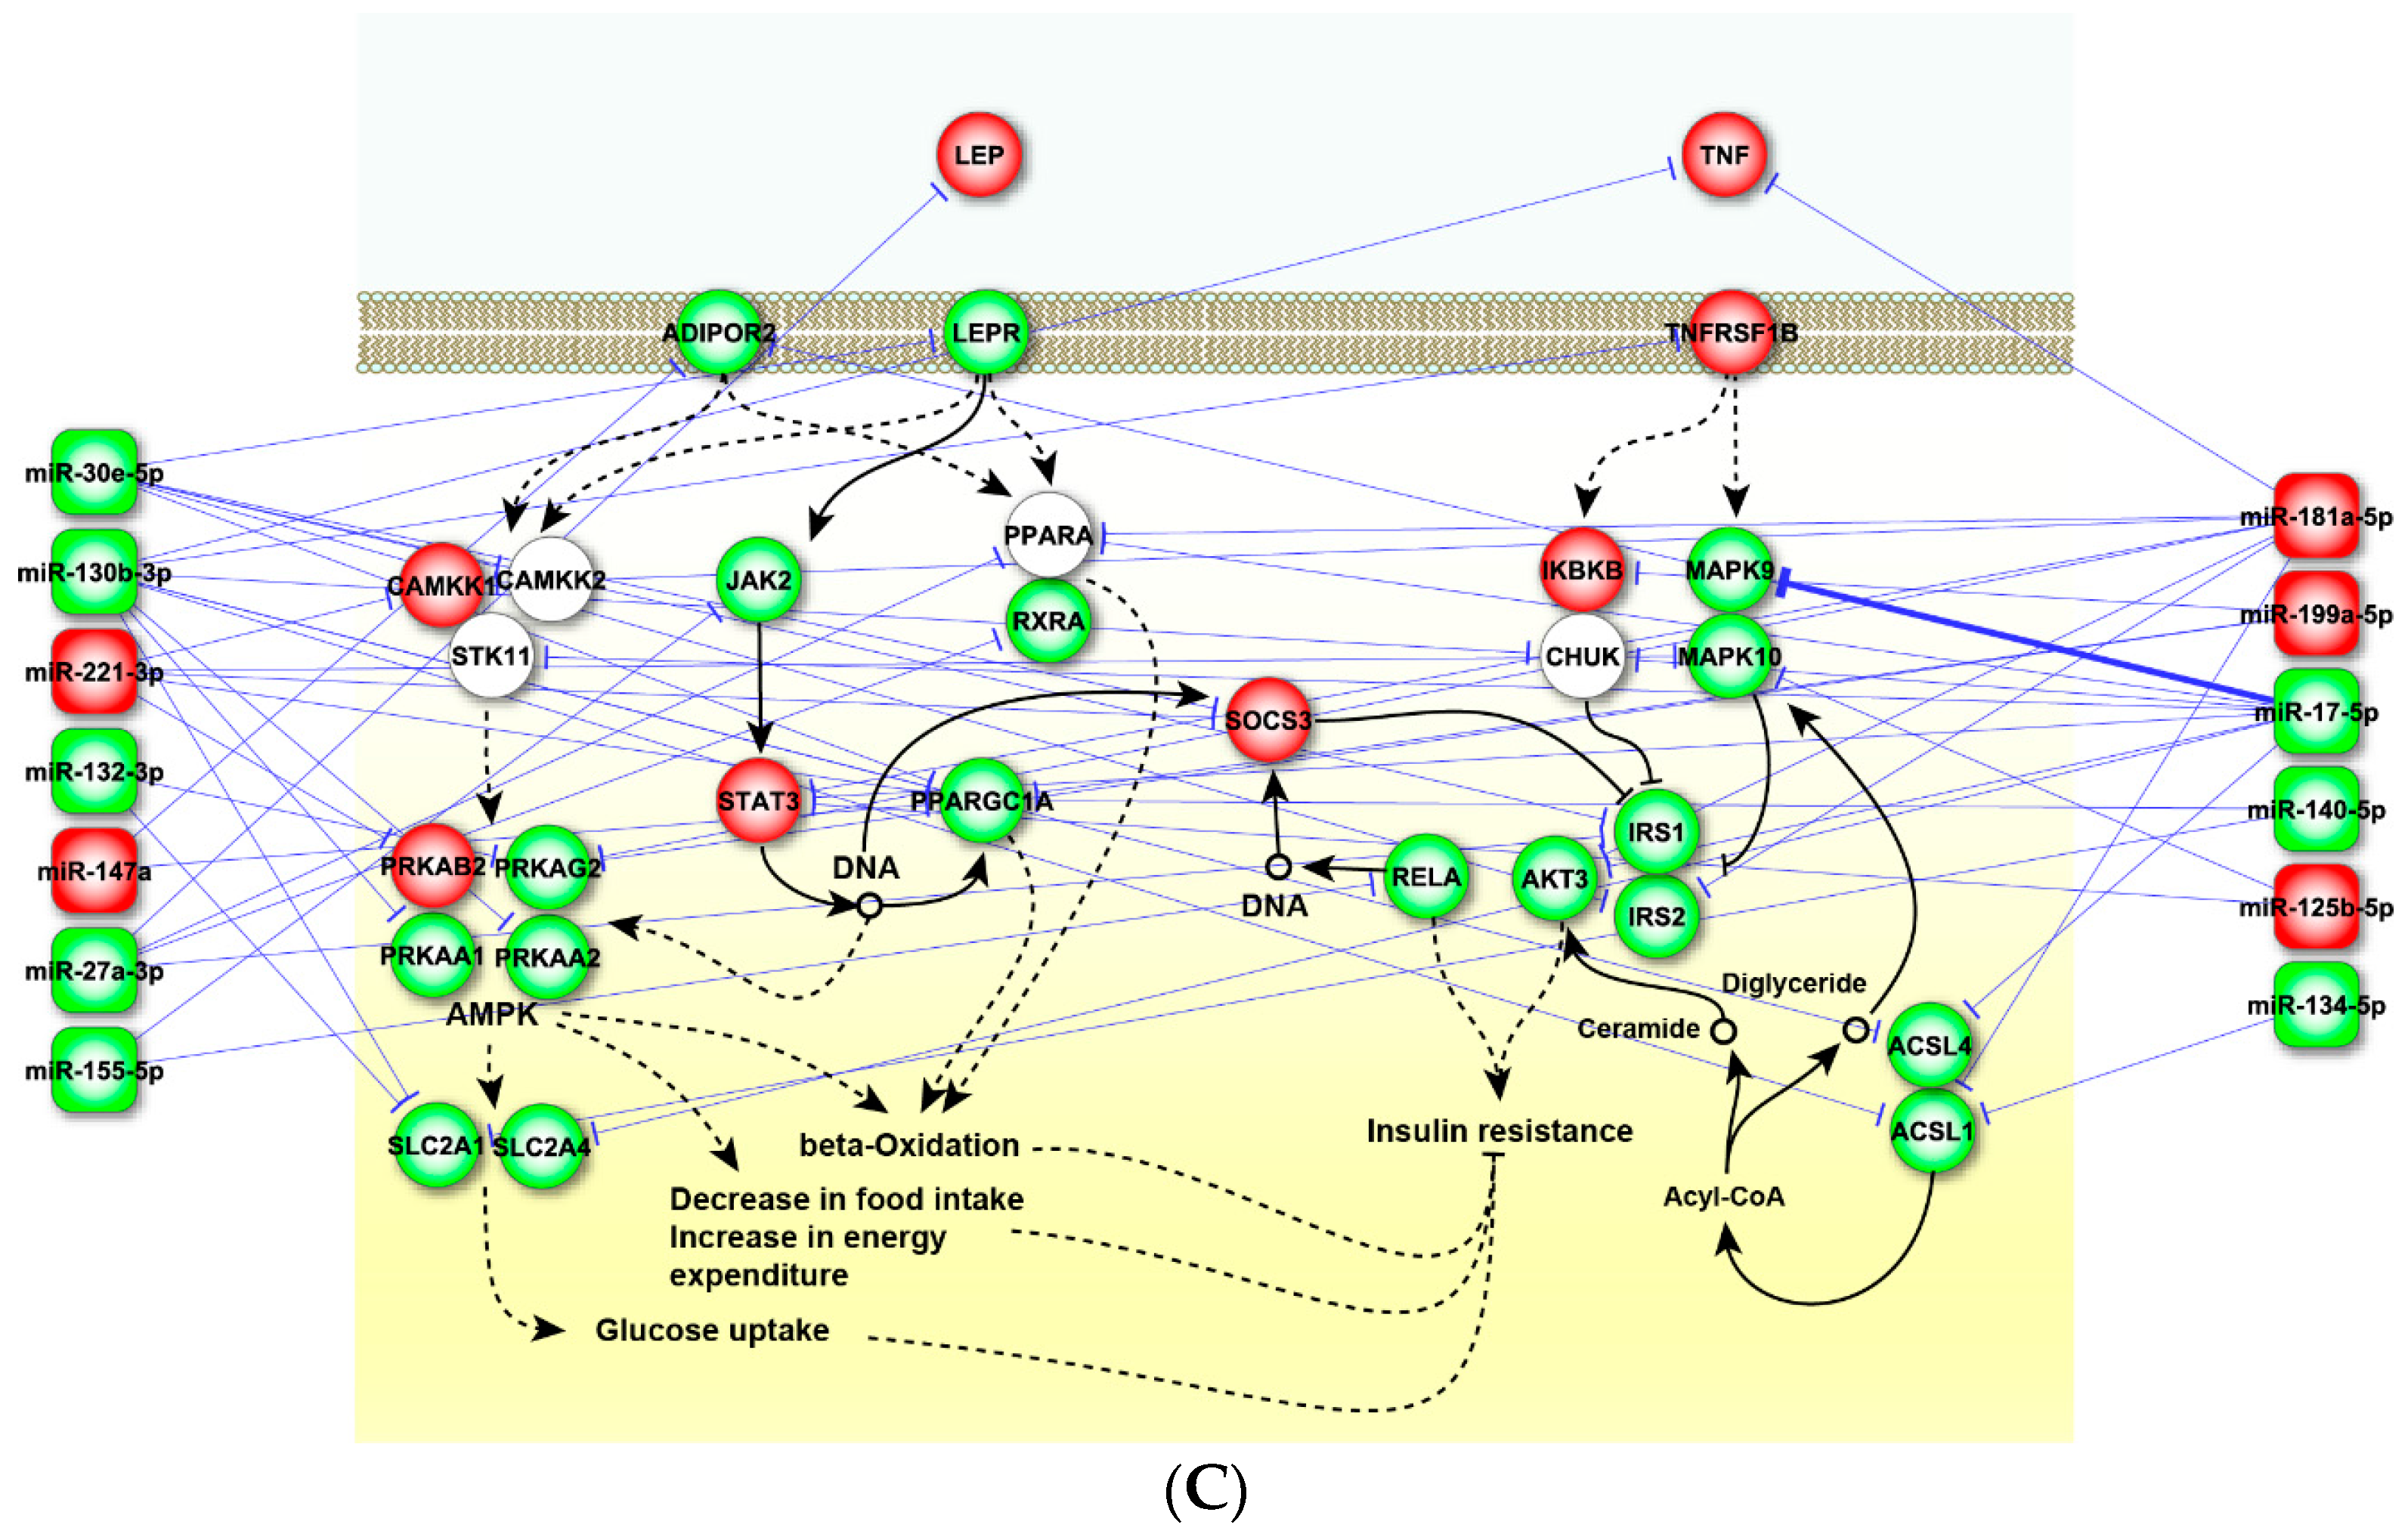
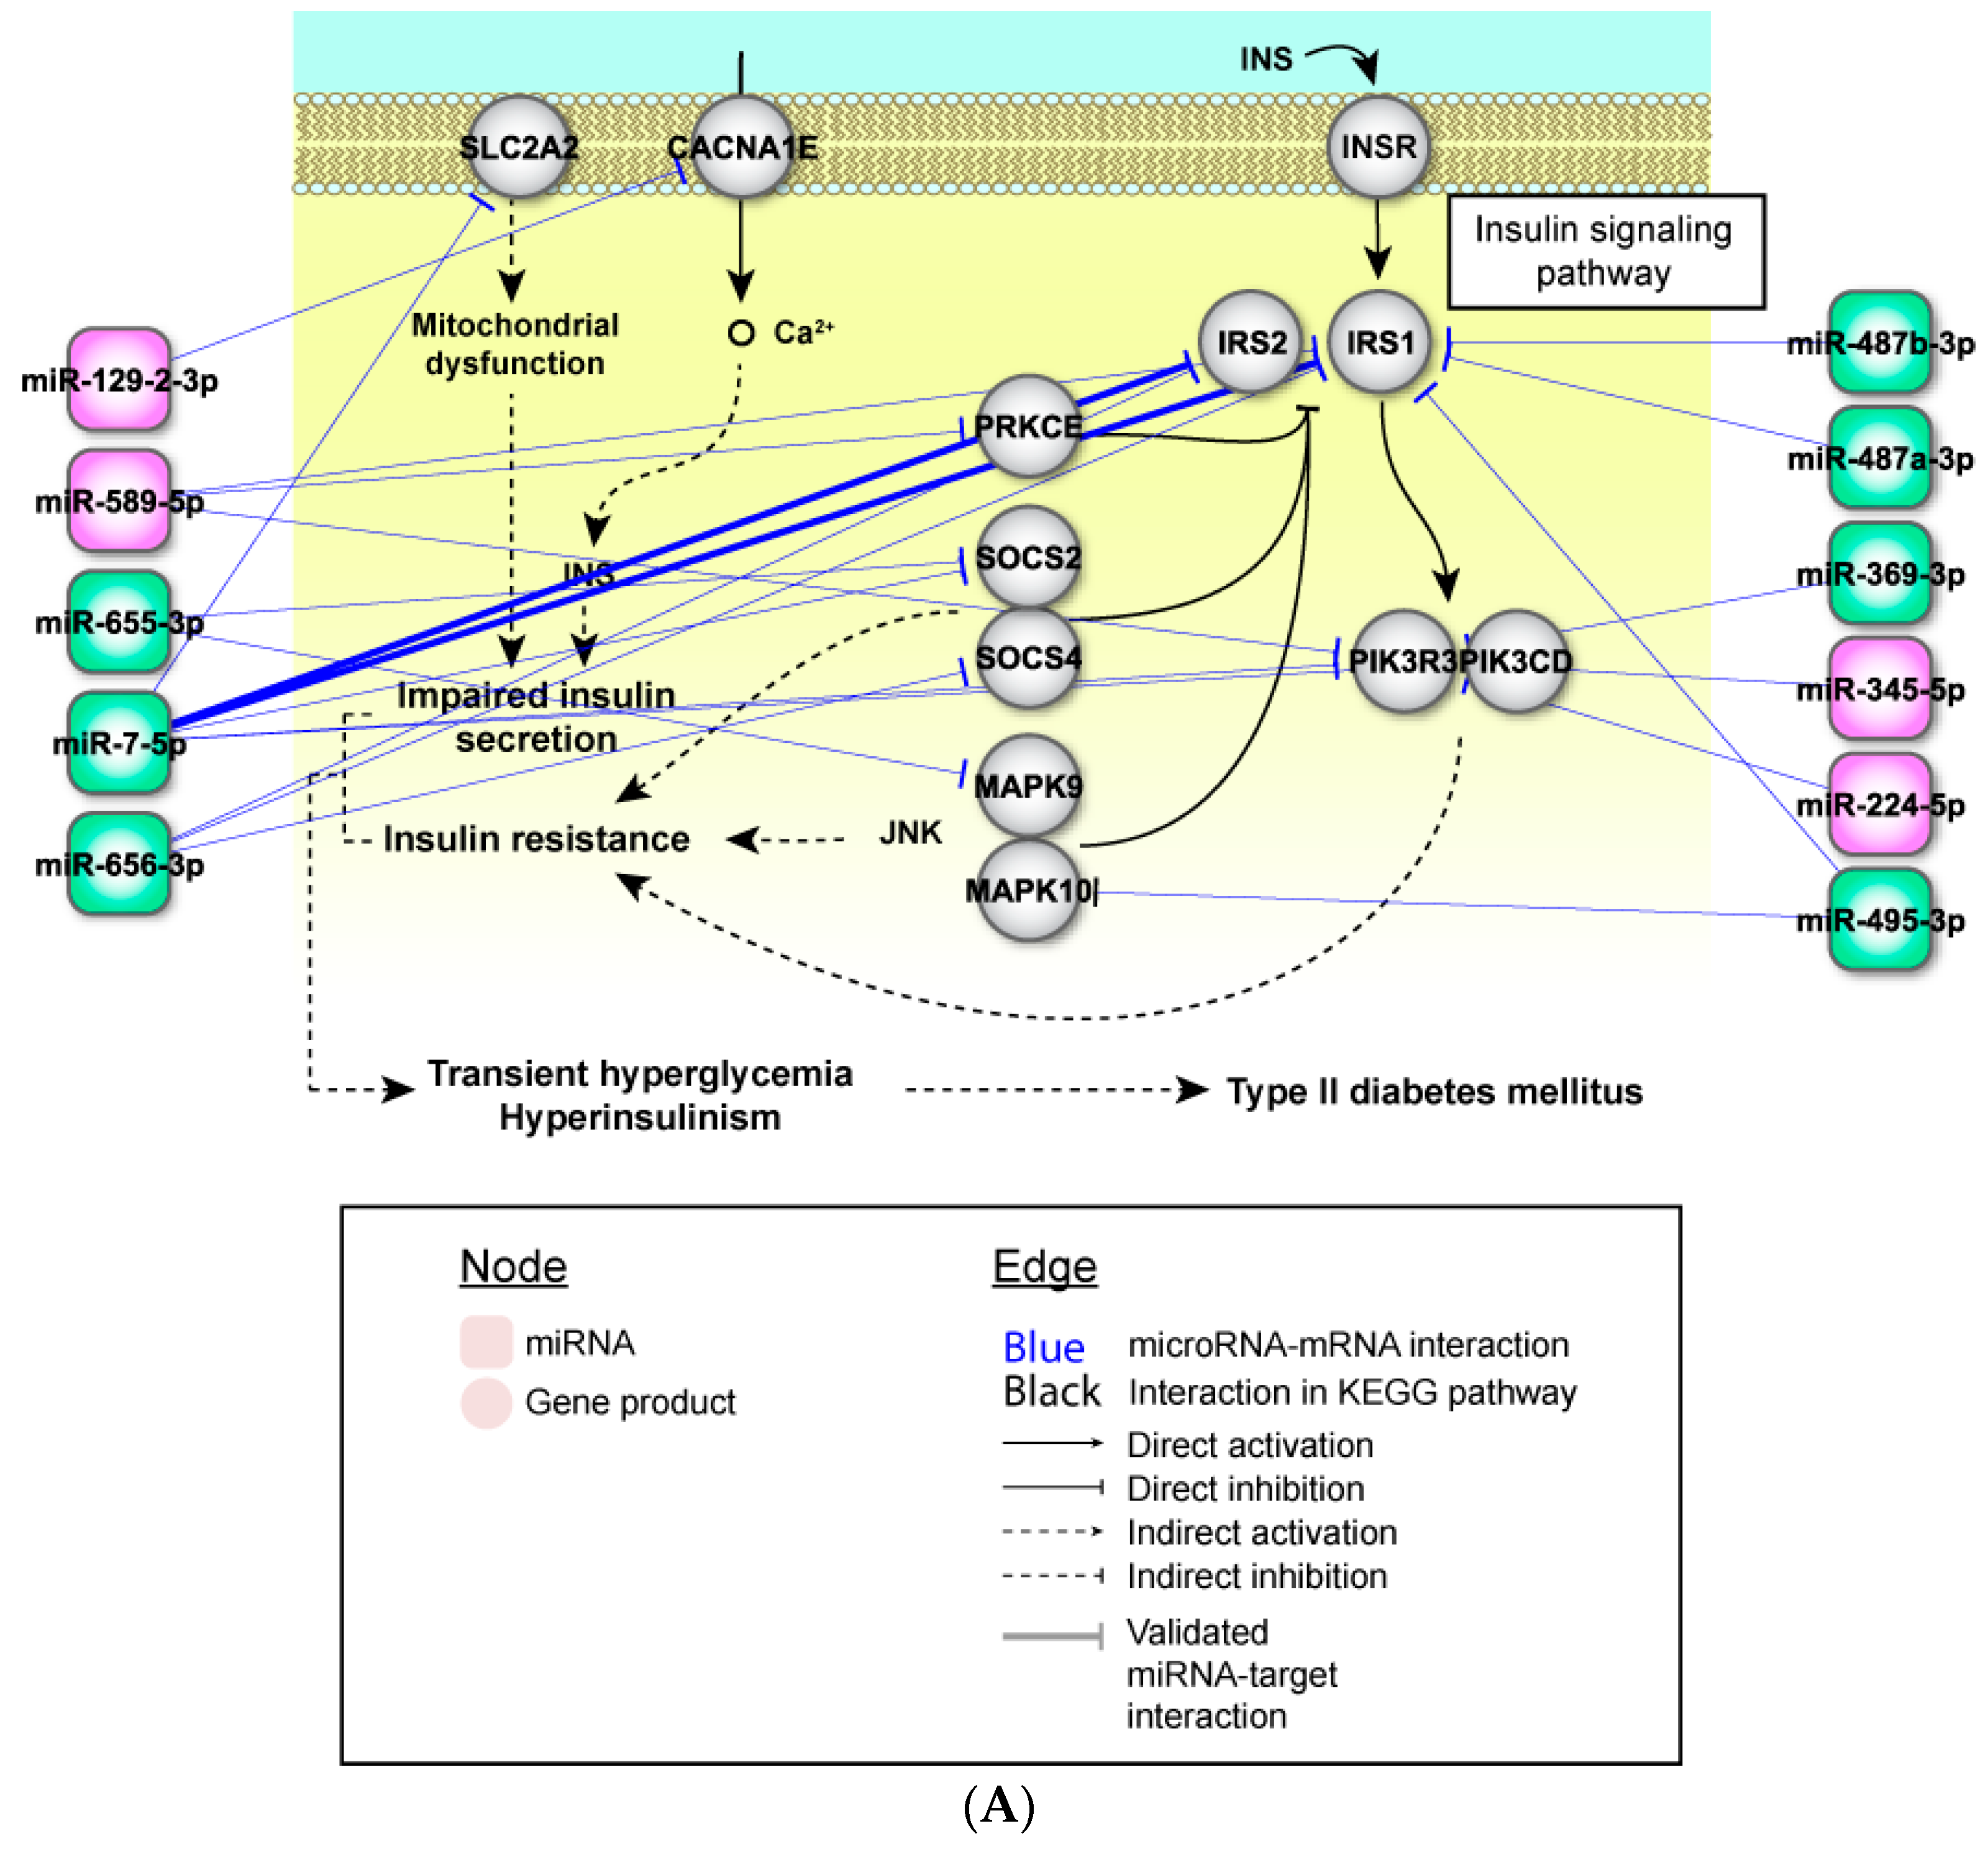
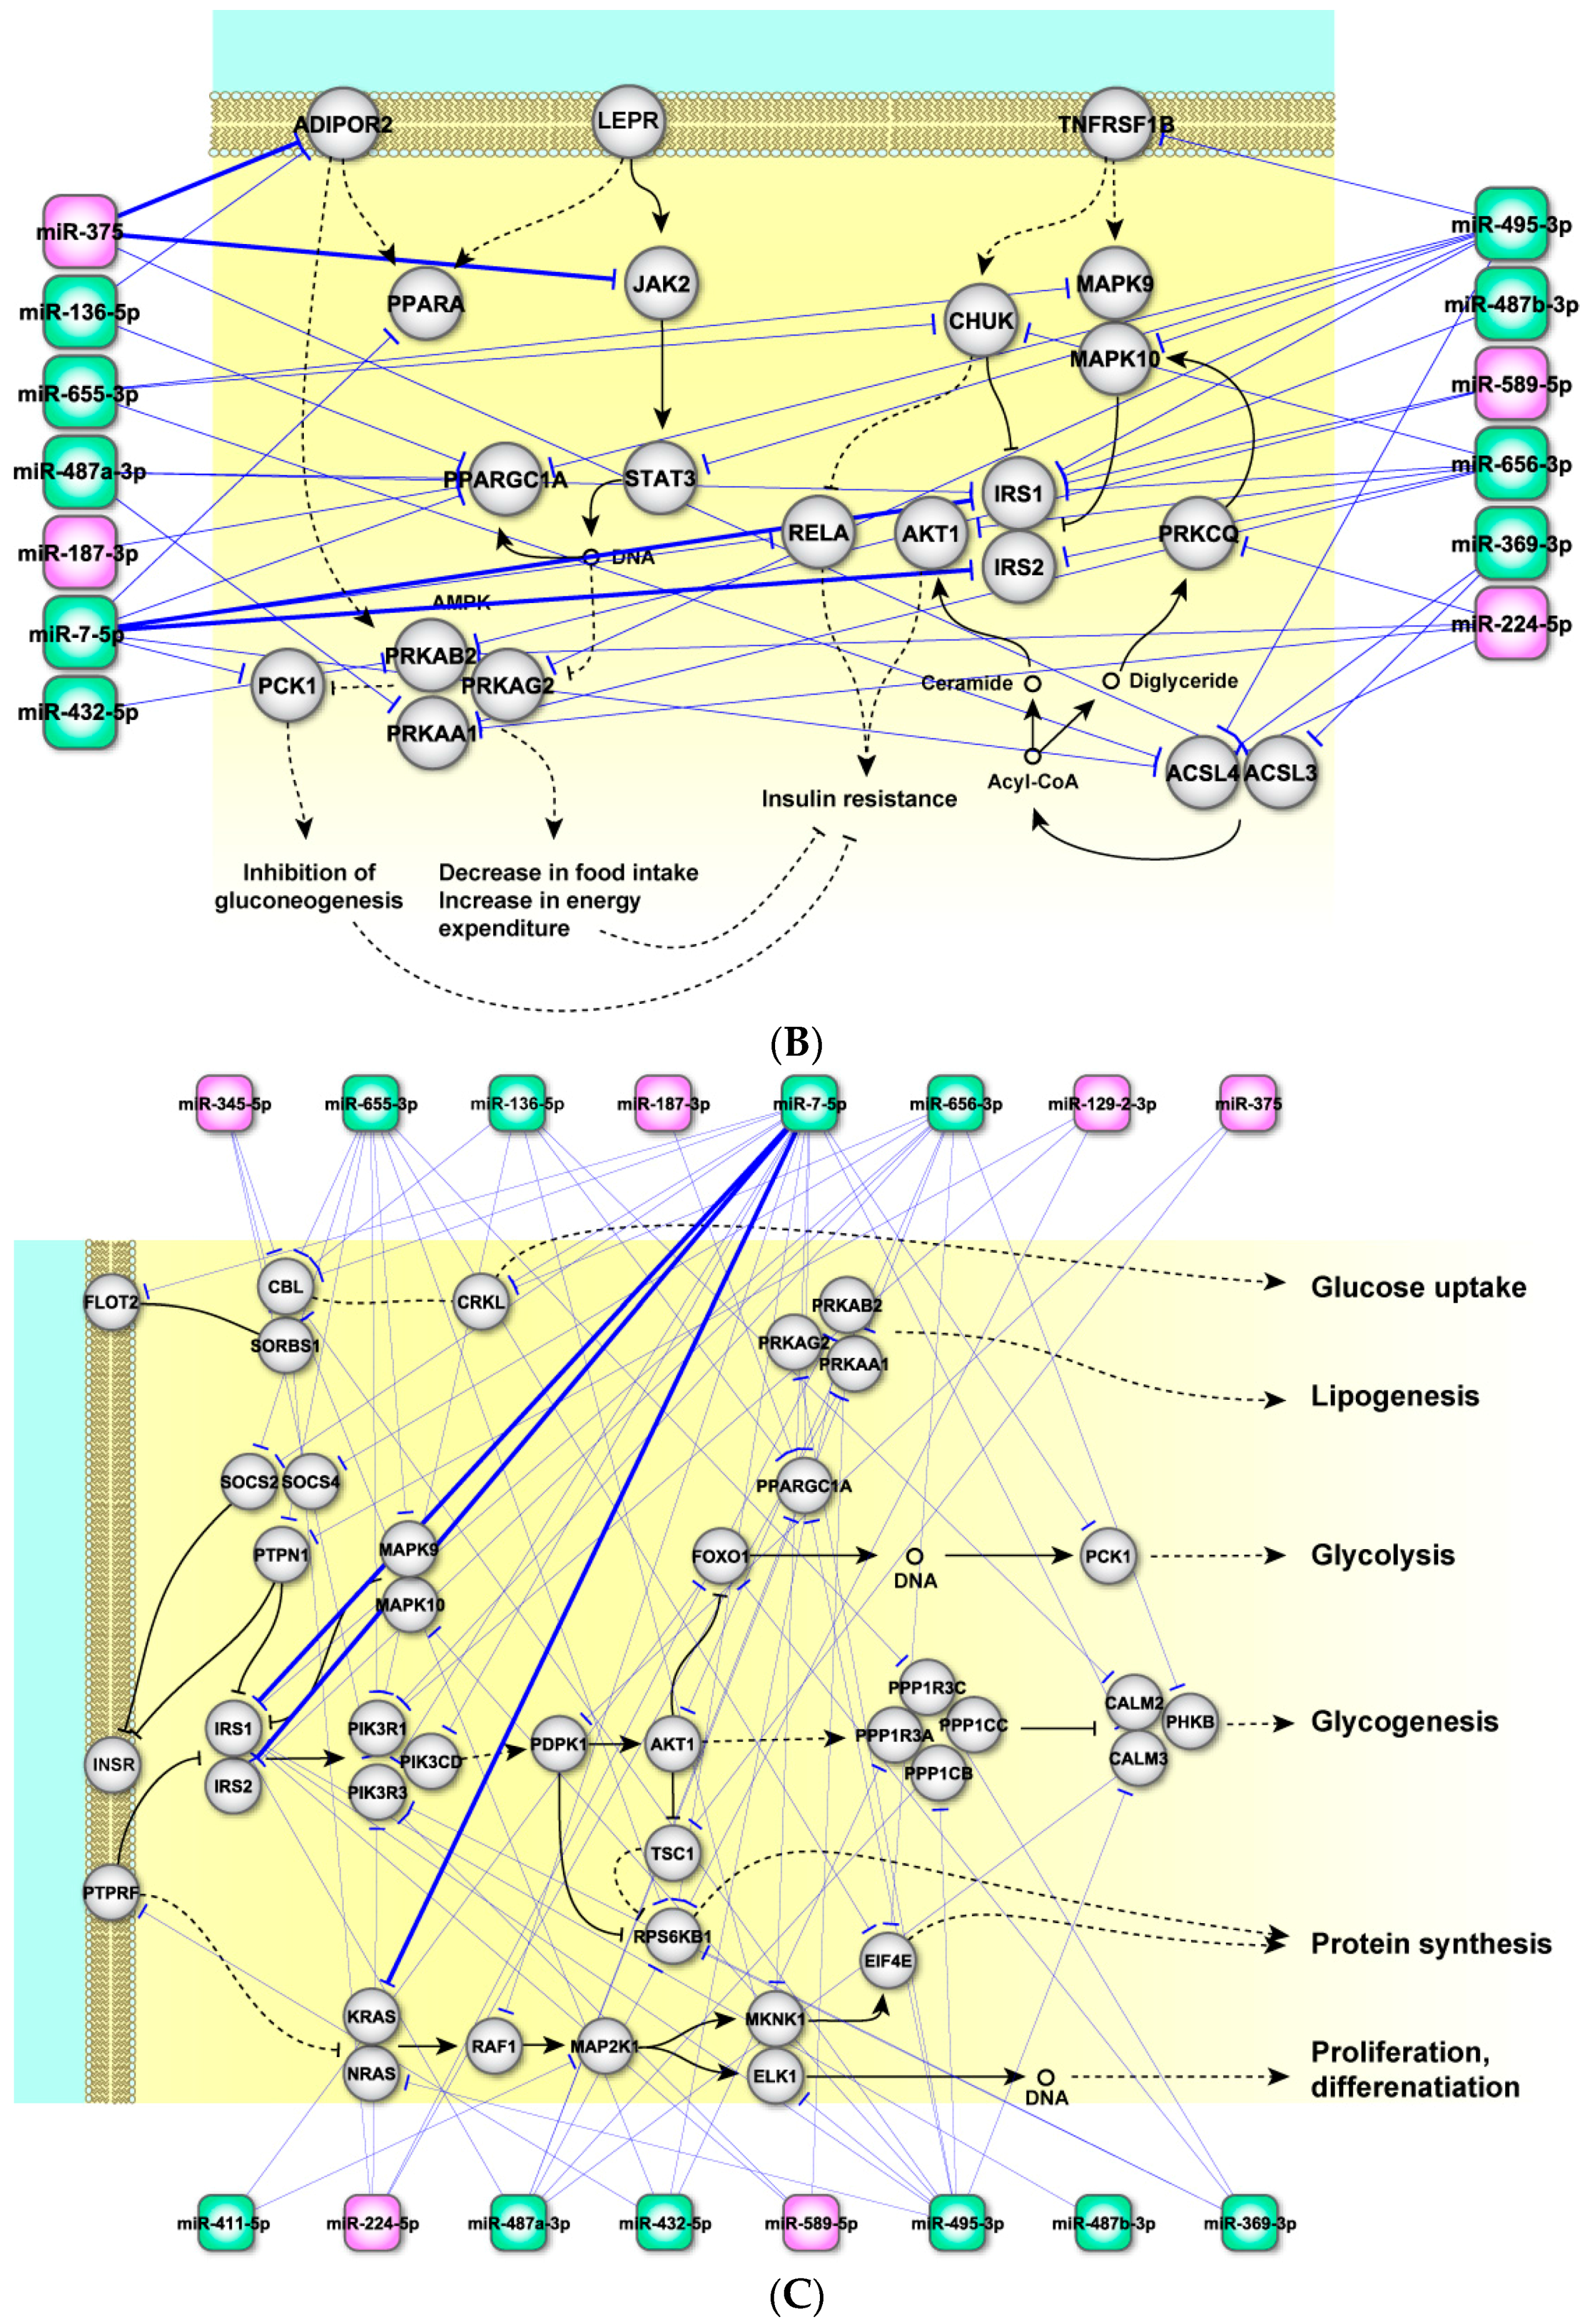
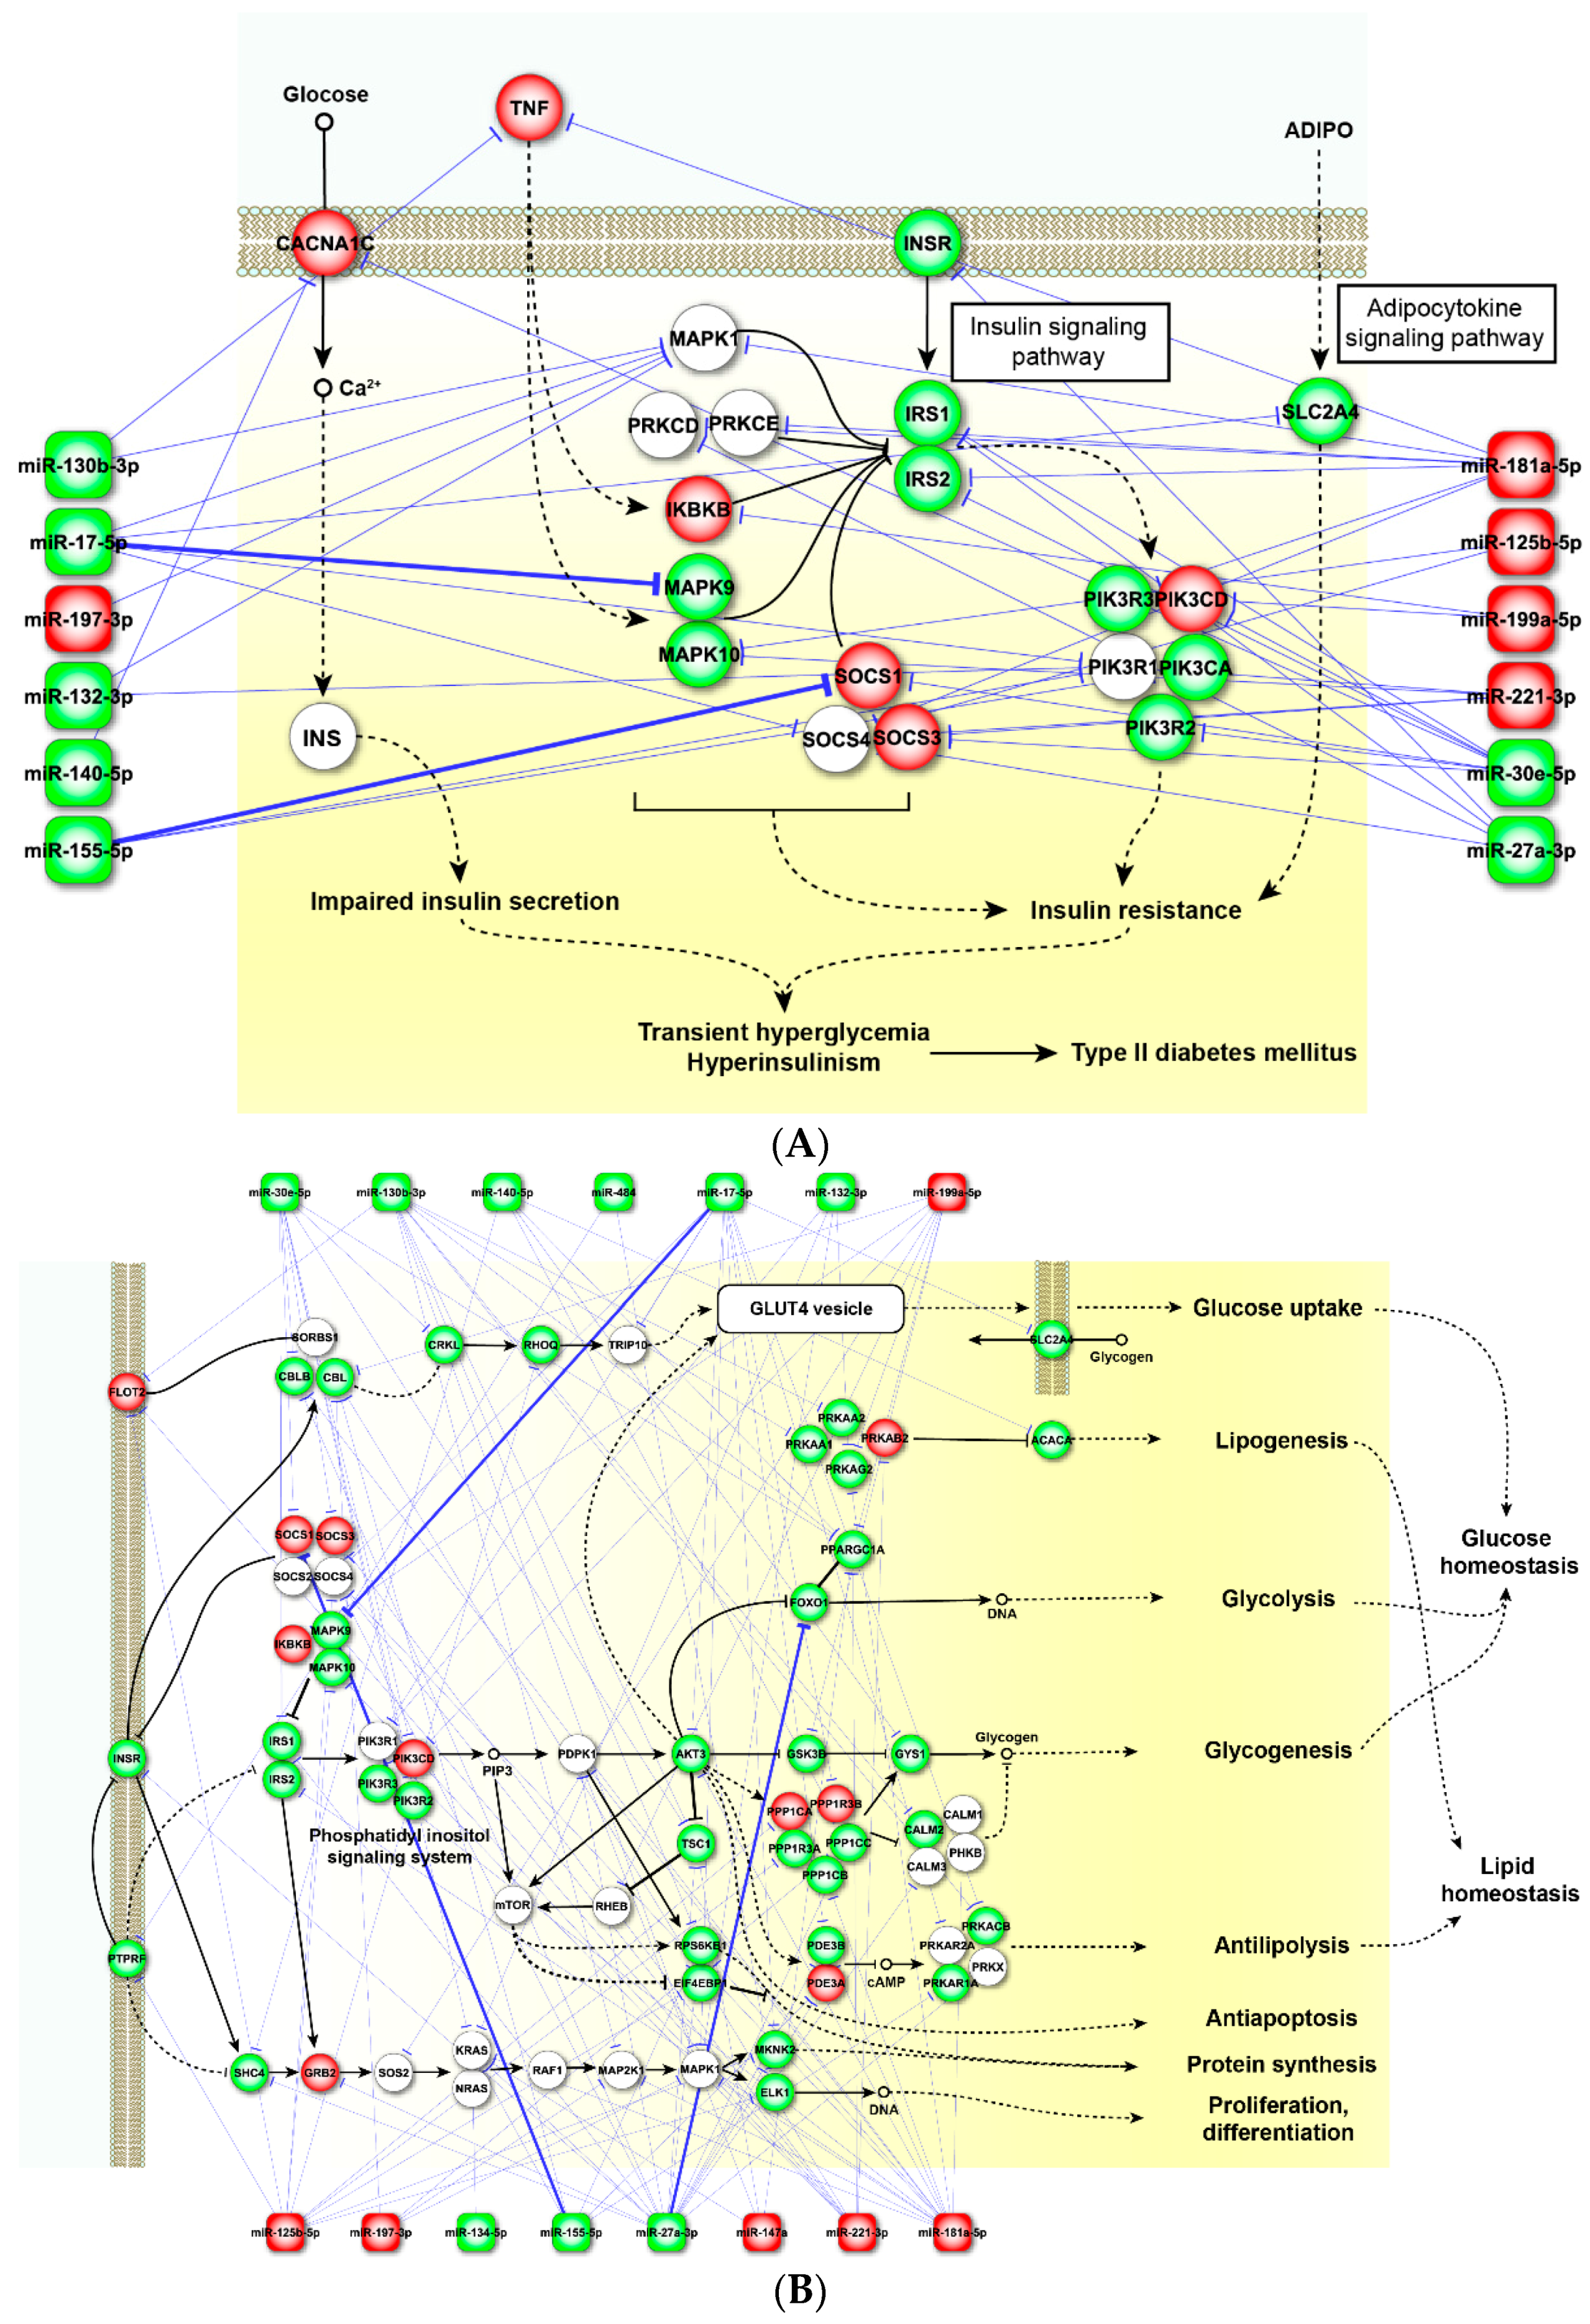
2.4. Perturbed Pathways Mediated by Dysregulated miRNAs
3. Discussion
4. Materials and Methods
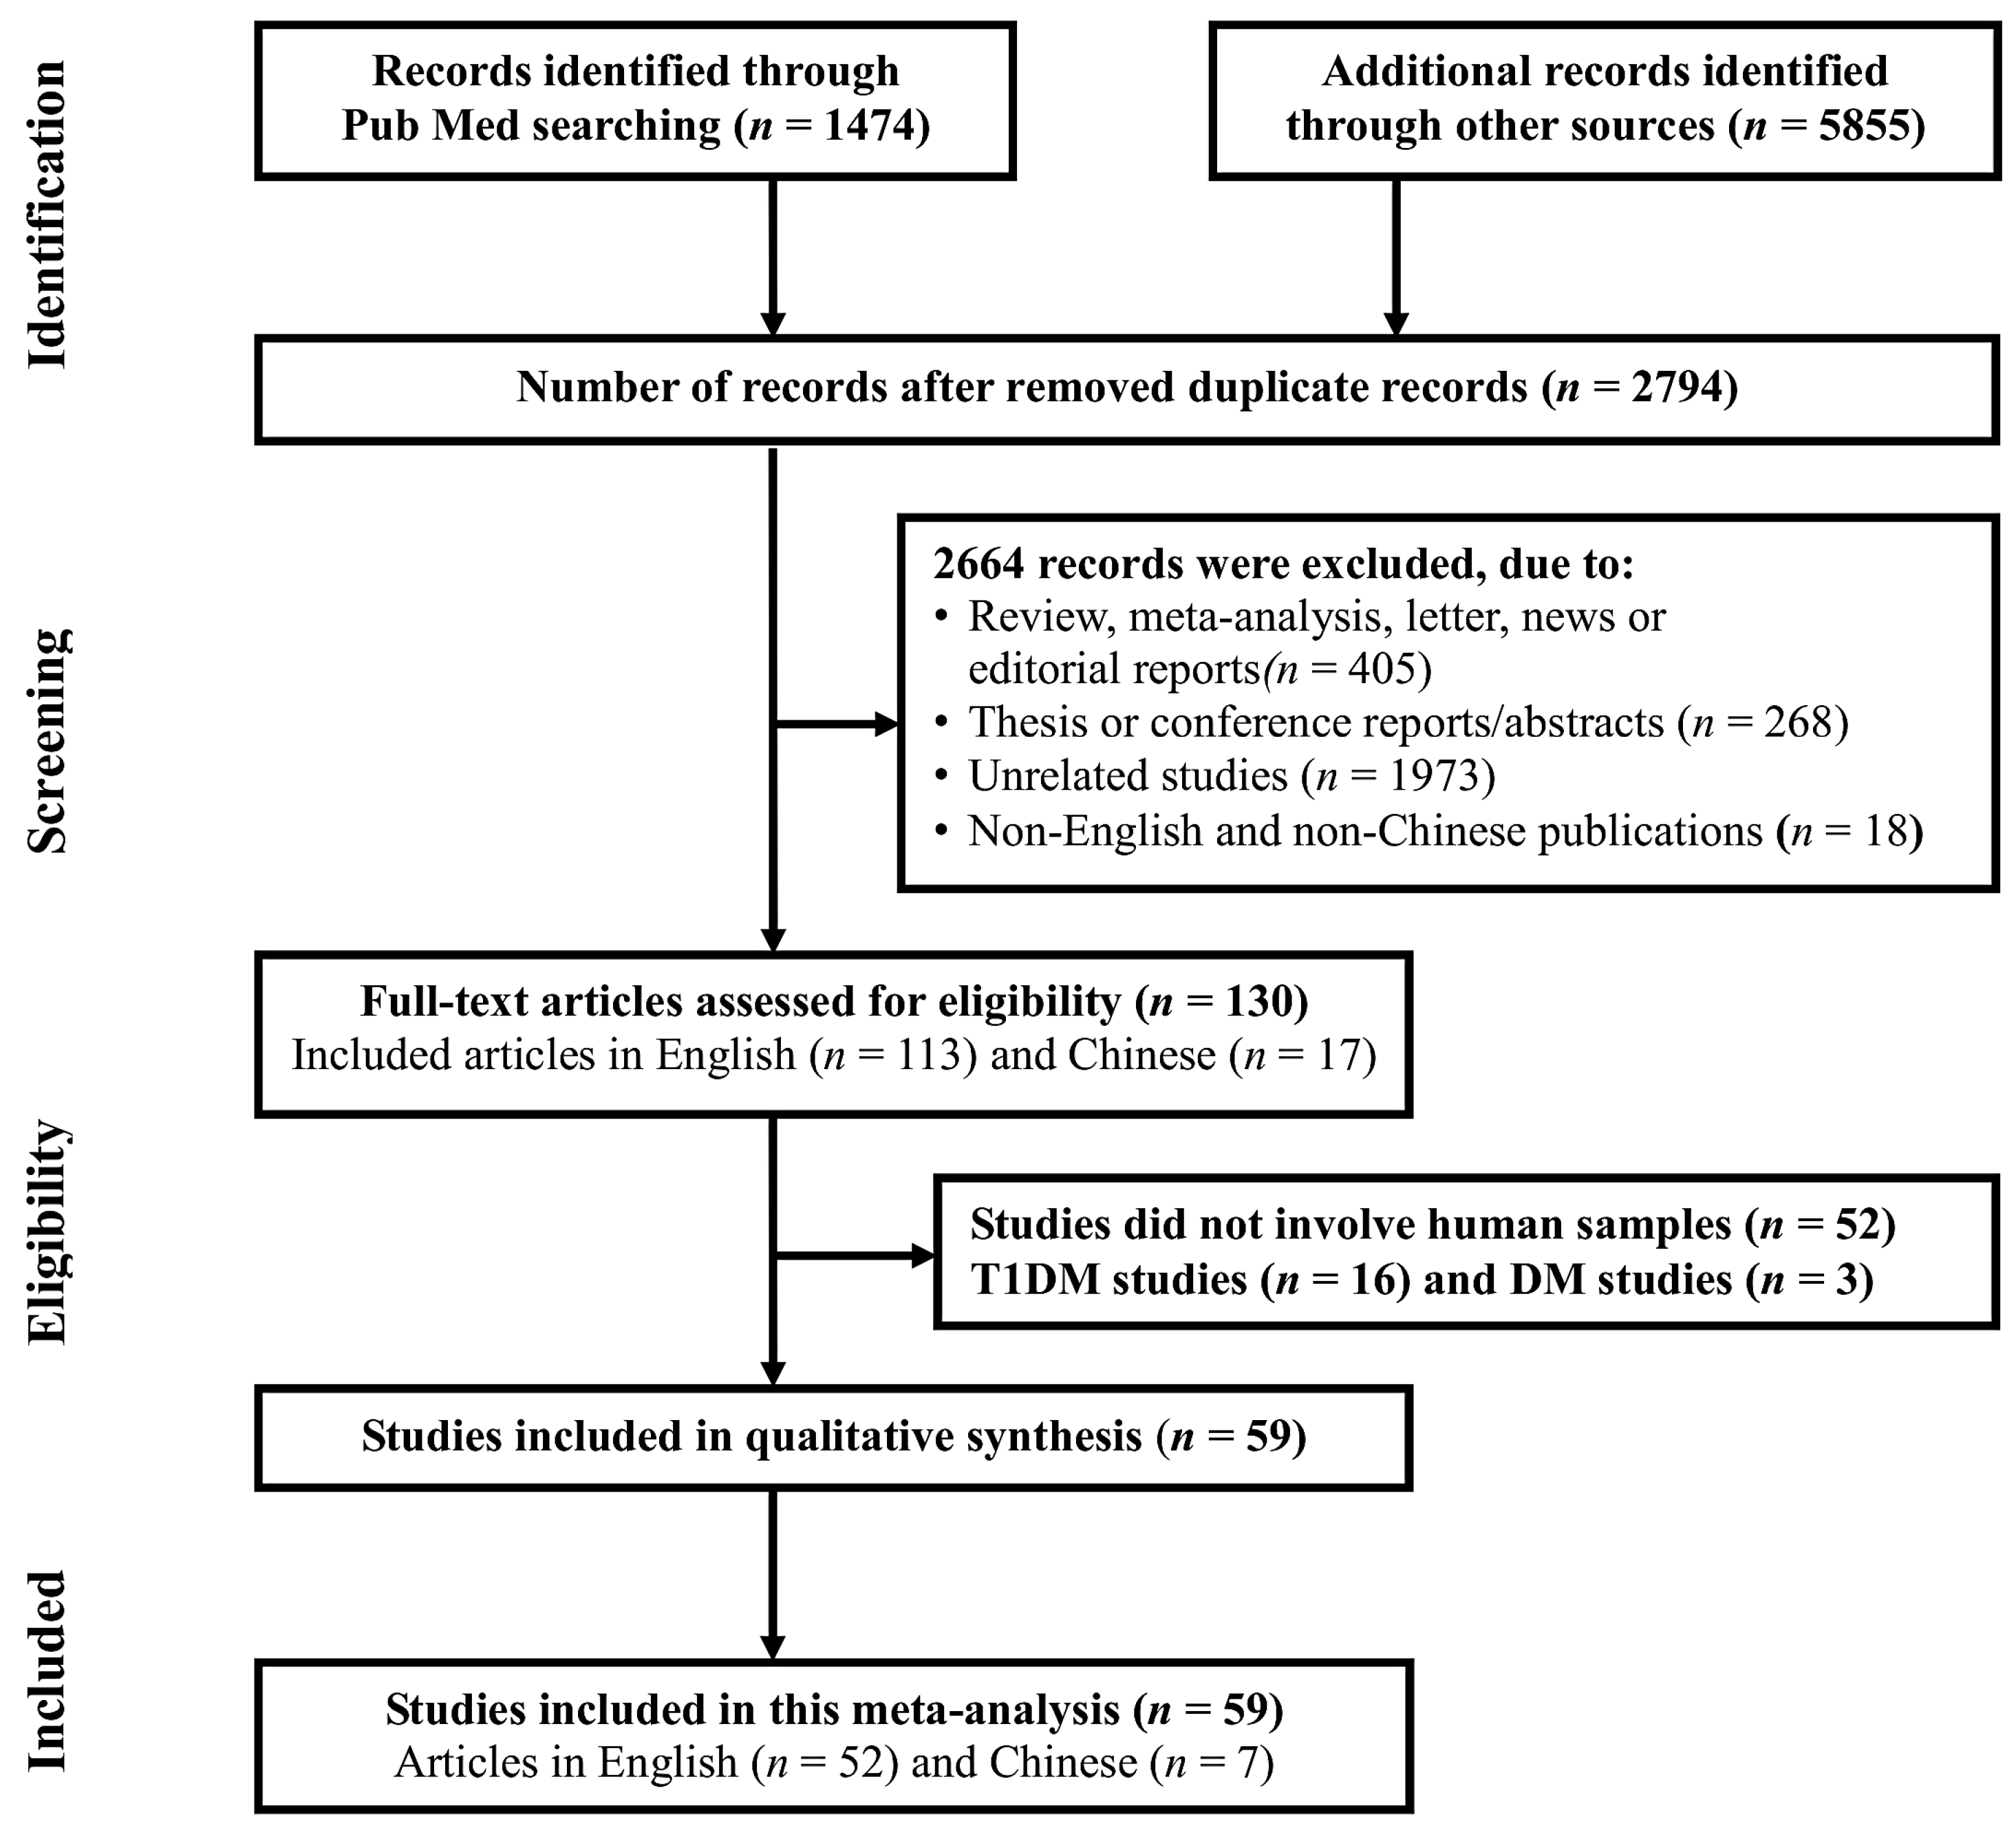
4.1. Search Strategy and Eligibility of Relevant Studies
4.2. Inclusion and Exclusion Criteria
4.3. Data Extraction
4.4. Quality Assessment and Statistical Analysis
4.5. miRNA Target Prediction and Pathway Enrichment Analysis
Supplementary Materials
Acknowledgments
Author Contributions
Conflicts of Interest
Abbreviations
| GSIS | glucose-stimulated insulin secretion |
| PDPK1 | 3-phosphoinositide dependent protein kinase 1 |
| PPARG | peroxisome proliferator-activated receptor gamma |
| MAPK | mitogen-activated protein kinase |
| ADIPOR2 | adiponectin receptor 2 |
| ACSL | acyl-coA synthetase long-chain family members |
| TNFA | tumor necrosis factor alpha |
| SLC2As | solute carrier family 2, which facilitates glucose transport |
| PPKAs | AMP-activated protein kinase |
| MEF2 | myocyte enhancer factor 2 |
| T2DM | type 2 diabetes mellitus |
| miRNA | microRNA |
References
- Rogers, E.A.; Fine, S.; Handley, M.A.; Davis, H.; Kass, J.; Schillinger, D. Development and early implementation of the bigger picture, a youth-targeted public health literacy campaign to prevent type 2 diabetes. J. Health Commun. 2014, 19, 144–160. [Google Scholar] [CrossRef] [PubMed]
- Jin, W.; Patti, M. Genetic determinants and molecular pathways in the pathogenesis of type 2 diabetes. Clin. Sci. 2009, 116, 99–111. [Google Scholar] [CrossRef] [PubMed]
- Ribbing, J.; Hamrén, B.; Svensson, M.K.; Karlsson, M.O. A model for glucose, insulin, and β-cell dynamics in subjects with insulin resistance and patients with type 2 diabetes. J. Clin. Pharmacol. 2010, 50, 861–872. [Google Scholar] [CrossRef] [PubMed]
- Pedicino, D.; Liuzzo, G.; Trotta, F.; Giglio, A.F.; Giubilato, S.; Martini, F.; Zaccardi, F.; Scavone, G.; Previtero, M.; Massaro, G. Adaptive immunity, inflammation, and cardiovascular complications in type 1 and type 2 diabetes mellitus. J. Diabetes Res. 2013, 2013, 184258. [Google Scholar] [CrossRef] [PubMed]
- Bello, N.A.; Pfeffer, M.A.; Skali, H.; McGill, J.B.; Rossert, J.; Olson, K.A.; Weinrauch, L.; Cooper, M.E.; de Zeeuw, D.; Rossing, P. Retinopathy and clinical outcomes in patients with type 2 diabetes mellitus, chronic kidney disease, and anemia. BMJ Open Diabetes Res. Care 2014, 2, e000011. [Google Scholar] [CrossRef] [PubMed]
- Paneni, F.; Beckman, J.A.; Creager, M.A.; Cosentino, F. Diabetes and vascular disease: Pathophysiology, clinical consequences, and medical therapy: Part I. Eur. Heart J. 2013, 34, 2436–2443. [Google Scholar] [CrossRef] [PubMed]
- Shlomai, G.; Neel, B.; LeRoith, D.; Gallagher, E.J. Type 2 diabetes mellitus and cancer: The role of pharmacotherapy. J. Clin. Oncol. 2016, 34, 4261–4269. [Google Scholar] [PubMed]
- Klil-Drori, A.J.; Azoulay, L.; Pollak, M.N. Cancer, obesity, diabetes, and antidiabetic drugs: Is the fog clearing? Nat. Rev. Clin. Oncol. 2017, 14, 85–99. [Google Scholar] [CrossRef] [PubMed]
- Liu, H.T.; Xu, Y.T.; Li, H.Y.; Zhao, J.; Zhai, H.Y.; Chen, Y. Loss of microRNA-145 expression is involved in the development and prognosis of breast cancer complicated by type 2 diabetes mellitus. Int. J. Biol. Markers 2016, 31, e368–e374. [Google Scholar] [CrossRef] [PubMed]
- Wang, Y.; Wang, B.; Yan, S.; Shen, F.; Cao, H.; Fan, J.; Zhang, R.; Gu, J. Type 2 diabetes and gender differences in liver cancer by considering different confounding factors: A meta-analysis of cohort studies. Ann. Epidemiol. 2016, 26, 764–772. [Google Scholar] [CrossRef] [PubMed]
- Sayyid, R.K.; Fleshner, N.E. Diabetes mellitus type 2: A driving force for urological complications. Trends Endocrinol. Metab. 2016, 27, 249–261. [Google Scholar] [CrossRef] [PubMed]
- Esteller, M. Non-coding RNAs in human disease. Nat. Rev. Genet. 2011, 12, 861–874. [Google Scholar] [CrossRef] [PubMed]
- Kellis, M.; Wold, B.; Snyder, M.P.; Bernstein, B.E.; Kundaje, A.; Marinov, G.K.; Ward, L.D.; Birney, E.; Crawford, G.E.; Dekker, J. Defining functional DNA elements in the human genome. Proc. Natl. Acad. Sci. USA 2014, 111, 6131–6138. [Google Scholar] [CrossRef] [PubMed]
- Eliasson, L.; Esguerra, J.L.S. Role of non-coding RNAs in pancreatic β-cell development and physiology. Acta Physiol. 2014, 211, 273–284. [Google Scholar] [CrossRef] [PubMed]
- Lee, M.J.; Park, D.H.; Kang, J.H. Exosomes as the source of biomarkers of metabolic diseases. Ann. Pediatr. Endocrinol. Metab. 2016, 21, 119–125. [Google Scholar] [CrossRef] [PubMed]
- Simpson, K.; Wonnacott, A.; Fraser, D.J.; Bowen, T. MicroRNAs in diabetic nephropathy: From biomarkers to therapy. Curr. Diabetes Rep. 2016, 16, 35. [Google Scholar] [CrossRef] [PubMed]
- Deiuliis, J.A. MicroRNAs as regulators of metabolic disease: Pathophysiologic significance and emerging role as biomarkers and therapeutics. Int. J. Obes. 2016, 40, 88–101. [Google Scholar] [CrossRef] [PubMed]
- Kato, M.; Natarajan, R. MicroRNAs in diabetic nephropathy: Functions, biomarkers, and therapeutic targets. Ann. N. Y. Acad. Sci. 2015, 1353, 72–88. [Google Scholar] [CrossRef] [PubMed]
- Price, N.L.; Ramirez, C.M.; Fernandez-Hernando, C. Relevance of microRNA in metabolic diseases. Crit. Rev. Clin. Lab. Sci. 2014, 51, 305–320. [Google Scholar] [CrossRef] [PubMed]
- Chen, H.; Lan, H.Y.; Roukos, D.H.; Cho, W.C. Application of microRNAs in diabetes mellitus. J. Endocrinol. 2014, 222, 1–10. [Google Scholar] [CrossRef] [PubMed]
- Fernandez-Hernando, C.; Ramirez, C.M.; Goedeke, L.; Suarez, Y. MicroRNAs in metabolic disease. Arterioscler. Thromb. Vasc. Biol. 2013, 33, 178–185. [Google Scholar] [CrossRef] [PubMed]
- Guay, C.; Roggli, E.; Nesca, V.; Jacovetti, C.; Regazzi, R. Diabetes mellitus, a microRNA-related disease? Transl. Res. 2011, 157, 253–264. [Google Scholar] [CrossRef] [PubMed]
- Kameswaran, V.; Bramswig, N.C.; McKenna, L.B.; Penn, M.; Schug, J.; Hand, N.J.; Chen, Y.; Choi, I.; Vourekas, A.; Won, K.-J. Epigenetic regulation of the DLK1-MEG3 microRNA cluster in human type 2 diabetic islets. Cell Metab. 2014, 19, 135–145. [Google Scholar] [CrossRef] [PubMed]
- Balasubramanyam, M.; Aravind, S.; Gokulakrishnan, K.; Prabu, P.; Sathishkumar, C.; Ranjani, H.; Mohan, V. Impaired miR-146a expression links subclinical inflammation and insulin resistance in type 2 diabetes. Mol. Cell. Biochem. 2011, 351, 197–205. [Google Scholar] [CrossRef] [PubMed]
- Caporali, A.; Meloni, M.; Vollenkle, C.; Bonci, D.; Sala-Newby, G.B.; Addis, R.; Spinetti, G.; Losa, S.; Masson, R.; Baker, A.H.; et al. Deregulation of microRNA-503 contributes to diabetes mellitus-induced impairment of endothelial function and reparative angiogenesis after limb ischemia. Circulation 2011, 123, 282–291. [Google Scholar] [CrossRef] [PubMed]
- Karolina, D.S.; Armugam, A.; Tavintharan, S.; Wong, M.T.; Lim, S.C.; Sum, C.F.; Jeyaseelan, K. MicroRNA 144 impairs insulin signaling by inhibiting the expression of insulin receptor substrate 1 in type 2 diabetes mellitus. PLoS ONE 2011, 6, e22839. [Google Scholar] [CrossRef]
- Karolina, D.S.; Tavintharan, S.; Armugam, A.; Sepramaniam, S.; Pek, S.L.; Wong, M.T.; Lim, S.C.; Sum, C.F.; Jeyaseelan, K. Circulating miRNA profiles in patients with metabolic syndrome. J. Clin. Endocrinol. Metab. 2012, 97, E2271–E2276. [Google Scholar] [CrossRef] [PubMed]
- Meng, S.; Cao, J.T.; Zhang, B.; Zhou, Q.; Shen, C.X.; Wang, C.Q. Downregulation of microRNA-126 in endothelial progenitor cells from diabetes patients, impairs their functional properties, via target gene Spred-1. J. Mol. Cell. Cardiol. 2012, 53, 64–72. [Google Scholar] [CrossRef] [PubMed]
- Ortega, F.J.; Moreno-Navarrete, J.M.; Pardo, G.; Sabater, M.; Hummel, M.; Ferrer, A.; Rodriguez-Hermosa, J.I.; Ruiz, B.; Ricart, W.; Peral, B. MiRNA expression profile of human subcutaneous adipose and during adipocyte differentiation. PLoS ONE 2010, 5, e9022. [Google Scholar] [CrossRef] [PubMed]
- Zampetaki, A.; Kiechl, S.; Drozdov, I.; Willeit, P.; Mayr, U.; Prokopi, M.; Mayr, A.; Weger, S.; Oberhollenzer, F.; Bonora, E.; et al. Plasma microRNA profiling reveals loss of endothelial miR-126 and other microRNAs in type 2 diabetes. Circul. Res. 2010, 107, 810–817. [Google Scholar] [CrossRef] [PubMed]
- Zhao, H.; Guan, J.; Lee, H.-M.; Sui, Y.; He, L.; Siu, J.J.; Patty, P.; Tong, P.C.; Lai, F.M.; Chan, J.C. Up-regulated pancreatic tissue microRNA-375 associates with human type 2 diabetes through β-cell deficit and islet amyloid deposition. Pancreas 2010, 39, 843–846. [Google Scholar] [CrossRef] [PubMed]
- Baldeon Rojas, L.; Weigelt, K.; de Wit, H.; Ozcan, B.; van Oudenaren, A.; Sempertegui, F.; Sijbrands, E.; Grosse, L.; Freire, W.; Drexhage, H.A.; et al. Decreased serum level of miR-146a as sign of chronic inflammation in type 2 diabetic patients. PLoS ONE 2014, 9, e115209. [Google Scholar]
- Granjon, A.; Gustin, M.P.; Rieusset, J.; Lefai, E.; Meugnier, E.; Guller, I.; Cerutti, C.; Paultre, C.; Disse, E.; Rabasa-Lhoret, R.; et al. The microRNA signature in response to insulin reveals its implication in the transcriptional action of insulin in human skeletal muscle and the role of a sterol regulatory element-binding protein-1C/myocyte enhancer factor 2C pathway. Diabetes 2009, 58, 2555–2564. [Google Scholar] [CrossRef] [PubMed]
- Kong, L.; Zhu, J.; Han, W.; Jiang, X.; Xu, M.; Zhao, Y.; Dong, Q.; Pang, Z.; Guan, Q.; Gao, L.; et al. Significance of serum microRNAs in pre-diabetes and newly diagnosed type 2 diabetes: A clinical study. Acta Diabetol. 2011, 48, 61–69. [Google Scholar] [CrossRef] [PubMed]
- Mao, G.; Liu, L. MicroRNA-18a is a genetic marker for the early diagnosis of cerebral injury induced by type 2 diabetes. Exp. Ther. Med. 2014, 8, 1901–1905. [Google Scholar] [CrossRef] [PubMed]
- Locke, J.; da Silva Xavier, G.; Dawe, H.; Rutter, G.; Harries, L. Increased expression of miR-187 in human islets from individuals with type 2 diabetes is associated with reduced glucose-stimulated insulin secretion. Diabetologia 2014, 57, 122–128. [Google Scholar] [CrossRef] [PubMed] [Green Version]
- Ren, Y.H.; Shi, X.X.; Yan, D.D.; Li, X.L. The change of expression level of circulating miRNA-126 in patients with type 2 diabetes and its relative factors. Clin. J. Diabetes 2014, 22, 633–636. [Google Scholar]
- Santovito, D.; De Nardis, V.; Marcantonio, P.; Mandolini, C.; Paganelli, C.; Vitale, E.; Buttitta, F.; Bucci, M.; Mezzetti, A.; Consoli, A.; et al. Plasma exosome microRNA profiling unravels a new potential modulator of adiponectin pathway in diabetes: Effect of glycemic control. J. Clin. Endocrinol. Metab. 2014, 99, 1681–1685. [Google Scholar] [CrossRef] [PubMed]
- Sun, K.; Chang, X.; Yin, L.; Li, J.; Zhou, T.; Zhang, C.; Chen, X. Expression and DNA methylation status of microRNA-375 in patients with type 2 diabetes mellitus. Mol. Med. Rep. 2014, 9, 967–972. [Google Scholar] [CrossRef] [PubMed]
- Yang, Z.; Chen, H.; Si, H.; Li, X.; Ding, X.; Sheng, Q.; Chen, P.; Zhang, H. Serum miR-23a, a potential biomarker for diagnosis of pre-diabetes and type 2 diabetes. Acta Diabetol. 2014, 51, 823–831. [Google Scholar] [CrossRef] [PubMed]
- Zhang, L.Q.; Han, Z.P. Expression and clinical significance of peripheral hsa-miR-29b during the type 2 diabetes. J. Mod. Lab. Med. 2014, 29, 113–116. [Google Scholar]
- Agarwal, P.; Srivastava, R.; Srivastava, A.K.; Ali, S.; Datta, M. MiR-135a targets IRS2 and regulates insulin signaling and glucose uptake in the diabetic gastrocnemius skeletal muscle. Biochim. Biophys. Acta 2013, 1832, 1294–1303. [Google Scholar] [CrossRef] [PubMed]
- Corral-Fernandez, N.E.; Salgado-Bustamante, M.; Martinez-Leija, M.E.; Cortez-Espinosa, N.; Garcia-Hernandez, M.H.; Reynaga-Hernandez, E.; Quezada-Calvillo, R.; Portales-Perez, D.P. Dysregulated miR-155 expression in peripheral blood mononuclear cells from patients with type 2 diabetes. Exp. Clin. Endocrinol. Diabetes 2013, 121, 347–353. [Google Scholar] [CrossRef] [PubMed]
- Jiang, S.Y.; Jiao, J.; Zhang, T.T.; Xu, Y.P. Pharmacokinetics study of recombinant hirudin in the plasma of rats using chromogenic substrate, ELISA, and radioisotope assays. PLoS ONE 2013, 8, e64336. [Google Scholar] [CrossRef] [PubMed]
- Pescador, N.; Perez-Barba, M.; Ibarra, J.M.; Corbaton, A.; Martinez-Larrad, M.T.; Serrano-Rios, M. Serum circulating microRNA profiling for identification of potential type 2 diabetes and obesity biomarkers. PLoS ONE 2013, 8, e77251. [Google Scholar] [CrossRef] [PubMed]
- Rong, Y.; Bao, W.; Shan, Z.; Liu, J.; Yu, X.; Xia, S.; Gao, H.; Wang, X.; Yao, P.; Hu, F.B.; et al. Increased microRNA-146a levels in plasma of patients with newly diagnosed type 2 diabetes mellitus. PLoS ONE 2013, 8, e73272. [Google Scholar] [CrossRef] [PubMed] [Green Version]
- Zhou, J.; Peng, R.; Li, T.; Luo, X.; Peng, H.; Zha, H.; Yin, P.; Wen, L.; Zhang, Z. A potentially functional polymorphism in the regulatory region of let-7a-2 is associated with an increased risk for diabetic nephropathy. Gene 2013, 527, 456–461. [Google Scholar] [CrossRef] [PubMed]
- Liu, Y.; Gao, G.; Yang, C.; Zhou, K.; Shen, B.; Liang, H.; Jiang, X. The role of circulating microRNA-126 (miR-126): A novel biomarker for screening prediabetes and newly diagnosed type 2 diabetes mellitus. Int. J. Mol. Sci. 2014, 15, 10567–10577. [Google Scholar] [CrossRef] [PubMed]
- Gallagher, I.J.; Scheele, C.; Keller, P.; Nielsen, A.R.; Remenyi, J.; Fischer, C.P.; Roder, K.; Babraj, J.; Wahlestedt, C.; Hutvagner, G. Integration of microRNA changes in vivo identifies novel molecular features of muscle insulin resistance in type 2 diabetes. Genome Med. 2010, 2, 9. [Google Scholar] [CrossRef] [PubMed]
- Klöting, N.; Berthold, S.; Kovacs, P.; Schön, M.R.; Fasshauer, M.; Ruschke, K.; Stumvoll, M.; Blüher, M. MicroRNA expression in human omental and subcutaneous adipose tissue. PLoS ONE 2009, 4, e4699. [Google Scholar] [CrossRef] [PubMed]
- Pan, J.; Chen, H. Expression of miR-155 and miR-146a in patients with type 2 diabetes mellitus and its significance. Zhejiang Clin. Med. 2014, 16, 1042–1043. [Google Scholar]
- Yang, S.; Zhao, J.; Chen, Y.; Lei, M. Biomarkers associated with ischemic stroke in diabetes mellitus patients. Cardiovasc. Toxicol. 2016, 16, 213–222. [Google Scholar] [CrossRef] [PubMed]
- Yan, S.; Wang, T.; Huang, S.; Di, Y.; Huang, Y.; Liu, X.; Luo, Z.; Han, W.; An, B. Differential expression of microRNAs in plasma of patients with prediabetes and newly diagnosed type 2 diabetes. Acta Diabetol. 2016, 53, 693–702. [Google Scholar] [CrossRef] [PubMed]
- Wang, Y.; Li, J.Y.; Du, W.P.; Jin, W.B. Association analysis between plasma leptin, insulin levels and their microRNA expression in patients with type 2 diabetes mellitus. Chin. J. Diabetes 2016, 24, 28–31. [Google Scholar]
- Wang, C.; Wan, S.; Yang, T.; Niu, D.; Zhang, A.; Yang, C.; Cai, J.; Wu, J.; Song, J.; Zhang, C.Y.; et al. Increased serum microRNAs are closely associated with the presence of microvascular complications in type 2 diabetes mellitus. Sci. Rep. 2016, 6, 20032. [Google Scholar] [CrossRef] [PubMed]
- Seyhan, A.A.; Nunez Lopez, Y.O.; Xie, H.; Yi, F.; Mathews, C.; Pasarica, M.; Pratley, R.E. Pancreas-enriched miRNAs are altered in the circulation of subjects with diabetes: A pilot cross-sectional study. Sci. Rep. 2016, 6, 31479. [Google Scholar] [CrossRef] [PubMed]
- Rezk, N.A.; Sabbah, N.A.; Saad, M.S. Role of microRNA 126 in screening, diagnosis, and prognosis of diabetic patients in Egypt. IUBMB Life 2016, 68, 452–458. [Google Scholar] [CrossRef] [PubMed]
- Pek, S.L.; Sum, C.F.; Lin, M.X.; Cheng, A.K.; Wong, M.T.; Lim, S.C.; Tavintharan, S. Circulating and visceral adipose miR-100 is down-regulated in patients with obesity and type 2 diabetes. Mol. Cell. Endocrinol. 2016, 427, 112–123. [Google Scholar] [CrossRef] [PubMed]
- Li, M.Y.; Pan, S.R.; Qiu, A.Y. Roles of microRNA-221/222 in type 2 diabetic patients with post-menopausal breast cancer. Genet. Mol. Res. 2016. [Google Scholar] [CrossRef] [PubMed]
- Latouche, C.; Natoli, A.; Reddy-Luthmoodoo, M.; Heywood, S.E.; Armitage, J.A.; Kingwell, B.A. MicroRNA-194 modulates glucose metabolism and its skeletal muscle expression is reduced in diabetes. PLoS ONE 2016, 11, e0155108. [Google Scholar] [CrossRef] [PubMed]
- Jansen, F.; Wang, H.; Przybilla, D.; Franklin, B.S.; Dolf, A.; Pfeifer, P.; Schmitz, T.; Flender, A.; Endl, E.; Nickenig, G.; et al. Vascular endothelial microparticles-incorporated microRNAs are altered in patients with diabetes mellitus. Cardiovasc. Diabetol. 2016, 15, 49. [Google Scholar] [CrossRef] [PubMed]
- Hou, X.; Wu, W.; Yin, B.; Liu, X.; Ren, F. MicroRNA-463–3p/ABCG4: A new axis in glucose-stimulated insulin secretion. Obesity 2016, 24, 2368–2376. [Google Scholar] [CrossRef] [PubMed]
- Ding, L.; Ai, D.; Wu, R.; Zhang, T.; Jing, L.; Lu, J.; Zhong, L. Identification of the differential expression of serum microRNA in type 2 diabetes. Biosci. Biotechnol. Biochem. 2016, 80, 461–465. [Google Scholar] [CrossRef] [PubMed]
- Baldeon Rojas, L.; Weigelt, K.; de Wit, H.; Ozcan, B.; van Oudenaren, A.; Sempertegui, F.; Sijbrands, E.; Grosse, L.; van Zonneveld, A.J.; Drexhage, H.A.; et al. Study on inflammation-related genes and microRNAs, with special emphasis on the vascular repair factor HGF and miR-574-3p, in monocytes and serum of patients with T2D. Diabetol. Metab. Syndr. 2016, 8, 6. [Google Scholar] [CrossRef] [PubMed] [Green Version]
- Sebastiani, G.; Po, A.; Miele, E.; Ventriglia, G.; Ceccarelli, E.; Bugliani, M.; Marselli, L.; Marchetti, P.; Gulino, A.; Ferretti, E.; et al. MicroRNA-124a is hyperexpressed in type 2 diabetic human pancreatic islets and negatively regulates insulin secretion. Acta Diabetol. 2015, 52, 523–530. [Google Scholar] [CrossRef] [PubMed]
- Olivieri, F.; Spazzafumo, L.; Bonafe, M.; Recchioni, R.; Prattichizzo, F.; Marcheselli, F.; Micolucci, L.; Mensa, E.; Giuliani, A.; Santini, G.; et al. MiR-21-5p and miR-126a-3p levels in plasma and circulating angiogenic cells: Relationship with type 2 diabetes complications. Oncotarget 2015, 6, 35372–35382. [Google Scholar] [PubMed]
- Long, Y.; Zhan, Q.; Yuan, M.; Duan, X.; Zhou, J.; Lu, J.; Li, Z.; Yu, F.; Zhou, X.; Yang, Q.; et al. The expression of microRNA-223 and FAM5C in cerebral infarction patients with diabetes mellitus. Cardiovasc. Toxicol. 2017, 17, 42–48. [Google Scholar] [CrossRef] [PubMed]
- Lenin, R.; Sankaramoorthy, A.; Mohan, V.; Balasubramanyam, M. Altered immunometabolism at the interface of increased endoplasmic reticulum (ER) stress in patients with type 2 diabetes. J. Leukoc. Biol. 2015, 98, 615–622. [Google Scholar] [CrossRef] [PubMed]
- Jiao, Y.; Zhu, M.; Mao, X.; Long, M.; Du, X.; Wu, Y.; Abudureyimu, K.; Zhang, C.; Wang, Y.; Tao, Y.; et al. MicroRNA-130a expression is decreased in Xinjiang Uygur patients with type 2 diabetes mellitus. Am. J. Transl. Res. 2015, 7, 1984–1991. [Google Scholar] [PubMed]
- Higuchi, C.; Nakatsuka, A.; Eguchi, J.; Teshigawara, S.; Kanzaki, M.; Katayama, A.; Yamaguchi, S.; Takahashi, N.; Murakami, K.; Ogawa, D.; et al. Identification of circulating miR-101, miR-375 and miR-802 as biomarkers for type 2 diabetes. Metabolism 2015, 64, 489–497. [Google Scholar] [CrossRef] [PubMed]
- Bao, L.; Fu, X.; Si, M.; Wang, Y.; Ma, R.; Ren, X.; Lv, H. MicroRNA-185 targets SOCS3 to inhibit β-cell dysfunction in diabetes. PLoS ONE 2015, 10, e0116067. [Google Scholar] [CrossRef] [PubMed]
- Baldeon Rojas, L.; Weigelt, K.; de Wit, H.; Ozcan, B.; van Oudenaren, A.; Sempertegui, F.; Sijbrands, E.; Grosse, L.; van Zonneveld, A.J.; Drexhage, H.A.; et al. Type 2 diabetes monocyte microRNA and mRNA expression: Dyslipidemia associates with increased differentiation-related genes but not inflammatory activation. PLoS ONE 2015, 10, e0129421. [Google Scholar]
- Al-Kafaji, G.; Al-Mahroos, G.; Alsayed, N.A.; Hasan, Z.A.; Nawaz, S.; Bakhiet, M. Peripheral blood microRNA-15a is a potential biomarker for type 2 diabetes mellitus and pre-diabetes. Mol. Med. Rep. 2015, 12, 7485–7490. [Google Scholar] [CrossRef] [PubMed]
- Kong, L.; Han, W.X.; Jiang, X.Y.; AXu, J.; Zhang, X.; Li, Q.; Guan, Q.B.; Gao, L.; Zhao, J.J. Expression and clinical significance of peripheral miR-34a during the onset of type 2 diabetes. J. Shandong Univ. 2010, 48, 1–3. [Google Scholar]
- Liang, G.W.; Song, Y.; Shao, D.H.; Xu, X.; He, M.L. The change of serum miR-375 and miR-29a and their correlation with glycemic control and lipid profile in patients with newly diagnosed type 2 diabete. Chin. J. Lab. Diagn. 2013, 17, 475–478. [Google Scholar]
- Lu, S.Y.; Lu, Z.H.; Tan, L.; Wan, S. Association of Plasma miR-375 and miR-126 in patients with type 2 diabetes mellitus. J. Mod. Lab. Med. 2014, 29, 18–21. [Google Scholar]
- Ortega, F.J.; Mercader, J.M.; Moreno-Navarrete, J.M.; Rovira, O.; Guerra, E.; Esteve, E.; Xifra, G.; Martinez, C.; Ricart, W.; Rieusset, J.; et al. Profiling of circulating microRNAs reveals common microRNAs linked to type 2 diabetes that change with insulin sensitization. Diabetes Care 2014, 37, 1375–1383. [Google Scholar] [CrossRef] [PubMed]
- Wang, X.; Sundquist, J.; Zoller, B.; Memon, A.A.; Palmer, K.; Sundquist, K.; Bennet, L. Determination of 14 circulating microRNAs in Swedes and Iraqis with and without diabetes mellitus type 2. PLoS ONE 2014, 9, e86792. [Google Scholar] [CrossRef] [PubMed]
- Wu, B.; Liu, W.-W.; HE, Y.; Hu, Y.S.; Zhang, Z.L. Analysis on related metabolic influencing factors for miR-21 expression levels in type 2 diabetic patients. Mod. Prev. Med. 2015, 42, 2218–2222. [Google Scholar]
- Yan, S.T.; Li, C.L.; Tian, H.; Li, J.; Pei, Y.; Liu, Y.; Gong, Y.P.; Fang, F.S.; Sun, B.R. MiR-199a is overexpressed in plasma of type 2 diabetes patients which contributes to type 2 diabetes by targeting GLUT4. Mol. Cell. Biochem. 2014, 397, 45–51. [Google Scholar] [CrossRef] [PubMed]
- Zhou, B.; Li, C.; Qi, W.; Zhang, Y.; Zhang, F.; Wu, J.X.; Hu, Y.N.; Wu, D.M.; Liu, Y.; Yan, T.T.; et al. Downregulation of miR-181a upregulates sirtuin-1 (SIRT1) and improves hepatic insulin sensitivity. Diabetologia 2012, 55, 2032–2043. [Google Scholar] [CrossRef] [PubMed]
- Berends, L.; Ozanne, S. Early determinants of type-2 diabetes. Best Pract. Res. Clin. Endocrinol. Metabol. 2012, 26, 569–580. [Google Scholar] [CrossRef] [PubMed]
- Lorenzen, J.; Kumarswamy, R.; Dangwal, S.; Thum, T. MicroRNAs in diabetes and diabetes-associated complications. RNA Biol. 2012, 9, 820–827. [Google Scholar] [CrossRef] [PubMed]
- Dehwah, M.A.S.; Xu, A.; Huang, Q. MicroRNAs and type 2 diabetes/obesity. J. Genet. Genom. 2012, 39, 11–18. [Google Scholar] [CrossRef] [PubMed]
- Rome, S. Are extracellular microRNAs involved in type 2 diabetes and related pathologies? Clin. Biochem. 2013, 46, 937–945. [Google Scholar] [CrossRef] [PubMed]
- Pansuria, M.; Xi, H.; Li, L.; Yang, X.-F.; Wang, H. Insulin resistance, metabolic stress, and atherosclerosis. Front. Biosci. 2012, 4, 916–931. [Google Scholar]
- Poy, M.N.; Eliasson, L.; Krutzfeldt, J.; Kuwajima, S.; Ma, X.; MacDonald, P.E.; Pfeffer, S.; Tuschl, T.; Rajewsky, N.; Rorsman, P. A pancreatic islet-specific microRNA regulates insulin secretion. Nature 2004, 432, 226–230. [Google Scholar] [CrossRef] [PubMed]
- Hashimoto, N.; Kido, Y.; Uchida, T.; Asahara, S.-I.; Shigeyama, Y.; Matsuda, T.; Takeda, A.; Tsuchihashi, D.; Nishizawa, A.; Ogawa, W. Ablation of PDK1 in pancreatic β-cells induces diabetes as a result of loss of β-cell mass. Nat. Genet. 2006, 38, 589–593. [Google Scholar] [CrossRef] [PubMed]
- Gilbert, E.R.; Liu, D. Epigenetics: The missing link to understanding β-cell dysfunction in the pathogenesis of type 2 diabetes. Epigenetics 2012, 7, 841–852. [Google Scholar] [CrossRef] [PubMed]
- Plaisance, V.; Waeber, G.; Regazzi, R.; Abderrahmani, A. Role of microRNAs in Islet β-cell compensation and failure during diabetes. J. Diabetes Res. 2014, 2014, 618652. [Google Scholar] [CrossRef] [PubMed]
- Nesca, V.; Guay, C.; Jacovetti, C.; Menoud, V.; Peyot, M.-L.; Laybutt, D.R.; Prentki, M.; Regazzi, R. Identification of particular groups of microRNAs that positively or negatively impact on β-cell function in obese models of type 2 diabetes. Diabetologia 2013, 56, 2203–2212. [Google Scholar] [CrossRef] [PubMed] [Green Version]
- Sacco, J.; Adeli, K. MicroRNAs: Emerging roles in lipid and lipoprotein metabolism. Curr. Opin. Lipidol. 2012, 23, 220–225. [Google Scholar] [CrossRef] [PubMed]
- Williams, M.D.; Mitchell, G.M. MicroRNAs in insulin resistance and obesity. Exp. Diabetes Res. 2012, 2012, 484696. [Google Scholar] [CrossRef] [PubMed]
- Karbiener, M.; Fischer, C.; Nowitsch, S.; Opriessnig, P.; Papak, C.; Ailhaud, G.; Dani, C.; Amri, E.-Z.; Scheideler, M. MicroRNA miR-27b impairs human adipocyte differentiation and targets PPARγ. Biochem. Biophys. Res. Commun. 2009, 390, 247–251. [Google Scholar] [CrossRef] [PubMed]
- Peng, Y.; Yu, S.; Li, H.; Xiang, H.; Peng, J.; Jiang, S. MicroRNAs: Emerging roles in adipogenesis and obesity. Cell. Signal. 2014, 26, 1888–1896. [Google Scholar] [CrossRef] [PubMed]
- Hamar, P. Role of regulatory microRNAs in type 2 diabetes mellitus-related inflammation. Nucleic Acid Ther. 2012, 22, 289–294. [Google Scholar] [PubMed]
- Keren, A.; Tamir, Y.; Bengal, E. The p38 MAPK signaling pathway: A major regulator of skeletal muscle development. Mol. Cell. Endocrinol. 2006, 252, 224–230. [Google Scholar] [CrossRef] [PubMed]
- Song, M.-Y.; Pan, K.-F.; Su, H.-J.; Zhang, L.; Ma, J.-L.; Li, J.-Y.; Yuasa, Y.; Kang, D.; Kim, Y.S.; You, W.-C. Identification of serum microRNAs as novel non-invasive biomarkers for early detection of gastric cancer. PLoS ONE 2012, 7, e33608. [Google Scholar] [CrossRef] [PubMed]
- Pan, F.; You, J.; Liu, Y.; Qiu, X.; Yu, W.; Ma, J.; Pan, L.; Zhang, A.; Zhang, Q. Differentially expressed microRNAs in the corpus cavernosum from a murine model with type 2 diabetes mellitus-associated erectile dysfunction. Mol. Genet. Genom. 2016, 291, 2215–2224. [Google Scholar] [CrossRef] [PubMed]
- He, J.S.; Lian, C.W.; Fang, Y.L.; Wu, J.Z.; Ye, X.L.; Zhu, S.B. Influence and significance of intervening diabetes microRNA expression profile of NOD mice with exendin-4. Eur Rev. Med. Pharmacol. Sci. 2016, 20, 4322–4327. [Google Scholar] [PubMed]
- Singh, G.B.; Raut, S.K.; Khanna, S.; Kumar, A.; Sharma, S.; Prasad, R.; Khullar, M. MicroRNA-200c modulates DUSP-1 expression in diabetes-induced cardiac hypertrophy. Mol. Cell. Biochem. 2016, 424, 1–11. [Google Scholar] [CrossRef] [PubMed]
- Wei, S.; Zhang, M.; Yu, Y.; Xue, H.; Lan, X.; Liu, S.; Hatch, G.; Chen, L. HNF-4α regulated miR-122 contributes to development of gluconeogenesis and lipid metabolism disorders in type 2 diabetic mice and in palmitate-treated HepG2 cells. Eur. J. Pharmacol. 2016, 791, 254–263. [Google Scholar] [CrossRef] [PubMed]
- Chen, H.Y.; Zhong, X.; Huang, X.R.; Meng, X.M.; You, Y.; Chung, A.C.; Lan, H.Y. MicroRNA-29b inhibits diabetic nephropathy in db/db mice. Mol. Ther. 2014, 22, 842–853. [Google Scholar] [CrossRef] [PubMed]
- Guay, C.; Regazzi, R. Role of islet microRNAs in diabetes: Which model for which question? Diabetologia 2015, 58, 456–463. [Google Scholar] [CrossRef] [PubMed]
- Huang, B.; Qin, W.; Zhao, B.; Shi, Y.; Yao, C.; Li, J.; Xiao, H.; Jin, Y. MicroRNA expression profiling in diabetic GK rat model. Acta Biochim. Biophys. Sin. 2009, 41, 472–477. [Google Scholar] [CrossRef] [PubMed]
- Lu, T.P.; Lee, C.Y.; Tsai, M.H.; Chiu, Y.C.; Hsiao, C.K.; Lai, L.C.; Chuang, E.Y. MiRSystem: An integrated system for characterizing enriched functions and pathways of microRNA targets. PLoS ONE 2012, 7, e42390. [Google Scholar] [CrossRef] [PubMed]
- Cho, S.; Jang, I.; Jun, Y.; Yoon, S.; Ko, M.; Kwon, Y.; Choi, I.; Chang, H.; Ryu, D.; Lee, B.; et al. MiRGator v3.0: A microRNA portal for deep sequencing, expression profiling and mRNA targeting. Nucleic Acids Res. 2013, 41, 252–257. [Google Scholar] [CrossRef] [PubMed]
- Backes, C.; Kehl, T.; Stockel, D.; Fehlmann, T.; Schneider, L.; Meese, E.; Lenhof, H.P.; Keller, A. MiRPathDB: A new dictionary on microRNAs and target pathways. Nucleic Acids Res. 2017, 45, D90–D96. [Google Scholar] [CrossRef] [PubMed]
- Palmer, J.D.; Soule, B.P.; Simone, B.A.; Zaorsky, N.G.; Jin, L.; Simone, N.L. MicroRNA expression altered by diet: Can food be medicinal? Ageing Res. Rev. 2014, 17, 16–24. [Google Scholar] [CrossRef] [PubMed]
- Chen, G.Q.; Lian, W.J.; Wang, G.M.; Wang, S.; Yang, Y.Q.; Zhao, Z.W. Altered microRNA expression in skeletal muscle results from high-fat diet-induced insulin resistance in mice. Mol. Med. Rep. 2012, 5, 1362–1368. [Google Scholar] [PubMed]
- Baier, S.R.; Nguyen, C.; Xie, F.; Wood, J.R.; Zempleni, J. MicroRNAs are absorbed in biologically meaningful amounts from nutritionally relevant doses of cow milk and affect gene expression in peripheral blood mononuclear cells, HEK-293 kidney cell cultures, and mouse livers. J. Nutr. 2014, 144, 1495–1500. [Google Scholar] [CrossRef] [PubMed]


| Author, Year (Ref.) | Country | Sample Type | miRNA | Exp Change | Assay Method | Number of Samples | Avg Age | Gender (M/F) | QC |
|---|---|---|---|---|---|---|---|---|---|
| Ding et al., 2016 [63] | China | Serum | miR-451a, -4534 | Up | RT-qPCR | T2DM(40)/NC(56) | 61.21 | 59/37 | 9 |
| miR-320d, -3960, -572 | Down | ||||||||
| Hou et al., 2016 [62] | China | Pancreatic islets | miR-463-3p | Up | RT-qPCR | T2DM(34)/NC(34) | 53 ± 7.5 | 35/33 | 7 |
| Jansen et al., 2016 [61] | Germany | Plasma | miR-126, -26a | Down | RT-qPCR | T2DM(55)/NC(80) | 66.4 ± 10.9 | 45/90 | 7 |
| Latouche et al., 2016 [60] | Australia | SM | miR-194 | Down | RT-qPCR | T2DM(6)/NC(5) | 50.72 | NA | 8 |
| Li et al., 2016 [59] | China | Serum | miR-221/222 | Up | RT-qPCR | T2DM(30)/NC(20) | 60.28 | NA | 7 |
| Pek et al., 2016 [58] | China, Malaysia, India and Others | Adipose tissue | miR-100, miR-378, miR-99a, miR-125b, miR-181a, miR-210 and miR-378 | Down | Microarray RT-qPCR | T2DM(42)/NC(73) | 40.4 ± 11.25 | NA | 7 |
| Rezk et al., 2016 [57] | Egypt | Serum | miR-126 | Down | RT-qPCR | T2DM(100)/NC(100) | 46.95 | 95/105 | 9 |
| Seyhan et al., 2016 [56] | USA | Plasma | miR-30d, -34a, -21, -148a | Up | RT-qPCR | T2DM(31)/NC(27) | 40.05 | 30/28 | 9 |
| Yan et al., 2016 [53] | China | Plasma | miR-572 | Up | Microarray RT-qPCR | T2DM(50)/NC(50) | 45.87 | 49/51 | 8 |
| miR-1249, -320b | Down | ||||||||
| Wang et al., 2016 [55] | China | Serum | miR-661, -571, -770-5p, -892b, -1303, -15a, -16, -125b, -221, -320a | Up | RT-qPCR | T2DM(92)/NC(92) | 48.95 | 114/70 | 8 |
| Baldeon et al., 2016 [64] | Ecuador | Serum | miR-574-3p, -146a | Down | RT-PCR | T2DM(64)/NC(44) | 61 (37–85) | 37/71 | 8 |
| Wang et al., 2016 [54] | China | Plasma | miR-296, -9 | Down | RT-qPCR | T2DM(150)/NC(150) | 48.6 ± 1.7 | 150/150 | 7 |
| Long et al., 2015 [67] | China | PBMC | miR-223-3p | Down | RT-qPCR | T2DM(16)/NC(18) | 55 | 20/14 | 6 |
| Olivieri et al., 2015 [66] | Italy | PBMC | miR-126-3p, -21-5p | Down | RT-qPCR | T2DM(76)/NC(107) | 64.79 | 85/98 | 9 |
| Yang et al., 2015 [52] | China | Plasma/platelets | miR-144 | Up | RT-qPCR | T2DM(114)/NC(30) | 49.8 ± 9.1 | NA | 8 |
| miR-223 | Down | ||||||||
| Higuchi et al., 2015 [70] | Japan | Serum | miR-101, -375, -802 | Up | RT-qPCR | T2DM(155)/NC(49) | 62.3 ± 13.2 | 121/83 | 7 |
| Al-Kafaji et al., 2015 [73] | Bahrain | WB | miRNA-15a | Down | RT-qPCR | T2DM(24)/NC(24) | 52 ± 6.0 | 23/25 | 8 |
| Lenin et al., 2015 [68] | India | PBMC | miR-146a | Down | RT-qPCR | T2DM(35)/NC(35) | 47.3 ± 7 | 36/34 | 6 |
| Sebastiani et al., 2015 [65] | Italia | Pancreatic islets | miR-124a | Up | RT-qPCR | T2DM(5)/NC(10) | 71.2 ± 9.8 | 7/8 | 7 |
| Jiao et al., 2015 [69] | China | PB | miR-130a, -10b, -143 | Down | RT-qPCR | T2DM(30)/NC(42) | 56 ± 10 | NA | 8 |
| Bao et al., 2015 [71] | China | Plasma/Serum | miR-185 | Down | RT-qPCR | T2DM(34)/NC(30) | NA | NA | 9 |
| Baldeón et al., 2015 [72] | Ecuador | PBMC | miR-34c-5p, -576-3p | Up | Microarray RT-qPCR | T2DM(64)/NC(44) | 61 (37–85) | 37/71 | 6 |
| Wu et al., 2015 [79] | China | PBMC | miR-21 | Up | RT-qPCR | T2DM(18)/NC(18) | 53.6 ± 4.6 | 18/18 | 7 |
| Ortega et al., 2014 [77] | Spain | Plasma | miR-140-5p, -142-3p, -222 | Up | RT-qPCR | T2DM(48)/NC(45) | 54 ± 10 | 93/0 | 8 |
| miR-423-5p, -125b, -192, -195, -130b, -532-5p, -126 | Down | ||||||||
| Yan et al., 2014 [80] | China | Plasma | miR-199a | Up | RT-PCR | T2DM(64)/NC(64) | 46–62 | NA | 8 |
| Lu et al., 2014 [76] | China | Plasma | miR-375, miR-126 | Up | RT-qPCR | T2DM(30)/NC(30) | 53.67 ± 8.92 | 42/18 | 8 |
| Wang et al., 2014 [78] | Swedes Iraqis | Plasma | miR-15a, -21, -144, -150, -486-5p | Up | RT-qPCR | T2DM(33)/NC(119) | 45-65 | 83/69 | 7 |
| miR-24, -29b, -126, -320a | Down | ||||||||
| Liu et al., 2014 [35] | China | Serum | miR-126 | Down | qPCR | T2DM(160)/NC(138) | 50.2 ± 6.7 | 78/82 | 9 |
| Pan et al., 2014 [51] | China | WB | miR-146a, -155 | Down | FQ-PCR | T2DM(36)/NC(32) | 61.0 ± 7.0 | 20/16 | 9 |
| Locke et al., 2014 [36] | UK | Islet | miR-129-3p, -187, -345 | Up | RT-qPCR | T2DM(9)/NC(11) | 53 | 7/2 | 5 |
| Yang et al., 2014 [40] | China | Serum | miR-23a, let-7i, -486, -96, -186, -191, -192, -146a | Down | RT-qPCR | T2DM(24)/NC(20) | 50.60 ± 5.128 | 16/8 | 9 |
| Santovito et al., 2014 [38] | Germany | Plasma | miR-326 | Up | RT-qPCR | T2DM(18)/NC(12) | 57.2 ± 9.6 | 12/6 | 7 |
| miR-let-7a,let-7f | Down | ||||||||
| Mao et al., 2014 [35] | China | Serum | miR-18a | Down | qPCR | T2DM(33)/NC(33) | 53.8 (35–72) | 13/20 | 6 |
| Baldeon et al., 2014 [32] | Netherlands | Serum | miR-146a | Down | RT-qPCR | T2DM(56)/NC(40) | 62 (38–85) | 22/34 | 8 |
| Sun et al., 2014 [39] | China | Plasma | miR-375 | Up | qPCR | T2DM(100)/NC(100) | 51.33 ± 11.75 | 54/46 | 9 |
| Kameswaran et al., 2014 [23] | USA | Islet | miR-7, -136, -369, -369-3p, -411, -432, -487a, -487b, -495, -539-3p, -655, -656 | Down | RT-qPCR | T2DM(20)/NC(29) | 51.35 (22–65) | 14/6 | 8 |
| miR-187, -187 *, -224, -589 | Up | ||||||||
| Zhang et al., 2014 [41] | China | Serum | miR-29b | Up | RT-PCR | T2DM(50)/NC(50) | 35–70 | 30/20 | 8 |
| Ren et al., 2014 [37] | China | Plasma | miR-126 | Down | RT-PCR | T2DM(40)/NC(40) | 43.0 ± 11.0 | 24/16 | 9 |
| Zhou et al., 2013 [47] | China | WB | let-7a | Up | RT-PCR | T2DM(104)/NC(62) | 52.8 ± 10.4 | 59/45 | 9 |
| Pescador et al., 2013 [45] | Spain | Serum | miR-503 | Down | RT-qPCR | T2DM(13)/NC(20) | 69.40 ± 7.12 | 7/6 | 8 |
| Zhang et al., 2013 [47] | China | Plasma | miR-126 | Down | RT-qPCR | T2DM(30)/NC(30) | 63 ± 8.56 (42–73) | 16/14 | 8 |
| Agarwal et al., 2013 [42] | India | SM | miR-135a | Up | RT-PCR | T2DM(3)/NC(3) | 65–75 | 3/0 | 5 |
| Rong et al., 2013 [46] | China | Plasma | miR-146a | Up | qPCR | T2DM(90)/NC(90) | 48.50 (42–56) | 47/43 | 9 |
| Corral, et al., 2013 [43] | México | PBMC | miR-146a, -155 | Down | RT-PCR | T2DM(20)/NC(20) | 46.2 (35–59) | 11/9 | 6 |
| Liang et al, 2013 [75] | China | Serum | miR-29a, -375 | Up | RT-FQ-PCR | T2DM(48)/NC(38) | 54.9 ± 9.8 (35–72) | 27/21 | 9 |
| Zhou et al., 2012 [81] | China | Serum | miR-181a | Up | RT-PCR | T2DM(20)/NC(20) | NA | NA | 7 |
| Meng et al., 2012 [28] | China | PBMC | miR-21, -27a, -27b, -126, -130a | Down | Microarray RT-qPCR | T2DM(15)/NC(15) | 67 ± 8 | 7/8 | 8 |
| Karolina et al., 2012 [27] | Singapore | WB | miR-17, -92a, -130a, -195, -197, -509-5p, -652 | Down | Microarray RT-qPCR | T2DM(50)/NC(46) | 42.02 | NA | 9 |
| miR-27a, -150, -192, -320a, -375 | Up | ||||||||
| Balasubramanyam et al., 2011 [24] | India | PBMC | miR-146a | Down | RT-qPCR | T2DM(20)/NC(20) | 43.7 ± 5.1 | NA | 8 |
| Caporali et al., 2011 [25] | U.K. | Plasma | miR-503 | Up | RT-PCR | T2DM(10)/NC(11) | 68.09 ± 9.06 | 9/1 | 7 |
| SM | miR-503 | ||||||||
| Karolina et al., 2011 [26] | Singapore | WB | miR-15a, -17, -17 *, -23a, -23b, -26a, -26b, -27a, -29b, -29c, -99b *, -106b, -125a-5p, -125b, -126, -130a, -130b, -142-3p, -151-3p, -151-5p, -183, -185, -190, -193a-3p, -194, -221, -222, -299-3p, -320b, -320c, -320d, -335, -361-3p, -375, -502-3p, -550, -550 *, -589, -620, -629, -665, -886-5p, -1285, -1301 | Up | Microarray | T2DM(21)/NC(15) | 43.2 (21–70) | 21/0 | 9 |
| miR-7, -19a, -20a, -20b, -30c, -30e, -34b, -106a, -129-5p, -146b-5p, -185 *, -186, -340, -342-3p, -362-5p, -374b, -519e, -532-3p, -636, -637, -652, -660, -923, -1184, -1297, let-7b *, let-7d, let-7e, let-7g, let-7i | Down | ||||||||
| miR-29a, -144, -150, -192, -320a | Up | RT-qPCR | |||||||
| miR-30d, -146a, -182 | Down | ||||||||
| Kong et al., 2011 [34] | China | Serum | miR-9, -29a, -30d, -34a, -124a, -146a, -375 | Up | RT-qPCR | T2DM(18)/NC(19) | 47.33 ± 2.617 | 9/9 | 9 |
| Zhao et al., 2010 [31] | Hong Kong | Pancreas | miR-375 | Up | RT-qPCR | T2DM(40)/NC(15) | 69 ± 13 | 17/23 | 8 |
| Zampetaki et al., 2010 [30] | U.K. | Plasma | miR-15a, -20b, -21, -24, -29b, -126, -150, -191, -197, -223, -320, -486 | Down | Microarray/RT-qPCR | T2DM(80)/NC(80) | 66.3 ± 8.9 | 30/50 | 5 |
| miR-28-3p | Up | ||||||||
| Gallagher et al., 2010 [49] | U.K. | SM | miR-15b, -30b *, -30c-2 *, -32 *, -93, -106b, -138-1 *, -142-3p, -142-5p, -143, -144, -181a-2 *, -185, -193a-5p, -371-5p, -451, -503, -518c *, -589, -597, -600, -634, -658, -665, -668, -765, -921, -923, -937 | Up | Microarray | T2DM(45)/NC(47) | 54.8 ± 10.2 | NA | 7 |
| miR-10a, -10b, -15a, -27b, -30e, -95, -100, -126 *, -128, -133a, -152, -154, -190, -196a, -199a-3p, -199b-5p, -206, -208a, -331-3p, -342-3p, -362-3p, -374a, -374b, -378 *, -422a, -423-3p, -424, -455-5p, -519d, -768-3p, -768-5p, -801 | Down | ||||||||
| Ortega et al., 2010 [29] | Spain | Adipose | miR-125b, -199a-5p, -221, -1229 | Up | RT-PCR | T2DM(9)/NC(6) | 45 ± 10 | 0/9 | 8 |
| miR-30a *, -130b, -484 | Down | ||||||||
| Kong et al., 2010 [74] | China | Serum | miR-34a | Up | RT-qPCR | T2DM(18)/NC(26) | 47.33 ± 2.62 | 23/21 | |
| Klöting et al., 2009 [50] | Germany | Adipose | miR-147, -181a, -197 | Up | Microarray | T2DM(6)/NC(9) | 67 ± 2.8 | NA | 8 |
| miR-17-5p, -27a, -30e, -132, -134, -140, -155, -210 | Down | ||||||||
| Granjon et al., 2009 [33] | France | SM | miR-1, -133a | Down | RT-qPCR | T2DM(5)/NC(15) | 51 ± 2 | 2/3 | 7 |
| Increased in T2DM Patient a | |||||||
| miR-101-3p | |||||||
| miR-124-3p | |||||||
| miR-125b-5p | |||||||
| miR-1303 | |||||||
| miR-126-3p | miR-146a-5p | ||||||
| miR-140-5p | miR-15a-5p | ||||||
| miR-142-3p | miR-16-5p | ||||||
| miR-144-3p | miR-181a-5p | ||||||
| miR-106b-5p | miR-146a-5p | miR-221-3p | |||||
| miR-135a-5p | miR-451a | miR-148a-3p | miR-222-3p | ||||
| miR-138-1-3p | miR-503-5p | miR-15a-5p | miR-29a-3p | ||||
| miR-142-3p | miR-518c-5p | miR-150-5p | miR-29b-3p | ||||
| miR-142-5p | miR-589-5p | miR-199a-5p | miR-30d-5p | ||||
| miR-143-3p | miR-597-5p | miR-21-5p | miR-320a | ||||
| miR-144-3p | miR-600 | miR-222-3p | miR-34a-5p | ||||
| miR-124-3p | miR-15b-5p | miR-634 | let-7a-5p | miR-28-3p | miR-375 | ||
| miR-1229-3p | miR-129-3p | miR-181a-2-3p | miR-658 | miR-144-3p | miR-30d-5p | miR-451a | |
| miR-125b-5p | miR-187-3p | miR-185-5p | miR-665 | miR-150-5p | miR-326 | miR-4534 | |
| miR-147a | miR-187-5p | miR-193a-5p | miR-668-3p | miR-192-5p | miR-34a-5p | miR-571 | |
| miR-181a-5p | miR-224-5p | miR-30b-3p | miR-765 | miR-27a-3p | miR-375 | miR-661 | |
| miR-197-3p | miR-345-5p | miR-30c-2-3p | miR-921 | miR-29a-3p | miR-21-5p | miR-486-5p | miR-770-5p |
| miR-199a-5p | miR-375 | miR-32-3p | miR-93-5p | miR-320a | miR-34c-5p | miR-503-5p | miR-892b |
| miR-221-3p | miR-589-5p | miR-371a-5p | miR-937-3p | miR-375 | miR-576-3p | miR-572 | miR-9-5p |
| Adipose b | Islet b | Skeletal Muscle b | Whole Blood b | PBMC b | Plasma b | Serum b | |
| T2DM(72)/NC(103) | T2DM(88)/NC(113) | T2DM(114)/NC(128) | T2DM(378)/NC(312) | T2DM(264)/NC(277) | T2DM(1058)/NC(1234) | T2DM(961)/NC(821) | |
| miR-100-5p | miR-136-5p | miR-100-5p | miR-208a-3p | miR-10b-5p | miR-126-3p | let-7a-5p | let-7i-5p |
| miR-125b-5p | miR-369-3p | miR-10a-5p | miR-27b-3p | miR-130a-3p | miR-130a-3p | let-7f-5p | miR-126-3p |
| miR-130b-3p | miR-411-5p | miR-10b-5p | miR-30e-5p | miR-143-3p | miR-146a-5p | miR-1249-3p | miR-146a-5p |
| miR-132-3p | miR-432-5p | miR-126-5p | miR-331-3p | miR-146a-5p | miR-155-5p | miR-125b-5p | miR-186-5p |
| miR-134-5p | miR-487a-3p | miR-128-3p | miR-342-3p | miR-155-5p | miR-21-5p | miR-126-3p | miR-18a-5p |
| miR-140-5p | miR-487b-3p | miR-133a-3p | miR-362-3p | miR-15a-5p | miR-223-3p | miR-130b-3p | miR-191-5p |
| miR-155-5p | miR-495-3p | miR-1-3p | miR-374a-5p | miR-17-5p | miR-27a-3p | miR-15a-5p | miR-192-5p |
| miR-17-5p | miR-539-3p | miR-152-3p | miR-374b-5p | miR-182-5p | miR-27b-3p | miR-150-5p | miR-23a-3p |
| miR-181a-5p | miR-655-3p | miR-154-5p | miR-378a-5p | miR-195-5p | miR-191-5p | miR-320d | |
| miR-210-3p | miR-656-3p | miR-15a-5p | miR-422a | miR-197-3p | miR-192-5p | miR-3960 | |
| miR-27a-3p | miR-7-5p | miR-190a-5p | miR-423-3p | miR-30d-5p | miR-195-5p | miR-486-5p | |
| miR-30a-5p | miR-194-5p | miR-424-5p | miR-509-5p | miR-197-3p | miR-503-5p | ||
| miR-30e-5p | miR-196a-5p | miR-455-5p | miR-652-3p | miR-20b-5p | miR-572 | ||
| miR-378a-3p | miR-199a-3p | miR-519d-3p | miR-92a-3p | miR-21-5p | miR-574-3p | ||
| miR-484 | miR-199b-5p | miR-95-3p | miR-223-3p | miR-96-5p | |||
| miR-99a-5p | miR-206 | miR-24-3p | |||||
| miR-26a-5p | |||||||
| miR-296-5p | |||||||
| miR-29b-3p | |||||||
| miR-320a | |||||||
| miR-320b | |||||||
| miR-423-5p | |||||||
| miR-486-5p | |||||||
| miR-532-5p | |||||||
| miR-9-5p | |||||||
| Decreased in T2DM patient a | |||||||
| miRNA ID | Plasma | Serum | PBMC | Whole Blood | Skeletal Muscle | Islet | Adipose |
|---|---|---|---|---|---|---|---|
| let-7a-5p | Down | Up | |||||
| miR-100-5p | Down | Down | |||||
| miR-124-3p | Up | Up | |||||
| miR-125b-5p | Down | Up | Up | ||||
| Down | |||||||
| miR-126-3p | Up | Down | Down | Down | |||
| Down | |||||||
| miR-126-5p | Down | ||||||
| miR-130a-3p | Down | Down | |||||
| miR-140-5p | Up | Down | |||||
| miR-142-3p | Up | Up | |||||
| miR-143-3p | Down | UP | |||||
| miR-144-3p | Up | Up | Up | ||||
| miR-146a-5p | Up | Down | Down | Down | |||
| Up | |||||||
| miR-150-5p | Up | Up | |||||
| Down | |||||||
| miR-155-5p | Down | Down | |||||
| miR-15a-5p | Up | Up | Down | Down | |||
| Down | |||||||
| miR-17-5p | Down | Down | |||||
| miR-181a-5p | Up | Up | |||||
| Down | |||||||
| miR-191-5p | Down | Down | |||||
| miR-192-5p | Down | Down | Up | ||||
| miR-195-5p | Down | Down | |||||
| miR-197-3p | Down | Down | Up | ||||
| miR-199a-5p | Up | Up | |||||
| miR-21-5p | Up | Up | |||||
| Down | Down | ||||||
| miR-221-3p | UP | Up | |||||
| miR-222-3p | Up | Up | |||||
| miR-223-3p | Down | Down | |||||
| miR-27a-3p | Down | Up | |||||
| miR-27b-3p | Down | Down | |||||
| miR-29a-3p | Up | Up | |||||
| miR-29b-3p | Down | Up | |||||
| miR-30d-5p | Up | Up | Down | ||||
| miR-30e-5p | Down | Down | |||||
| miR-320a | Down | Up | Up | ||||
| miR-34a-5p | Up | Up | |||||
| miR-375 | Up | Up | Up | Up | |||
| miR-451a | Up | Up | |||||
| miR-486-5p | Up | Down | |||||
| Down | |||||||
| miR-503-5p | Up | Down | Up | ||||
| miR-572 | Up | Down | |||||
| miR-589-5p | Up | Up | |||||
| miR-9-5p | Down | Up |
© 2017 by the authors. Licensee MDPI, Basel, Switzerland. This article is an open access article distributed under the terms and conditions of the Creative Commons Attribution (CC BY) license ( http://creativecommons.org/licenses/by/4.0/).
Share and Cite
He, Y.; Ding, Y.; Liang, B.; Lin, J.; Kim, T.-K.; Yu, H.; Hang, H.; Wang, K. A Systematic Study of Dysregulated MicroRNA in Type 2 Diabetes Mellitus. Int. J. Mol. Sci. 2017, 18, 456. https://doi.org/10.3390/ijms18030456
He Y, Ding Y, Liang B, Lin J, Kim T-K, Yu H, Hang H, Wang K. A Systematic Study of Dysregulated MicroRNA in Type 2 Diabetes Mellitus. International Journal of Molecular Sciences. 2017; 18(3):456. https://doi.org/10.3390/ijms18030456
Chicago/Turabian StyleHe, Yuqing, Yuanlin Ding, Biyu Liang, Juanjuan Lin, Taek-Kyun Kim, Haibing Yu, Hanwei Hang, and Kai Wang. 2017. "A Systematic Study of Dysregulated MicroRNA in Type 2 Diabetes Mellitus" International Journal of Molecular Sciences 18, no. 3: 456. https://doi.org/10.3390/ijms18030456