
Evaluating Complex Mixtures in the Zebrafish Embryo by Reconstituting Field Water Samples: A Metal Pollution Case Study

 , , ,
, , ,
Abstract
:
1. Introduction
2. Results
2.1. Physicochemical Properties of the Scheppelijke Nete (SN), Ditch (D) and Kneutersloop (K)
2.2. Exposure to Field Water Samples and Reconstituted Water Samples
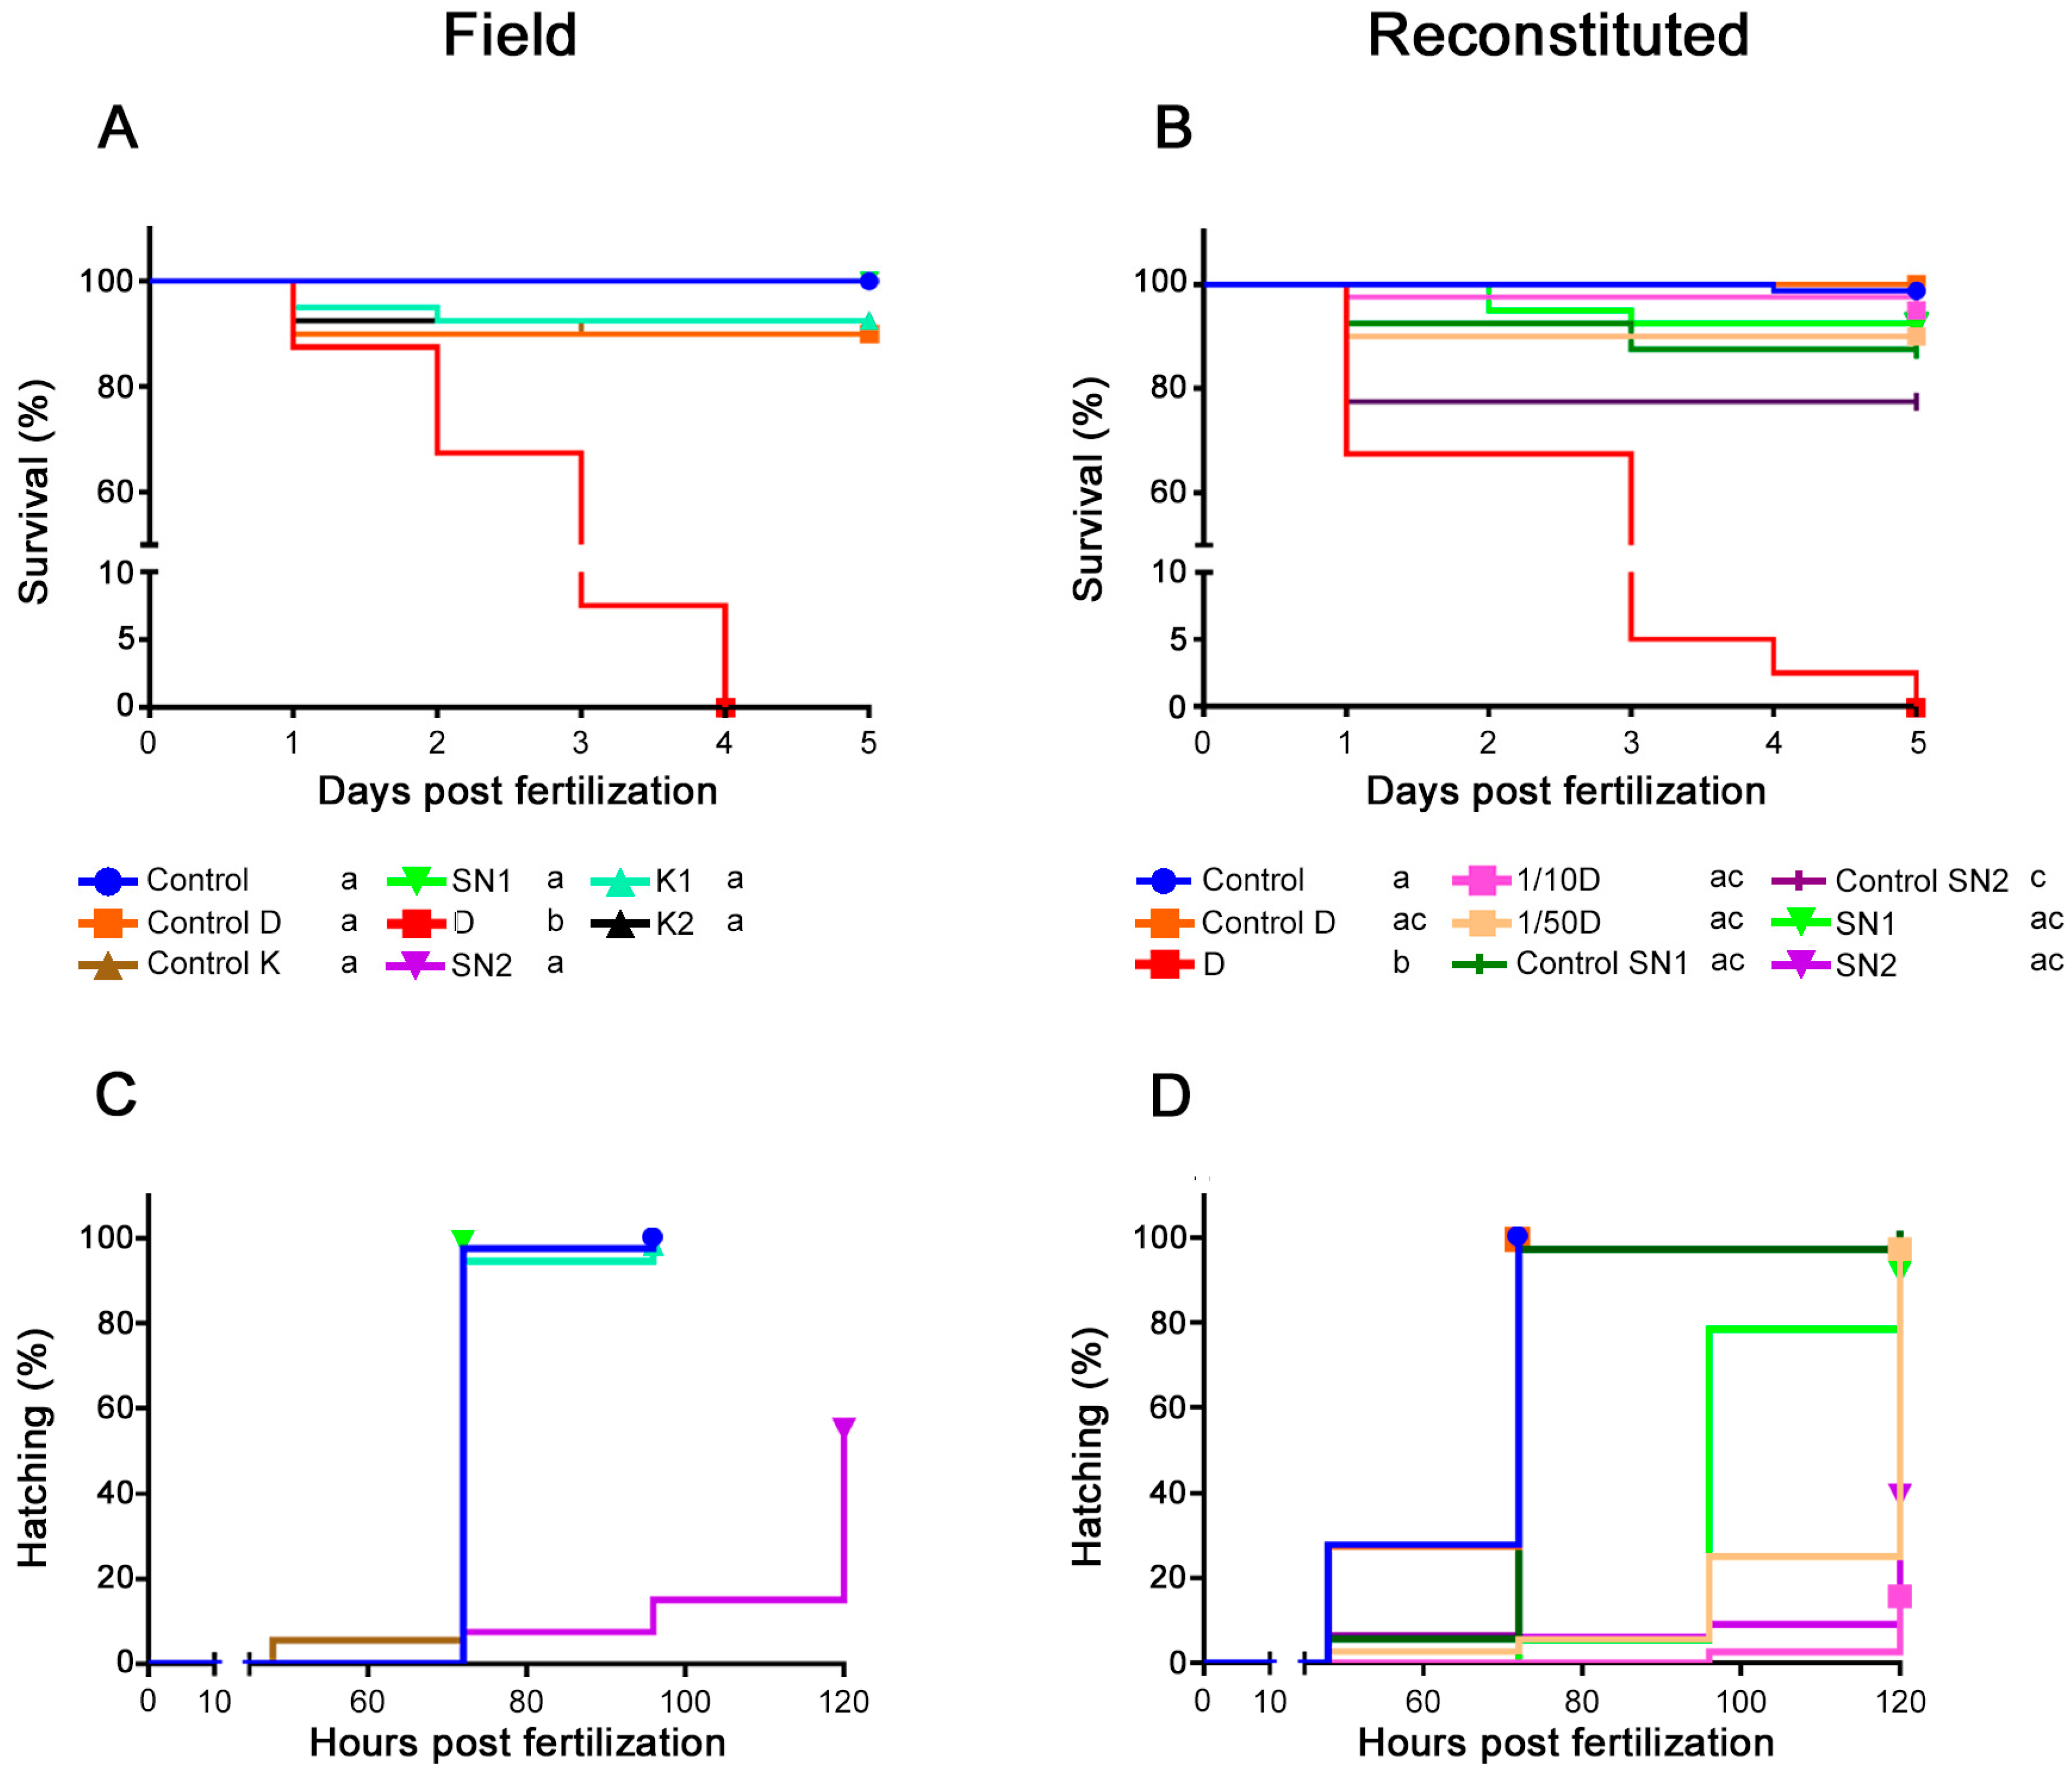
2.2.1. Survival
2.2.2. Hatching
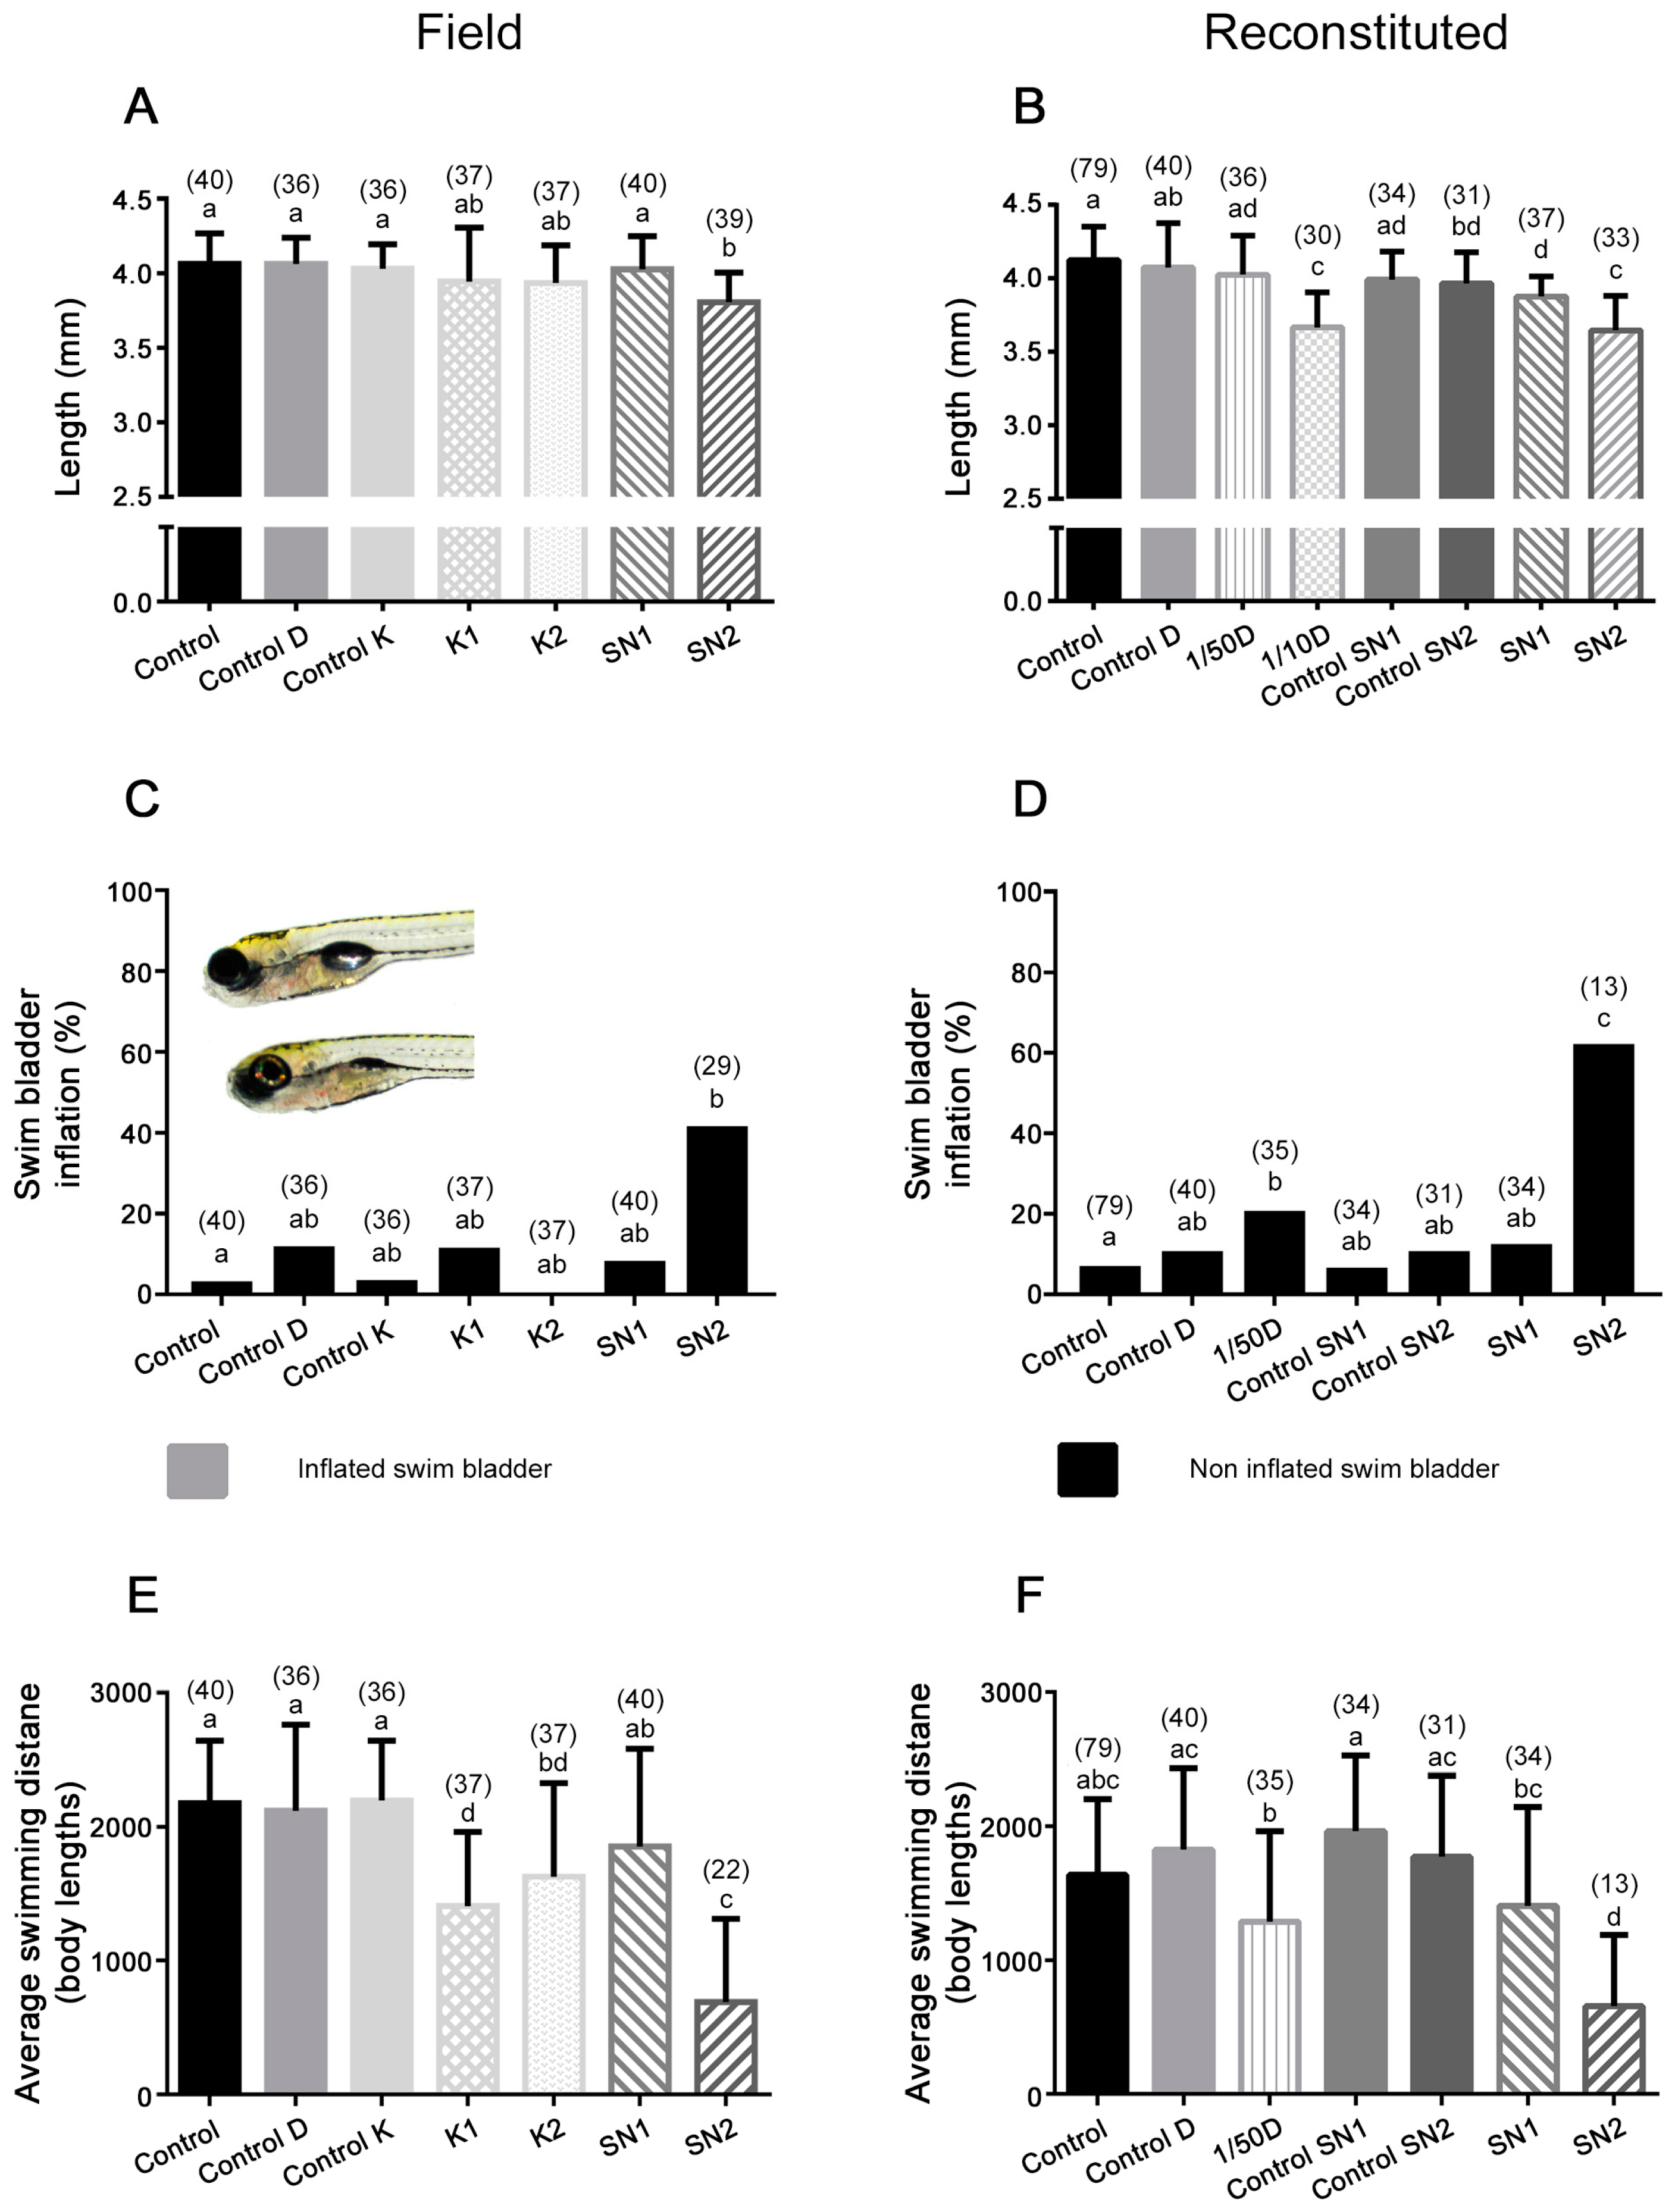
2.2.3. Length
2.2.4. Morphological Abnormalities
2.2.5. Swimming Activity
2.2.6. Metal Measurements of the Reconstituted Mixtures
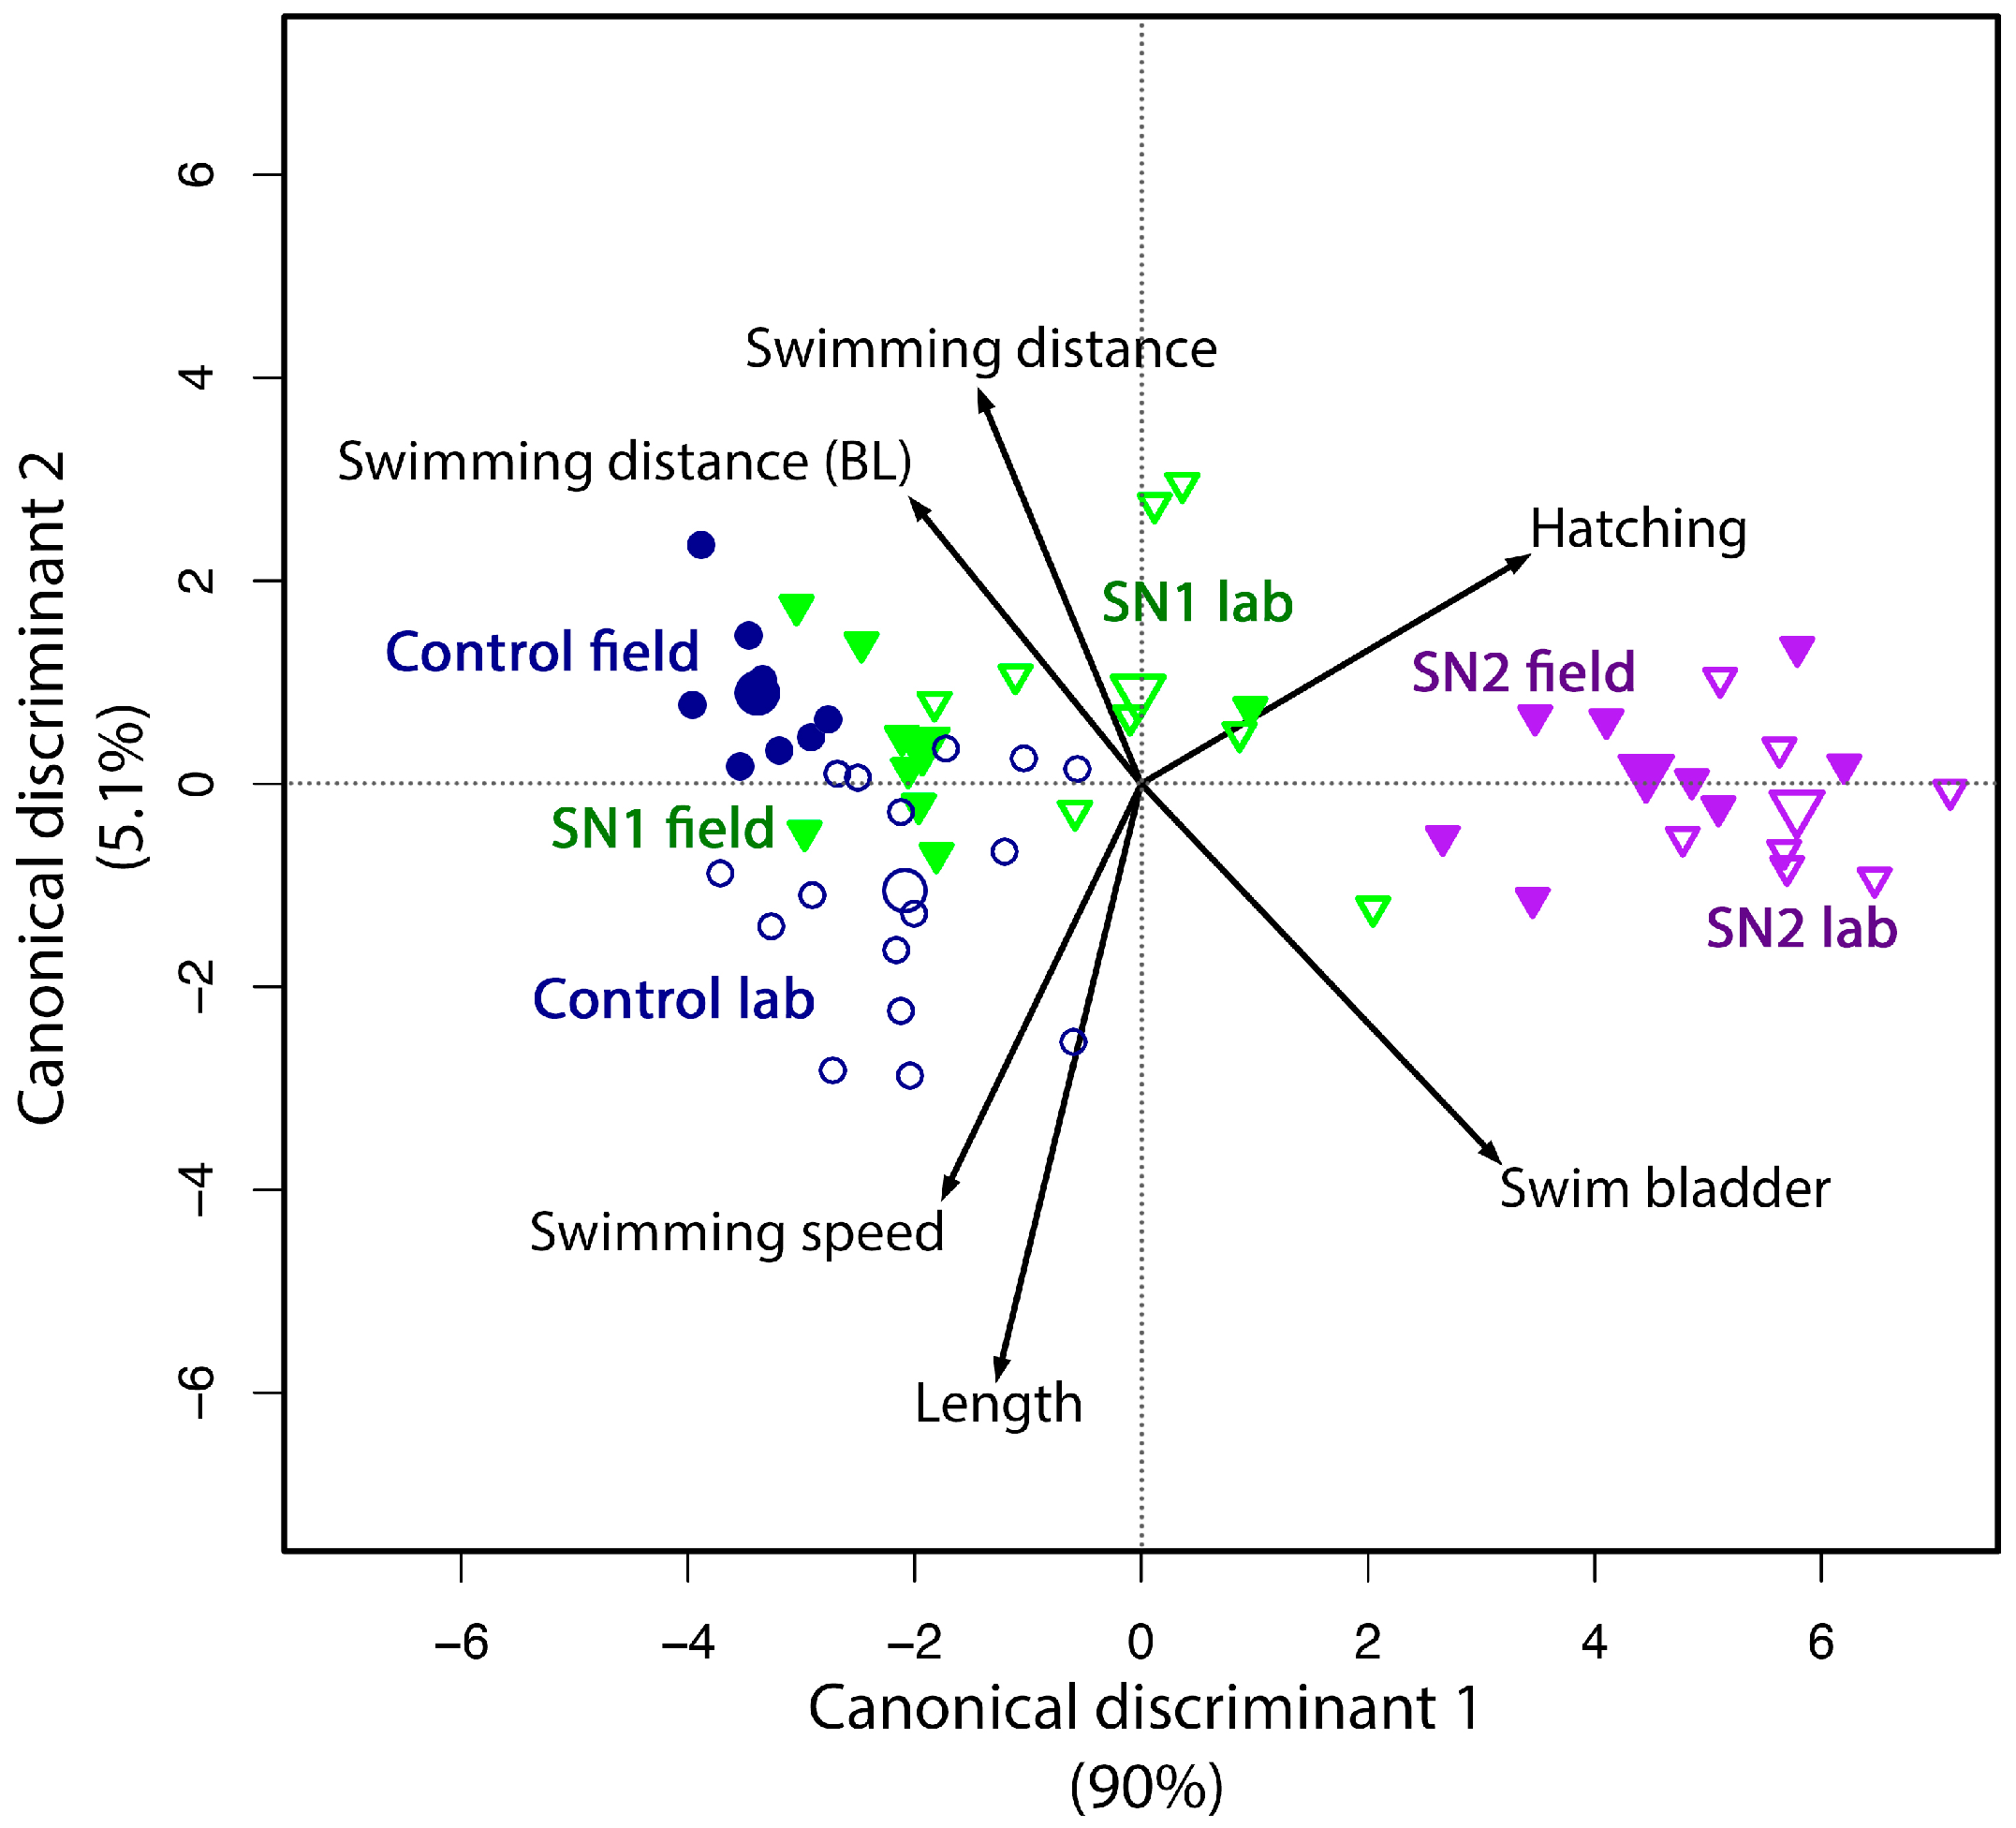
2.2.7. Identification of the Similarity between Field and Reconstituted Exposure Scenarios
3. Discussion
3.1. Contamination History of the Study Area
3.2. Comparison between the Toxicity of Field and Reconstituted Water Samples
3.2.1. Toxicity in the Selected Streams Was Mainly Caused by the Metal Mixtures
3.2.2. More Detailed Toxicity Analysis of the Selected Sites
4. Materials and Methods
4.1. Fish Maintenance and Egg Production
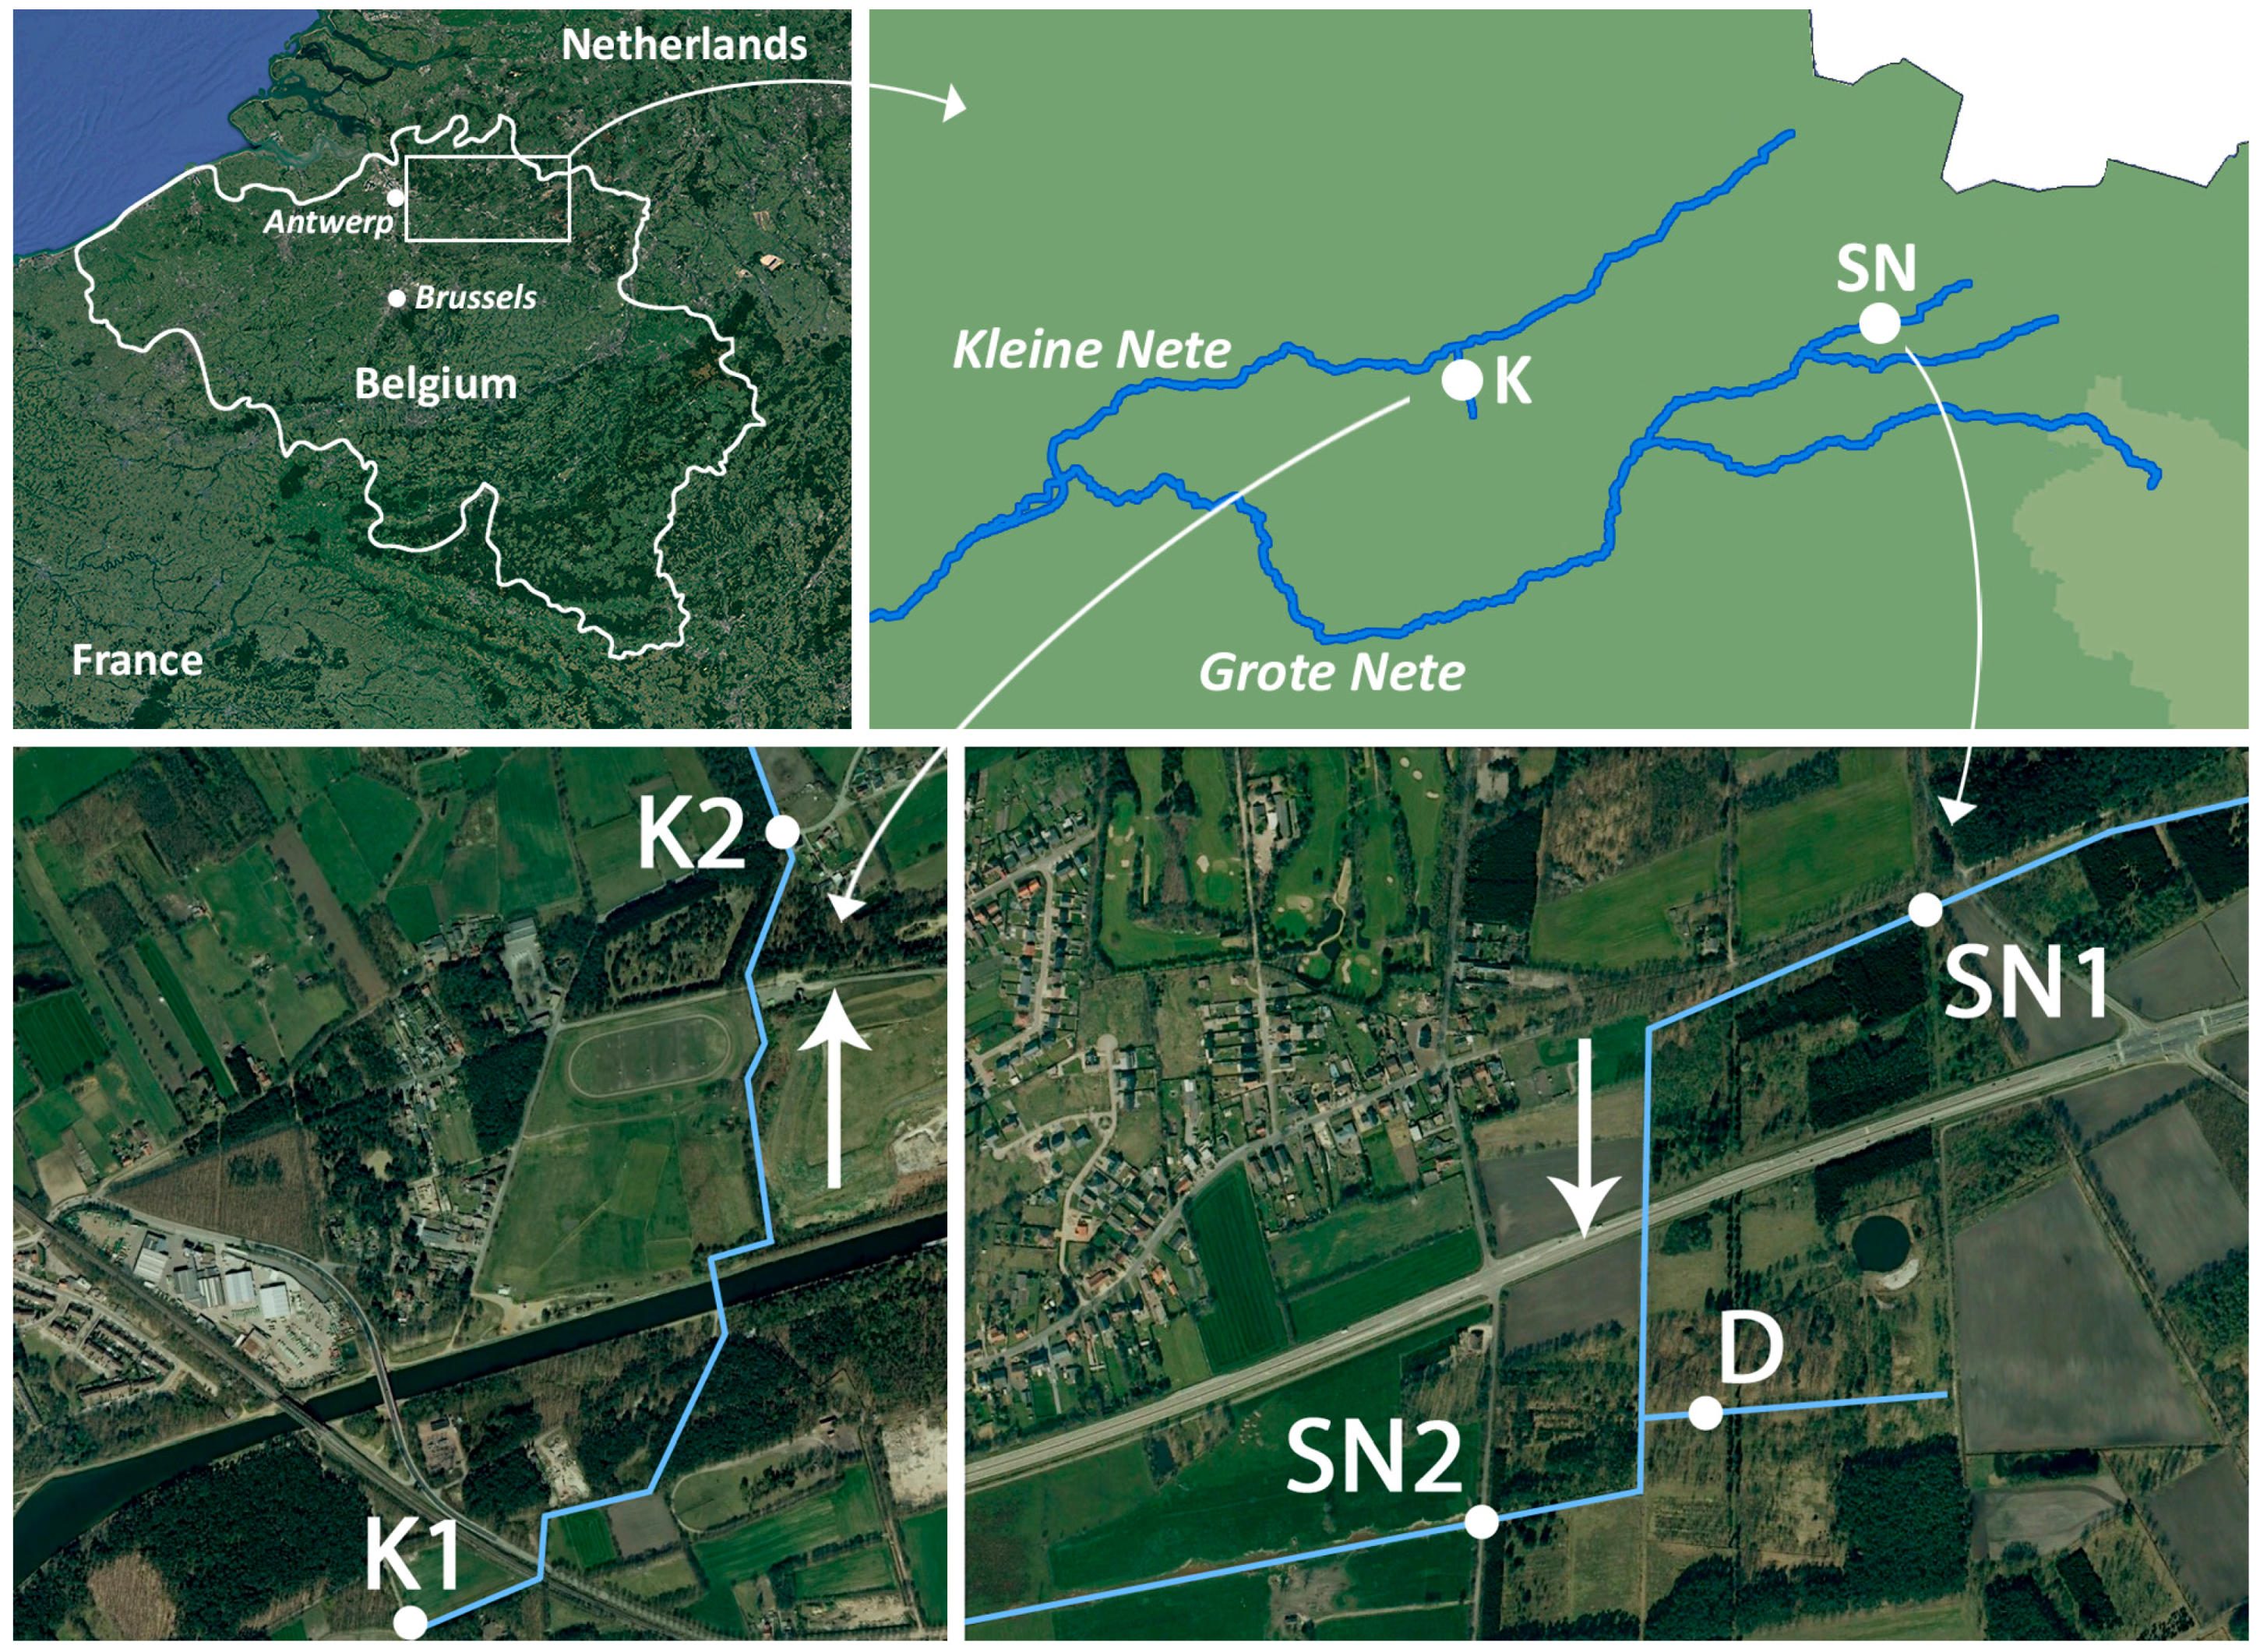
4.2. Study Area
4.3. General Zebrafish Embryo Exposure Procedure
4.4. Determination of Salinity Tolerance Range
4.5. Exposure to Field Water Samples
4.6. Metal Analysis
4.7. Exposure to Reconstituted Water Samples
4.8. Statistical Analysis
5. Conclusions
Supplementary Materials
Acknowledgments
Author Contributions
Conflicts of Interest
References
- Kuzmanovic, M.; Ginebreda, A.; Petrovic, M.; Barcelo, D. Risk assessment based prioritization of 200 organic micropollutants in 4 iberian rivers. Sci. Total Environ. 2015, 503, 289–299. [Google Scholar] [CrossRef] [PubMed]
- Beyer, J.; Petersen, K.; Song, Y.; Ruus, A.; Grung, M.; Bakke, T.; Tollefsen, K.E. Environmental risk assessment of combined effects in aquatic ecotoxicology: A discussion paper. Mar. Environ. Res. 2014, 96, 81–91. [Google Scholar] [CrossRef] [PubMed]
- Brian, J.V.; Harris, C.A.; Scholze, M.; Kortenkamp, A.; Booy, P.; Lamoree, M.; Pojana, G.; Jonkers, N.; Marcomini, A.; Sumpter, J.P. Evidence of estrogenic mixture effects on the reproductive performance of fish. Environ. Sci. Technol. 2007, 41, 337–344. [Google Scholar] [CrossRef] [PubMed]
- Kortenkamp, A. Low dose mixture effects of endocrine disrupters: Implications for risk assessment and epidemiology. Int. J. Androl. 2008, 31, 233–237. [Google Scholar] [CrossRef] [PubMed]
- Silva, E.; Rajapakse, N.; Kortenkamp, A. Something from “nothing”—Eight weak estrogenic chemicals combined at concentrations below noecs produce significant mixture effects. Environ. Sci. Technol. 2002, 36, 1751–1756. [Google Scholar] [CrossRef] [PubMed]
- Abu Bakar, S.N.N.; Ashriya, A.; Shuib, A.S.; Razak, S.A. Genotoxic effect of zinc and cadmium following single and binary mixture exposures in tilapia (Oreochromis niloticus) using micronucleus test. Sains Malays. 2014, 43, 1053–1059. [Google Scholar]
- Attar, E.N.; Maly, E.J. Acute toxicity of cadmium, zinc, and cadmium-zinc mixtures to Daphnia-magna. Arch. Environ. Contam. Toxicol. 1982, 11, 291–296. [Google Scholar] [PubMed]
- Brack, W.; Klamer, H.J.C.; de Ada, M.L.; Barcelo, D. Effect-directed analysis of key toxicants in european river basins—A review. Environ. Sci. Pollut. Res. 2007, 14, 30–38. [Google Scholar]
- Whitehead, A.; Kuivila, K.M.; Orlando, J.L.; Kotelevtsev, S.; Anderson, S.L. Genotoxicity in native fish associated with agricultural runoff events. Environ. Toxicol. Chem. 2004, 23, 2868–2877. [Google Scholar] [CrossRef] [PubMed]
- Johnsen, K.; Tana, J.; Lehtinen, K.-J.; Stuthridge, T.; Mattsson, K.; Hemming, J.; Carlberg, G.E. Experimental field exposure of brown trout to river water receiving effluent from an integrated newsprint mill. Ecotoxicol. Environ. Saf. 1998, 40, 184–193. [Google Scholar] [CrossRef] [PubMed]
- Schoenaers, S.; Vergauwen, L.; Hagenaars, A.; Vanhaecke, L.; AbdElgawad, H.; Asard, H.; Covaci, A.; Bervoets, L.; Knapen, D. Prioritization of contaminated watercourses using an integrated biomarker approach in caged carp. Water Res. 2016, 99, 129–139. [Google Scholar] [CrossRef] [PubMed]
- Di Paolo, C.; Seiler, T.-B.; Keiter, S.; Hu, M.; Muz, M.; Brack, W.; Hollert, H. The value of zebrafish as an integrative model in effect-directed analysis—A review. Environ. Sci. Eur. 2015, 27, 1–11. [Google Scholar] [CrossRef] [Green Version]
- Fang, M.; Getzinger, G.J.; Cooper, E.M.; Clark, B.W.; Garner, L.V.T.; Di Giulio, R.T.; Ferguson, P.L.; Stapleton, H.M. Effect-directed analysis of elizabeth river porewater: Developmental toxicity in zebrafish (Danio rerio). Environ. Toxicol. Chem. 2014, 33, 2767–2774. [Google Scholar] [CrossRef] [PubMed]
- Legler, J.; van Velzen, M.; Cenijn, P.H.; Houtman, C.J.; Lamoree, M.H.; Wegener, J.W. Effect-directed analysis of municipal landfill soil reveals novel developmental toxicants in the zebrafish Danio rerio. Environ. Sci. Technol. 2011, 45, 8552–8558. [Google Scholar] [CrossRef] [PubMed] [Green Version]
- United States Environmental Protection Agency. Methods for Aquatic Toxicity Identification Evaluations: Phase I Toxicity Characterization Procedures, 2nd ed.Environmental Research Laboratory: Duluth, MN, USA, 1991.
- United States Environmental Protection Agency. Methods for Aquatic Toxicity Identification Evaluations: Phase II Toxicity Identification Procedures for Samples Exhibiting Acute and Chronic Toxicity; Environmental Research Laboratory: Duluth, MN, USA, 1993.
- United States Environmental Protection Agency. Methods for Aquatic Toxicity Identification Evaluations: Phase III Toxicity Confirmation Procedures for Samples Exhibiting Acute and Chronic Toxicity; Environmental Research Laboratory: Duluth, MN, USA, 1993.
- Burgess, R.M.; Ho, K.T.; Brack, W.; Lamoree, M. Effects-directed analysis (EDA) and toxicity identification evaluation (TIE): Complementary but different approaches for diagnosing causes of environmental toxicity. Environ. Toxicol. Chem. 2013, 32, 1935–1945. [Google Scholar] [CrossRef] [PubMed]
- Jain, C.K.; Singhal, D.C.; Sharma, M.K. Metal pollution assessment of sediment and water in the river hindon, india. Environ. Monit. Assess. 2005, 105, 193–207. [Google Scholar] [CrossRef] [PubMed]
- Kar, D.; Sur, P.; Mandal, S.K.; Saha, T.; Kole, R.K. Assessment of heavy metal pollution in surface water. Int. J. Environ. Sci. Technol. 2008, 5, 119–124. [Google Scholar] [CrossRef]
- Shanbehzadeh, S.; Vahid Dastjerdi, M.; Hassanzadeh, A.; Kiyanizadeh, T. Heavy metals in water and sediment: A case study of tembi river. J. Environ. Public Health 2014, 2014, 858720. [Google Scholar] [CrossRef] [PubMed]
- Organisation for Economic Co-Operation and Development. OECD Guidelines for the Testing of Chemicals: Fish Embryo Acute Toxicity (Fet) Test; Organisation for Economic Co-Operation and Development: Pairs, France, 2013. [Google Scholar]
- Bervoets, L.; Blust, R. Metal concentrations in water, sediment and gudgeon (Gobio gobio) from a pollution gradient: Relationship with fish condition factor. Environ. Pollut. 2003, 126, 9–19. [Google Scholar] [CrossRef]
- Bervoets, L.; Meregalli, G.; de Cooman, W.; Goddeeris, B.; Blust, R. Caged midge larvae (Chironomus riparius) for the assessment of metal bioaccumulation from sediments in situ. Environ. Toxicol. Chem. 2004, 23, 443–454. [Google Scholar] [CrossRef] [PubMed]
- De Jonge, M.; Blust, R.; Bervoets, L. The relation between acid volatile sulfides (AVS) and metal accumulation in aquatic invertebrates: Implications of feeding behavior and ecology. Environ. Pollut. 2010, 158, 1381–1391. [Google Scholar] [CrossRef] [PubMed]
- Fraysse, B.; Mons, R.; Garric, J. Development of a zebrafish 4-day embryo-larval bioassay to assess toxicity of chemicals. Ecotoxicol. Environ. Saf. 2006, 63, 253–267. [Google Scholar] [CrossRef] [PubMed]
- Kucukoglu, M.; Binokay, U.S.; Pekmezekmek, A.B. The effects of zinc chloride during early embryonic development in zebrafish (Brachydanio rerio). Turk. J. Biol. 2013, 37, 158–164. [Google Scholar]
- Sarnowski, P. The Effects of Metals on Swimbladder Inflation of Common Carp (Cyprinus carpio L.) Larvae. Available online: http://www.ejpau.media.pl/articles/volume7/issue1/fisheries/art-01.pdf (accessed on 17 February 2015).
- Stinckens, E.; Vergauwen, L.; Schroeder, A.L.; Maho, W.; Blackwell, B.R.; Witters, H.; Blust, R.; Ankley, G.T.; Covaci, A.; Villeneuve, D.L.; et al. Impaired anterior swim bladder inflation following exposure to the thyroid peroxidase inhibitor 2-mercaptobenzothiazole part II: Zebrafish. Aquat. Toxicol. 2016, 173, 204–217. [Google Scholar] [CrossRef] [PubMed]
- Dave, G. The influence of ph on the toxicity of aluminum, cadmium, and iron to eggs and larvae of the zebrafish, brachydanio-rerio. Ecotoxicol. Environ. Saf. 1985, 10, 253–267. [Google Scholar] [CrossRef]
- Bervoets, L.; Knaepkens, G.; Eens, M.; Blust, R. Fish community responses to metal pollution. Environ. Pollut. 2005, 138, 338–349. [Google Scholar] [CrossRef] [PubMed]
- Medcalc Software. Available online: https://www.medcalc.org/ (accessed on 22 December 2016).
- Pype, C.; Verbueken, E.; Saad, M.A.; Casteleyn, C.R.; van Ginneken, C.J.; Knapen, D.; van Cruchten, S.J. Incubation at 32.5 degrees C and above causes malformations in the zebrafish embryo. Reprod. Toxicol. 2015, 56, 56–63. [Google Scholar] [CrossRef] [PubMed]


| (µg/L) | Al | Cr | Mn | Fe | Ni | Cu | Zn | As | Cd | Pb |
|---|---|---|---|---|---|---|---|---|---|---|
| SN1 | 53.0 | 0.4 | 31.1 | 267 | 2.4 | 12.5 | 65.8 | 2.5 | 0.5 | 2.9 |
| D | 904 | 0.3 | 5298 | 10440 | 67.2 | 3.0 | 98621 | 131 | 3383 | 2.2 |
| SN2 | 84.3 | 0.3 | 264 | 709 | 5.0 | 4.3 | 3447 | 2.9 | 6.7 | 2.1 |
| K1 | 12.6 | 0.3 | 26.1 | 847 | 34.9 | 60.4 | 46.2 | 7.8 | 1.4 | 3.3 |
| K2 | 10.4 | 0.4 | 17.7 | 847 | 35.4 | 56.4 | 27.4 | 6.3 | 0.9 | 2.9 |
| Norm | 87 a | 5 b | / c | / c | 20 b | 7 b | 20 b | 3 b | 0.08–0.25 b (*) | 7.2 b |
| Sample | Ca (mg/L) | Mg (mg/L) | K (mg/L) | Na (mg/L) | pH | Conductivity (µS/cm) |
|---|---|---|---|---|---|---|
| SN1 | 54.05 | 6.50 | 9.01 | 28.89 | 7.47 | 476 |
| D | 51.16 | 13.60 | 12.92 | 39.22 | 6.14 | 931 |
| SN2 | 54.31 | 6.82 | 8.46 | 28.57 | 7.39 | 509 |
| K1 | 38.16 | 8.36 | 8.78 | 208.24 | 7.33 | 1343 |
| K2 | 37.61 | 8.26 | 8.50 | 201.74 | 7.42 | 1322 |
| Standard embryo medium | 2.86 | 8.56 | 5.08 | 68.94 | 7.50 | 500 |
| µg/L (% of Nominal) | Al | Mn | Fe | Ni | Cu | Zn | As | Cd |
|---|---|---|---|---|---|---|---|---|
| SN1 (n = 3) | 52 ± 0 (98.4%) | 30.9 ± 0.4 (99.1%) | 253 ± 5 (95.1%) | 2.6 ± 0.09 (109.9%) | 12.3 ± 0.2 (97.8%) | 64.3 ± 1.1 (97.7%) | 2.4 ± 0.09 (92.8%) | 0.6 ± 0.04 (107.2%) |
| D (n = 2) | 926 ± 10 (102.4%) | 5446 ± 50.2 (102.8%) | 10582 ± 842 (101.4%) | 64.6 ± 0.02 (96.1%) | 2.9 ± 0.3 (98.3%) | 98550 ± 1089 (99.9%) | 128 ± 0.6 (97.9%) | 3290 ± 58.7 (97.2%) |
| 1/10D (n = 3) | 93 ± 1 (102.3%) | 523 ± 3.2 (98.7%) | 1069 ± 49 (102.4%) | 6.9 ± 0.09 (102.9%) | BDL | 9691 ± 84.1 (98.3%) | 12.8 ± 0.08 (98.0%) | 342 ± 7.8 (101.2%) |
| 1/50D (n = 3) | 18 ± 0 (99.6%) | 98.8 ± 2.3 (93.3%) | 196 ± 14 (93.8%) | 1.5 ± 0.2 (109.9%) | BDL | 1854 ± 52.1 (94.0%) | 2.6 ± 0.07 (101.2%) | 63.9 ± 2.5 (94.4%) |
| SN2 (n = 3) | 82 ± 1 (97.6%) | 257 ± 1.7 (97.5%) | 672 ± 7 (94.7%) | 4.8 ± 0.1 (97.1%) | 4.8 ± 0.2 (112.6%) | 3256 ± 27.1 (94.4%) | 2.7 ± 0.04 (94.1%) | 6.9 ± 0.08 (102.7%) |
| Standard embryo medium | BDL | BDL | 10 | 0.1 | 1.3 | 5.1 | BDL | BDL |
| Control SN1 | BDL | BDL | BDL | 0.9 | BDL | BDL | BDL | BDL |
| Control D | BDL | BDL | BDL | 0.5 | BDL | BDL | BDL | BDL |
| Control SN2 | BDL | BDL | BDL | 0.6 | BDL | BDL | BDL | BDL |
© 2017 by the authors. Licensee MDPI, Basel, Switzerland. This article is an open access article distributed under the terms and conditions of the Creative Commons Attribution (CC BY) license ( http://creativecommons.org/licenses/by/4.0/).
Share and Cite
Michiels, E.D.G.; Vergauwen, L.; Hagenaars, A.; Fransen, E.; Dongen, S.V.; Van Cruchten, S.J.; Bervoets, L.; Knapen, D. Evaluating Complex Mixtures in the Zebrafish Embryo by Reconstituting Field Water Samples: A Metal Pollution Case Study. Int. J. Mol. Sci. 2017, 18, 539. https://doi.org/10.3390/ijms18030539
Michiels EDG, Vergauwen L, Hagenaars A, Fransen E, Dongen SV, Van Cruchten SJ, Bervoets L, Knapen D. Evaluating Complex Mixtures in the Zebrafish Embryo by Reconstituting Field Water Samples: A Metal Pollution Case Study. International Journal of Molecular Sciences. 2017; 18(3):539. https://doi.org/10.3390/ijms18030539
Chicago/Turabian StyleMichiels, Ellen D. G., Lucia Vergauwen, An Hagenaars, Erik Fransen, Stefan Van Dongen, Steven J. Van Cruchten, Lieven Bervoets, and Dries Knapen. 2017. "Evaluating Complex Mixtures in the Zebrafish Embryo by Reconstituting Field Water Samples: A Metal Pollution Case Study" International Journal of Molecular Sciences 18, no. 3: 539. https://doi.org/10.3390/ijms18030539