
Selective Expression of Flt3 within the Mouse Hematopoietic Stem Cell Compartment

Abstract
:
1. Introduction
2. Results
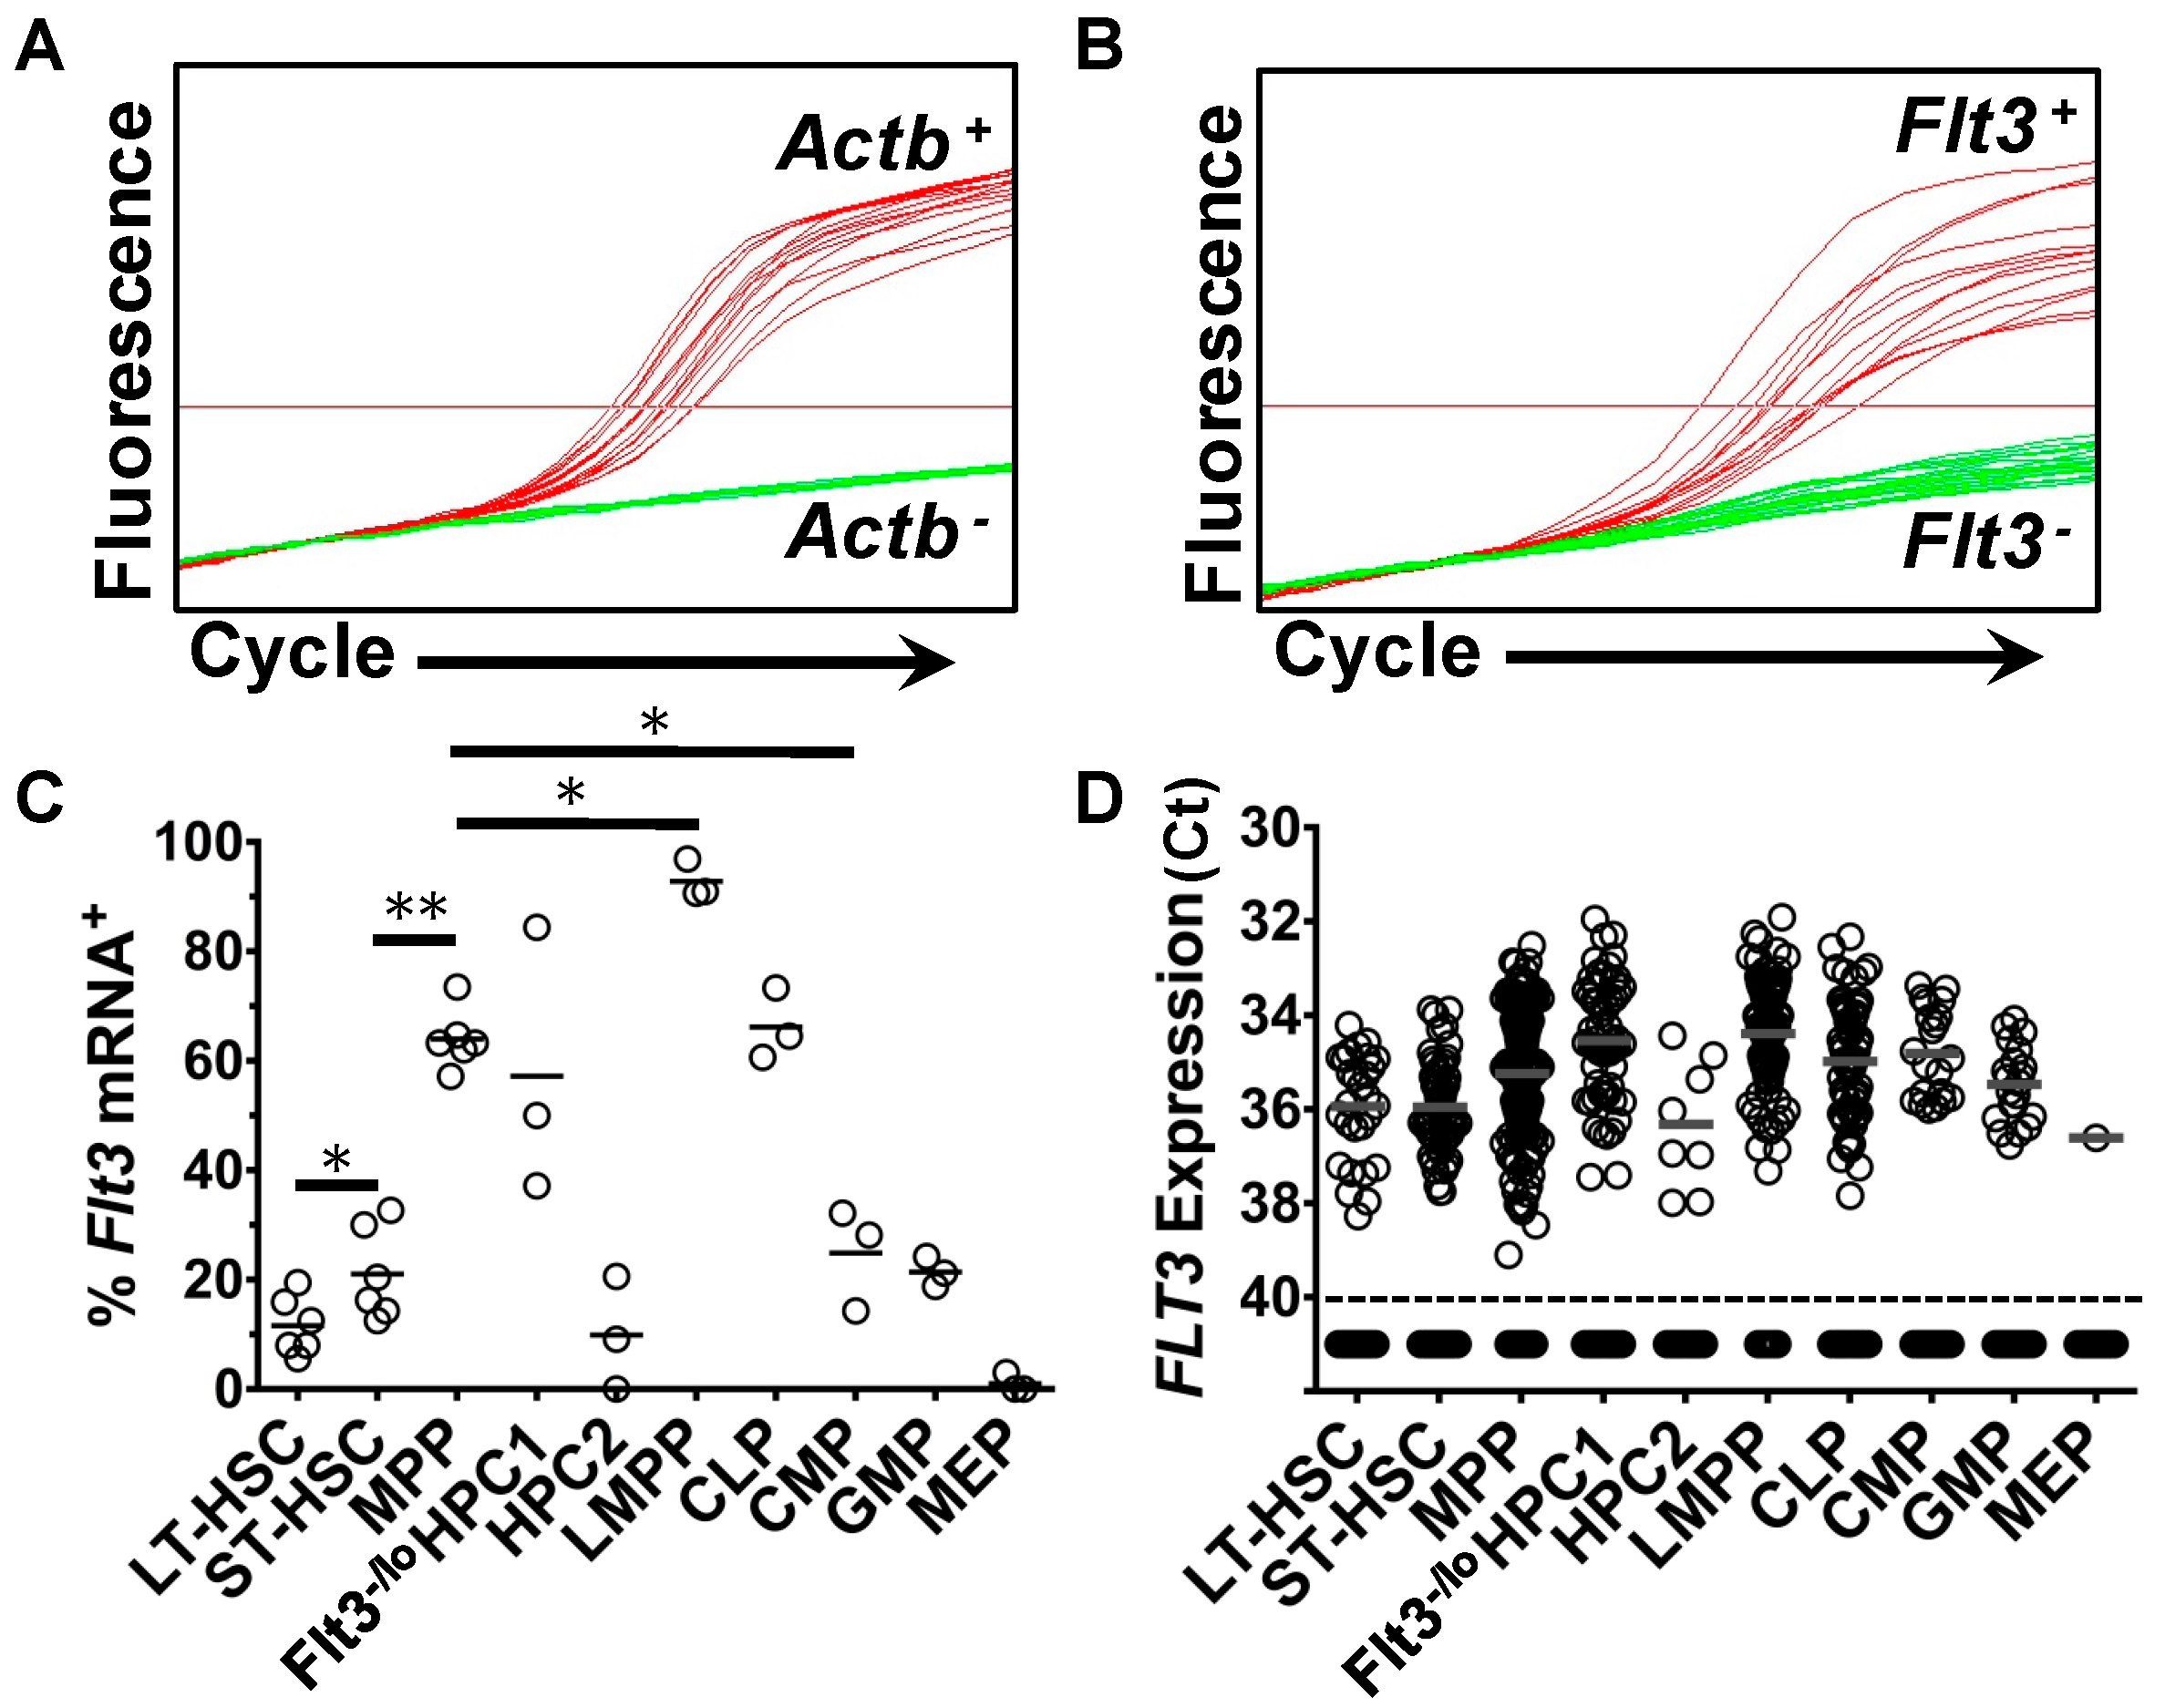
2.1. Heterogeneous Expression of Flt3 Transcripts by Single HSPC
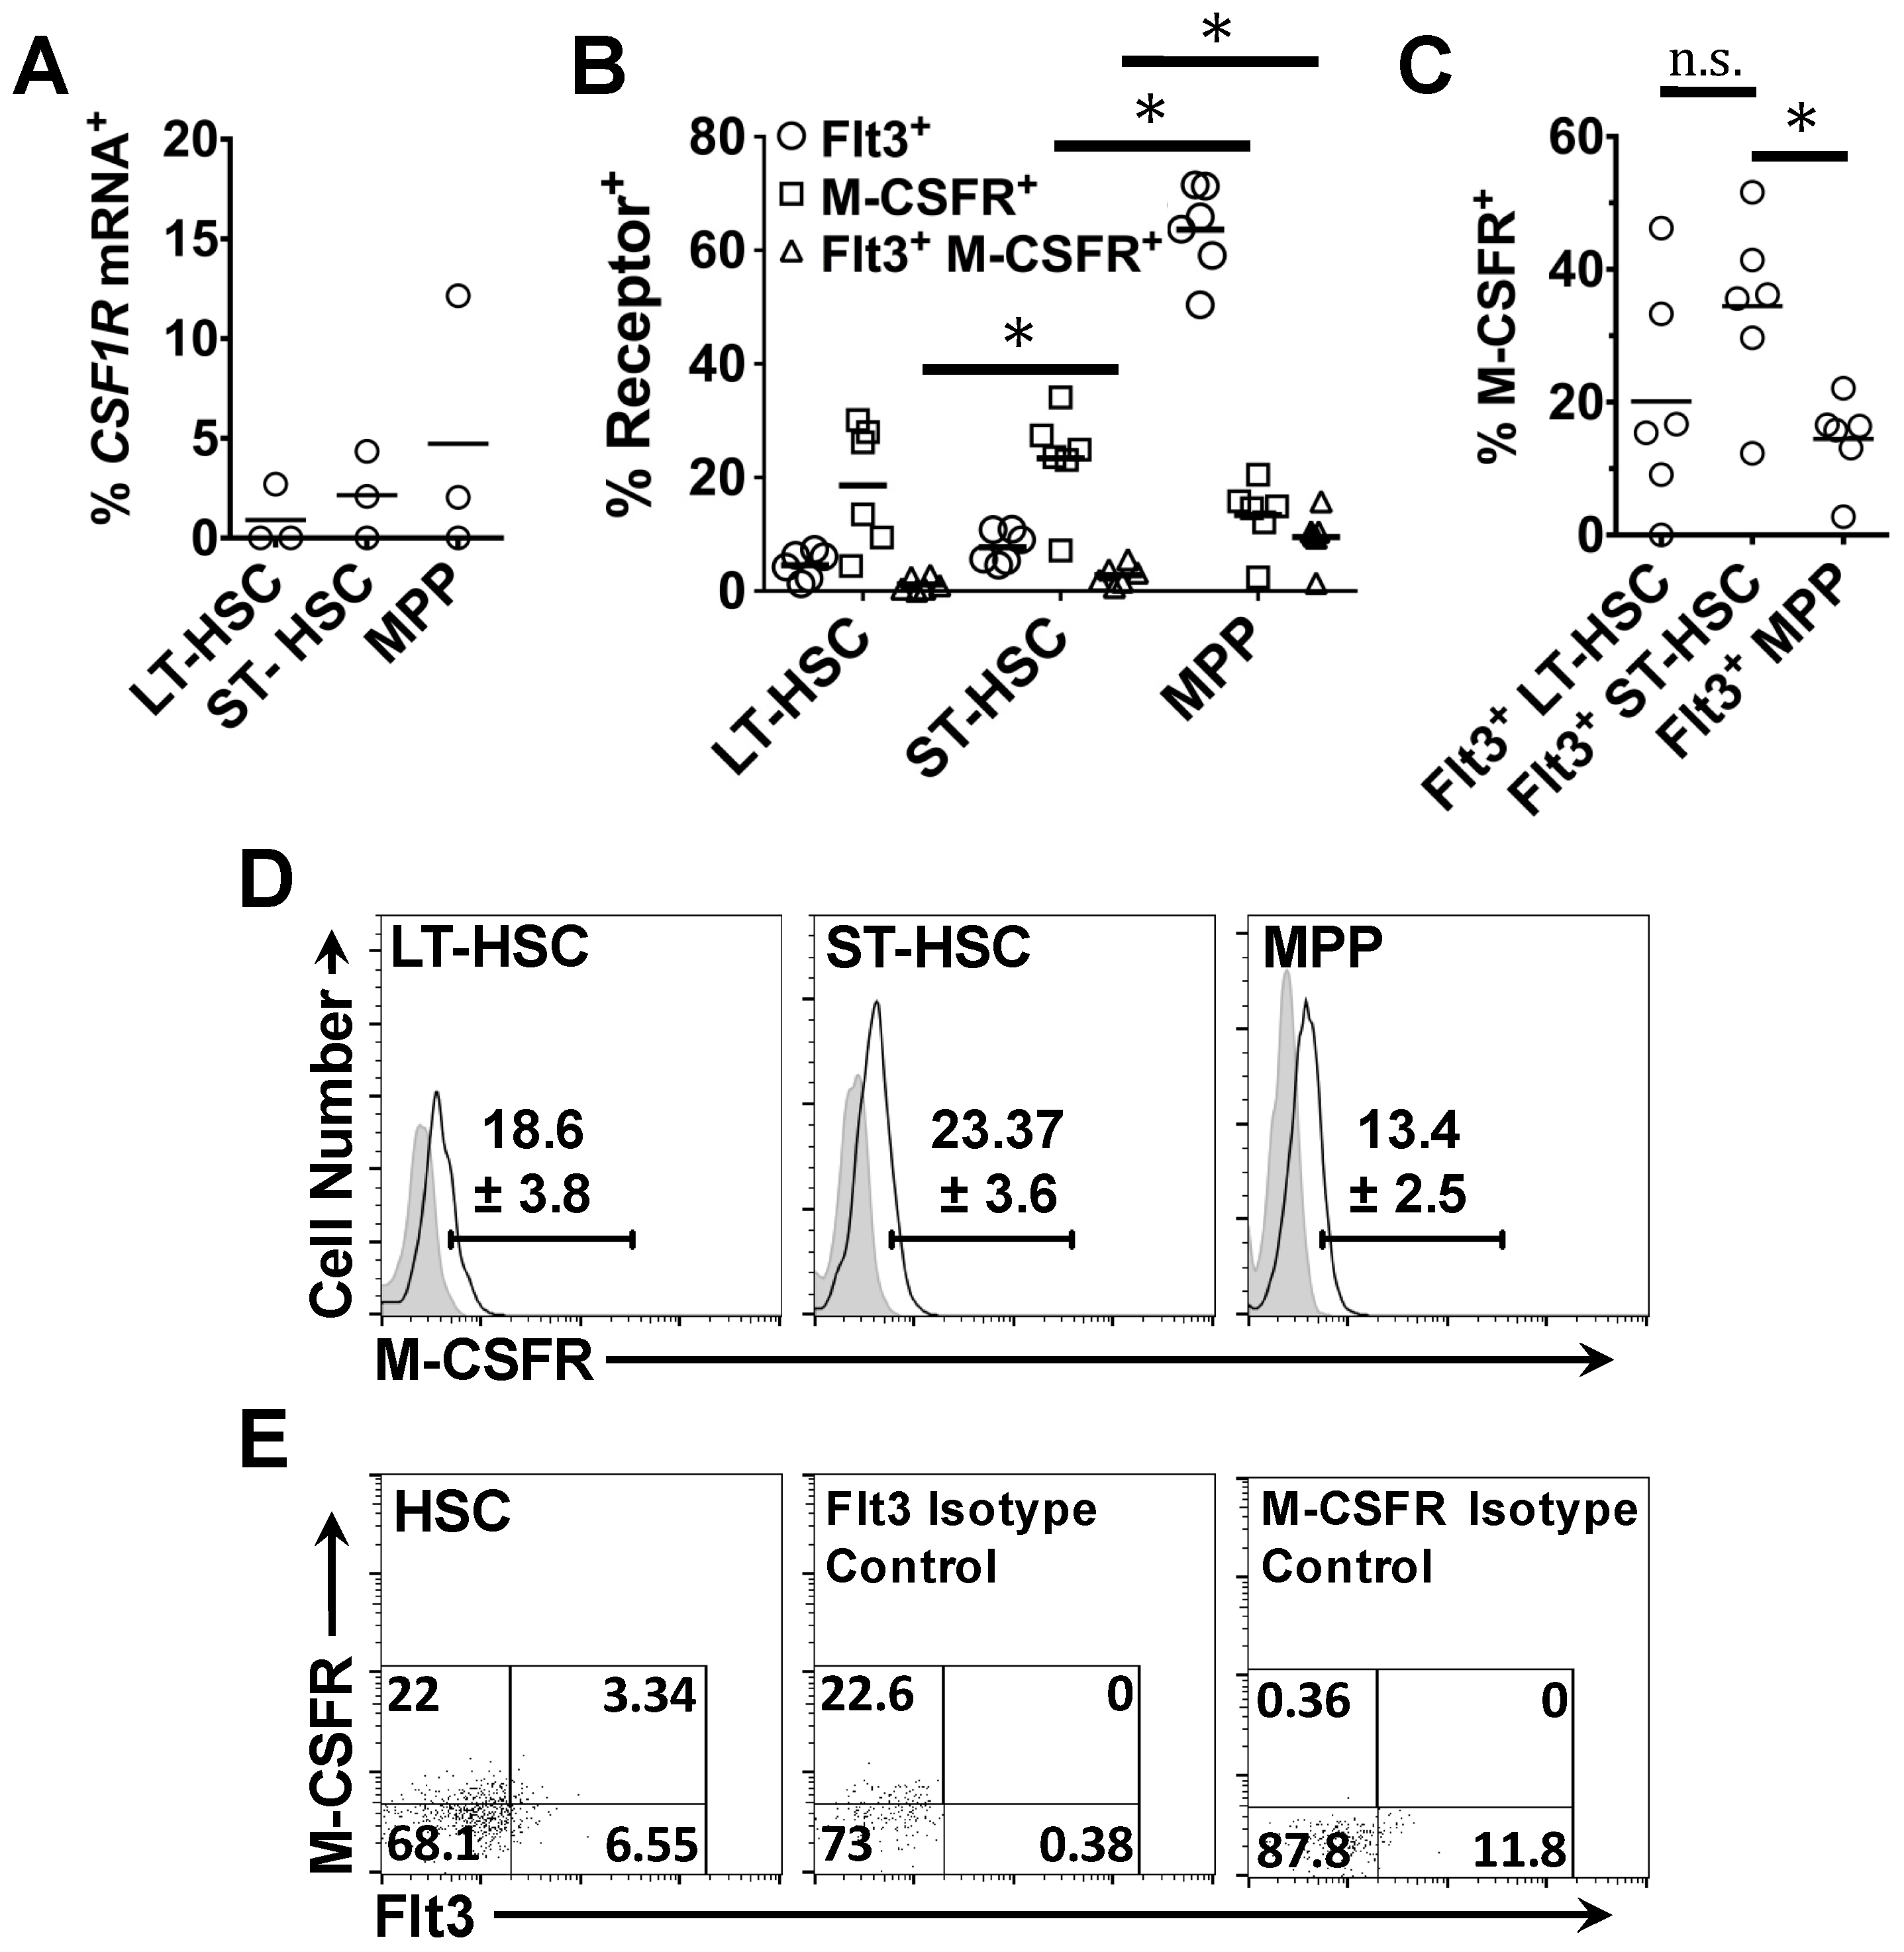
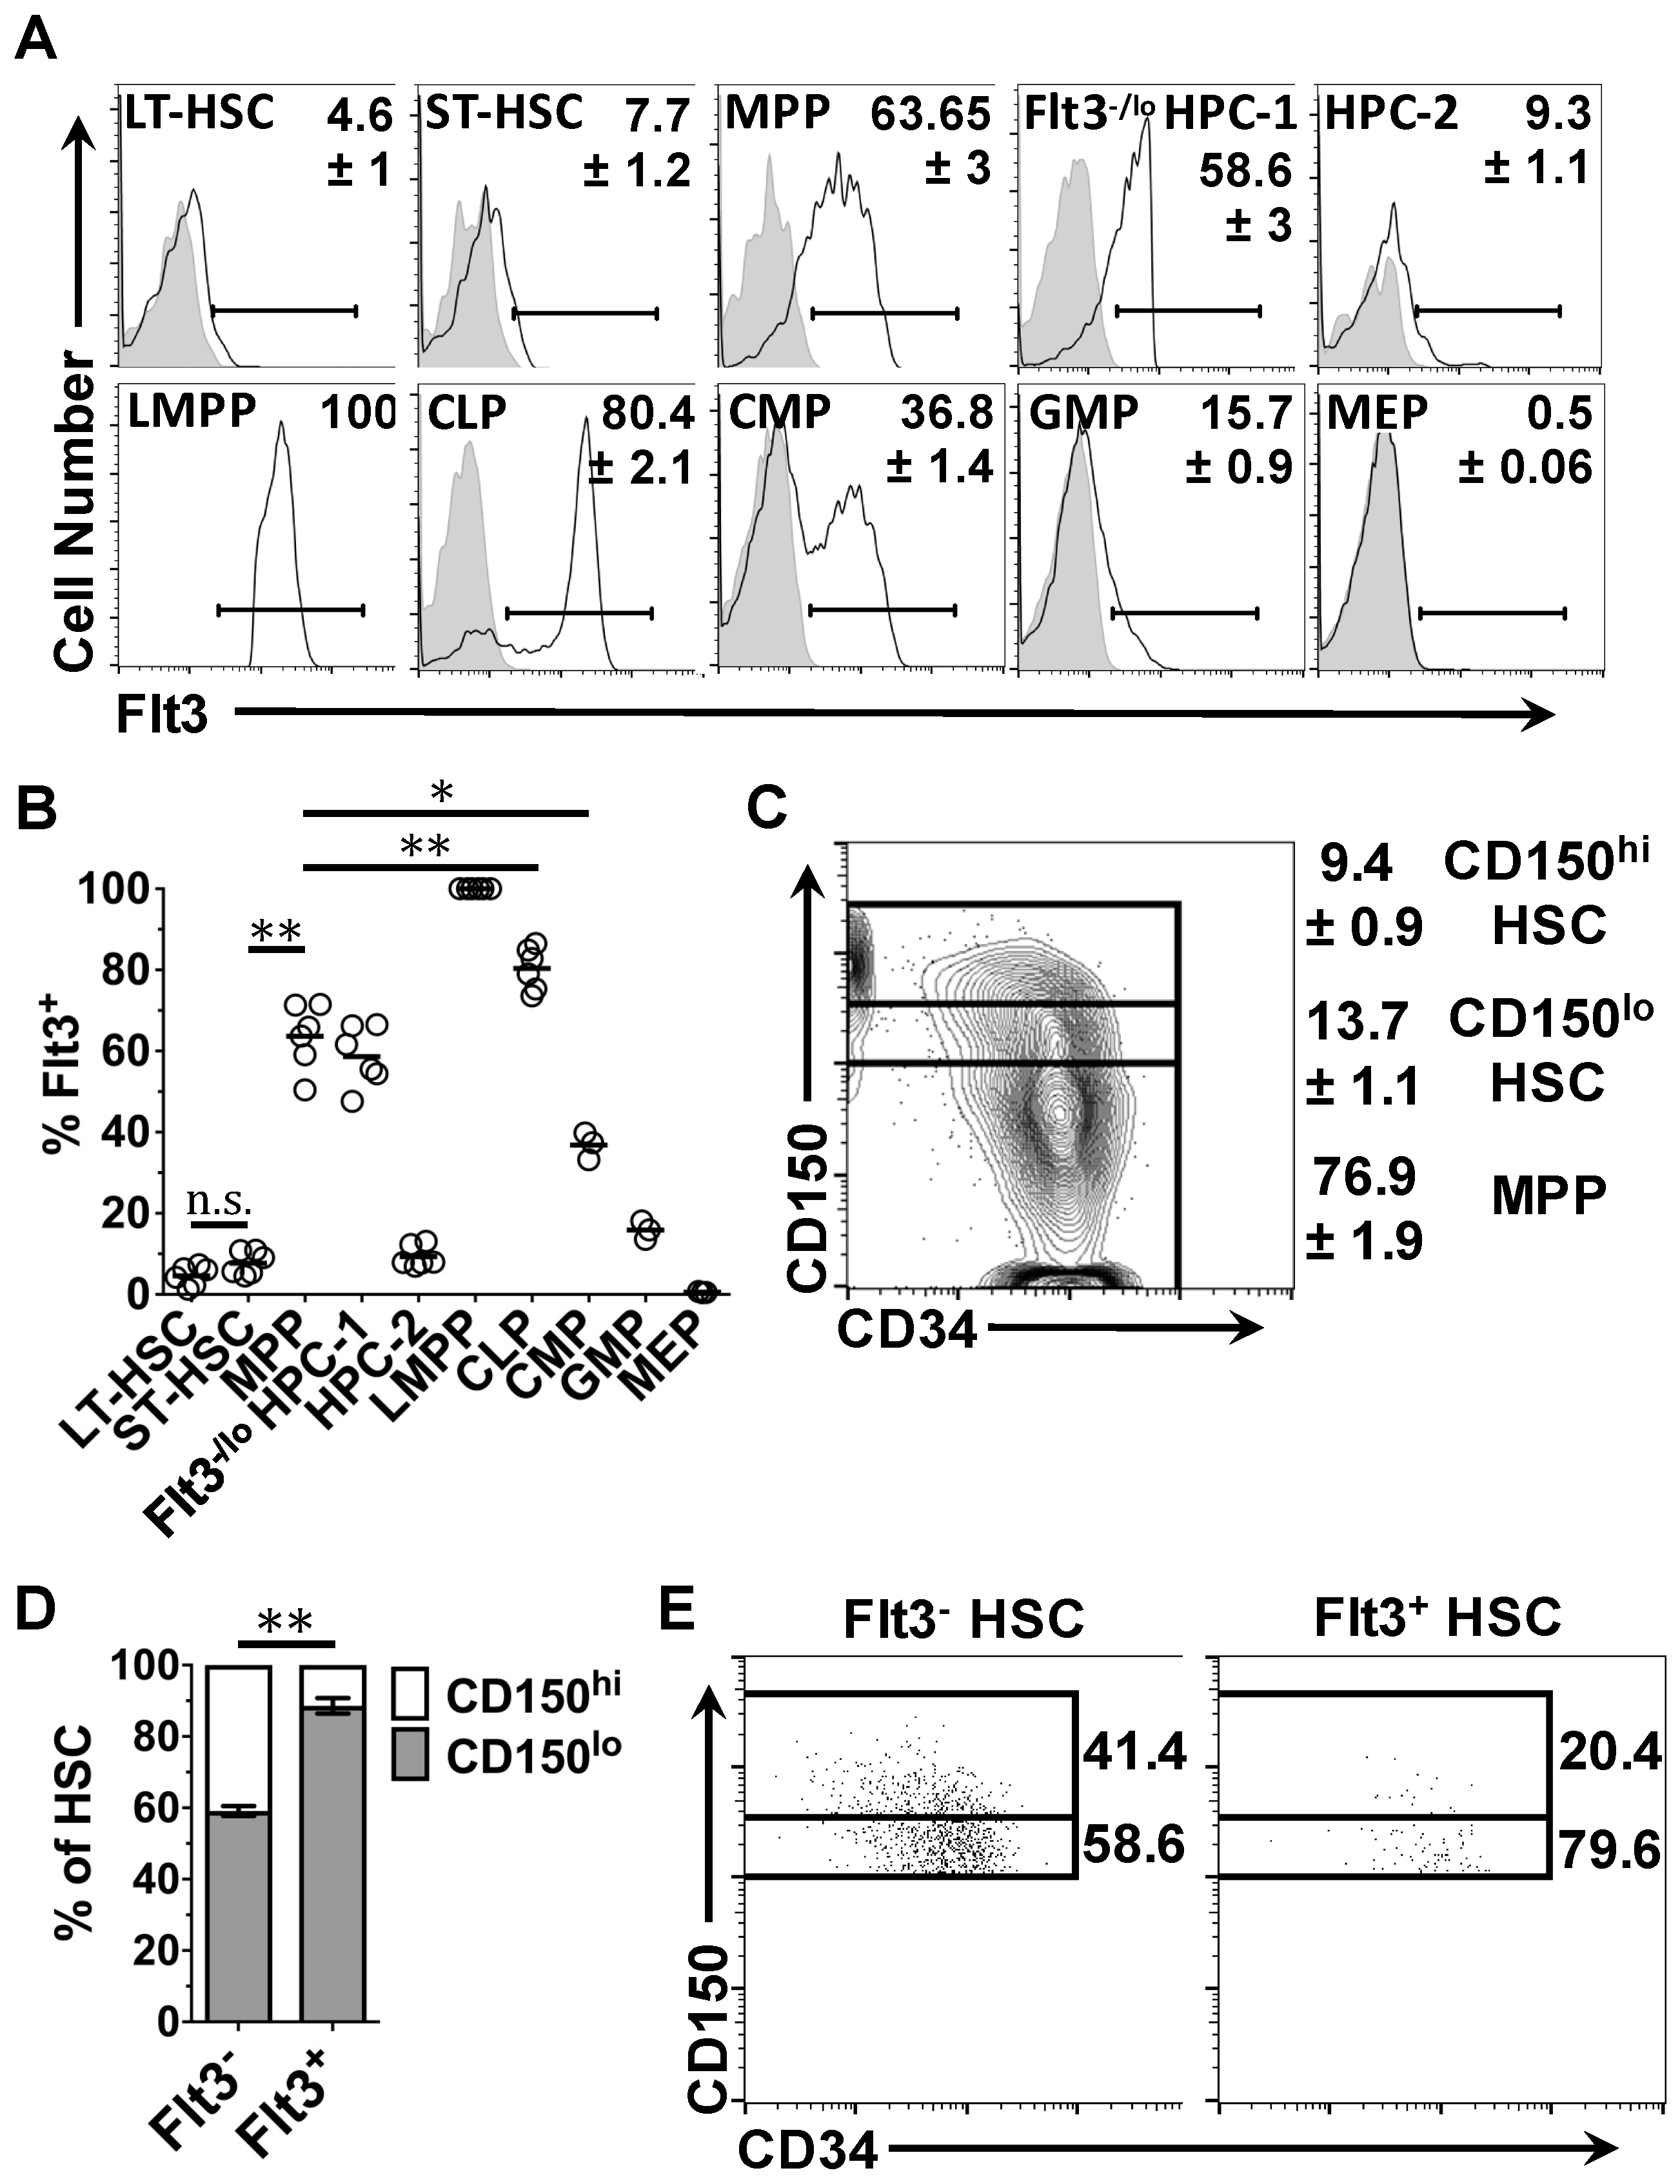
2.2. Expression of Flt3 Protein by HSPC Populations
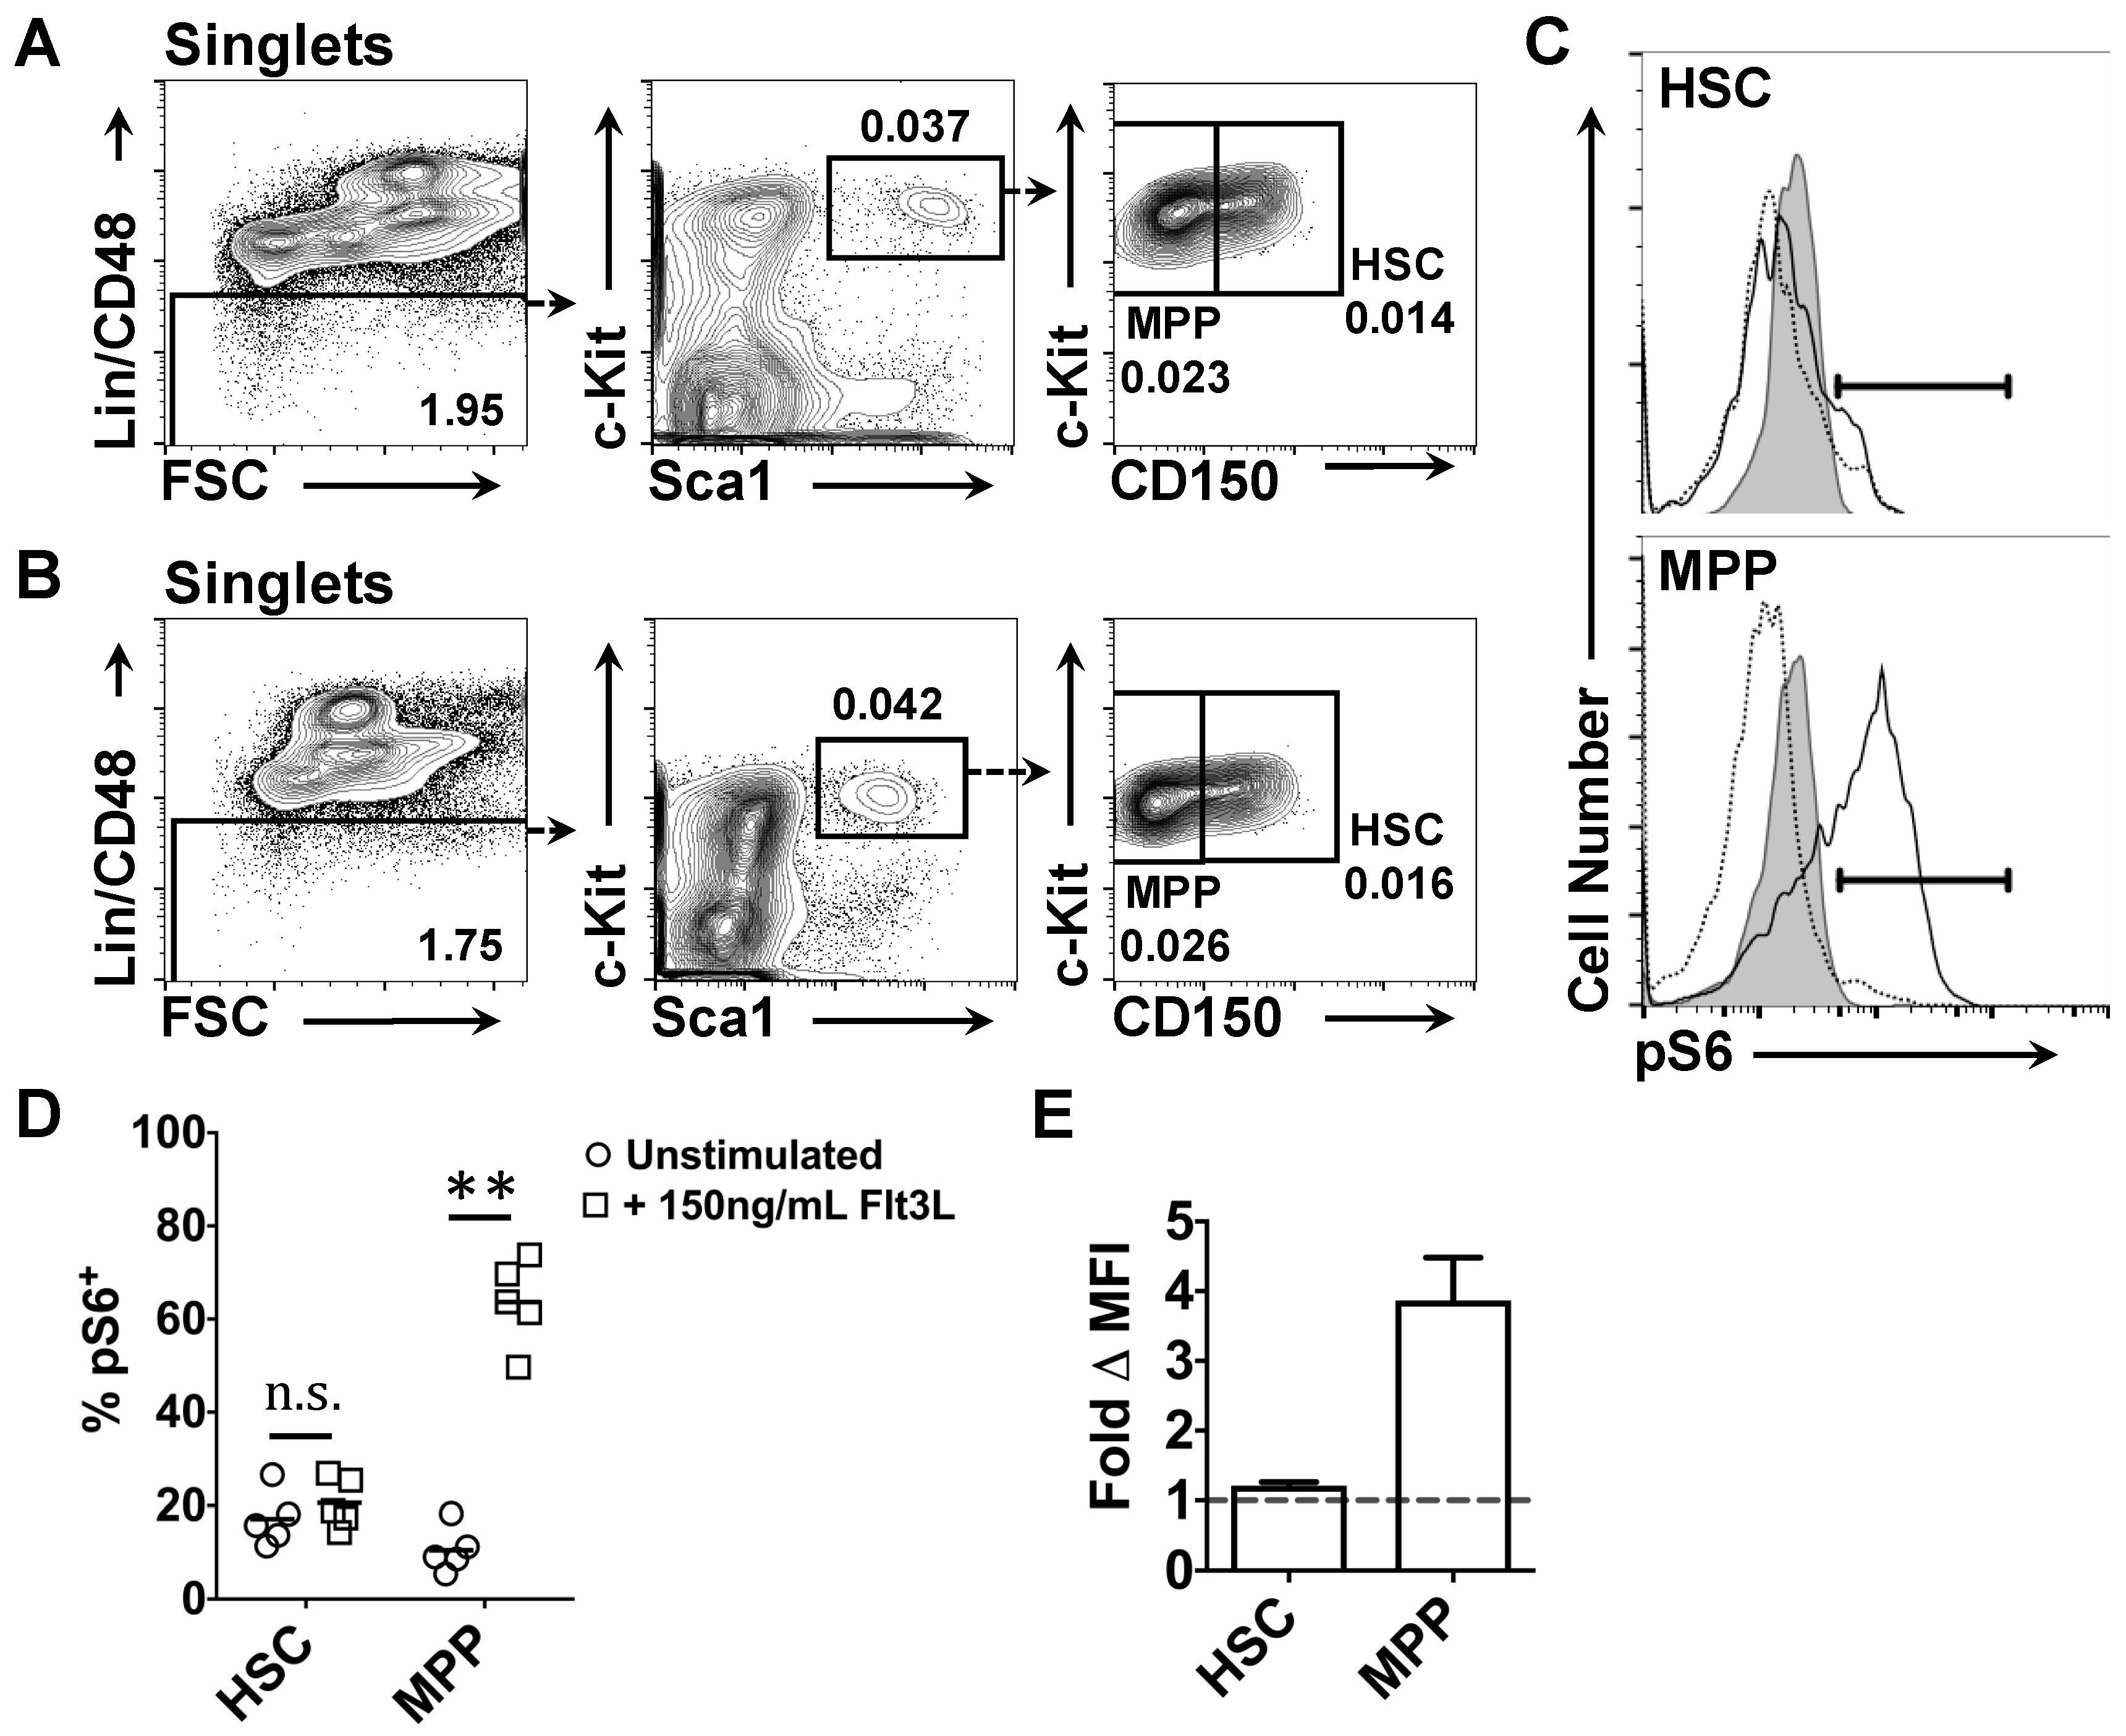
2.3. Effects of Flt3 Stimulation on the Phosphorylation of Intracellular Ribosomal Protein S6 by HSC and MPP
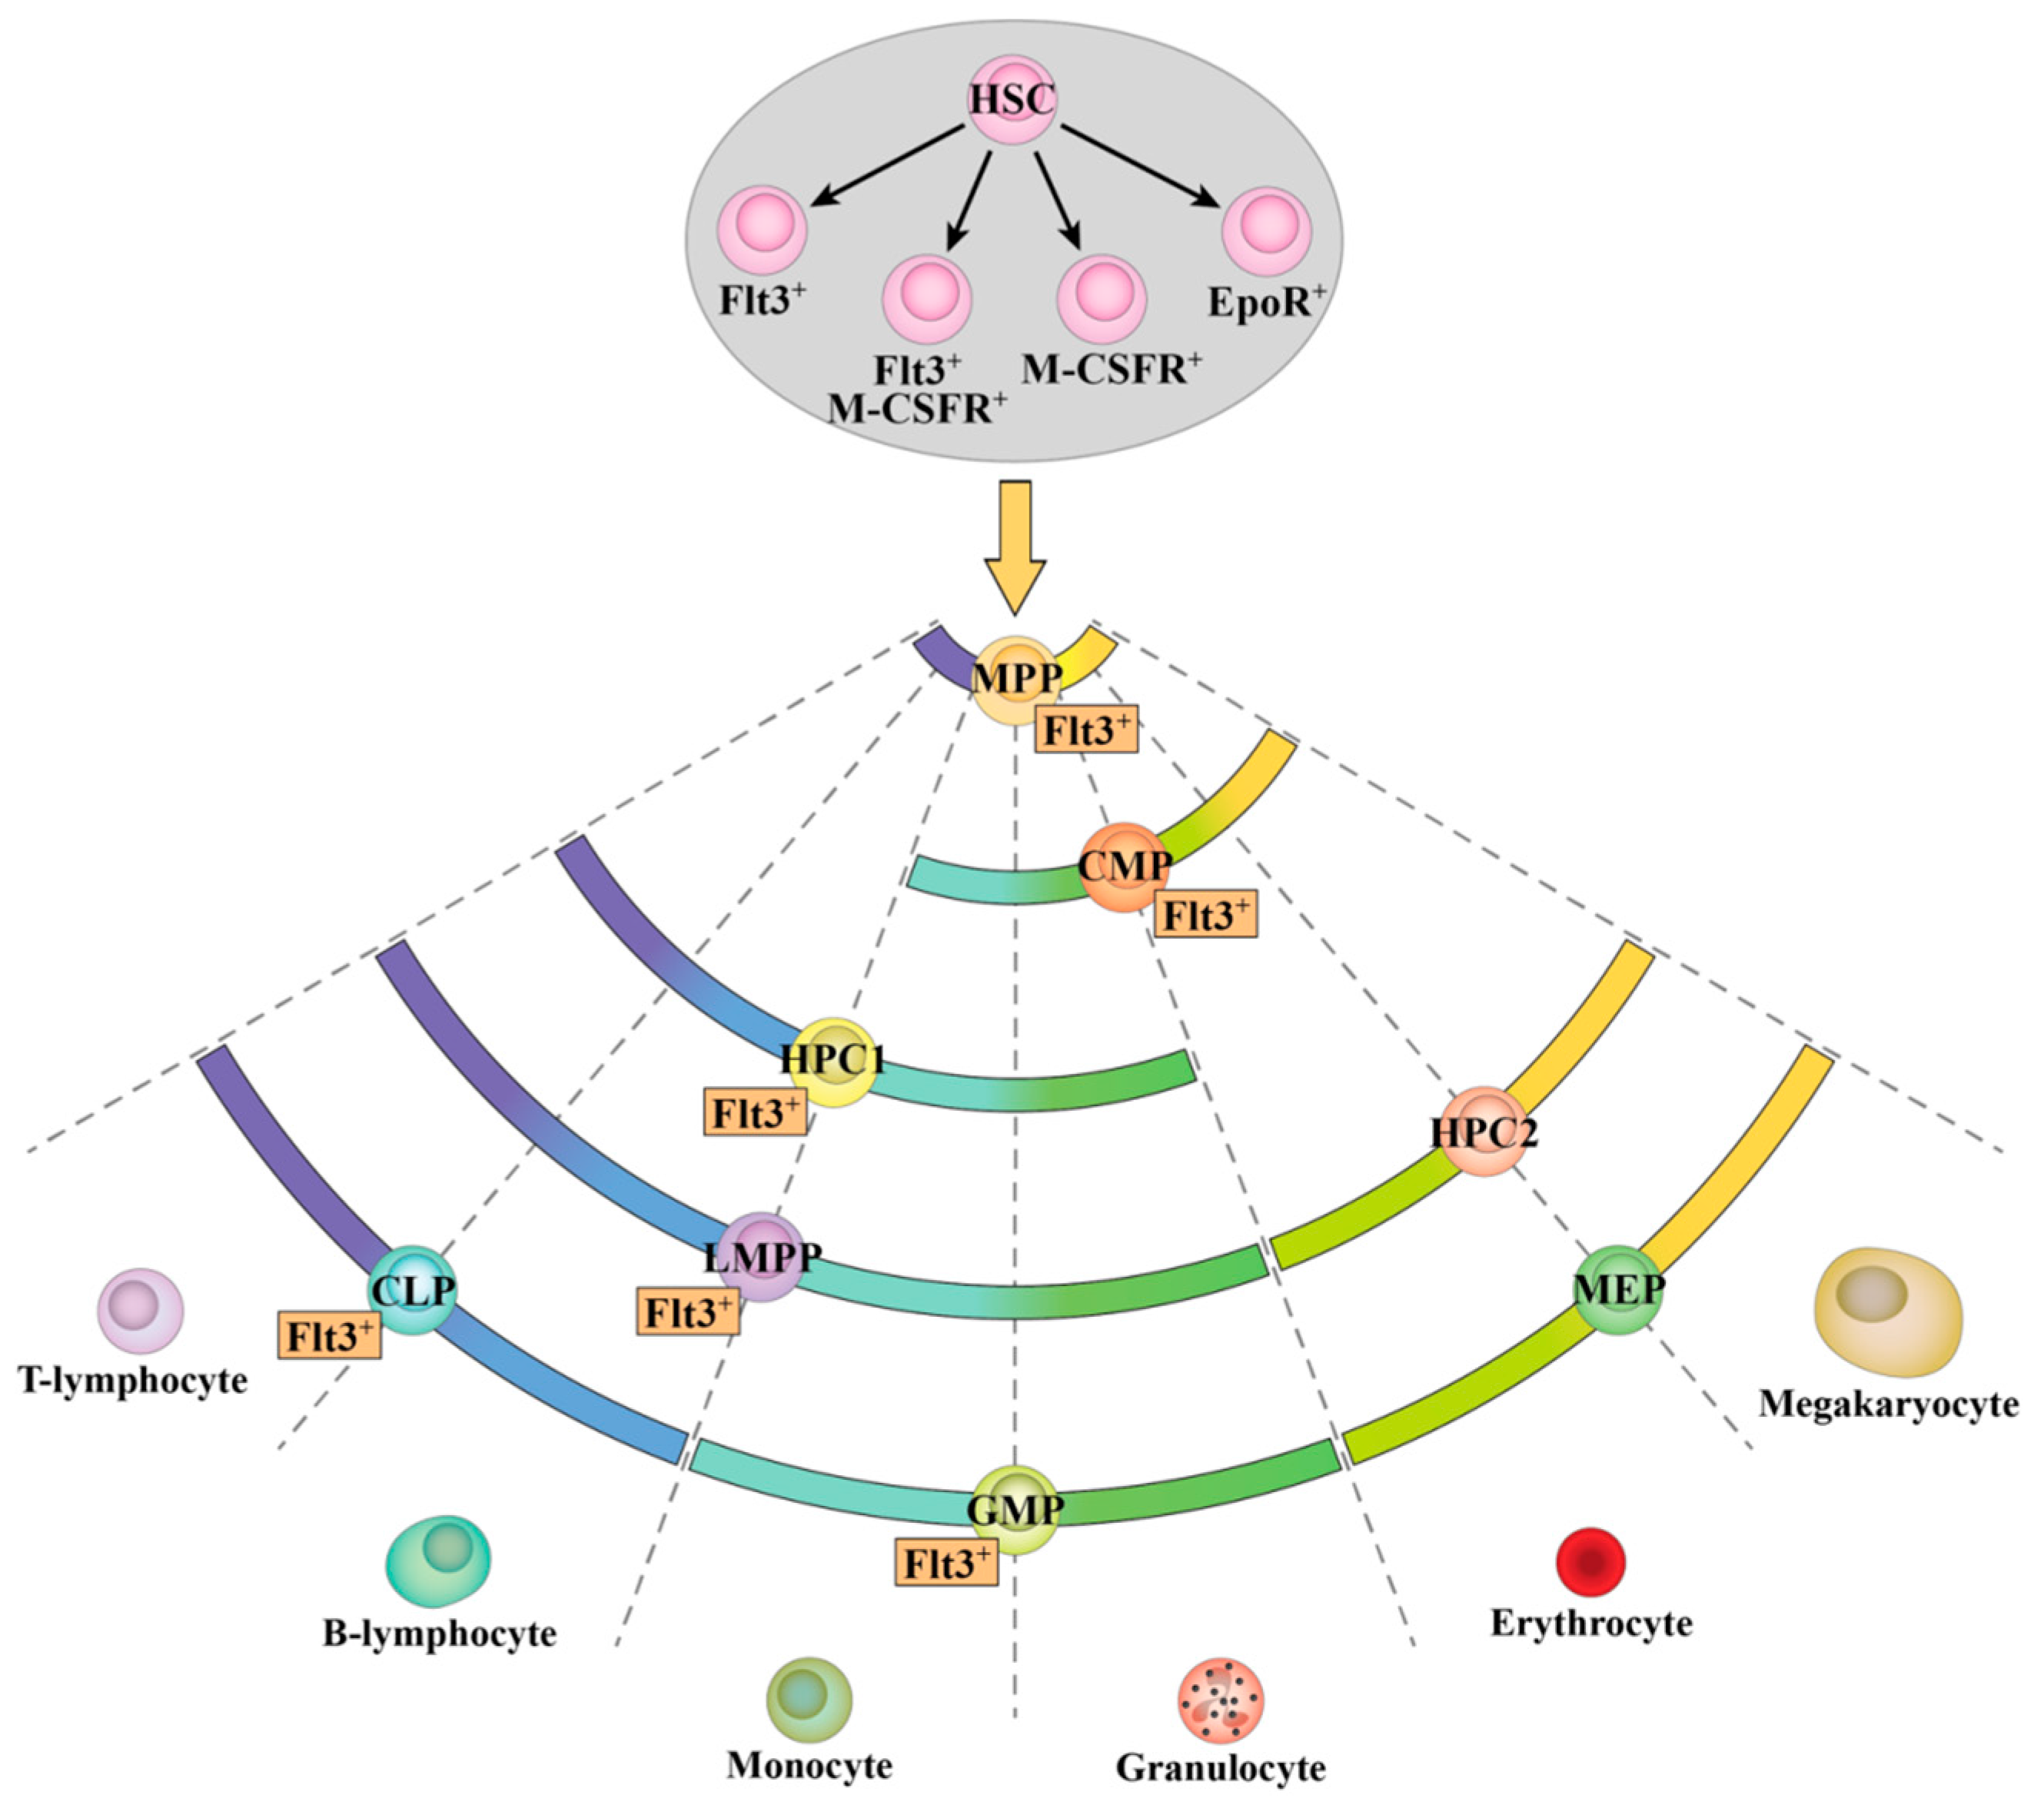
2.4. Flt3 Expression Identifies Distinct Sub-Populations of HSC and MPP
3. Discussion
4. Materials and Methods
4.1. Animals
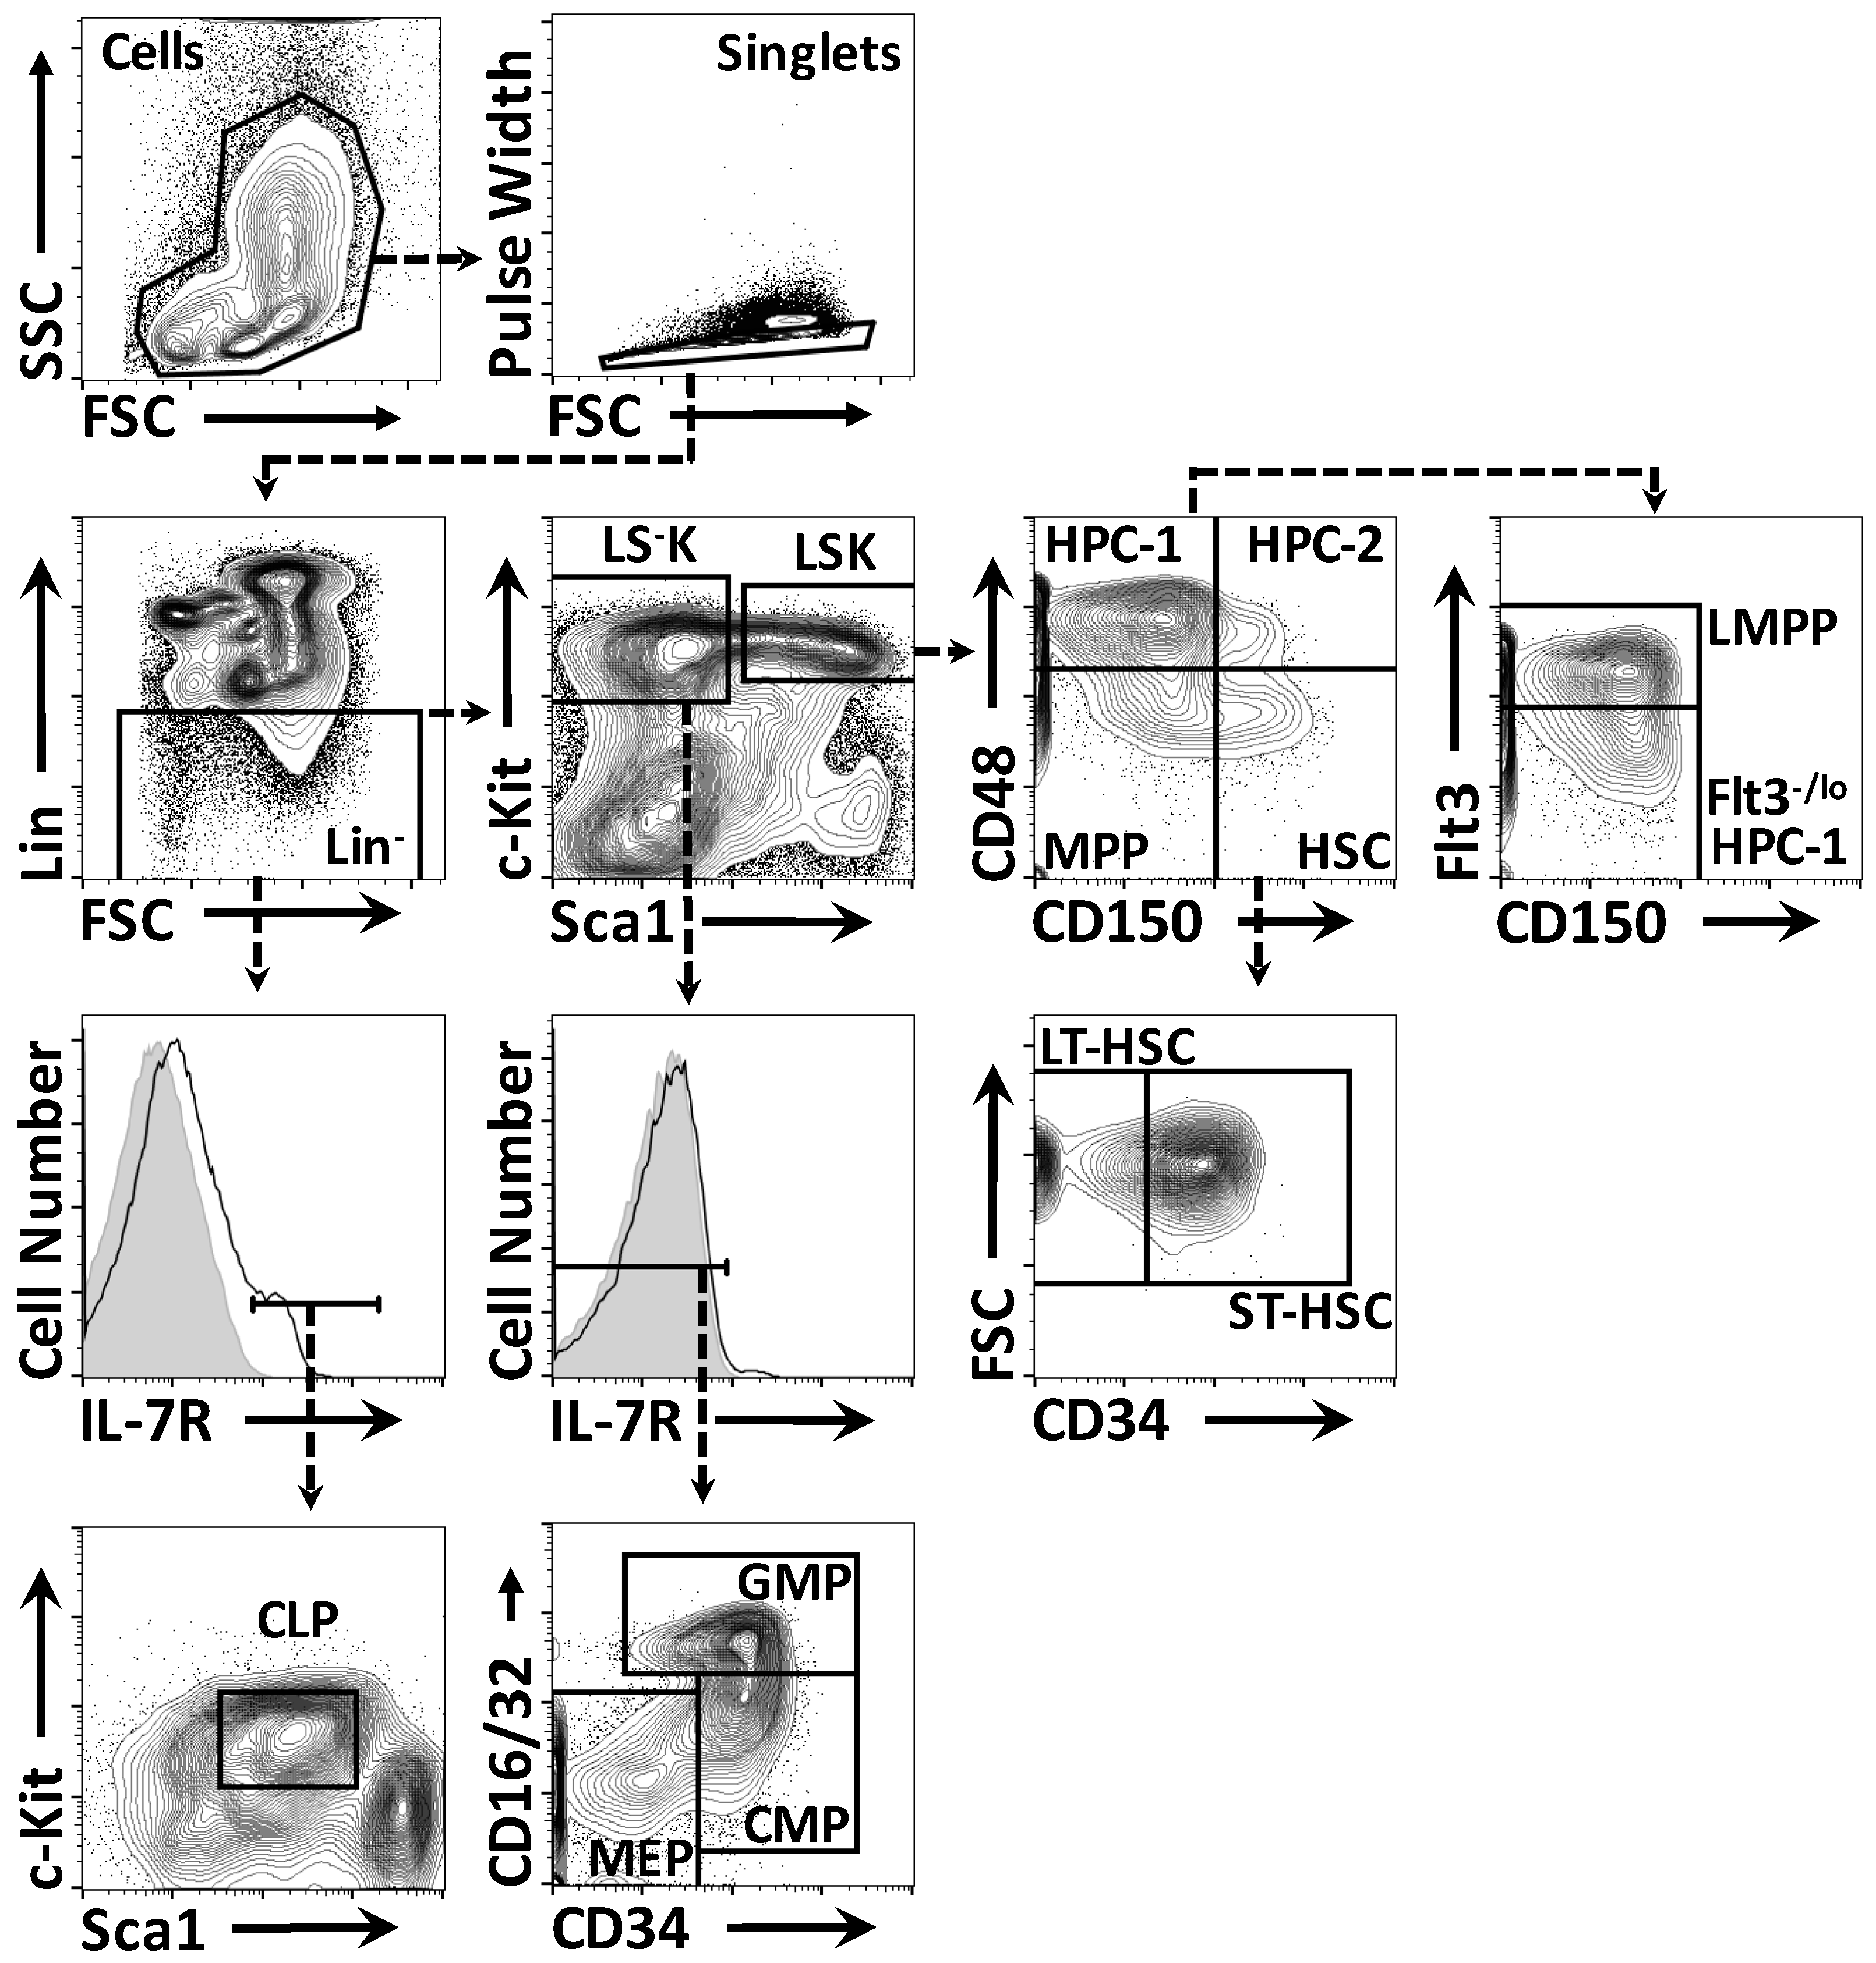
4.2. Flow Cytometry
4.3. Fluorescence Activated Cell Sorting (FACS)
4.4. Single Cell Quantitative Reverse Transcription Polymerase Chain Reaction
4.5. Phospho-Flow Analysis
5. Conclusions
Acknowledgments
Author Contributions
Conflicts of Interest
References
- Osawa, M.; Hanada, K.; Hamada, H.; Nakauchi, H. Long-term lymphohematopoietic reconstitution by a single CD34-low/negative hematopoietic stem cell. Science 1996, 273, 242–245. [Google Scholar] [CrossRef] [PubMed]
- Rosnet, O.; Marchetto, S.; deLapeyriere, O.; Birnbaum, D. Murine Flt3, a gene encoding a novel tyrosine kinase receptor of the PDGFR/CSF1R family. Oncogene 1991, 6, 1641–1650. [Google Scholar] [PubMed]
- Matthews, W.; Jordan, C.T.; Wiegand, G.W.; Pardoll, D.; Lemischka, I.R. A receptor tyrosine kinase specific to hematopoietic stem and progenitor cell-enriched populations. Cell 1991, 65, 1143–1152. [Google Scholar] [CrossRef]
- Small, D.; Levenstein, M.; Kim, E.; Carow, C.; Amin, S.; Rockwell, P.; Witte, L.; Burrow, C.; Ratajczak, M.Z.; Gewirtz, A.M. Stk-1, the human homolog of Flk-2/Flt-3, is selectively expressed in CD34+ human bone marrow cells and is involved in the proliferation of early progenitor/stem cells. Proc. Natl. Acad. Sci. USA 1994, 91, 459–463. [Google Scholar] [CrossRef] [PubMed]
- Adolfsson, J.; Borge, O.J.; Bryder, D.; Theilgaard-Mönch, K.; Astrand-Grundström, I.; Sitnicka, E.; Sasaki, Y.; Jacobsen, S.E. Upregulation of flt3 expression within the bone marrow Lin−Sca1+c-kit+ stem cell compartment is accompanied by loss of self-renewal capacity. Immunity 2001, 15, 659–669. [Google Scholar] [CrossRef]
- Christensen, J.L.; Weissman, I.L. Flk-2 is a marker in hematopoietic stem cell differentiation: A simple method to isolate long-term stem cells. Proc. Natl. Acad. Sci. USA 2001, 98, 14541–14546. [Google Scholar] [CrossRef] [PubMed]
- Yang, L.; Bryder, D.; Adolfsson, J.; Nygren, J.; Månsson, R.; Sigvardsson, M.; Jacobsen, S.E. Identification of Lin−Sca1+Kit+CD34+Flt3− short-term hematopoietic stem cells capable of rapidly reconstituting and rescuing myeloablated transplant recipients. Blood 2005, 105, 2717–2723. [Google Scholar] [CrossRef] [PubMed]
- Volpe, G.; Clarke, M.; Garcìa, P.; Walton, D.S.; Vegiopoulos, A.; Del Pozzo, W.; O’Neill, L.P.; Frampton, J.; Dumon, S. Regulation of the Flt3 gene in haematopoietic stem and early progenitor cells. PLoS ONE 2015, 10, e0138257. [Google Scholar] [CrossRef] [PubMed]
- Buza-Vidas, N.; Woll, P.; Hultquist, A.; Duarte, S.; Lutteropp, M.; Bouriez-Jones, T.; Ferry, H.; Luc, S.; Jacobsen, S.E. Flt3 expression initiates in fully multipotent mouse hematopoietic progenitor cells. Blood 2011, 118, 1544–1548. [Google Scholar] [CrossRef] [PubMed]
- Boyer, S.W.; Schroeder, A.V.; Smith-Berdan, S.; Forsberg, E.C. All hematopoietic cells develop from hematopoietic stem cells through Flk2/Flt3-positive progenitor cells. Cell Stem Cell 2011, 9, 64–73. [Google Scholar] [CrossRef] [PubMed]
- Meshinchi, S.; Appelbaum, F.R. Structural and functional alterations of Flt3 in acute myeloid leukemia. Clin. Cancer Res. 2009, 15, 4263–4269. [Google Scholar] [CrossRef] [PubMed]
- Griffith, J.; Black, J.; Faerman, C.; Swenson, L.; Wynn, M.; Lu, F.; Lippke, J.; Saxena, K. The structural basis for autoinhibition of Flt3 by the juxtamembrane domain. Mol. Cell 2004, 13, 169–178. [Google Scholar] [CrossRef]
- Zhang, S.; Mantel, C.; Broxmeyer, H.E. Flt3 signaling involves tyrosyl-phosphorylation of SHP-2 and SHIP and their association with Grb2 and Shc in Baf3/Flt3 cells. J. Leukoc. Biol. 1999, 65, 372–380. [Google Scholar] [PubMed]
- Marchetto, S.; Fournier, E.; Beslu, N.; Aurran-Schleinitz, T.; Dubreuil, P.; Borg, J.P.; Birnbaum, D.; Rosnet, O. SHC and SHIP phosphorylation and interaction in response to activation of the Flt3 receptor. Leukemia 1999, 13, 1374–1382. [Google Scholar] [CrossRef] [PubMed]
- Lavagna-Sévenier, C.; Marchetto, S.; Birnbaum, D.; Rosnet, O. Flt3 signaling in hematopoietic cells involves CBL, SHC and an unknown P115 as prominent tyrosine-phosphorylated substrates. Leukemia 1998, 12, 301–310. [Google Scholar] [CrossRef] [PubMed]
- Stirewalt, D.L.; Radich, J.P. The role of Flt3 in haematopoietic malignancies. Nat. Rev. Cancer 2003, 3, 650–665. [Google Scholar] [CrossRef] [PubMed]
- Gilliland, D.G.; Griffin, J.D. The roles of Flt3 in hematopoiesis and leukemia. Blood 2002, 100, 1532–1542. [Google Scholar] [CrossRef] [PubMed]
- Veiby, O.P.; Jacobsen, F.W.; Cui, L.; Lyman, S.D.; Jacobsen, S.E. The flt3 ligand promotes the survival of primitive hemopoietic progenitor cells with myeloid as well as B lymphoid potential. Suppression of apoptosis and counteraction by TNF-α and TGF-β. J. Immunol. 1996, 157, 2953–2960. [Google Scholar] [PubMed]
- Broxmeyer, H.E.; Lu, L.; Cooper, S.; Ruggieri, L.; Li, Z.H.; Lyman, S.D. Flt3 ligand stimulates/costimulates the growth of myeloid stem/progenitor cells. Exp. Hematol. 1995, 23, 1121–1129. [Google Scholar] [PubMed]
- von Muenchow, L.; Alberti-Servera, L.; Klein, F.; Capoferri, G.; Finke, D.; Ceredig, R.; Rolink, A.; Tsapogas, P. Permissive roles of cytokines interleukin-7 and Flt3 ligand in mouse B-cell lineage commitment. Proc. Natl. Acad. Sci. USA 2016, 113, E8122–E8130. [Google Scholar] [CrossRef] [PubMed]
- Lyman, S.D.; James, L.; Johnson, L.; Brasel, K.; de Vries, P.; Escobar, S.S.; Downey, H.; Splett, R.R.; Beckmann, M.P.; McKenna, H.J. Cloning of the human homologue of the murine Flt3 ligand: A growth factor for early hematopoietic progenitor cells. Blood 1994, 83, 2795–2801. [Google Scholar] [PubMed]
- Hannum, C.; Culpepper, J.; Campbell, D.; McClanahan, T.; Zurawski, S.; Bazan, J.F.; Kastelein, R.; Hudak, S.; Wagner, J.; Mattson, J. Ligand for Flt3/Flk2 receptor tyrosine kinase regulates growth of haematopoietic stem cells and is encoded by variant rnas. Nature 1994, 368, 643–648. [Google Scholar] [CrossRef] [PubMed]
- Brashem-Stein, C.; Flowers, D.A.; Bernstein, I.D. Regulation of colony forming cell generation by flt-3 ligand. Br. J. Haematol. 1996, 94, 17–22. [Google Scholar] [CrossRef] [PubMed]
- Banu, N.; Deng, B.; Lyman, S.D.; Avraham, H. Modulation of haematopoietic progenitor development by Flt-3 ligand. Cytokine 1999, 11, 679–688. [Google Scholar] [CrossRef] [PubMed]
- Hudak, S.; Hunte, B.; Culpepper, J.; Menon, S.; Hannum, C.; Thompson-Snipes, L.; Rennick, D. Flt3/Flk2 ligand promotes the growth of murine stem cells and the expansion of colony-forming cells and spleen colony-forming units. Blood 1995, 85, 2747–2755. [Google Scholar] [PubMed]
- Gabbianelli, M.; Pelosi, E.; Montesoro, E.; Valtieri, M.; Luchetti, L.; Samoggia, P.; Vitelli, L.; Barberi, T.; Testa, U.; Lyman, S. Multi-level effects of Flt3 ligand on human hematopoiesis: Expansion of putative stem cells and proliferation of granulomonocytic progenitors/monocytic precursors. Blood 1995, 86, 1661–1670. [Google Scholar] [PubMed]
- Jacobsen, S.E.; Okkenhaug, C.; Myklebust, J.; Veiby, O.P.; Lyman, S.D. The Flt3 ligand potently and directly stimulates the growth and expansion of primitive murine bone marrow progenitor cells in vitro: Synergistic interactions with interleukin (IL) 11, IL-12, and other hematopoietic growth factors. J. Exp. Med. 1995, 181, 1357–1363. [Google Scholar] [CrossRef] [PubMed]
- McKenna, H.J.; de Vries, P.; Brasel, K.; Lyman, S.D.; Williams, D.E. Effect of Flt3 ligand on the ex vivo expansion of human CD34+ hematopoietic progenitor cells. Blood 1995, 86, 3413–3420. [Google Scholar] [PubMed]
- Hirayama, F.; Lyman, S.D.; Clark, S.C.; Ogawa, M. The Flt3 ligand supports proliferation of lymphohematopoietic progenitors and early B-lymphoid progenitors. Blood 1995, 85, 1762–1768. [Google Scholar] [PubMed]
- Åhsberg, J.; Tsapogas, P.; Qian, H.; Zetterblad, J.; Zandi, S.; Månsson, R.; Jönsson, J.I.; Sigvardsson, M. Interleukin-7-induced Stat-5 acts in synergy with Flt-3 signaling to stimulate expansion of hematopoietic progenitor cells. J. Biol. Chem. 2010, 285, 36275–36284. [Google Scholar] [CrossRef] [PubMed]
- Turner, A.M.; Lin, N.L.; Issarachai, S.; Lyman, S.D.; Broudy, V.C. Flt3 receptor expression on the surface of normal and malignant human hematopoietic cells. Blood 1996, 88, 3383–3390. [Google Scholar] [PubMed]
- Ratajczak, M.Z.; Ratajczak, J.; Ford, J.; Kregenow, R.; Marlicz, W.; Gewirtz, A.M. Flt3/Flk-2 (Stk-1) ligand does not stimulate human megakaryopoiesis in vitro. Stem Cells 1996, 14, 146–150. [Google Scholar] [CrossRef] [PubMed]
- McKenna, H.J.; Stocking, K.L.; Miller, R.E.; Brasel, K.; de Smedt, T.; Maraskovsky, E.; Maliszewski, C.R.; Lynch, D.H.; Smith, J.; Pulendran, B.; et al. Mice lacking Flt3 ligand have deficient hematopoiesis affecting hematopoietic progenitor cells, dendritic cells, and natural killer cells. Blood 2000, 95, 3489–3497. [Google Scholar] [PubMed]
- Baerenwaldt, A.; von Burg, N.; Kreuzaler, M.; Sitte, S.; Horvath, E.; Peter, A.; Voehringer, D.; Rolink, A.G.; Finke, D. Flt3 ligand regulates the development of innate lymphoid cells in fetal and adult mice. J. Immunol. 2016, 196, 2561–2571. [Google Scholar] [CrossRef] [PubMed]
- Brasel, K.; McKenna, H.J.; Morrissey, P.J.; Charrier, K.; Morris, A.E.; Lee, C.C.; Williams, D.E.; Lyman, S.D. Hematologic effects of Flt3 ligand in vivo in mice. Blood 1996, 88, 2004–2012. [Google Scholar] [PubMed]
- Balciunaite, G.; Ceredig, R.; Massa, S.; Rolink, A.G. A B220+ CD117+ CD19− hematopoietic progenitor with potent lymphoid and myeloid developmental potential. Eur. J. Immunol. 2005, 35, 2019–2030. [Google Scholar] [CrossRef] [PubMed]
- Ceredig, R.; Rauch, M.; Balciunaite, G.; Rolink, A.G. Increasing Flt3L availability alters composition of a novel bone marrow lymphoid progenitor compartment. Blood 2006, 108, 1216–1222. [Google Scholar] [CrossRef] [PubMed]
- Tsapogas, P.; Swee, L.K.; Nusser, A.; Nuber, N.; Kreuzaler, M.; Capoferri, G.; Rolink, H.; Ceredig, R.; Rolink, A. In vivo evidence for an instructive role of fms-like tyrosine kinase-3 (Flt3) ligand in hematopoietic development. Haematologica 2014, 99, 638–646. [Google Scholar] [CrossRef] [PubMed]
- Carow, C.E.; Levenstein, M.; Kaufmann, S.H.; Chen, J.; Amin, S.; Rockwell, P.; Witte, L.; Borowitz, M.J.; Civin, C.I.; Small, D. Expression of the hematopoietic growth factor receptor Flt3 (STK-1/Flk2) in human leukemias. Blood 1996, 87, 1089–1096. [Google Scholar] [PubMed]
- Rosnet, O.; Bühring, H.J.; Marchetto, S.; Rappold, I.; Lavagna, C.; Sainty, D.; Arnoulet, C.; Chabannon, C.; Kanz, L.; Hannum, C.; et al. Human Flt3/Flk2 receptor tyrosine kinase is expressed at the surface of normal and malignant hematopoietic cells. Leukemia 1996, 10, 238–248. [Google Scholar] [PubMed]
- Piacibello, W.; Fubini, L.; Sanavio, F.; Brizzi, M.F.; Severino, A.; Garetto, L.; Stacchini, A.; Pegoraro, L.; Aglietta, M. Effects of human Flt3 ligand on myeloid leukemia cell growth: Heterogeneity in response and synergy with other hematopoietic growth factors. Blood 1995, 86, 4105–4114. [Google Scholar] [PubMed]
- Nakao, M.; Yokota, S.; Iwai, T.; Kaneko, H.; Horiike, S.; Kashima, K.; Sonoda, Y.; Fujimoto, T.; Misawa, S. Internal tandem duplication of the Flt3 gene found in acute myeloid leukemia. Leukemia 1996, 10, 1911–1918. [Google Scholar] [PubMed]
- Kuchenbauer, F.; Kern, W.; Schoch, C.; Kohlmann, A.; Hiddemann, W.; Haferlach, T.; Schnittger, S. Detailed analysis of Flt3 expression levels in acute myeloid leukemia. Haematologica 2005, 90, 1617–1625. [Google Scholar] [PubMed]
- Khaled, S.; Al Malki, M.; Marcucci, G. Acute myeloid leukemia: Biologic, prognostic, and therapeutic insights. Oncology 2016, 30, 318–329. [Google Scholar] [PubMed]
- Horiike, S.; Yokota, S.; Nakao, M.; Iwai, T.; Sasai, Y.; Kaneko, H.; Taniwaki, M.; Kashima, K.; Fujii, H.; Abe, T.; et al. Tandem duplications of the Flt3 receptor gene are associated with leukemic transformation of myelodysplasia. Leukemia 1997, 11, 1442–1446. [Google Scholar] [CrossRef] [PubMed]
- Yamamoto, Y.; Kiyoi, H.; Nakano, Y.; Suzuki, R.; Kodera, Y.; Miyawaki, S.; Asou, N.; Kuriyama, K.; Yagasaki, F.; Shimazaki, C.; et al. Activating mutation of d835 within the activation loop of Flt3 in human hematologic malignancies. Blood 2001, 97, 2434–2439. [Google Scholar] [CrossRef] [PubMed]
- Yokota, S.; Kiyoi, H.; Nakao, M.; Iwai, T.; Misawa, S.; Okuda, T.; Sonoda, Y.; Abe, T.; Kahsima, K.; Matsuo, Y.; et al. Internal tandem duplication of the Flt3 gene is preferentially seen in acute myeloid leukemia and myelodysplastic syndrome among various hematological malignancies. A study on a large series of patients and cell lines. Leukemia 1997, 11, 1605–1609. [Google Scholar] [CrossRef] [PubMed]
- Marcucci, G.; Maharry, K.; Whitman, S.P.; Vukosavljevic, T.; Paschka, P.; Langer, C.; Mrózek, K.; Baldus, C.D.; Carroll, A.J.; Powell, B.L.; et al. High expression levels of the ETS-related gene, ERG, predict adverse outcome and improve molecular risk-based classification of cytogenetically normal acute myeloid leukemia: A cancer and leukemia group B study. J. Clin. Oncol. 2007, 25, 3337–3343. [Google Scholar] [CrossRef] [PubMed]
- Fröhling, S.; Schlenk, R.F.; Breitruck, J.; Benner, A.; Kreitmeier, S.; Tobis, K.; Döhner, H.; Döhner, K. Prognostic significance of activating Flt3 mutations in younger adults (16 to 60 years) with acute myeloid leukemia and normal cytogenetics: A study of the AML study group ulm. Blood 2002, 100, 4372–4380. [Google Scholar] [CrossRef] [PubMed]
- Kottaridis, P.D.; Gale, R.E.; Frew, M.E.; Harrison, G.; Langabeer, S.E.; Belton, A.A.; Walker, H.; Wheatley, K.; Bowen, D.T.; Burnett, A.K.; et al. The presence of a Flt3 internal tandem duplication in patients with acute myeloid leukemia (AML) adds important prognostic information to cytogenetic risk group and response to the first cycle of chemotherapy: Analysis of 854 patients from the united kingdom medical research council AML 10 and 12 trials. Blood 2001, 98, 1752–1759. [Google Scholar] [PubMed]
- Thiede, C.; Steudel, C.; Mohr, B.; Schaich, M.; Schäkel, U.; Platzbecker, U.; Wermke, M.; Bornhäuser, M.; Ritter, M.; Neubauer, A.; et al. Analysis of FLT3-activating mutations in 979 patients with acute myelogenous leukemia: Association with fab subtypes and identification of subgroups with poor prognosis. Blood 2002, 99, 4326–4335. [Google Scholar] [CrossRef] [PubMed]
- Abu-Duhier, F.M.; Goodeve, A.C.; Wilson, G.A.; Care, R.S.; Peake, I.R.; Reilly, J.T. Identification of novel Flt-3 Asp835 mutations in adult acute myeloid leukaemia. Br. J. Haematol. 2001, 113, 983–988. [Google Scholar] [CrossRef] [PubMed]
- De Kouchkovsky, I.; Abdul-Hay, M. Acute myeloid leukemia: A comprehensive review and 2016 update. Blood Cancer J. 2016, 6, e441. [Google Scholar] [CrossRef] [PubMed]
- Kiel, M.J.; Yilmaz, O.H.; Iwashita, T.; Terhorst, C.; Morrison, S.J. Slam family receptors distinguish hematopoietic stem and progenitor cells and reveal endothelial niches for stem cells. Cell 2005, 121, 1109–1121. [Google Scholar] [CrossRef] [PubMed]
- Oguro, H.; Ding, L.; Morrison, S.J. Slam family markers resolve functionally distinct subpopulations of hematopoietic stem cells and multipotent progenitors. Cell Stem Cell 2013, 13, 102–116. [Google Scholar] [CrossRef] [PubMed]
- Adolfsson, J.; Månsson, R.; Buza-Vidas, N.; Hultquist, A.; Liuba, K.; Jensen, C.T.; Bryder, D.; Yang, L.; Borge, O.J.; Thoren, L.A.; et al. Identification of Flt3+ lympho-myeloid stem cells lacking erythro-megakaryocytic potential a revised road map for adult blood lineage commitment. Cell 2005, 121, 295–306. [Google Scholar] [CrossRef] [PubMed]
- Akashi, K.; Traver, D.; Miyamoto, T.; Weissman, I.L. A clonogenic common myeloid progenitor that gives rise to all myeloid lineages. Nature 2000, 404, 193–197. [Google Scholar] [CrossRef] [PubMed]
- Kondo, M.; Weissman, I.L.; Akashi, K. Identification of clonogenic common lymphoid progenitors in mouse bone marrow. Cell 1997, 91, 661–672. [Google Scholar] [CrossRef]
- Beerman, I.; Bhattacharya, D.; Zandi, S.; Sigvardsson, M.; Weissman, I.L.; Bryder, D.; Rossi, D.J. Functionally distinct hematopoietic stem cells modulate hematopoietic lineage potential during aging by a mechanism of clonal expansion. Proc. Natl. Acad. Sci. USA 2010, 107, 5465–5470. [Google Scholar] [CrossRef] [PubMed]
- Morita, Y.; Ema, H.; Nakauchi, H. Heterogeneity and hierarchy within the most primitive hematopoietic stem cell compartment. J. Exp. Med. 2010, 207, 1173–1182. [Google Scholar] [CrossRef] [PubMed]
- Roux, P.P.; Shahbazian, D.; Vu, H.; Holz, M.K.; Cohen, M.S.; Taunton, J.; Sonenberg, N.; Blenis, J. RAS/ERK signaling promotes site-specific ribosomal protein S6 phosphorylation via RSK and stimulates cap-dependent translation. J. Biol. Chem. 2007, 282, 14056–14064. [Google Scholar] [CrossRef] [PubMed]
- Fingar, D.C.; Salama, S.; Tsou, C.; Harlow, E.; Blenis, J. Mammalian cell size is controlled by mtor and its downstream targets s6k1 and 4ebp1/eif4e. Genes Dev. 2002, 16, 1472–1487. [Google Scholar] [CrossRef] [PubMed]
- Kalaitzidis, D.; Neel, B.G. Flow-cytometric phosphoprotein analysis reveals agonist and temporal differences in responses of murine hematopoietic stem/progenitor cells. PLoS ONE 2008, 3, e3776. [Google Scholar] [CrossRef] [PubMed]
- Iacobucci, I.; Li, Y.; Roberts, K.G.; Dobson, S.M.; Kim, J.C.; Payne-Turner, D.; Harvey, R.C.; Valentine, M.; McCastlain, K.; Easton, J.; et al. Truncating erythropoietin receptor rearrangements in acute lymphoblastic leukemia. Cancer Cell 2016, 29, 186–200. [Google Scholar] [CrossRef] [PubMed]
- Specchia, G.; Liso, V.; Capalbo, S.; Fazioli, F.; Bettoni, S.; Bassan, R.; Viero, P.; Barbui, T.; Rambaldi, A. Constitutive expression of IL-1β, M-CSF and c-fms during the myeloid blastic phase of chronic myelogenous leukaemia. Br. J. Haematol. 1992, 80, 310–316. [Google Scholar] [CrossRef] [PubMed]
- Aikawa, Y.; Katsumoto, T.; Zhang, P.; Shima, H.; Shino, M.; Terui, K.; Ito, E.; Ohno, H.; Stanley, E.R.; Singh, H.; et al. 1-mediated upregulation of CSF1R is crucial for leukemia stem cell potential induced by MOZ-TIF2. Nat. Med. 2010, 16, 580–585. [Google Scholar] [CrossRef] [PubMed]
- Grover, A.; Mancini, E.; Moore, S.; Mead, A.J.; Atkinson, D.; Rasmussen, K.D.; O’Carroll, D.; Jacobsen, S.E.; Nerlov, C. Erythropoietin guides multipotent hematopoietic progenitor cells toward an erythroid fate. J. Exp. Med. 2014, 211, 181–188. [Google Scholar] [CrossRef] [PubMed]
- Mossadegh-Keller, N.; Sarrazin, S.; Kandalla, P.K.; Espinosa, L.; Stanley, E.R.; Nutt, S.L.; Moore, J.; Sieweke, M.H. M-CSF instructs myeloid lineage fate in single haematopoietic stem cells. Nature 2013, 497, 239–243. [Google Scholar] [CrossRef] [PubMed]
- Sitnicka, E.; Bryder, D.; Theilgaard-Mönch, K.; Buza-Vidas, N.; Adolfsson, J.; Jacobsen, S.E. Key role of Flt3 ligand in regulation of the common lymphoid progenitor but not in maintenance of the hematopoietic stem cell pool. Immunity 2002, 17, 463–472. [Google Scholar] [CrossRef]
- Chu, S.H.; Heiser, D.; Li, L.; Kaplan, I.; Collector, M.; Huso, D.; Sharkis, S.J.; Civin, C.; Small, D. Flt3-itd knockin impairs hematopoietic stem cell quiescence/homeostasis, leading to myeloproliferative neoplasm. Cell Stem Cell 2012, 11, 346–358. [Google Scholar] [CrossRef] [PubMed]
- Ceredig, R.; Rolink, A.G.; Brown, G. Models of haematopoiesis: Seeing the wood for the trees. Nat. Rev. Immunol. 2009, 9, 293–300. [Google Scholar] [CrossRef] [PubMed]
- Brown, G.; Mooney, C.J.; Alberti-Servera, L.; Muenchow, L.; Toellner, K.M.; Ceredig, R.; Rolink, A. Versatility of stem and progenitor cells and the instructive actions of cytokines on hematopoiesis. Crit. Rev. Clin. Lab. Sci. 2015, 52, 168–179. [Google Scholar] [PubMed]
- Kikushige, Y.; Yoshimoto, G.; Miyamoto, T.; Iino, T.; Mori, Y.; Iwasaki, H.; Niiro, H.; Takenaka, K.; Nagafuji, K.; Harada, M.; et al. Human Flt3 is expressed at the hematopoietic stem cell and the granulocyte/macrophage progenitor stages to maintain cell survival. J. Immunol. 2008, 180, 7358–7367. [Google Scholar] [CrossRef] [PubMed]
- Beaudin, A.E.; Boyer, S.W.; Perez-Cunningham, J.; Hernandez, G.E.; Derderian, S.C.; Jujjavarapu, C.; Aaserude, E.; MacKenzie, T.; Forsberg, E.C. A transient developmental hematopoietic stem cell gives rise to innate-like B and T cells. Cell Stem Cell. 2016, 19, 768–783. [Google Scholar] [CrossRef] [PubMed]
- Yamamoto, R.; Morita, Y.; Ooehara, J.; Hamanaka, S.; Onodera, M.; Rudolph, K.L.; Ema, H.; Nakauchi, H. Clonal analysis unveils self-renewing lineage-restricted progenitors generated directly from hematopoietic stem cells. Cell 2013, 154, 1112–1126. [Google Scholar] [CrossRef] [PubMed]
- Benz, C.; Copley, M.R.; Kent, D.G.; Wohrer, S.; Cortes, A.; Aghaeepour, N.; Ma, E.; Mader, H.; Rowe, K.; Day, C.; et al. Hematopoietic stem cell subtypes expand differentially during development and display distinct lymphopoietic programs. Cell Stem Cell. 2012, 10, 273–283. [Google Scholar] [CrossRef] [PubMed]
- Naik, S.H.; Perié, L.; Swart, E.; Gerlach, C.; van Rooij, N.; de Boer, R.J.; Schumacher, T.N. Diverse and heritable lineage imprinting of early haematopoietic progenitors. Nature 2013, 496, 229–232. [Google Scholar] [CrossRef] [PubMed]
- Challen, G.A.; Boles, N.C.; Chambers, S.M.; Goodell, M.A. Distinct hematopoietic stem cell subtypes are differentially regulated by tgf-beta1. Cell Stem Cell 2010, 6, 265–278. [Google Scholar] [CrossRef] [PubMed]
- Lu, R.; Neff, N.F.; Quake, S.R.; Weissman, I.L. Tracking single hematopoietic stem cells in vivo using high-throughput sequencing in conjunction with viral genetic barcoding. Nat. Biotechnol. 2011, 29, 928–933. [Google Scholar] [CrossRef] [PubMed]
- Sanjuan-Pla, A.; Macaulay, I.C.; Jensen, C.T.; Woll, P.S.; Luis, T.C.; Mead, A.; Moore, S.; Carella, C.; Matsuoka, S.; Bouriez Jones, T.; et al. Platelet-biased stem cells reside at the apex of the haematopoietic stem-cell hierarchy. Nature 2013, 502, 232–236. [Google Scholar] [CrossRef] [PubMed]
- Gekas, C.; Graf, T. CD41 expression marks myeloid-biased adult hematopoietic stem cells and increases with age. Blood 2013, 121, 4463–4472. [Google Scholar] [CrossRef] [PubMed]
- Shimazu, T.; Iida, R.; Zhang, Q.; Welner, R.S.; Medina, K.L.; Alberola-Lla, J.; Kincade, P.W. CD86 is expressed on murine hematopoietic stem cells and denotes lymphopoietic potential. Blood 2012, 119, 4889–4897. [Google Scholar] [CrossRef] [PubMed]
- Shin, J.Y.; Hu, W.; Naramura, M.; Park, C.Y. High c-kit expression identifies hematopoietic stem cells with impaired self-renewal and megakaryocytic bias. J. Exp. Med. 2014, 211, 217–231. [Google Scholar] [CrossRef] [PubMed]
- Notta, F.; Zandi, S.; Takayama, N.; Dobson, S.; Gan, O.I.; Wilson, G.; Kaufmann, K.B.; McLeod, J.; Laurenti, E.; Dunant, C.F.; et al. Distinct routes of lineage development reshape the human blood hierarchy across ontogeny. Science 2016, 351, aab2116. [Google Scholar] [CrossRef] [PubMed]
- Velten, L.; Haas, S.F.; Raffel, S.; Blaszkiewicz, S.; Islam, S.; Hennig, B.P.; Hirche, C.; Lutz, C.; Buss, E.C.; Nowak, D.; et al. Human haematopoietic stem cell lineage commitment is a continuous process. Nat. Cell. Biol. 2017, 19, 271–281. [Google Scholar] [CrossRef] [PubMed]
- Paul, F.; Arkin, Y.; Giladi, A.; Jaitin, D.A.; Kenigsberg, E.; Keren-Shaul, H.; Winter, D.; Lara-Astiaso, D.; Gury, M.; Weiner, A.; et al. Transcriptional heterogeneity and lineage commitment in myeloid progenitors. Cell 2015, 163, 1663–1677. [Google Scholar] [CrossRef] [PubMed]
- Karsunky, H.; Merad, M.; Cozzio, A.; Weissman, I.L.; Manz, M.G. Flt3 ligand regulates dendritic cell development from Flt3+ lymphoid and myeloid-committed progenitors to Flt3+ dendritic cells in vivo. J. Exp. Med. 2003, 198, 305–313. [Google Scholar] [CrossRef] [PubMed]
- Chi, A.W.; Chavez, A.; Xu, L.; Weber, B.N.; Shestova, O.; Schaffer, A.; Wertheim, G.; Pear, W.S.; Izon, D.; Bhandoola, A. Identification of Flt3⁺CD150⁻ myeloid progenitors in adult mouse bone marrow that harbor T lymphoid developmental potential. Blood 2011, 118, 2723–2732. [Google Scholar] [CrossRef] [PubMed]
- Luc, S.; Anderson, K.; Kharazi, S.; Buza-Vidas, N.; Böiers, C.; Jensen, C.T.; Ma, Z.; Wittmann, L.; Jacobsen, S.E. Down-regulation of mpl marks the transition to lymphoid-primed multipotent progenitors with gradual loss of granulocyte-monocyte potential. Blood 2008, 111, 3424–3434. [Google Scholar] [CrossRef] [PubMed]
- Böiers, C.; Buza-Vidas, N.; Jensen, C.T.; Pronk, C.J.; Kharazi, S.; Wittmann, L.; Sitnicka, E.; Hultquist, A.; Jacobsen, S.E. Expression and role of Flt3 in regulation of the earliest stage of normal granulocyte-monocyte progenitor development. Blood 2010, 115, 5061–5068. [Google Scholar] [CrossRef] [PubMed]
- Perié, L.; Hodgkin, P.D.; Naik, S.H.; Schumacher, T.N.; de Boer, R.J.; Duffy, K.R. Determining lineage pathways from cellular barcoding experiments. Cell Rep. 2014, 6, 617–624. [Google Scholar] [CrossRef] [PubMed]
- Passegué, E.; Wagers, A.J.; Giuriato, S.; Anderson, W.C.; Weissman, I.L. Global analysis of proliferation and cell cycle gene expression in the regulation of hematopoietic stem and progenitor cell fates. J. Exp. Med. 2005, 202, 1599–1611. [Google Scholar] [CrossRef] [PubMed]
- Fleming, W.H.; Alpern, E.J.; Uchida, N.; Ikuta, K.; Spangrude, G.J.; Weissman, I.L. Functional heterogeneity is associated with the cell cycle status of murine hematopoietic stem cells. J. Cell Biol. 1993, 122, 897–902. [Google Scholar] [CrossRef] [PubMed]
- Chang, H.H.; Hemberg, M.; Barahona, M.; Ingber, D.E.; Huang, S. Transcriptome-wide noise controls lineage choice in mammalian progenitor cells. Nature 2008, 453, 544–547. [Google Scholar] [CrossRef] [PubMed]


© 2017 by the authors. Licensee MDPI, Basel, Switzerland. This article is an open access article distributed under the terms and conditions of the Creative Commons Attribution (CC BY) license (http://creativecommons.org/licenses/by/4.0/).
Share and Cite
Mooney, C.J.; Cunningham, A.; Tsapogas, P.; Toellner, K.-M.; Brown, G. Selective Expression of Flt3 within the Mouse Hematopoietic Stem Cell Compartment. Int. J. Mol. Sci. 2017, 18, 1037. https://doi.org/10.3390/ijms18051037
Mooney CJ, Cunningham A, Tsapogas P, Toellner K-M, Brown G. Selective Expression of Flt3 within the Mouse Hematopoietic Stem Cell Compartment. International Journal of Molecular Sciences. 2017; 18(5):1037. https://doi.org/10.3390/ijms18051037
Chicago/Turabian StyleMooney, Ciaran James, Alan Cunningham, Panagiotis Tsapogas, Kai-Michael Toellner, and Geoffrey Brown. 2017. "Selective Expression of Flt3 within the Mouse Hematopoietic Stem Cell Compartment" International Journal of Molecular Sciences 18, no. 5: 1037. https://doi.org/10.3390/ijms18051037