Article

Osteopontin Deficiency Suppresses Intestinal Tumor Development in Apc-Deficient Min Mice

1
Central Animal Division, National Cancer Center Research Institute, 5-1-1, Tsukiji, Chuo-ku, Tokyo 104-0045, Japan
2
Epidemiology and Prevention Division, Research Center for Cancer Prevention and Screening, National Cancer Center, 5-1-1, Tsukiji, Chuo-ku, Tokyo 104-0045, Japan
3
Division of Pathology, National Institute of Health Science, 1-18-1 Kamiyoga, Setagaya-ku, Tokyo 158-8501, Japan
*
Author to whom correspondence should be addressed.
Int. J. Mol. Sci. 2017, 18(5), 1058; https://doi.org/10.3390/ijms18051058
Submission received: 29 March 2017 / Revised: 5 May 2017 / Accepted: 9 May 2017 / Published: 14 May 2017
(This article belongs to the Special Issue Inflammation and Cancer)

Abstract

:
Osteopontin (OPN) is a secreted phosphoglycoprotein, and is a transcriptional target of aberrant Wnt signaling. OPN is upregulated in human colon cancers, and is suggested to enhance cancer progression. In this study, the effect of deficiency of OPN on intestinal tumor development in Apc-deficient Min mice was investigated. At 16 weeks of age, the number of small intestinal polyps in Min/OPN(+/−) and Min/OPN(−/−) mice was lower than that of Min/OPN(+/+) mice. Colorectal tumor incidences and multiplicities in Min/OPN(+/−) and Min/OPN(−/−) mice were significantly lower than those in Min/OPN(+/+) mice, being 48% and 0.6 ± 0.8, 50% and 0.8 ± 0.9 vs. 80% and 1.6 ± 1.7, respectively. OPN expression in colorectal tumors was strongly upregulated in Min/OPN(+/+) compared to adjacent non-tumor parts, but was decreased in Min/OPN(+/−) and not detected in Min/OPN(−/−). Targets of OPN, matrix metalloproteinases (MMPs)-3, -9, and -13 were lowered by OPN deficiency. Macrophage marker F4/80 in colorectal tumors was also lowered by OPN deficiency. MMP-9 expression was observed in tumor cells and tumor-infiltrating neutrophils. These results indicate that induction of OPN by aberrant Wnt signaling could enhance colorectal tumor development in part by upregulation of MMP-3, -9, and -13 and infiltration of macrophage and neutrophils. Suppression of OPN expression could contribute to tumor prevention, but complete deficiency of OPN may cause some adverse effects.

Graphical Abstract

1. Introduction

Osteopontin (OPN), also known as secreted phosphoprotein 1 (SPP1), binds to several integrin receptors including CD44v6, a splicing variant of CD44, which is a marker of colon cancer stem cells, and regulates cell motility, invasion, chemotaxis, and cell survival [1,2]. OPN is overexpressed in multiple types of cancer, including colorectal carcinomas [3,4], and serum levels of OPN in cancer patients are elevated. Thus, it is used as a diagnostic and prognostic marker [5]. OPN plays important roles in immune regulation [6,7,8] and cancer progression [9,10]. OPN expression in colon cancer has been identified as an independent prognostic parameter for overall survival, and high OPN expression is associated with bad prognosis [11]. This might be explained by OPN being implicated as a key regulatory component of epithelial-mesenchymal transition (EMT) [12]. OPN is expressed in tumor cells and tumor-associated macrophages (TAMs) [13], and both autocrine and paracrine signaling of OPN are considered to be involved in tumor progression. Indeed, it has been reported that both endogenous OPN expression and exogenous OPN enhances the motility and invasiveness of human colon cancer cells in vitro [14]. OPN enhances hepatic metastasis of colorectal cancer cells [15], and it has been reported that silencing of OPN by small interfering RNA (siRNA) suppresses murine colon adenocarcinoma metastasis [16]. OPN knockdown in a human colon carcinoma cell line by siRNA reduces vascular endothelial growth factor (VEGF), matrix metalloproteinase (MMP)-2, and MMP9, and suppresses colon cancer cell growth [17]. OPN is also abundant in bone, and facilitates bone metastasis of breast cancer [18]. Thus, OPN is considered to be a candidate target for cancer therapy [19,20]. However, it is not clear whether OPN could be a target for cancer prevention.
Epidemiological studies have shown that insulin resistance and obesity are risk factors for colorectal tumors [21,22]. OPN is upregulated in adipose tissue in obesity and causes adipocyte inflammation and insulin resistance through macrophage activation [23,24]. Deficiency of OPN prevents proliferation of macrophages in adipose tissue, and induction of insulin resistance and inflammation in adipose tissue induced by a high fat diet in mice [23,25,26]. Neutralization of OPN by anti-OPN antibody also inhibits obesity-induced inflammation and insulin resistance in diet-induced obese mice [27]. Increased circulating levels of OPN have been observed to be due to obesity and colon cancer [28]. Thus, suppression of circulating OPN levels could prevent colorectal tumor development. There are reports that OPN depletion inhibits diethylnitrosamine (DEN)-induced hepatocarcinogenesis and N-methyl-N-nitrosourea (MNU) and Helicobacter pylori-induced gastric cancer development in mice [29,30]. However, there are no reports about intestinal tumorigenesis in OPN-knockout mice.
In human colon cancers, the Apc gene, a gene responsible for familial adenomatous polyposis (FAP), is frequently mutated [31] and Wnt/beta-catenin signaling is aberrantly activated [32]. OPN has been suggested to be a putative target of Wnt signaling, and elevated expression of OPN has been reported to be significantly correlated with increased cytoplasmic and nuclear accumulation of beta-catenin [11]. In genetically defined mouse models, OPN is upregulated in tumors in Apc1638N mice, an Apc-deficient mouse model, but not in tumors in pvillin-KRASV12G mice without Wnt activation mutations [11]. The Min mouse, another animal model of FAP, harbors a mutation and develops numerous polyps in the intestinal tract [33]. In the present study, the effect of deficiency of OPN on intestinal tumor development in Apc-deficient Min mice was investigated to clarify the importance of OPN in the early phase of colon tumor development.

2. Results

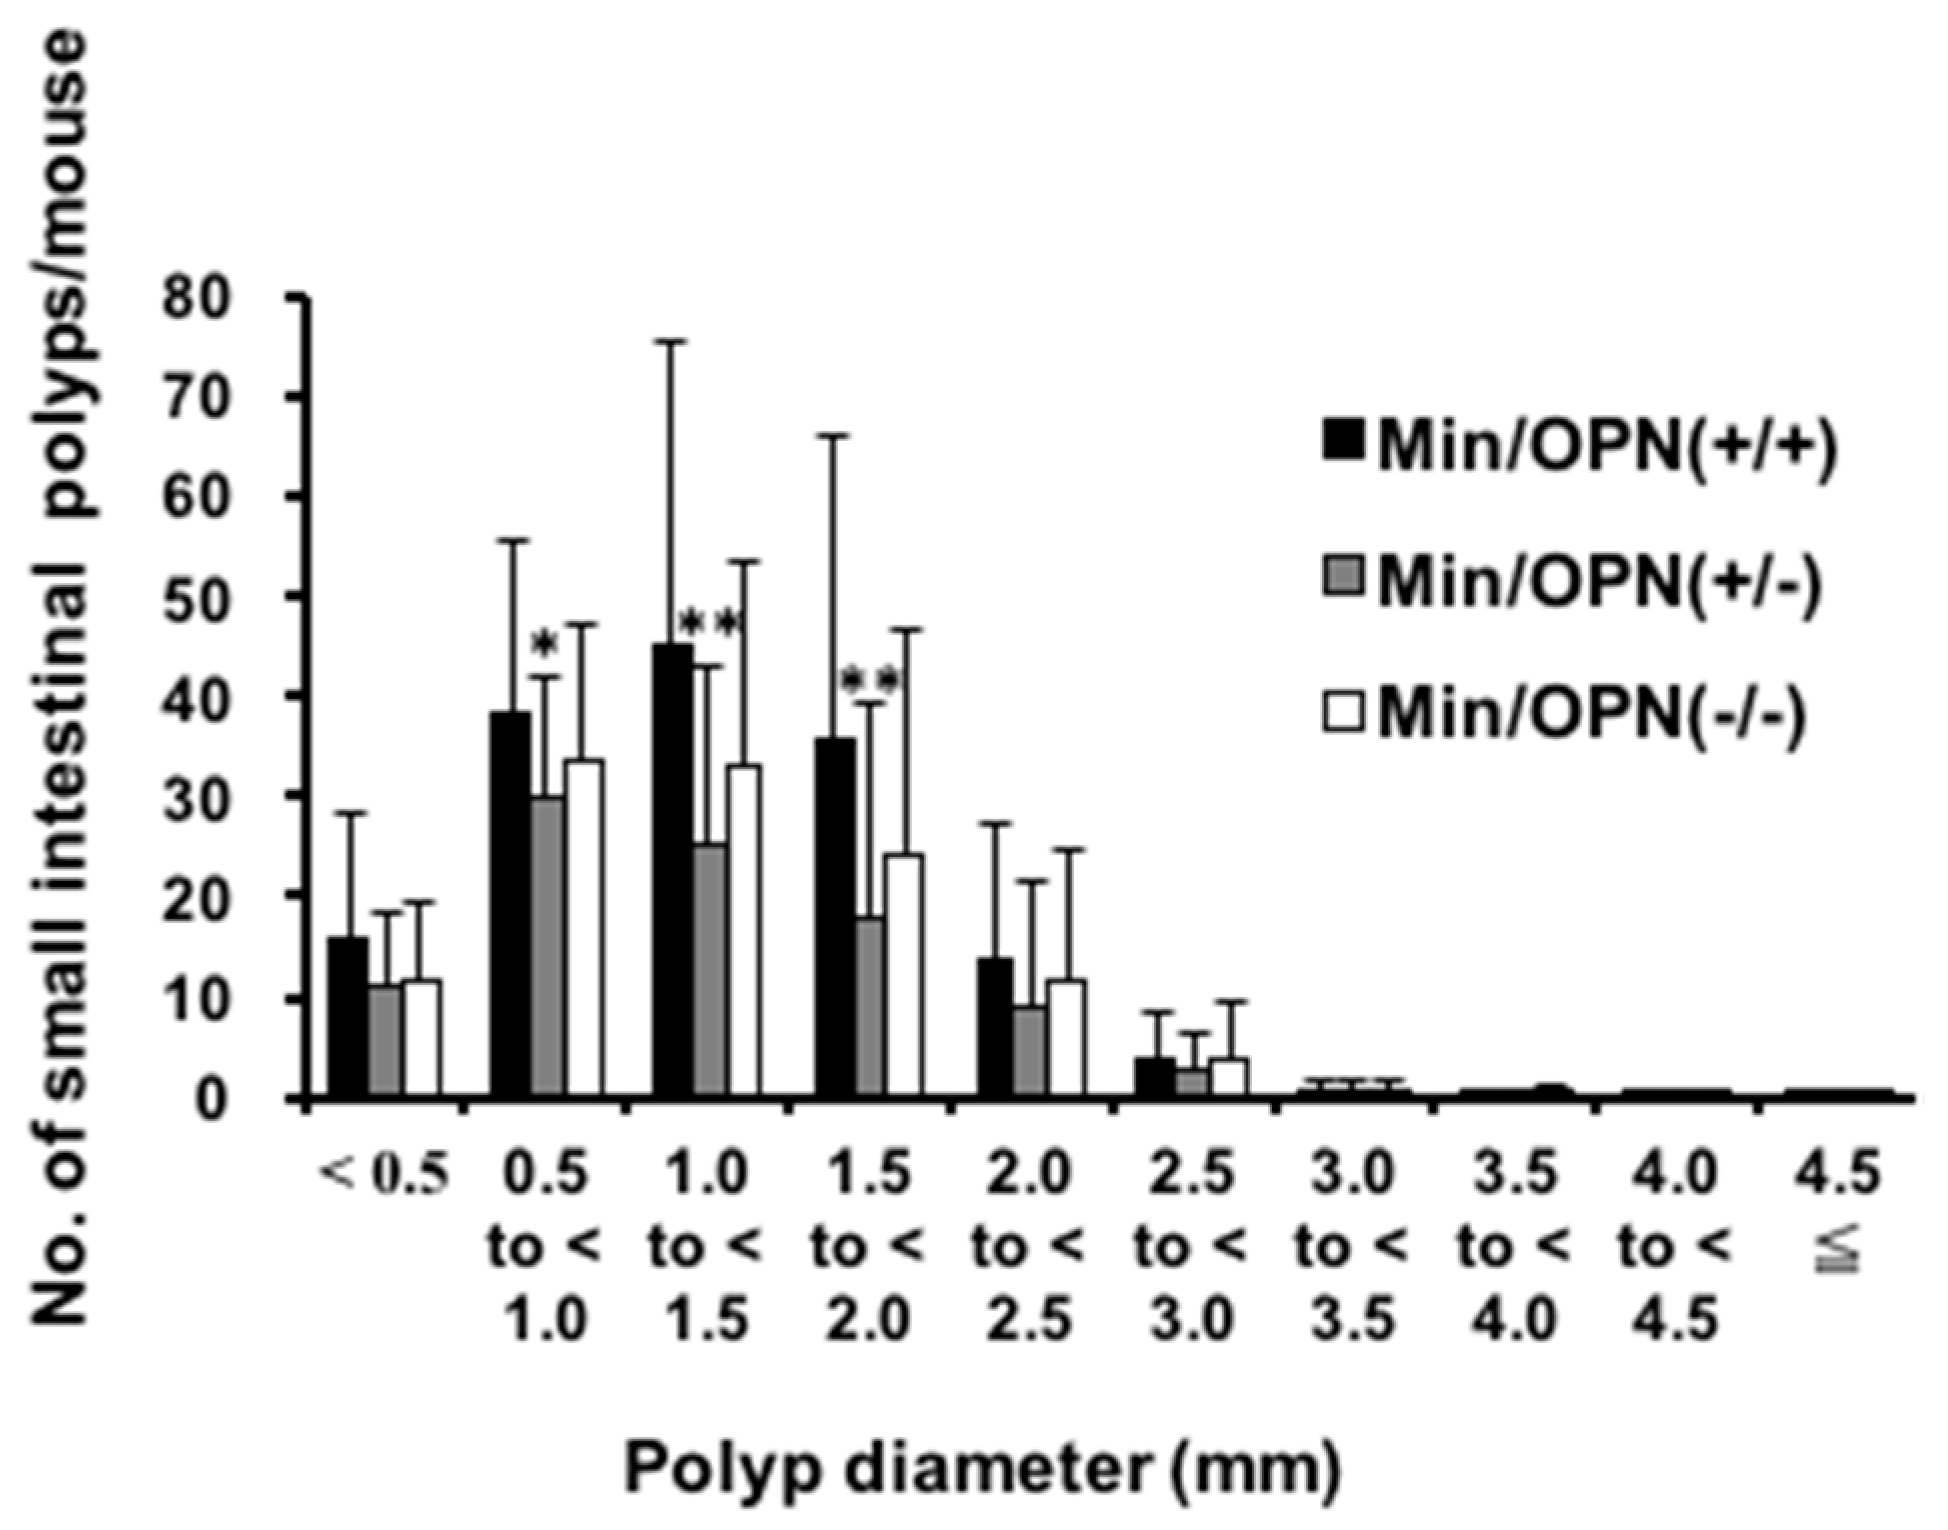
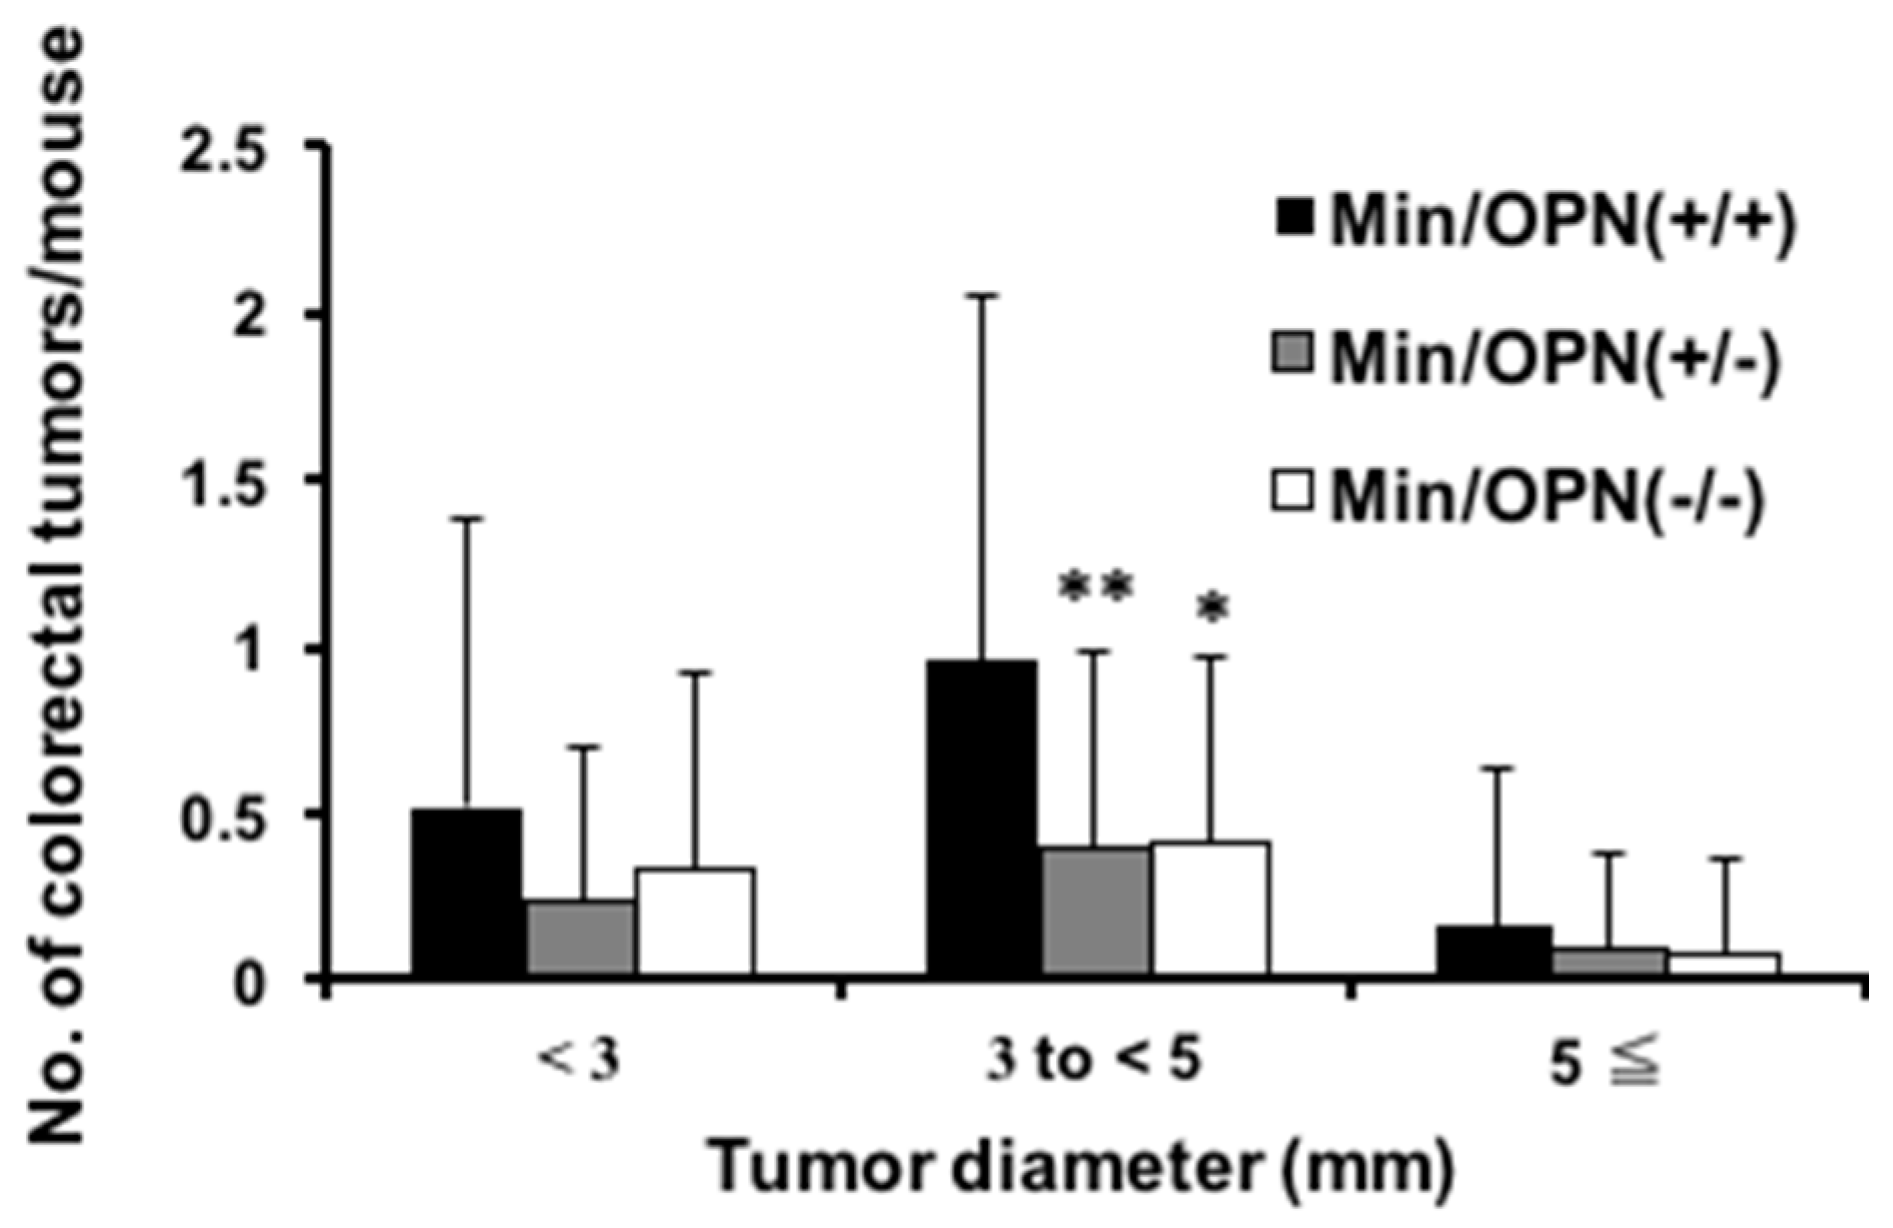
2.1. Effect of Osteopontin (OPN) Deficiency on Intestinal Polyp Formation in Min Mice

To investigate involvement of OPN in intestinal tumor development, the effect of the deficiency of OPN on intestinal polyp formation in Min mice was examined. OPN genotypes did not significantly affect food intake, behavior, or body weight changes during the experimental periods. Final body weights (g) in male Min/OPN(+/+), Min/OPN(+/−), Min/OPN(−/−), OPN(+/+), OPN(+/−), and OPN(−/−) mice were 23.3 ± 5.3, 26.0 ± 4.5, 25.2 ± 4.5, 29.8 ± 2.6, 31.4 ± 2.0, and 31.8 ± 2.1, respectively (Figure S1a). The differences between Apc mutant and wild type mice were statistically significant (p < 0.05). Final body weights (g) in female Min/OPN(+/+), Min/OPN(+/−), Min/OPN(−/−), OPN(+/+), OPN(+/−), and OPN(−/−) mice were 17.9 ± 3.3, 20.5 ± 2.1, 19.9 ± 2.3, 22.1 ± 1.1, 21.7 ± 1.9, and 22.3 ± 1.9, respectively (Figure S1b). The differences between male and female mice of each genotype were statistically significant (p < 0.01). There were no significant differences in final body weights among OPN genotypes. On the other hand, OPN genotypes affected spleen weights of Apc mutant mice. Spleen weights (g) in male Min/OPN(+/+), Min/OPN(+/−), Min/OPN(−/−), OPN(+/+), OPN(+/−), and OPN(−/−) mice were 0.173 ± 0.078, 0.278 ± 0.181, 0.270 ± 0.128, 0.092 ± 0.029, 0.105 ± 0.050, and 0.096 ± 0.021, respectively (Figure S1c). Spleen weights (g) in female Min/OPN(+/+), Min/OPN(+/−), Min/OPN(−/−), OPN(+/+), OPN(+/−), and OPN(−/−) mice were 0.156 ± 0.086, 0.174 ± 0.086, 0.232 ± 0.156, 0.088 ± 0.010, 0.088 ± 0.016, and 0.093 ± 0.027, respectively (Figure S1d). Spleen weights of Apc mutant mice were higher than those of Apc(+/+) mice, and deficiency of OPN further increased the spleen weight. OPN genotypes did not affect spleen weights of mice without the Apc mutation.
Table 1 summarizes the data for the number and distribution of small intestinal polyps in the Min/OPN(+/+), Min/OPN(+/−), and Min/OPN(−/−) mice at 16 weeks of age. Most polyps developed in the middle and distal sections of the small intestine, with only a few in the proximal segment of the small intestine and in the colon. There were no polyps in OPN(+/+), OPN(+/−), and OPN(−/−) mice. The total numbers of small intestinal polyps in Min/OPN(+/−) (96.3 ± 57.4, p < 0.01) and Min/OPN(−/−) mice (117.1 ± 62.4) were lower than that of Min/OPN(+/+) mice (152.8 ± 93.6). The majority of polyps were observed in the size range between 0.5 and 2.0 mm in diameter (Figure 1). In comparison to Min/OPN(+/+) mice, the number of polyps in the size range between 0.5 and 2.0 mm in diameter remarkably decreased in Min/OPN(+/−) and Min/OPN(−/−) mice.
As shown in Figure S2, colorectal tumors developed in the male and female Min/OPN(+/+), Min/OPN(+/−), and Min/OPN(−/−) mice. No lesions were observed in mice without the Apc gene mutation. Data for the incidence and multiplicity of colon tumors are summarized in Table 2. Both colon tumor incidences and multiplicities in Min/OPN(+/−) and Min/OPN(−/−) mice were significantly lower than those in Min/OPN(+/+) mice, being 27/56 (48%) (p < 0.01) and 0.6 ± 0.8 (p < 0.01), 18/36 (50%) (p < 0.05) and 0.8 ± 0.9 (p < 0.01) vs. 20/25 (80%) and 1.6 ± 1.7, respectively. Histopathological examination revealed that incidences of adenomas and adenocarcinomas in Min/OPN(+/+) mice were 44% and 60%, respectively, and each incidence tended to decrease with genetic OPN deficiency. Moreover, multiplicities of adenoma and adenocarcinoma also tended to decrease by OPN deficiency. Figure 2 shows the size distribution of colorectal tumors in mice. Compared to Min mice, the number of tumors showed a tendency to decrease at all sizes in mice with OPN deficiency. The number of tumors ranging between 3.0 mm and 5.0 mm in diameter was statistically lower in Min/OPN(+/−) (0.4 ± 0.6, p < 0.01) and Min/OPN(−/−) (0.4 ± 0.6, p < 0.05) mice than that in Min/OPN(+/+) mice (1.0 ± 1.1).

2.2. Serum Levels of OPN, Interleukin (IL)-6, and Triglycerides

The serum levels of OPN in Min/OPN(+/+), Min/OPN(+/−), and Min/OPN(−/−) mice were significantly different from each other and OPN genotype dependent (Table 3). As for the OPN(+/+), OPN(+/−), and OPN(−/−) mice, the OPN levels were also significantly different from each other and OPN genotype dependent. The serum levels of OPN in Min/OPN(+/+) were slightly higher than in OPN(+/+) mice, though the difference was not statistically different. The serum levels of OPN in Min/OPN(+/−) were significantly higher than in OPN(+/−) mice.
The serum levels of IL-6 were significantly elevated in mice bearing the Apc gene mutation (Min/OPN(+/+), Min/OPN(+/−), and Min/OPN(−/−)) compared with those in mice without the Apc gene mutation (OPN(+/+), OPN(+/−), and OPN(−/−) ), respectively (Table 3). The serum IL-6 level in Min/OPN(−/−) mice was significantly lower than those in Min/OPN(+/+) and Min/OPN(+/−) mice.
Mice bearing the Apc gene mutation were in the hypertriglyceridemic state, as shown in Table 3. In Min/OPN(+/−) and Min/OPN(−/−) mice, the levels of triglycerides (TGs) were lower than that in Min/OPN(+/+) mice, though the differences were not statistically significant. On the other hand, the TG levels in mice without the Apc gene mutation were low and similar among OPN(+/+), OPN(+/−), and OPN(−/−) mice. The serum levels of TGs in mice bearing the Apc gene mutation were statistically higher than that in mice without the Apc gene mutation (p < 0.01).

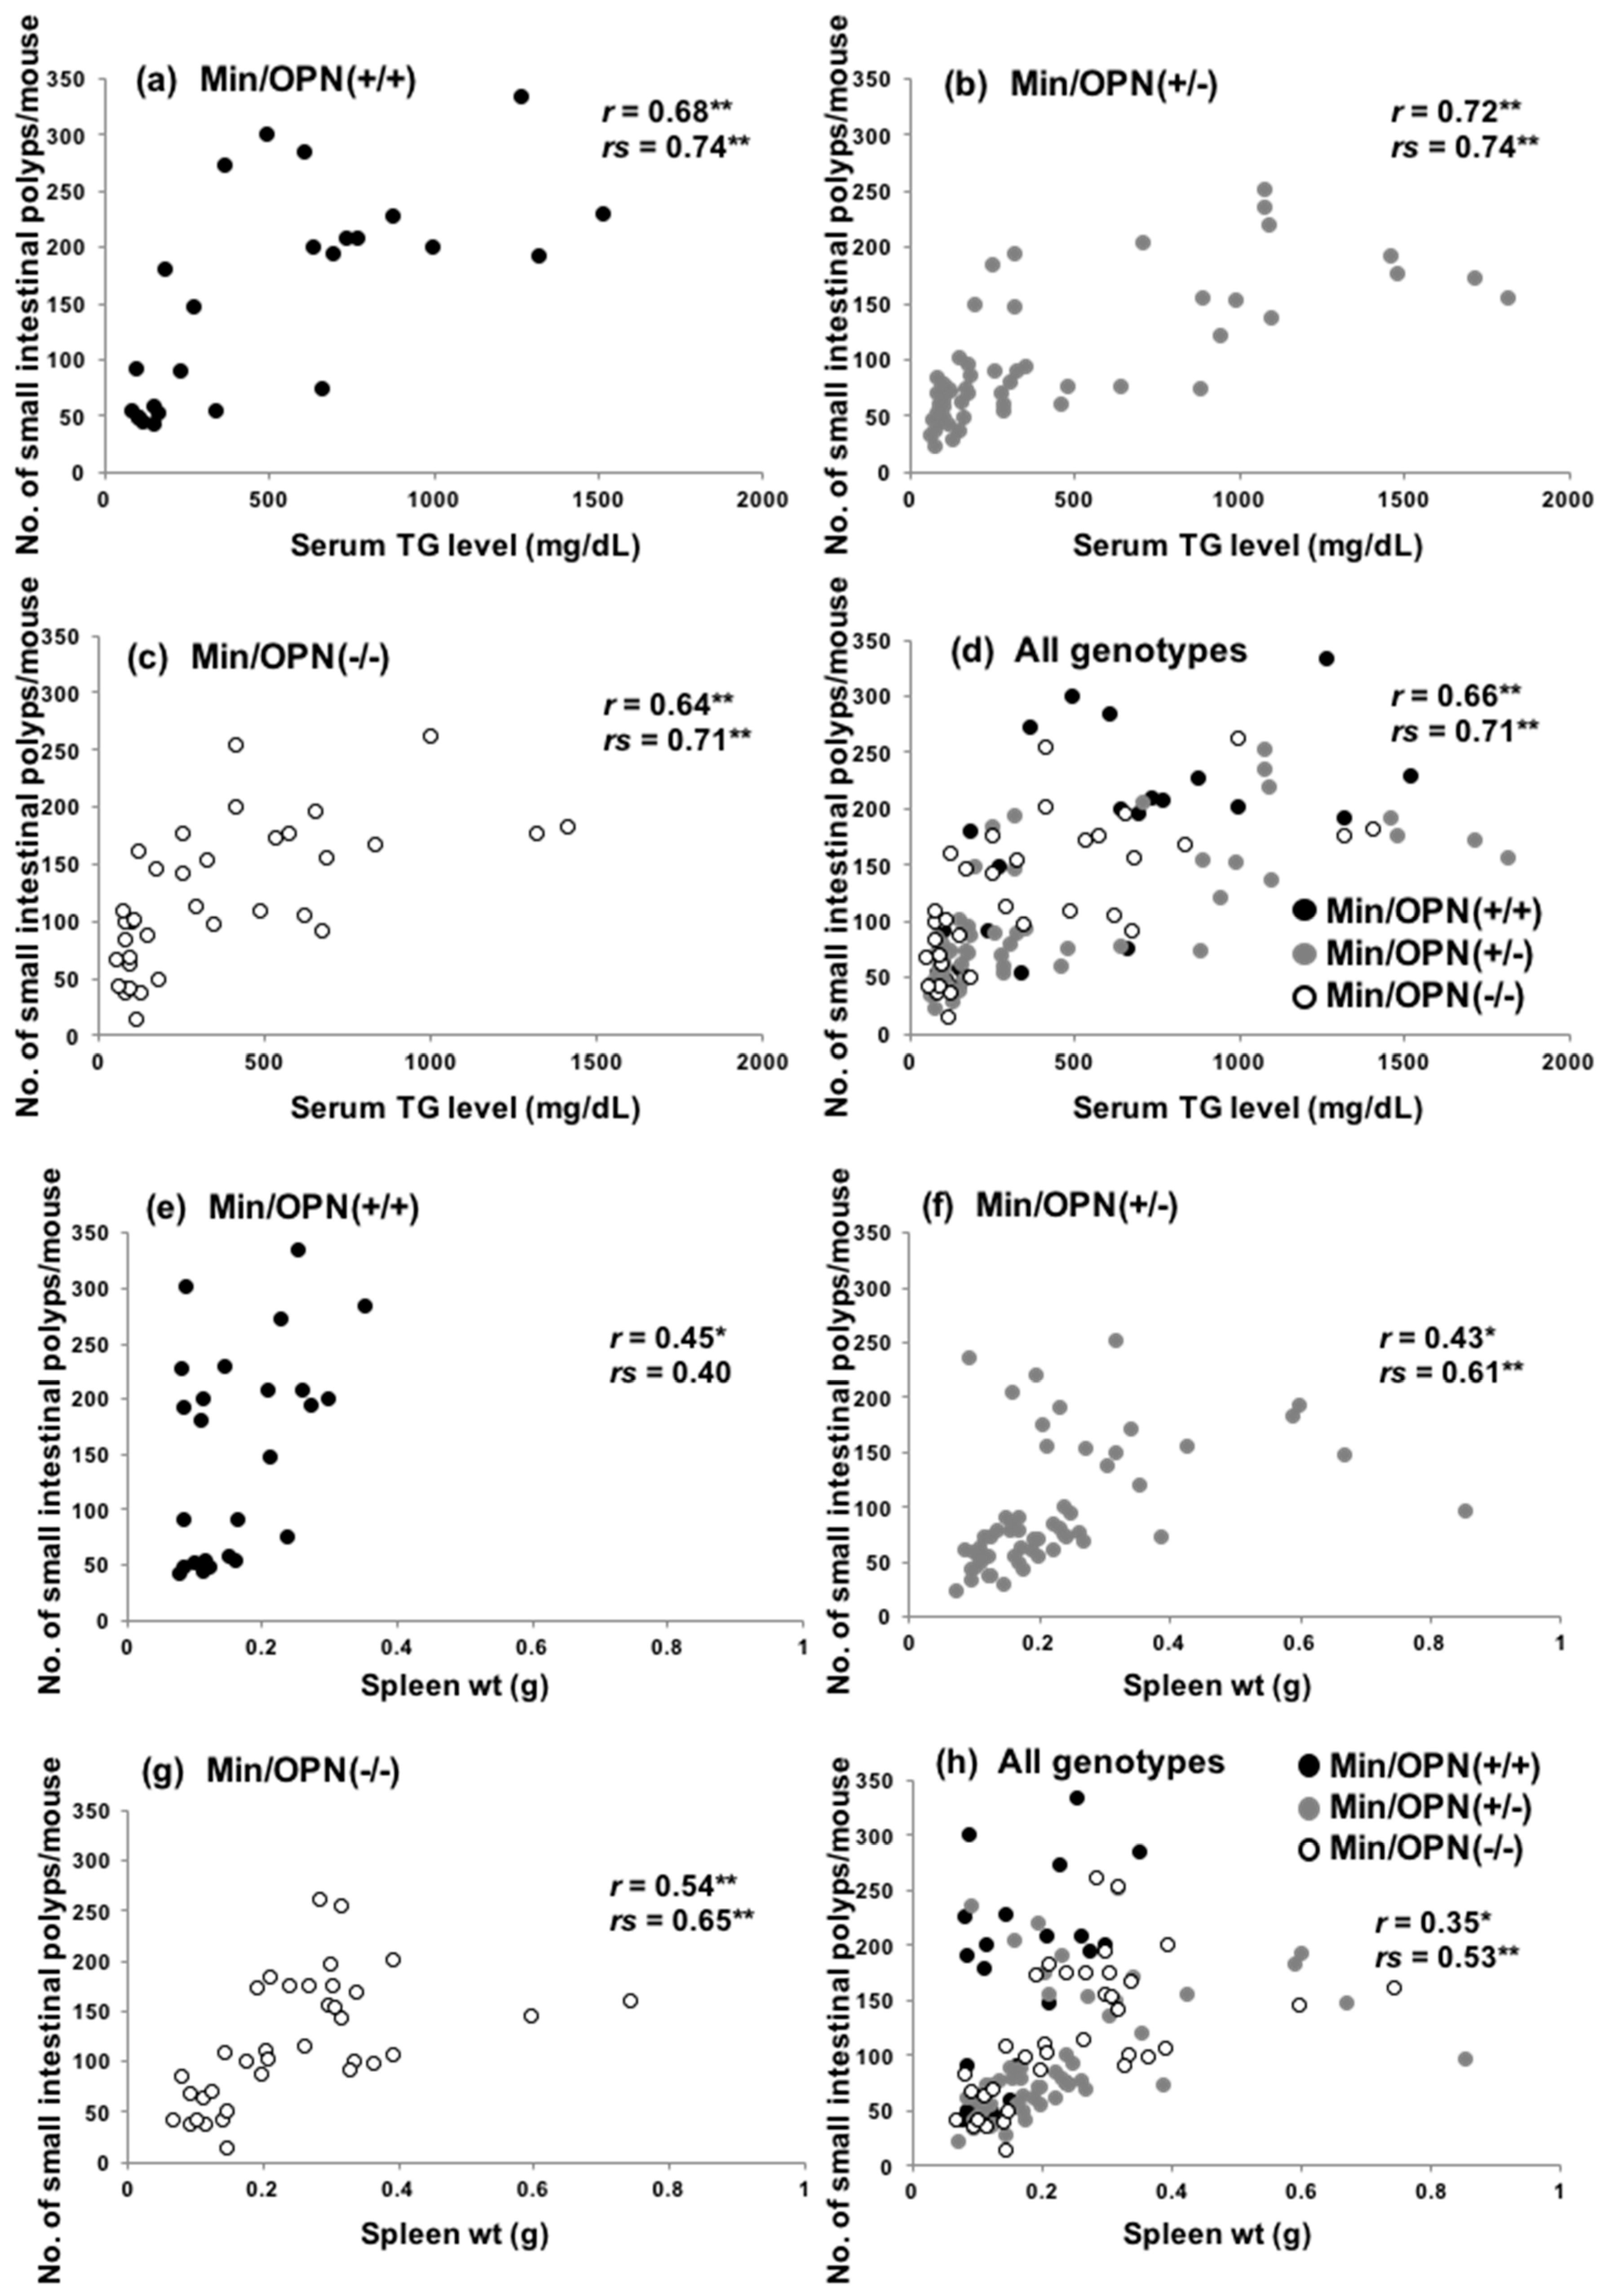
2.3. Correlation of Small Intestinal Polyp Numbers with Serum Levels of Triglycerides and Spleen Weights

Previously, we reported that serum TG levels dramatically increase with age in Apc-deficient mice, including Min mice, and both hyperlipidemia and polyp formation were suppressed by administration of peroxisome proliferator-activated receptor (PPAR) γ ligands, suggesting that hyperlipidemia in Min mice may be associated with intestinal lesion development [34]. Accordingly, the TG levels and number of small intestinal polyps in each mouse in the present study were plotted. As shown in Figure 3a–d, significant positive correlation between serum levels of TGs and polyp numbers was observed in Min/OPN(+/+) (r = 0.68 by the Pearson correlation coefficient test, p = 0.00019; rs = 0.74 by Spearman’s rank correlation coefficient test, p = 0.00031) Min/OPN(+/−) (r = 0.72, p = 3.1 × 10⁻¹⁰; rs = 0.74, p = 3.4 × 10⁻⁸), Min/OPN(−/−), (r = 0.64, p = 3.0 × 10⁻⁵; rs = 0.71, p = 2.5 × 10⁻⁵), and all three genotypes (r = 0.66, p = 9.5 × 10⁻¹⁶; rs = 0.71, p = 2.7 × 10⁻¹⁵).
It has been reported that spleen weights in Min mice positively correlate with small intestinal polyp numbers [35,36]. However, spleen weights of OPN-deficient Min mice were heavier than those of Min/OPN(+/+) mice in the present study (Figure S1c,d). The correlation between spleen weights and small intestinal polyps was examined (Figure 3e–h). Positive correlations were observed in Min/OPN(+/+) (r = 0.45 by the Pearson correlation coefficient test, p = 0.024; rs = 0.40 by Spearman’s rank correlation coefficient test, p = 0.048), Min/OPN(+/−) (r = 0.43, p = 0.0011; rs = 0.61, p = 5.2 × 10⁻⁶), Min/OPN(−/−) (r = 0.54, p = 0.00065; rs = 0.65, p = 00011), and all three genotypes (r = 0.35, p = 0.00013; rs = 0.53 p = 9.9 × 10⁻⁹), though the correlation coefficients were not very high. In the Min/OPN(+/+) group, there were no mice with more than 0.4 g of spleen weight, even though there were mice with quite high polyp numbers (250 <). On the other hand, in the Min/OPN(+/−) and Min/OPN(−/−) groups, there were a few mice with quite high spleen weights, though their polyp numbers were not very high (between 100 and 200); that is to say, positive correlations between polyp numbers and spleen weights were observed in each genotype, but the gradient of the correlation line seems to be different between Min/OPN(+/+) and OPN-deficient Min mice. As shown in Figure 1 and Figure 2, numbers of large polyps were relatively low in Min/OPN(+/−) and Min/OPN(−/−) mice compared with those in Min/OPN(+/+) mice.

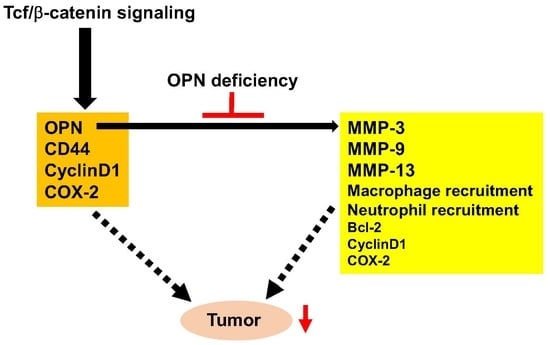
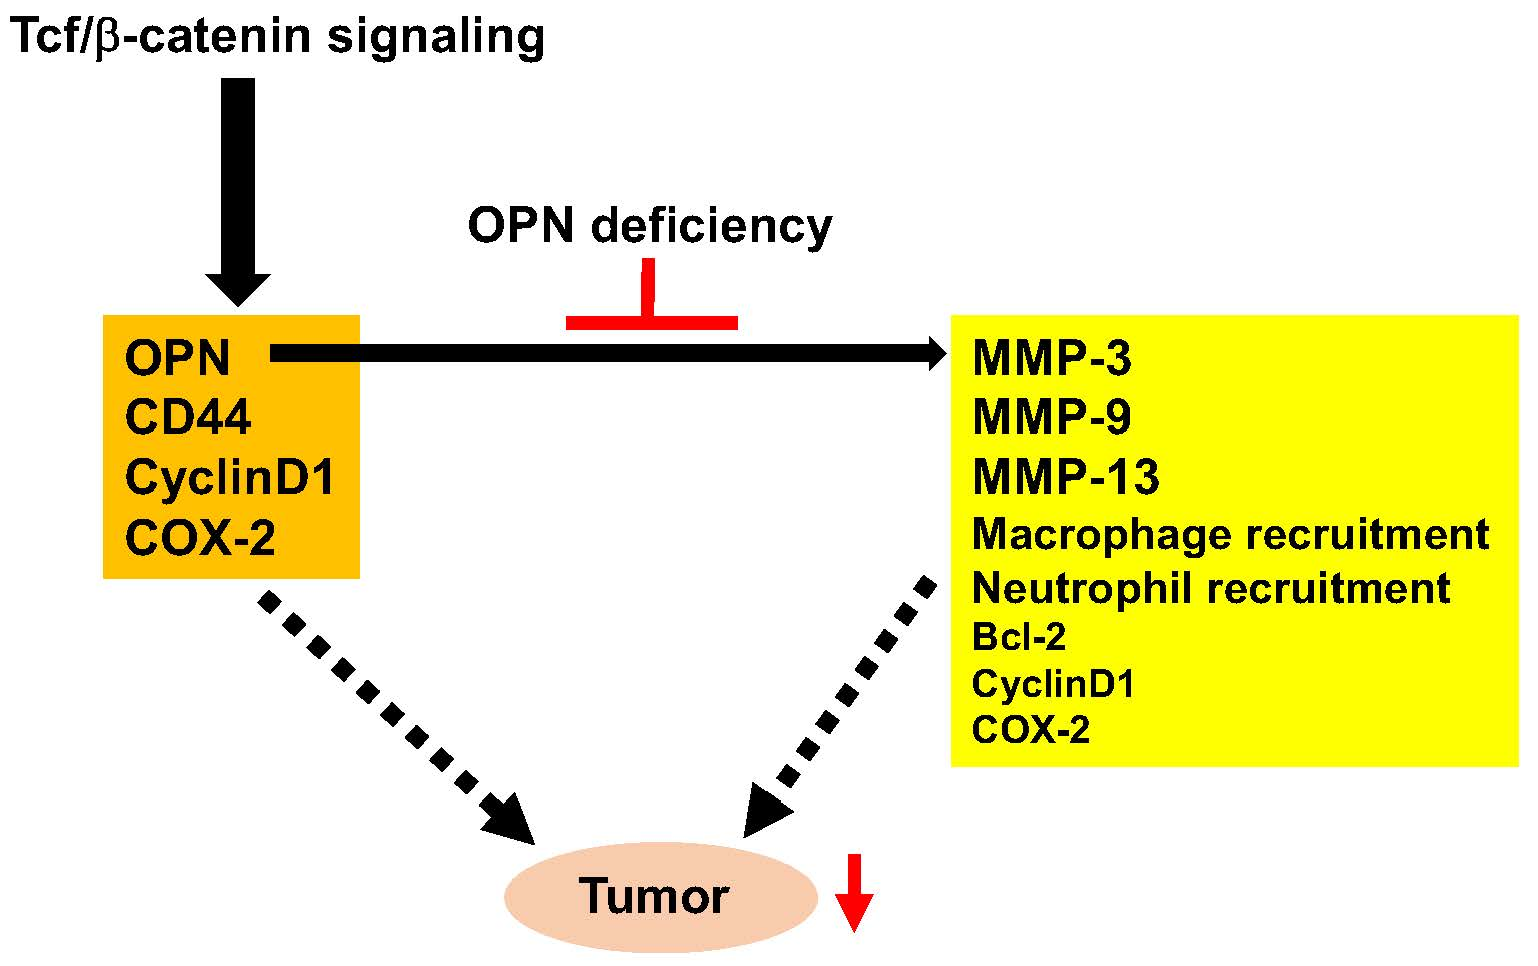
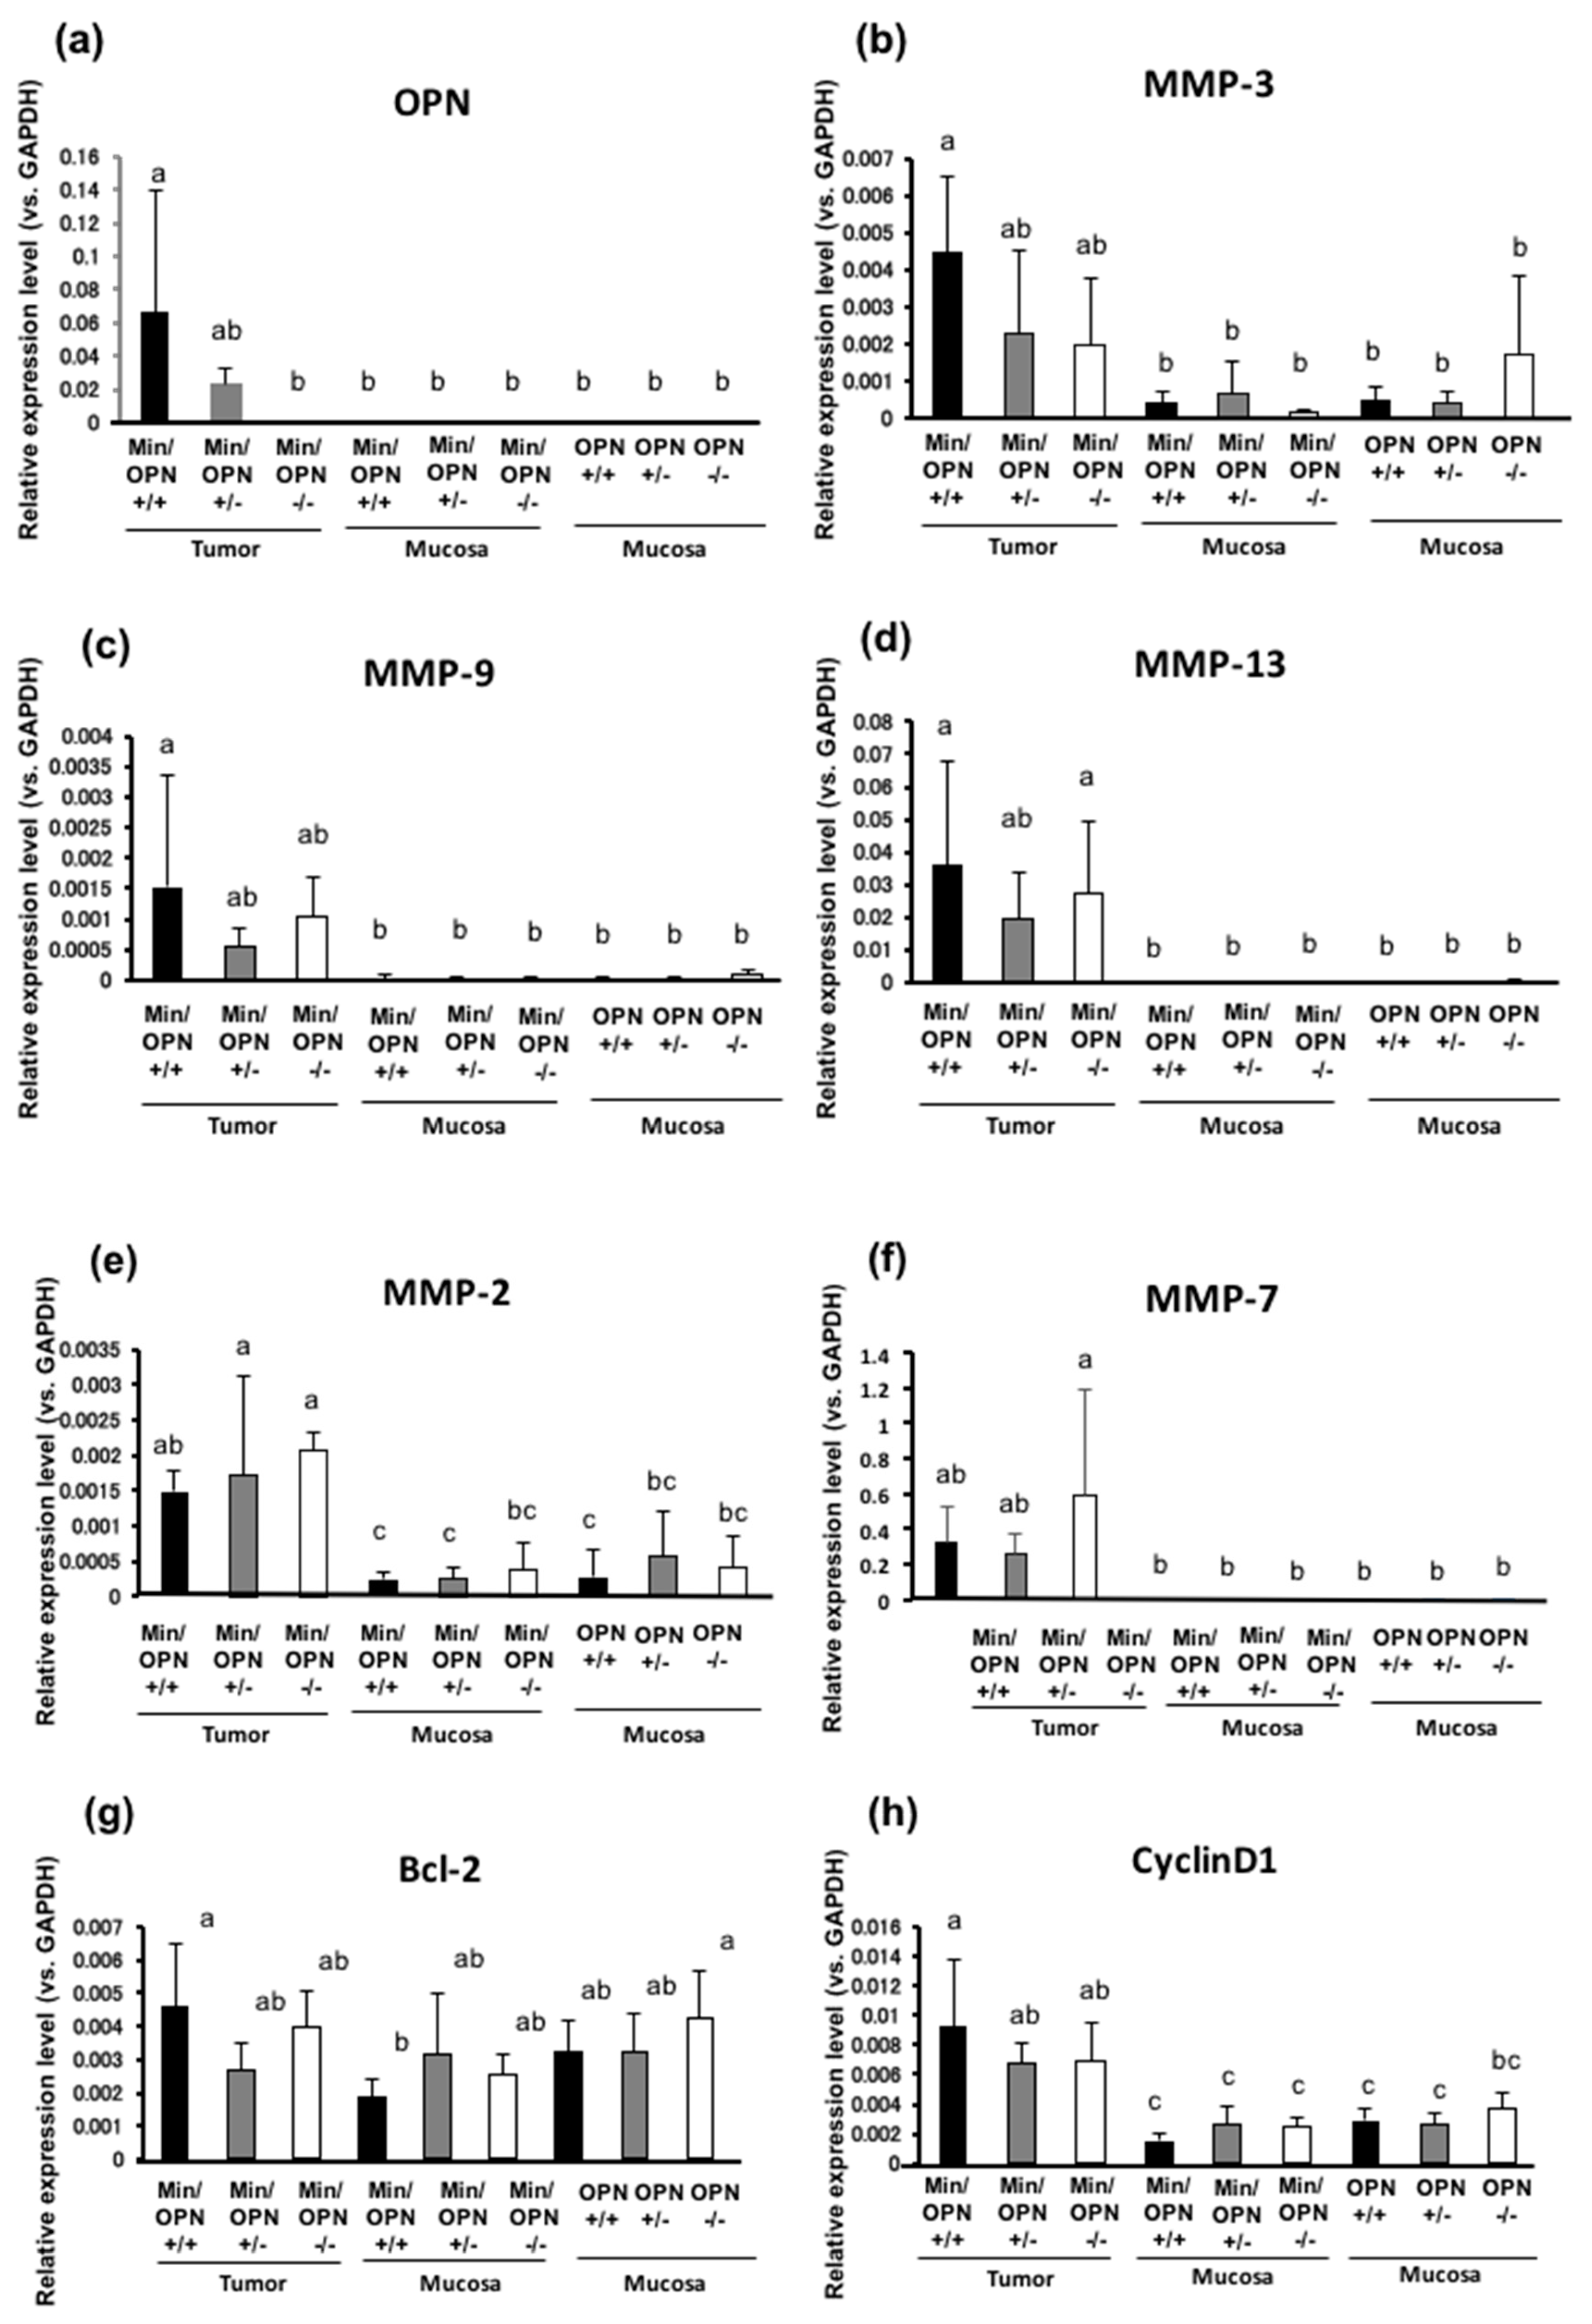
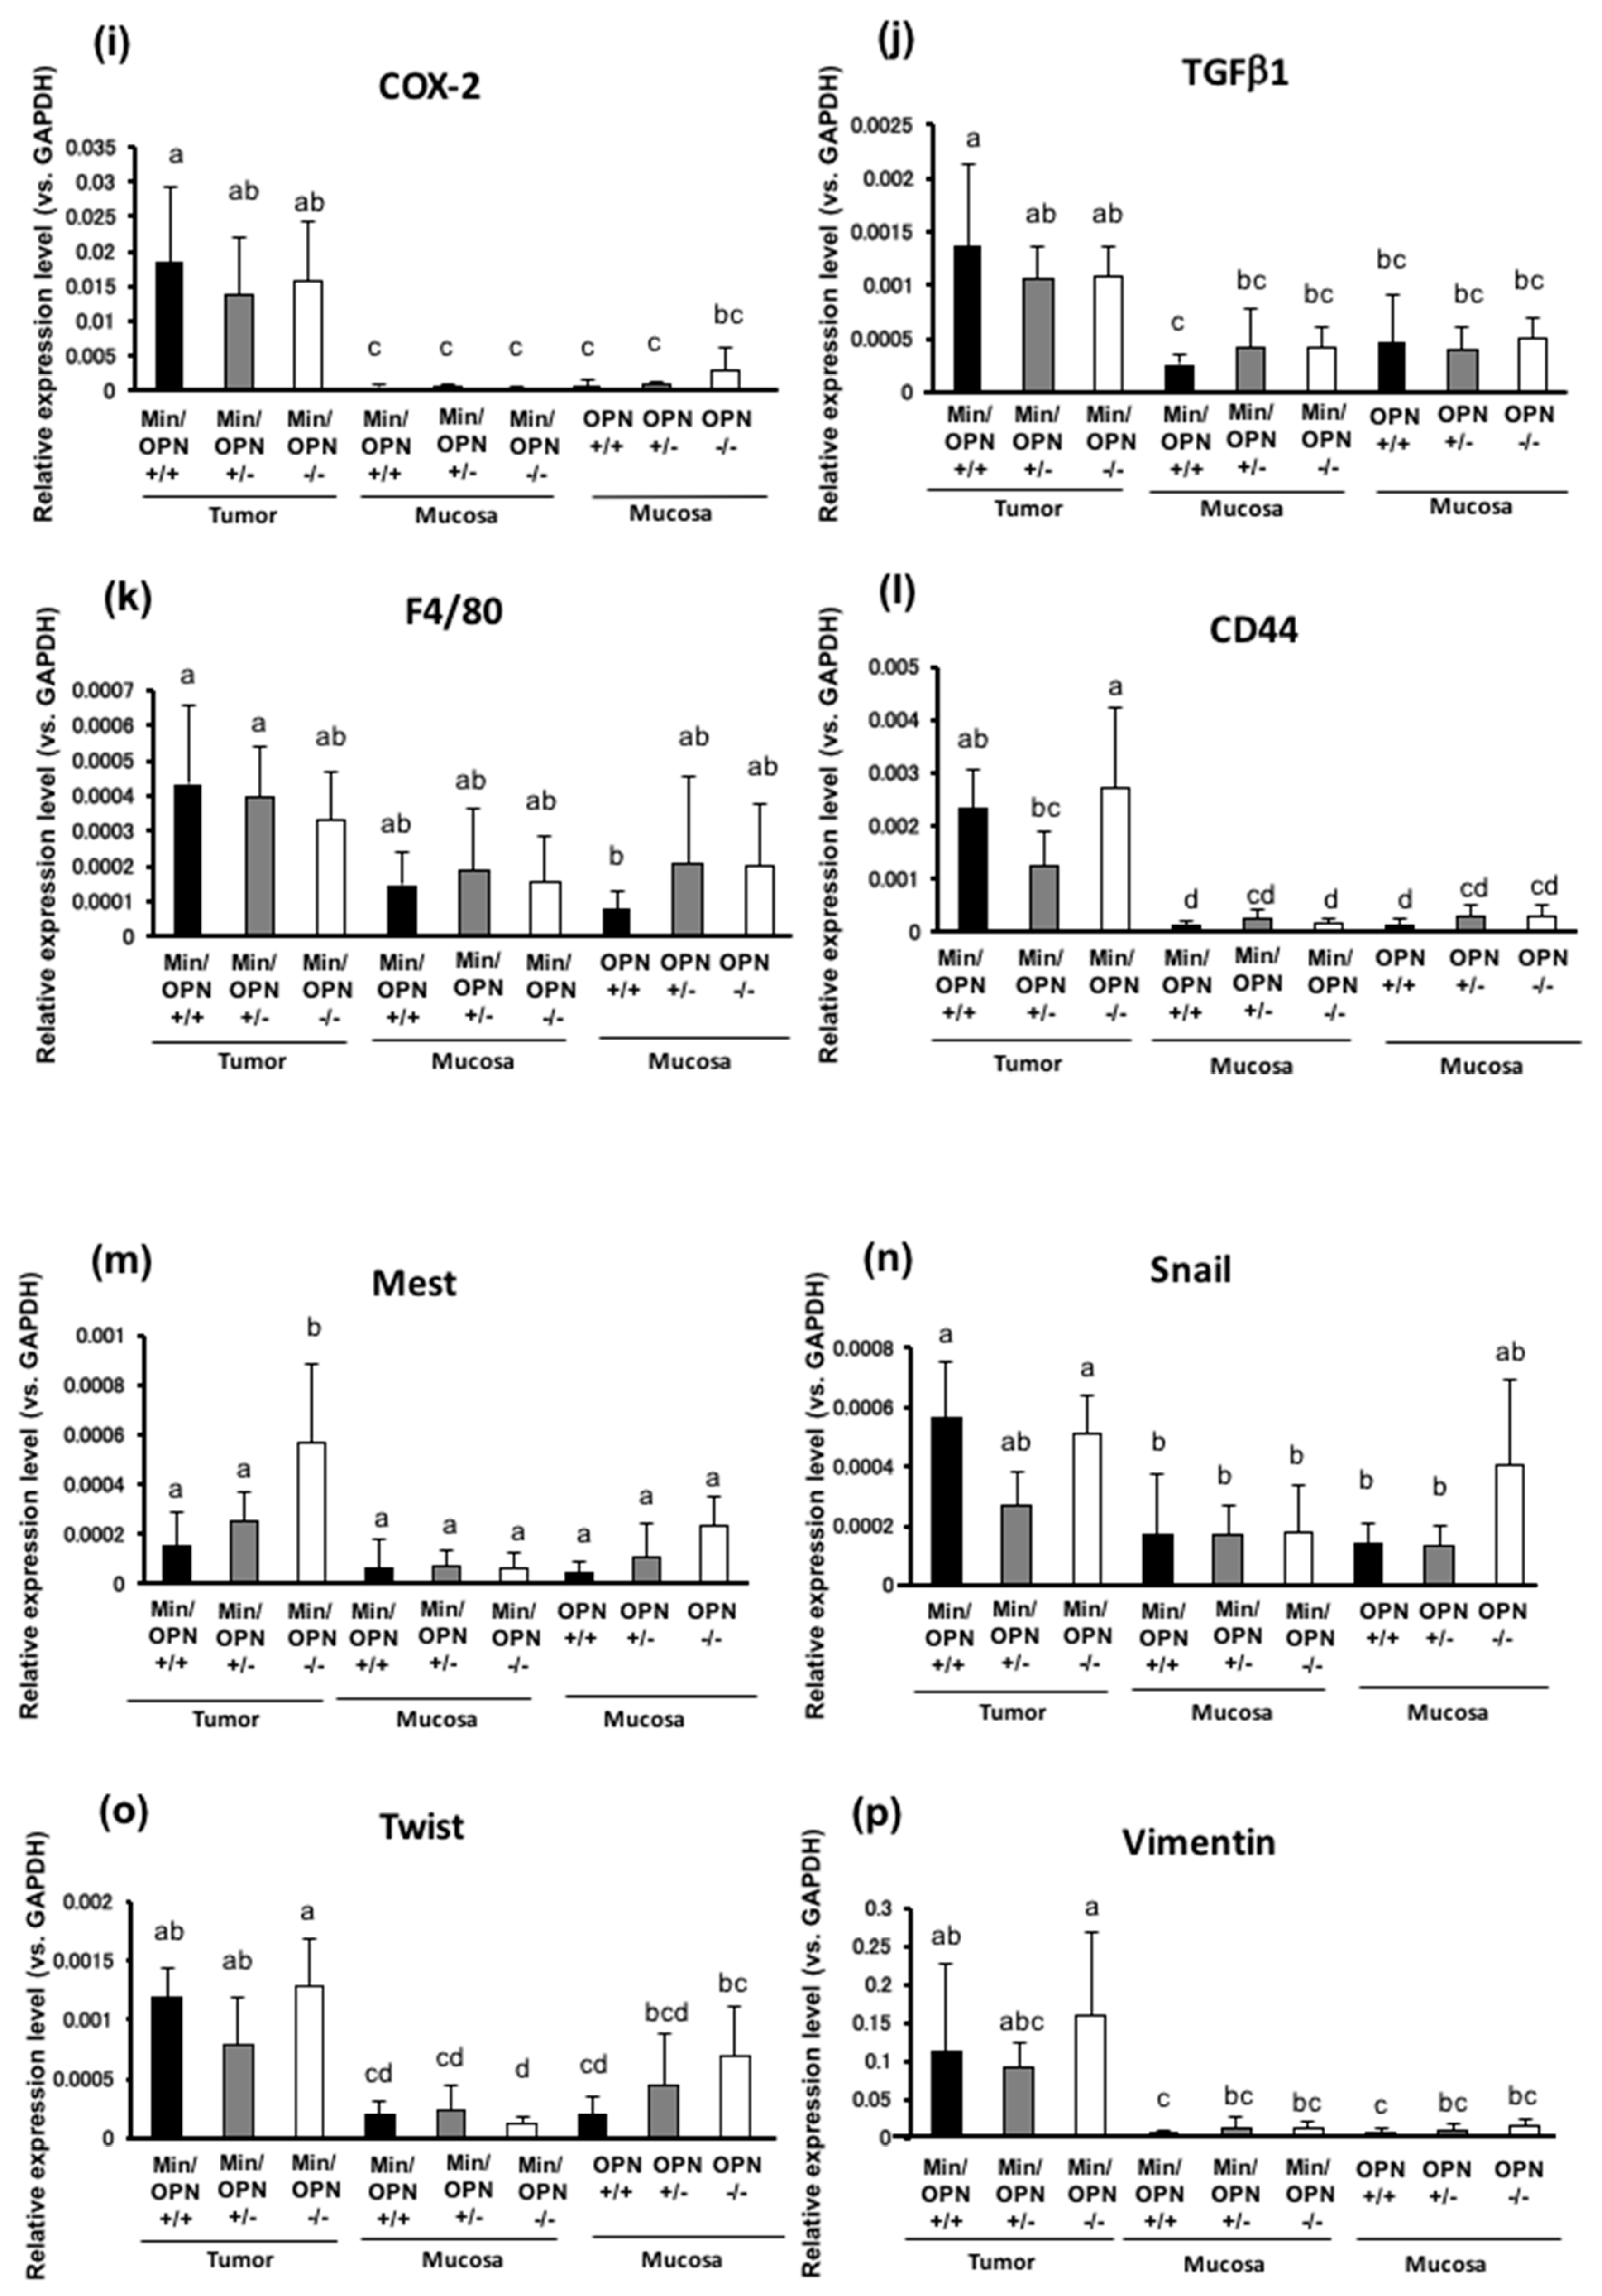
2.4. Effects of OPN deficiency on Gene Expression Levels in Colon Tumors

The effects of OPN deficiency on gene expression levels in colorectal tumors and non-tumorous colorectum were investigated by semi-quantitative reverse transcription-polymerase chain reaction (RT-PCR) analysis. OPN expression in colorectal tumors was strongly upregulated in Min/OPN(+/+) compared to the adjacent non-tumor part. These OPN levels were decreased in Min/OPN(+/−) and not detected in Min/OPN(−/−) (Figure 4a). OPN has been reported to activate MMPs. MMP-3, MMP-9, MMP-13, MMP-2, and MMP-7 were upregulated in colorectal tumors in Min/OPN(+/+) compared to adjacent non-tumor parts. The elevated expression levels of MMP-3 were decreased to almost half by hetero-knockout of OPN, and further decreased by homo-knockout (Figure 4b). The elevated expression levels of MMP-9 and MMP-13 were decreased to almost half by hetero-knockout of OPN, while a decrease by homo-knockout of OPN was slight and not significant (Figure 4c,d). On the other hand, MMP-2 and MMP-7 expression levels in the colorectal tumors were further increased by OPN deficiency (Figure 4e,f). Expression levels of cell survival/growth-related genes, Bcl-2, CyclinD1, COX-2, and transforming growth factor (TGF) β1 were higher in colorectal tumors than those in adjacent colorectal mucosa in Min/OPN(+/+) mice. Those expression levels in the colorectal tumors were slightly decreased in Min/OPN(+/−) and Min/OPN(−/−) mice (Figure 4g–j). Expression of a macrophage marker F4/80 in colorectal tumors was also slightly lowered in Min/OPN(+/−) and Min/OPN(−/−) mice (Figure 4k). CD44, a target of Wnt signaling [37] and a receptor of OPN, was upregulated in tumors in Min/OPN(+/+) mice, and the expression was decreased to almost half by hetero-knockout of OPN, but not by homo-knockout (Figure 4l). Interestingly, expression of mesoderm-specific transcript (Mest)/paternally expressed gene 1 (Peg1), an inhibitory factor of Wnt signaling [38], was inversely associated with OPN dose in tumors, and it was significantly elevated in tumors compared with adjacent non-tumor parts in Min/OPN(−/−) mice (Figure 4m). Expression levels of EMT-related genes, Snail and Twist, were higher in colorectal tumors than those in adjacent colorectal mucosa in Min/OPN(+/+) mice, and those were decreased in Min/OPN(+/−) mice, but not in Min/OPN(−/−) mice (Figure 4n,o). Vimentin expression was also upregulated in tumors in Min/OPN(+/+) mice, and further increased in Min/OPN(−/−) mice (Figure 4p).

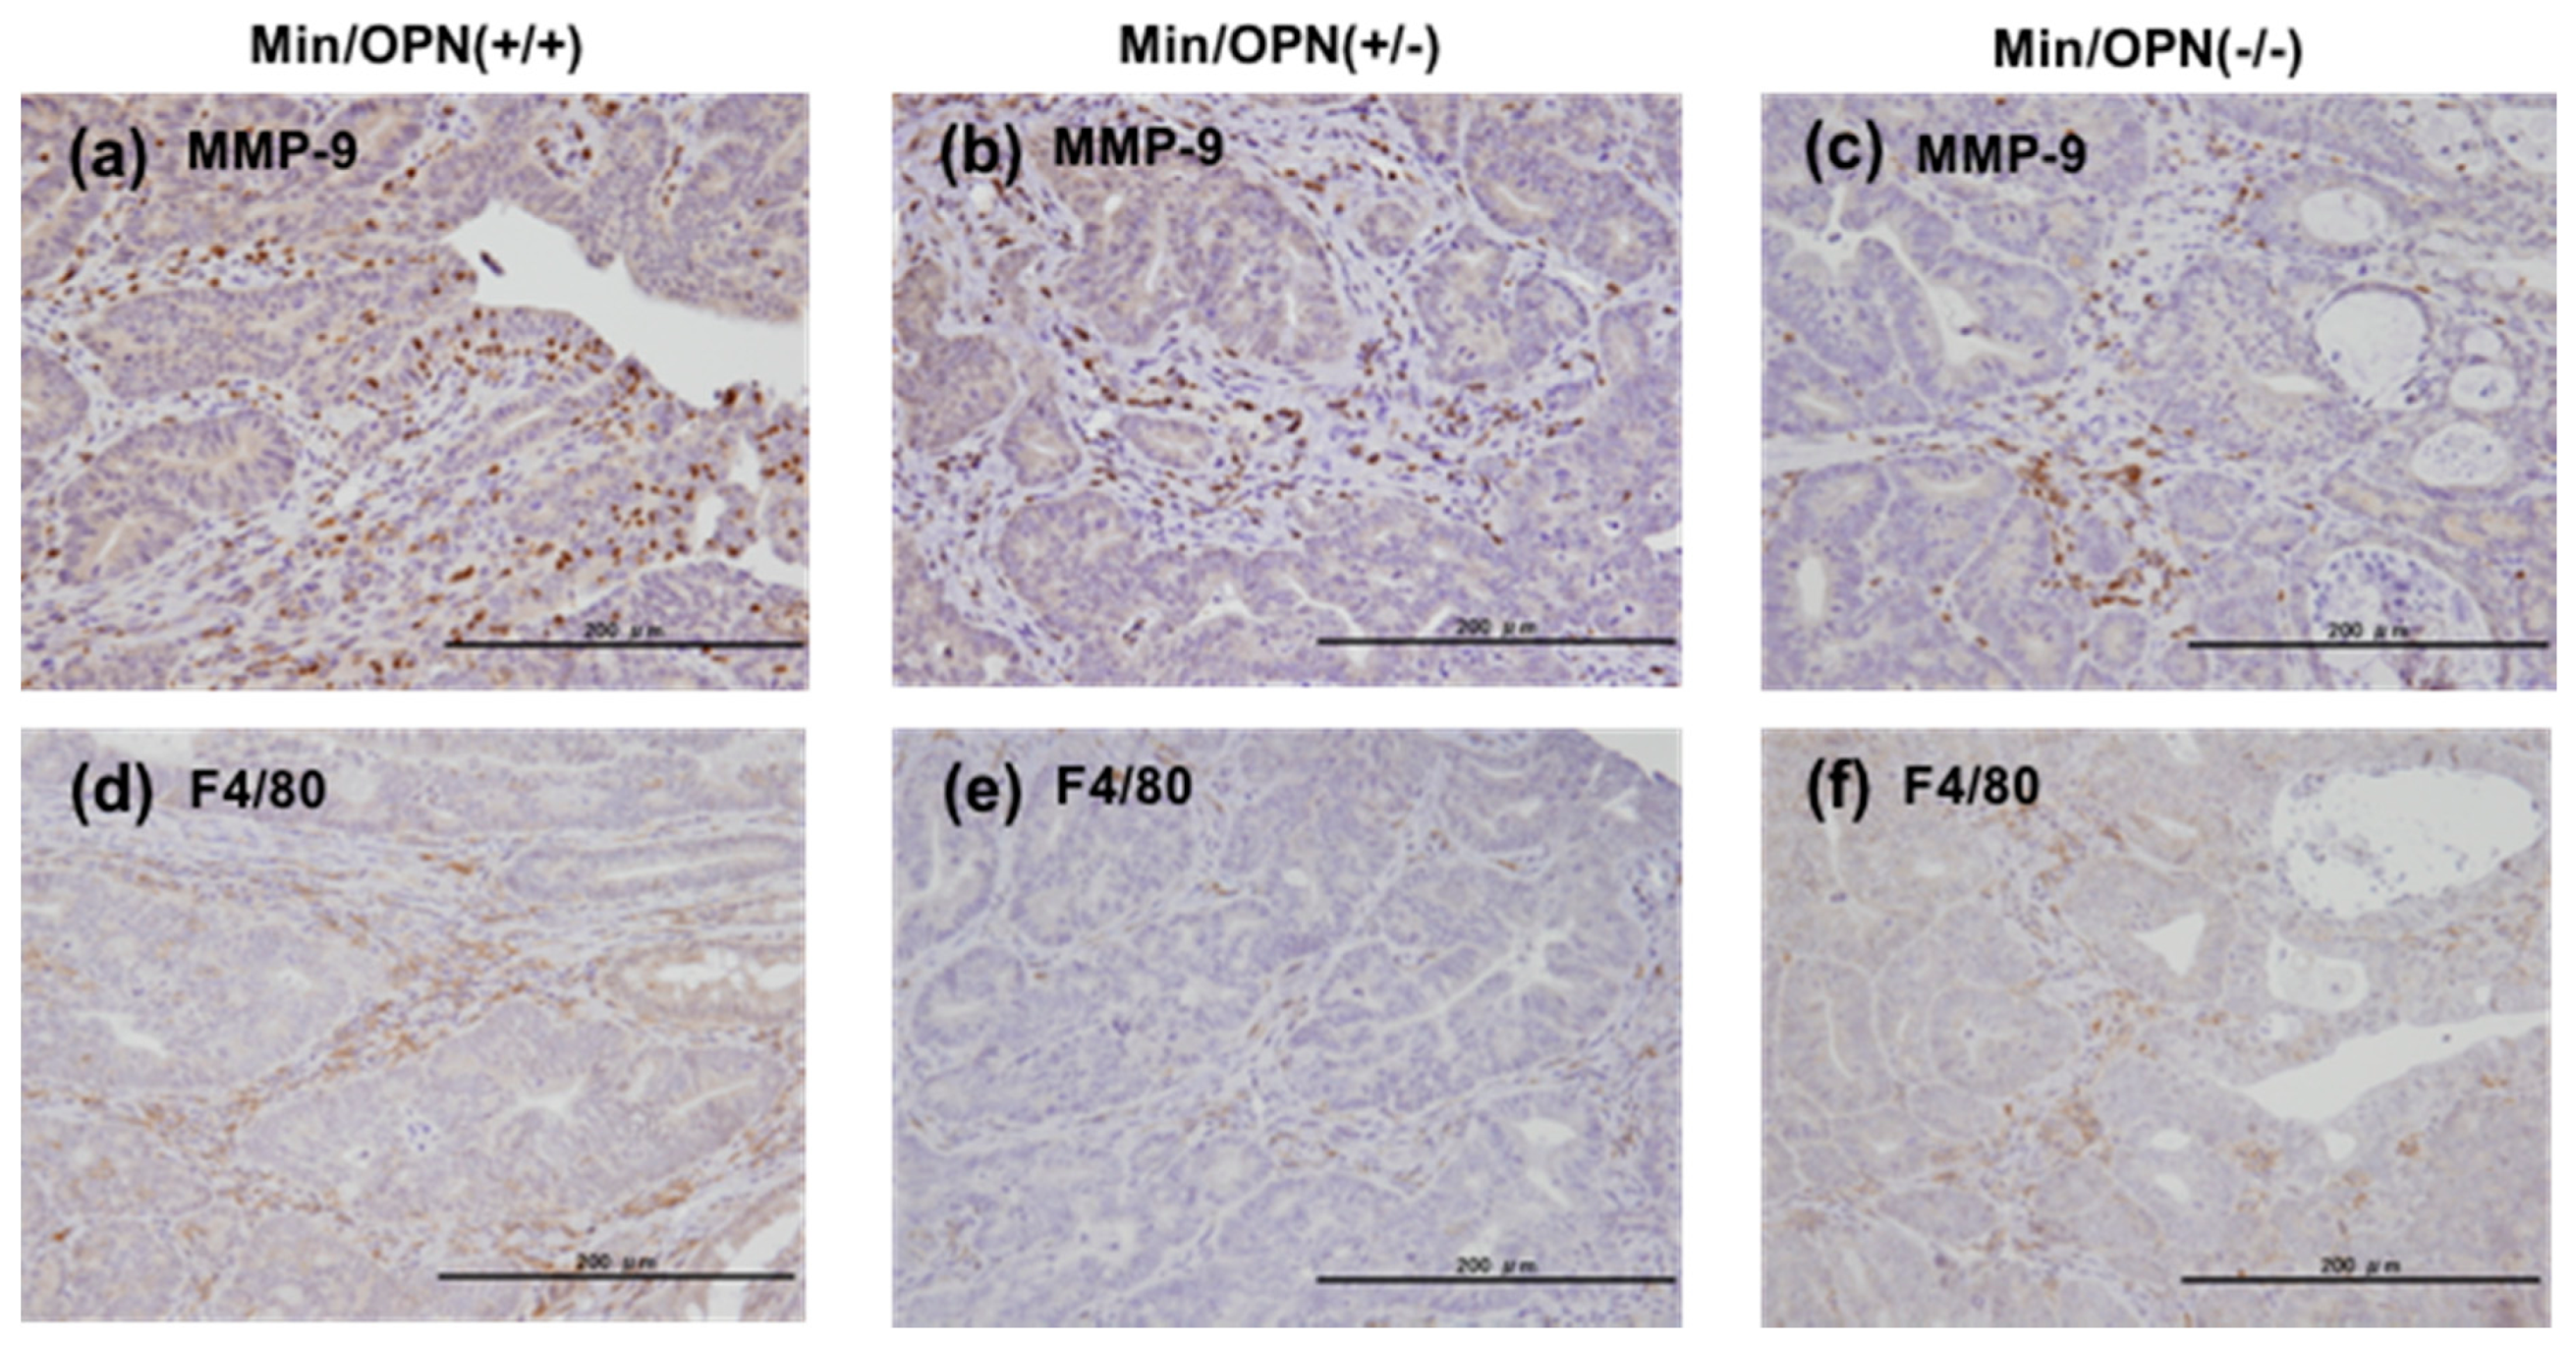
2.5. Protein Expression in Colon Tumors

Protein expressions in colorectal tumors in Min/OPN(+/+), Min/OPN(+/−), and Min/OPN(−/−) mice were examined by immunohistochemical staining. MMP-9 expression was observed strongly in stromal infiltrating neutrophils, and weakly in cancer cells in tumor tissue in Min/OPN(+/+) mice (Figure 5a). Lower expression of MMP-9 was observed in tumor tissue in Min/OPN(+/−) and Min/OPN(−/−) mice (Figure 5b,c). F4/80-positive macrophages were observed to be accumulated in tumor stroma in Min/OPN(+/+) mice (Figure 5d), and lower numbers of macrophages were observed in Min/OPN(+/−) and Min/OPN(−/−) mice (Figure 5e,f).

3. Discussion

In the present study, OPN-deficient Min mice showed decline in the number and size of small intestinal polyps compared to those of Min/OPN(+/+) mice in both males and females at the age of 16 weeks. Furthermore, OPN-deficient Min mice exhibited decreased incidence, multiplicity, and size of colorectal tumors. OPN expression was markedly elevated in colorectal tumors compared with that in adjacent normal colon mucosa in Min/OPN(+/+) mice, and that decreased with the OPN gene dosage. Elevated expressions of MMP-3, MMP-9, and MMP-13 in colorectal tumors in Min/OPN(+/+) mice were decreased by OPN deficiency. MMP-9 expression was observed in tumor cells and tumor-infiltrating neutrophils in Min/OPN(+/+) mice. Macrophage marker F4/80 in colorectal tumors was also lowered by OPN deficiency. These results indicate that OPN could enhance tumorigenesis in part by upregulating MMPs and increasing tumor-infiltrating neutrophils and macrophages, and could be a target for cancer prevention.
In Min mice, it has been reported that heterozygous disruption of the phosphatase and tensin homolog (PTEN) strongly induces OPN expression and promotes intestinal neoplasia [39]. Knockdown of OPN expression in human colon cancer cells suppresses cell proliferation, adherence, invasion, and expression of angiogenetic factors, such as VEGF, MMP-2, and MMP-9 [17]. It has been reported that tumor-infiltrating MMP-9-positive neutrophils enhance angiogenesis [40]. OPN is involved in neutrophil infiltration [41], and neutralization of OPN attenuates neutrophil migration [42]. OPN activates the phosphoinositide 3-kinase (PI3K)-phospo-Akt-nuclear factor (NF)-κB signaling pathway via α(v)β(3) integrin binding [43]. OPN promotes expression of MMP-13 through NF-κB signaling in osteoarthritis [44]. MMP-3 and MMP-13 is upregulated in human colorectal carcinomas [45], and MMP-13 activity is associated with poor prognosis in colorectal cancer [46]. OPN signaling also upregulates COX-2 expression via α(9)β(1) integrin [47]. Moreover, it has been reported that OPN activates JAK2/STAT3 signaling and upregulates Bcl-2 and cyclinD1 in human breast cancer cells [48]. OPN activates macrophages [13] and modulates EMT [12]. Consistent with these reports, elevated expression levels of MMP-3, MMP-9, and MMP-13 were lowered by OPN deficiency in the present study. Elevated expression levels of Bcl-2, CyclinD1, COX-2, TGF β1, and F4/80 in colorectal tumors in Min mice were only slightly lowered by OPN deficiency. Since Cyclin D1 and COX-2 are also known to be targets of β-catenin/Lef-1 [49,50], the effects of OPN knockout would be relatively small. On the other hand, elevated expressions of MMP-2 and MMP-7 in colorectal tumors in Min mice were not lowered but rather increased by OPN deficiency in the present study. Elevated expression of CD44 and EMT-related genes, Snail and Twist in tumors in Min/OPN(+/+) were lowered by OPN hetero-deficiency, but not by homo-deficiency. The reasons for this are uncertain. In the present study, we found that Mest, which has been reported to be an inhibitory factor of Wnt signaling [38] and has been upregulated in obese adipose tissue [51], was significantly elevated in colorectal tumors of Min/OPN(−/−) mice. It has been reported that leptin, an obesity-related factor, upregulates MMP-2 [52] and induces EMT [53]. As a bone marker, OPN is inversely associated with leptin in non-diabetic women [54]. Though the roles of Mest in tumorigenesis are unknown, we speculate that it may affect tumorigenesis via upregulation of MMPs and EMT-related genes in tumors in Min/OPN(−/−). We are now investigating the roles of Mest in tumorigenesis.
OPN is a secreted protein. The serum OPN levels in the Min/OPN(+/−) mice were almost half compared to those in Min/OPN(+/+) mice. Serum OPN was not detected in Min/OPN(−/−) mice. These results are consistent with the OPN gene dosage. The differences of serum OPN levels between mice with and without the Apc mutation, which are considered to be due to OPN production by intestinal tumors, were not particularly marked. This means that contribution of OPN produced in the tumors to the circulation levels of OPN was not high in Min mice. Min mice develop many polyps in the small intestine, but most of them are adenomas. Some colorectal tumors are carcinomas, but tumor volumes are relatively small. Besides cancer, OPN is expressed in a variety of tissues and cells including adipocytes and macrophages, and highly upregulated in inflammation [7]. This circulating OPN could also contribute to tumor development.
In the present study, serum IL-6 levels were elevated in mice bearing the Apc gene mutation, and that was lowered by homo-deficiency of OPN. Serum IL-6 levels positively correlate with progression of human colorectal cancer [55]. It has been reported that Min mice have elevated levels of circulating IL-6, which are decreased by exercise [36]. Min mice suffer from lymphodepletion between 83 and 120 days of age [56], and lymphodepletion could be associated with increased plasma IL-6 [57].
Epidemiological studies have shown that high serum TG levels are related with the risk of colorectal cancer [58,59]. Dysregulation of lipoprotein lipase (LPL) contributes to dyslipidemia, and LPL inducers, such as PPAR ligands, NO-1886, and indomethacin, have been shown to decrease TG levels and suppress tumor development in animal models [60]. Correlation between the level of TGs and the number of intestinal polyps was observed in the present study. In the OPN-deficient Min mice, serum TG levels tended to decrease with the OPN-gene dosage. It has been reported that osteogenic differentiation gene OPN and adipogenic differentiation gene LPL are oppositely regulated in mesenchymal stem cells [61,62]. These findings indicate that the depletion of OPN could affect development of small intestinal polyps and colorectal tumors in part through decreasing the inflammatory status and hypertriglyceridemia.
It has been reported that OPN is involved in high fat-induced insulin resistance and OPN deficiency protects against insulin resistance [22]. Therefore, insulin levels in the mice used in the present study were measured, but statistically significant differences were not observed (data not shown).
Intestinal polyposis causes anemia in Min mice [63], and as a result, extramedullary hematopoiesis in the spleen occurs [64,65]. Therefore, spleen weights in Min mice positively correlate with intestinal polyp numbers. Contrary to this, OPN deficiency increased spleen weight without an increase in polyp numbers and size in the present study. The reason is unclear. It has been reported that myocardial angiogenic response is impaired in the absence of OPN [66]. To recover the anemia, aggressive extramedullary hematopoiesis may play some roles in OPN-deficient Min mice.
Chronic inflammation is known to be a risk factor for cancer. Helicobacter pylori infection, which causes chronic gastritis, is closely associated with gastric cancer risk [67,68]. OPN depletion decreases inflammation and gastric epithelial proliferation during Helicobacter pylori infection in mice [69], and suppresses MNU and Helicobacter pylori-induced gastric cancer development [29]. As for colorectal cancer, inflammatory bowel diseases (IBDs), including ulcerative colitis (UC) and Crohn’s disease (CD), are well-known risk factors [70,71,72]. Increased levels of circulating and colonic tissue OPN in human IBD and experimentally-induced colitis in mice have been observed [73,74,75,76,77,78]. However, results of experimental studies about the effects of OPN deficiency on dextran sulfate sodium (DSS)-induced colitis are controversial. It has been reported that OPN deficiency exacerbates tissue destruction in DSS-induced acute colitis [74,79], and another report has shown that OPN deficiency protects mice from DSS-induced colitis [80]. In contrast to acute colitis, OPN-null mice are protected from mucosal inflammation during chronic colitis [74]. These findings suggest that OPN is a two-sided mediator of intestinal inflammation [74] and participates in both inflammation and mucosal protection in IBDs [73]. Thus, effects of OPN deficiency on colitis-associated colorectal carcinogenesis are unclear, and it is considered that suppression of mucosal protective effects of OPN may enhance colitis-associated colorectal carcinogenesis. OPN could be a target for tumor prevention under weak and chronic inflammation, such as in obesity, but when there are severe injury and acute inflammation, complete depletion of OPN should not be recommended. In the present study, suppressive effects of hetero-deficiency of OPN on intestinal tumor formation in Min mice were slightly higher than those of homo-deficiency. Since OPN plays important roles in many tissues and cells, complete suppression may cause adverse effects. Moreover, we speculate that Mest, which was found to be elevated in tumors in Min/OPN(−/−) mice, may affect tumorigenesis. It has been reported that OPN deficiency is linked to a reduced immune response [8]. Post-transcriptional activation of OPN by MMPs could also affect OPN functions. These points may have roles to play in the differential response. Roles of OPN in early stages of colorectal tumorigenesis and ways to prevent colorectal cancer development via OPN suppression should be further investigated.

4. Materials and Methods

4.1. Animals and Diets

Male and female C57BL/6-ApcMin/+ mice (Min mice) and B6.129S6(Cg)-Spp1tmlBlh/J (JR#004936) (OPN(−/−) mice) (those were backcrossed to background C57BL/6 for 10 generations) were purchased from Jackson Laboratories (Bar Harbor, ME, USA). Min mice were mated with OPN(−/−) mice to generate Min/OPN(+/−) mice. Then, the Min/OPN(+/−) mice were crossed with OPN(+/−) mice to obtain Min/OPN(+/+), Min/OPN(+/−), Min/OPN(−/−), OPN(+/+), OPN(+/−), and OPN(−/−) as littermates. Since Apc-homo-deficient mice are embryonic lethal, all Min/OPN(+/+), Min/OPN(+/−), and Min/OPN(−/−) mice are Apc hetero-deficient. Offspring were genotyped by PCR as previously reported [33,81]. All mice were housed in plastic cages with sterilized softwood chips as bedding in a barrier-sustained animal room with controlled conditions of humidity (55%), light (12/12 h light/dark cycle), and temperature (24 ± 2 °C). Basal diet AIN-76A and water were available ad libitum. The animals were observed daily for clinical signs and mortality. The experiments were performed according to the “Guidelines for Animal Experiments of the National Cancer Center” and were approved by the Institutional Ethics Review Committee for Animal Experimentation of the National Cancer Center (permission code: T07-012, approval date: 1 April 2007). Diluted isoflurane [82] was used to anaesthetize the animals.

4.2. Analysis of Intestinal Polyps

At 16 weeks old, mice were anesthetized, and blood samples were collected from the abdominal vein. The intestinal tract was removed and separated into the small intestine, cecum, and colon. The small intestine was divided into the proximal segment (4 cm in length) and the proximal (middle) and distal halves of the remainder. These segments were opened longitudinally and fixed flat between sheets of filter paper in 10% buffered formalin. The numbers and sizes of polyps and their distributions in the intestine were assessed with a stereoscopic microscope. The colon was opened longitudinally and observed colon tumors were collected. A half part of each colon tumor was stored at −80 °C for PCR analysis, and the other half was fixed with 10% buffered formalin and embedded in paraffin. Paraffin sections were stained with hematoxylin and eosin for histological examination. The remaining intestinal mucosa (non-polyp part) was removed by scraping, and then stored at −80 °C.

4.3. Measurement of Mouse Serum Parameter Levels

Serum concentrations of OPN (R&D Systems, Minneapolis, MN, USA) and IL-6 (BioSource International, Inc., Camarillo, CA, USA) were determined by enzyme-linked immunoassays according to the manufacturer’s protocol. The serum levels of TGs were measured using the Fuji Dri-Chem system (Fujifilm, Tokyo, Japan).

4.4. Quantitative RT-PCR Analysis

The mRNA expression levels of OPN, MMP-3, MMP-9, MMP-13, MMP-2, MMP-7, Bcl-2, CyclinD1, COX-2, TGF β1, F4/80, CD44, Mest, Snail, Twist, and Vimentin were examined in colorectal tumors (n = 5~6 for each group) and non-lesional colorectal mucosa (n = 6 for each group). Total RNA was extracted from the tissue samples using TRIZOL® Reagent (Life Technologies, Japan). After RNA purification, aliquots of total RNA (2 µg) were subjected to the RT reaction with oligo-dT and hexamer random primers in a final volume of 20 µL using an iScript TM cDNA Synthesis Kit (Bio-Rad Lab., Hercules, CA, USA). Quantitative real-time RT-PCR was performed in a final volume of 10 µL with aliquots of cDNA (10 ng) using SsoAdvancedTM Universal SYBR® Green Supermix (Bio-Rad Laboratories, Inc., Hercules, CA) and a PTC-200 DNA engine cycler equipped with a CFD-3220 Opticon 2 detector (MJ Research Inc., St. Bruno, Quebec, Canada) for fluorescence detection. The primers used were selected from the mouse cDNA sequences of GAPDH, OPN, MMP-3, MMP-9, MMP-13, MMP-2, MMP-7, Bcl-2, CyclinD1, COX-2, TGF β1, F4/80, CD44, Mest, Snail, Twist and Vimentin: 5’-primer: 5’-TCAAGAAGGTGGTGAAGCAG-3’, 3’-primer: 5’-TCCACCACCCTGTTGCTGTA-3’ (product size, 203 bp) for GAPDH; 5’-primer: 5’-CTTGCGCCACAGAATGCTG-3’, 3’-primer: 5’-TGACCTCAGTCCATAAGCCA-3’ (product size, 303 bp) for OPN; 5’-primer: 5’-CGTTTCCATCTCTCTCAAGATG-3’, 3’-primer: 5’-GTTAGACTTGGTGGGTACCA-3’ (product size, 99 bp) for MMP-3; 5’-primer: 5’-TGTACCGCTATGGTTACAC-3’, 3’-primer: 5’-CGACACCAAACTGGATGAC-3’ (product size, 372 bp) for MMP-9; 5’-primer: 5’-GATGATGAAACCTGGACAAG-3’, 3’-primer: 5’-GCCAGTGTAGGTATAGATGG-3’ (product size, 138 bp) for MMP-13; 5’-primer: 5’-TCAAGTTCCCCGGCGATGTC-3’, 3’-primer: 5’-AGTTGGCCACATCTGGGTTG-3’ (product size, 225 bp) for MMP-2; 5’-primer: 5’-TGTGGAGTGCCACATGTTGC-3’, 3’-primer: 5’-GTGTTCCCTGGCCCATCAAA-3’ (product size, 266 bp) for MMP-7; 5’-primer: 5’-AGCTGCACCTGACGCCCTTCAC-3’, 3’-primer: 5’-TCCACACACATGACCCCACCGA-3’ (product size, 127 bp) for Bcl-2; 5’-primer: 5’-CCATGGAACACCAGCTCCTG-3’, 3’-primer: 5’-CGGTCCAGGTAGTTCATGGC-3’ (product size, 187 bp) for CyclinD1; 5’-primer: 5’-AATGAGTACCGCAAACGCTT-3’, 3’-primer: 5’-GAGAGACTGAATTGAGGCAG-3’ (product size, 323 bp) for COX-2; 5’-primer: 5’-TTCCTGCTTCTCATGGCCACCC-3’, 3’-primer: 5’-TGCCGCACGCAGCAGTTCTT-3’ (product size, 122 bp) for TGF β1; 5’-primer: 5’-CCTGGACGAATCCTGTGAAG-3’, 3’-primer, 5’-GGTGGGACCACAGAGAGTTG-3’ (product size, 64 bp) for F4/80; 5’-primer: 5’-CTGGATCAGGCATTGATGATG-3’, 3’-primer: 5’-GCCATCCTGGTGGTTGTCTG-3’ (product size, 157 bp) for CD44; 5’-primer: 5’-CTGAGAGTGAGCTGTGGGAC-3’, 3’-primer: 5’-GGCAGCGTTTTCCTGTACAG-3’ (product size, 220 bp) for Mest; 5’-primer: 5’-CATCCGAAGCCACACGCTG-3’, 3’-primer: 5’-CGCAGGTTGGAGCGGTCA-3’ (product size, 256 bp) for Snail; 5’-primer: 5’-GATGGCAAGCTGCAGCTATG-3’, 3’-primer: 5’-CAGCTCCAGAGTCTCTAGAC-3’ (product size, 193 bp) for Twist; 5’-GATTCAGGAACAGCATGTCC-3’, 3’-primer: 5’-CATCCACTTCACAGGTGAG-3’ (product size, 251 bp) for Vimentin. The cycling conditions were as follows: 95 °C for 3 min, 40 cycles of 94 °C for 10 s, 60 °C (GAPDH, OPN, MMP2, Bcl-2, CyclinD1, TGF β1, F4/80, Mest, Vimentin), 55 °C (MMP-3, MMP-9, MMP-13, MMP-7, COX-2, Twist), or 65 °C (CD44, Snail) for 20 s, 72 °C for 20 s, and 79 °C for 2 s. The fluorescence intensity of SYBR Green I was measured at 79 °C at every cycle. To assess the specificity of each primer set, amplicons generated from the PCR reaction were analyzed for melting curves. Finally, the PCR products were analyzed by 2% agarose gel electrophoresis with ethidium bromide staining to confirm the correct sizes. Quantification of OPN, MMP-3, MMP-9, MMP-13, MMP-2, MMP-7, Bcl-2, CyclinD1, COX-2, TGF β1, F4/80, CD44, Mest, Snail, Twist, and Vimentin relative to GAPDH was performed by ΔΔCt method.

4.5. Immunohistochemical Staining of Colon Tumors

Paraffin-embedded tissue sections of colorectal tumors were used for immunohistochemical analyses with the avidin-biotin complex immunoperoxidase technique after heating with 10 mM citrate buffer (pH 6.0). As the primary antibodies, polyclonal rabbit anti-MMP-9 immunoglobulin G (IgG) (Chemicon, Temecula, CA, USA) and anti-F4/80 IgG (Santa Cruz Biotechnology, Santa Cruz, CA, USA) were used at 100× and 200× dilution, respectively. As the secondary antibody, biotinylated anti-rabbit IgG (H+L) raised in a goat, affinity purified, (Vector Laboratories Inc., Burlingame, CA, USA) was employed at 200× dilution. Staining was performed using avidin-biotin reagents (Vectastain ABC reagents; Vector Laboratories Inc., Burlingame, CA, USA), 3,3’-diaminobenzidine, and hydrogen peroxide. The sections were counterstained with hematoxylin. As a negative control, duplicate sections were immunostained without exposure to the primary antibody.

4.6. Statistical Analysis

The significance of differences in the incidences of colon tumors was analyzed using Fisher’s exact probability test. Other results are expressed as mean ± standard deviation (SD) and statistically analyzed using one-way analysis of variance (ANOVA), followed by Tukey-Kramer multiple comparison post-hoc test. Correlation of serum TG levels or spleen weights with polyp numbers was analyzed by the Pearson correlation test or Spearman’s rank correlation coefficient test. Differences were considered to be statistically significant at p < 0.05.

5. Conclusions

OPN expression was upregulated in colon tumors in Apc-deficient mice and OPN-knockout significantly suppressed tumor development. Though OPN was not essential for tumor formation, it was indicated that OPN is involved in early stage intestinal tumorigenesis in part by upregulation of MMP-3, MMP-9, and MMP-13, and infiltration of macrophages and neutrophils. OPN could be a target for cancer prevention.

Supplementary Materials

The following is available online at www.mdpi.com/1422-0067/18/5/1058/s1, Figure S1: Effects of OPN deficiency on body and spleen weights, Figure S2: A macroscopic view of the colorectum of (a) male Min/OPN(+/+), (b) male Min/OPN(+/−), (c) male Min/OPN(−/−), (d) female Min/OPN(+/+), (e) female Min/OPN(+/−), and (f) female Min/OPN(−/−).

Acknowledgments

This work was supported in part by a grant of the Third-Term Comprehensive 10-Year Strategy for Cancer Control from the Ministry of health, Labor, and Welfare of Japan; Grants-in-Aid from the Foundation of Promotion of Cancer Research; the National Cancer Center Research and Development Fund (21-2-1); a Grant-in-Aid for Scientific Research from the Japan Society for the Promotion of Science (22590371); and also supported by the National Cancer Center Research Core facility. Shinji Takasu was a recipient of Research Resident Fellowships from the Foundation for Promotion of Cancer Research during the performance of this research.

Author Contributions

Mami Takahashi conceived and designed the experiments; Rikako Ishigamori and Masami Komiya performed the experiments; Rikako Ishigamori, Michihiro Mutoh, and Shinji Takasu analyzed the data; Michihiro Mutoh, Toshio Imai, and Mami Takahashi contributed reagents/materials/analysis tools; Rikako Ishigamori and Mami Takahashi wrote the paper. Authorship has been limited to those who have contributed substantially to the work reported.

Conflicts of Interest

The authors declare no conflict of interest.

References

  1. Lee, J.L.; Wang, M.J.; Sudhir, P.R.; Chen, G.D.; Chi, C.W.; Chen, J.Y. Osteopontin promotes integrin activation through outside-in and inside-out mechanisms: OPN-CD44V interaction enhances survival in gastrointestinal cancer cells. Cancer Res. 2007, 67, 2089–2097. [Google Scholar] [CrossRef] [PubMed]
  2. Todaro, M.; Gaggianesi, M.; Catalano, V.; Benfante, A.; Iovino, F.; Biffoni, M.; Apuzzo, T.; Sperduti, I.; Volpe, S.; Cocorullo, G.; et al. CD44v6 is a marker of constitutive and reprogrammed cancer stem cells driving colon cancer metastasis. Cell Stem Cell 2014, 14, 342–356. [Google Scholar] [CrossRef] [PubMed]
  3. Brown, L.F.; Papadopoulos-Sergiou, A.; Berse, B.; Manseau, E.J.; Tognazzi, K.; Perruzzi, C.A.; Dvorak, H.F.; Senger, D.R. Osteopontin expression and distribution in human carcinomas. Am. J. Pathol. 1994, 145, 610–623. [Google Scholar] [PubMed]
  4. Coppola, D.; Szabo, M.; Boulware, D.; Muraca, P.; Alsarraj, M.; Chambers, A.F.; Yeatman, T.J. Correlation of osteopontin protein expression and pathological stage across a wide variety of tumor histologies. Clin. Cancer Res. 2004, 10, 184–190. [Google Scholar] [CrossRef] [PubMed]
  5. Fedarko, N.S.; Jain, A.; Karadag, A.; van Eman, M.R.; Fisher, L.W. Elevated serum bone sialoprotein and osteopontin in colon, breast, prostate, and lung cancer. Clin. Cancer Res. 2001, 7, 4060–4066. [Google Scholar] [PubMed]
  6. Cantor, H.; Shinohara, M.L. Regulation of T-helper-cell lineage development by osteopontin: The inside story. Nat. Rev. Immunol. 2009, 9, 137–141. [Google Scholar] [CrossRef] [PubMed]
  7. Rittling, S.R. Osteopontin in macrophage function. Expert Rev. Mol. Med. 2011, 13, e15. [Google Scholar] [CrossRef] [PubMed]
  8. Wang, K.X.; Denhardt, D.T. Osteopontin: role in immune regulation and stress responses. Cytokine Growth Factor Rev. 2008, 19, 333–345. [Google Scholar] [CrossRef] [PubMed]
  9. Anborgh, P.H.; Mutrie, J.C.; Tuck, A.B.; Chambers, A.F. Role of the metastasis-promoting protein osteopontin in the tumour microenvironment. J. Cell. Mol. Med. 2010, 14, 2037–2044. [Google Scholar] [CrossRef] [PubMed]
  10. Rittling, S.R.; Chambers, A.F. Role of osteopontin in tumour progression. Br. J. Cancer 2004, 90, 1877–1881. [Google Scholar] [CrossRef] [PubMed]
  11. Rohde, F.; Rimkus, C.; Friederichs, J.; Rosenberg, R.; Marthen, C.; Doll, D.; Holzmann, B.; Siewert, J.R.; Janssen, K.P. Expression of osteopontin, a target gene of de-regulated Wnt signaling, predicts survival in colon cancer. Int. J. Cancer 2007, 121, 1717–1723. [Google Scholar] [CrossRef] [PubMed]
  12. Kothari, A.N.; Arffa, M.L.; Chang, V.; Blackwell, R.H.; Syn, W.K.; Zhang, J.; Mi, Z.; Kuo, P.C. Osteopontin-A Master Regulator of Epithelial-Mesenchymal Transition. J. Clin. Med. 2016, 5, 39. [Google Scholar] [CrossRef] [PubMed]
  13. Hsu, H.P.; Shan, Y.S.; Lai, M.D.; Lin, P.W. Osteopontin-positive infiltrating tumor-associated macrophages in bulky ampullary cancer predict survival. Cancer Biol. Ther. 2010, 10, 144–154. [Google Scholar] [CrossRef] [PubMed]
  14. Irby, R.B.; McCarthy, S.M.; Yeatman, T.J. Osteopontin regulates multiple functions contributing to human colon cancer development and progression. Clin. Exp. Metastasis 2004, 21, 515–523. [Google Scholar] [CrossRef] [PubMed]
  15. Huang, J.; Pan, C.; Hu, H.; Zheng, S.; Ding, L. Osteopontin-enhanced hepatic metastasis of colorectal cancer cells. PLoS ONE 2012, 7, e47901. [Google Scholar] [CrossRef] [PubMed]
  16. Wai, P.Y.; Mi, Z.; Guo, H.; Sarraf-Yazdi, S.; Gao, C.; Wei, J.; Marroquin, C.E.; Clary, B.; Kuo, P.C. Osteopontin silencing by small interfering RNA suppresses in vitro and in vivo CT26 murine colon adenocarcinoma metastasis. Carcinogenesis 2005, 26, 741–751. [Google Scholar] [CrossRef] [PubMed]
  17. Wu, X.L.; Lin, K.J.; Bai, A.P.; Wang, W.X.; Meng, X.K.; Su, X.L.; Hou, M.X.; Dong, P.D.; Zhang, J.J.; Wang, Z.Y.; et al. Osteopontin knockdown suppresses the growth and angiogenesis of colon cancer cells. World J. Gastroenterol. 2014, 20, 10440–10448. [Google Scholar] [CrossRef] [PubMed]
  18. Shevde, L.A.; Das, S.; Clark, D.W.; Samant, R.S. Osteopontin: an effector and an effect of tumor metastasis. Curr. Mol. Med. 2010, 10, 71–81. [Google Scholar] [CrossRef] [PubMed]
  19. Bandopadhyay, M.; Bulbule, A.; Butti, R.; Chakraborty, G.; Ghorpade, P.; Ghosh, P.; Gorain, M.; Kale, S.; Kumar, D.; Kumar, S.; et al. Osteopontin as a therapeutic target for cancer. Expert Opin. Ther. Targets 2014, 18, 883–895. [Google Scholar] [CrossRef] [PubMed]
  20. Johnston, N.I.; Gunasekharan, V.K.; Ravindranath, A.; O’Connell, C.; Johnston, P.G.; El-Tanani, M.K. Osteopontin as a target for cancer therapy. Front. Biosci. 2008, 13, 4361–4372. [Google Scholar] [CrossRef] [PubMed]
  21. Bardou, M.; Barkun, A.N.; Martel, M. Obesity and colorectal cancer. Gut 2013, 62, 933–947. [Google Scholar] [CrossRef] [PubMed]
  22. Tsugane, S.; Inoue, M. Insulin resistance and cancer: epidemiological evidence. Cancer Sci. 2010, 101, 1073–1079. [Google Scholar] [CrossRef] [PubMed]
  23. Chapman, J.; Miles, P.D.; Ofrecio, J.M.; Neels, J.G.; Yu, J.G.; Resnik, J.L.; Wilkes, J.; Talukdar, S.; Thapar, D.; Johnson, K.; et al. Osteopontin is required for the early onset of high fat diet-induced insulin resistance in mice. PLoS ONE 2010, 5, e13959. [Google Scholar] [CrossRef] [PubMed]
  24. Zeyda, M.; Gollinger, K.; Todoric, J.; Kiefer, F.W.; Keck, M.; Aszmann, O.; Prager, G.; Zlabinger, G.J.; Petzelbauer, P.; Stulnig, T.M. Osteopontin is an activator of human adipose tissue macrophages and directly affects adipocyte function. Endocrinology 2011, 152, 2219–2227. [Google Scholar] [CrossRef] [PubMed]
  25. Lancha, A.; Rodriguez, A.; Catalan, V.; Becerril, S.; Sainz, N.; Ramirez, B.; Burrell, M.A.; Salvador, J.; Fruhbeck, G.; Gomez-Ambrosi, J. Osteopontin deletion prevents the development of obesity and hepatic steatosis via impaired adipose tissue matrix remodeling and reduced inflammation and fibrosis in adipose tissue and liver in mice. PLoS ONE 2014, 9, e98398. [Google Scholar] [CrossRef] [PubMed]
  26. Tardelli, M.; Zeyda, K.; Moreno-Viedma, V.; Wanko, B.; Grun, N.G.; Staffler, G.; Zeyda, M.; Stulnig, T.M. Osteopontin is a key player for local adipose tissue macrophage proliferation in obesity. Mol. Metab. 2016, 5, 1131–1137. [Google Scholar] [CrossRef] [PubMed]
  27. Kiefer, F.W.; Zeyda, M.; Gollinger, K.; Pfau, B.; Neuhofer, A.; Weichhart, T.; Saemann, M.D.; Geyeregger, R.; Schlederer, M.; Kenner, L.; et al. Neutralization of osteopontin inhibits obesity-induced inflammation and insulin resistance. Diabetes 2010, 59, 935–946. [Google Scholar] [CrossRef] [PubMed]
  28. Catalan, V.; Gomez-Ambrosi, J.; Rodriguez, A.; Ramirez, B.; Izaguirre, M.; Hernandez-Lizoain, J.L.; Baixauli, J.; Marti, P.; Valenti, V.; Moncada, R.; et al. Increased Obesity-Associated Circulating Levels of the Extracellular Matrix Proteins Osteopontin, Chitinase-3 Like-1 and Tenascin C Are Associated with Colon Cancer. PLoS ONE 2016, 11, e0162189. [Google Scholar] [CrossRef] [PubMed]
  29. Lee, S.H.; Park, J.W.; Go, D.M.; Kim, H.K.; Kwon, H.J.; Han, S.U.; Kim, D.Y. Ablation of osteopontin suppresses N-methyl-N-nitrosourea and Helicobacter pylori-induced gastric cancer development in mice. Carcinogenesis 2015, 36, 1550–1560. [Google Scholar] [PubMed]
  30. Lee, S.H.; Park, J.W.; Woo, S.H.; Go, D.M.; Kwon, H.J.; Jang, J.J.; Kim, D.Y. Suppression of osteopontin inhibits chemically induced hepatic carcinogenesis by induction of apoptosis in mice. Oncotarget 2016, 7, 87219–87231. [Google Scholar] [CrossRef] [PubMed]
  31. Miyaki, M.; Konishi, M.; Kikuchi-Yanoshita, R.; Enomoto, M.; Igari, T.; Tanaka, K.; Muraoka, M.; Takahashi, H.; Amada, Y.; Fukayama, M.; et al. Characteristics of somatic mutation of the adenomatous polyposis coli gene in colorectal tumors. Cancer Res. 1994, 54, 3011–3020. [Google Scholar] [PubMed]
  32. Morin, P.J.; Sparks, A.B.; Korinek, V.; Barker, N.; Clevers, H.; Vogelstein, B.; Kinzler, K.W. Activation of β-catenin-Tcf signaling in colon cancer by mutations in β-catenin or APC. Science 1997, 275, 1787–1790. [Google Scholar] [CrossRef] [PubMed]
  33. Moser, A.R.; Pitot, H.C.; Dove, W.F. A dominant mutation that predisposes to multiple intestinal neoplasia in the mouse. Science 1990, 247, 322–324. [Google Scholar] [CrossRef] [PubMed]
  34. Niho, N.; Takahashi, M.; Kitamura, T.; Shoji, Y.; Itoh, M.; Noda, T.; Sugimura, T.; Wakabayashi, K. Concomitant suppression of hyperlipidemia and intestinal polyp formation in Apc-deficient mice by peroxisome proliferator-activated receptor ligands. Cancer Res. 2003, 63, 6090–6095. [Google Scholar] [PubMed]
  35. Hodgson, A.; Wier, E.M.; Fu, K.; Sun, X.; Wan, F. Ultrasound imaging of splenomegaly as a proxy to monitor colon tumor development in Apcmin716/+ mice. Cancer Med 2016, 5, 2469–2476. [Google Scholar] [CrossRef] [PubMed]
  36. Mehl, K.A.; Davis, J.M.; Clements, J.M.; Berger, F.G.; Pena, M.M.; Carson, J.A. Decreased intestinal polyp multiplicity is related to exercise mode and gender in ApcMin/+ mice. J. Appl. Physioi. 2005, 98, 2219–2225. [Google Scholar] [CrossRef] [PubMed]
  37. Wielenga, V.J.; Smits, R.; Korinek, V.; Smit, L.; Kielman, M.; Fodde, R.; Clevers, H.; Pals, S.T. Expression of CD44 in Apc and Tcf mutant mice implies regulation by the WNT pathway. Am. J. Pathol. 1999, 154, 515–523. [Google Scholar] [CrossRef]
  38. Jung, H.; Lee, S.K.; Jho, E.H. Mest/Peg1 inhibits Wnt signalling through regulation of LRP6 glycosylation. Biochem. J. 2011, 436, 263–269. [Google Scholar] [CrossRef] [PubMed]
  39. Shao, J.; Washington, M.K.; Saxena, R.; Sheng, H. Heterozygous disruption of the PTEN promotes intestinal neoplasia in APCmin/+ mouse: roles of osteopontin. Carcinogenesis 2007, 28, 2476–2483. [Google Scholar] [CrossRef] [PubMed]
  40. Bekes, E.M.; Schweighofer, B.; Kupriyanova, T.A.; Zajac, E.; Ardi, V.C.; Quigley, J.P.; Deryugina, E.I. Tumor-recruited neutrophils and neutrophil TIMP-free MMP-9 regulate coordinately the levels of tumor angiogenesis and efficiency of malignant cell intravasation. Am. J. Pathol. 2011, 179, 1455–1470. [Google Scholar] [CrossRef] [PubMed]
  41. Atai, N.A.; Bansal, M.; Lo, C.; Bosman, J.; Tigchelaar, W.; Bosch, K.S.; Jonker, A.; de Witt Hamer, P.C.; Troost, D.; McCulloch, C.A.; et al. Osteopontin is up-regulated and associated with neutrophil and macrophage infiltration in glioblastoma. Immunology 2011, 132, 39–48. [Google Scholar] [CrossRef] [PubMed]
  42. Hirano, Y.; Aziz, M.; Yang, W.L.; Wang, Z.; Zhou, M.; Ochani, M.; Khader, A.; Wang, P. Neutralization of osteopontin attenuates neutrophil migration in sepsis-induced acute lung injury. Crit. Care 2015, 19, 53. [Google Scholar] [CrossRef] [PubMed]
  43. Urtasun, R.; Lopategi, A.; George, J.; Leung, T.M.; Lu, Y.; Wang, X.; Ge, X.; Fiel, M.I.; Nieto, N. Osteopontin, an oxidant stress sensitive cytokine, up-regulates collagen-I via integrin αvβ3 engagement and PI3K/pAkt/NFκB signaling. Hepatology 2012, 55, 594–608. [Google Scholar] [CrossRef] [PubMed]
  44. Li, Y.; Jiang, W.; Wang, H.; Deng, Z.; Zeng, C.; Tu, M.; Li, L.; Xiao, W.; Gao, S.; Luo, W.; et al. Osteopontin promotes expression of matrix metalloproteinase 13 through NF-κB signaling in osteoarthritis. BioMed Res. Int. 2016, 2016, 6345656. [Google Scholar] [CrossRef] [PubMed]
  45. Roeb, E.; Arndt, M.; Jansen, B.; Schumpelick, V.; Matern, S. Simultaneous determination of matrix metalloproteinase (MMP)-7, MMP-1, -3, and -13 gene expression by multiplex PCR in colorectal carcinomas. Int. J. Colorectal Dis. 2004, 19, 518–524. [Google Scholar] [CrossRef] [PubMed]
  46. Leeman, M.F.; McKay, J.A.; Murray, G.I. Matrix metalloproteinase 13 activity is associated with poor prognosis in colorectal cancer. J. Clin. Pathol. 2002, 55, 758–762. [Google Scholar] [CrossRef] [PubMed]
  47. Kale, S.; Raja, R.; Thorat, D.; Soundararajan, G.; Patil, T.V.; Kundu, G.C. Osteopontin signaling upregulates cyclooxygenase-2 expression in tumor-associated macrophages leading to enhanced angiogenesis and melanoma growth via α9β1 integrin. Oncogene 2014, 33, 2295–2306. [Google Scholar] [CrossRef] [PubMed]
  48. Behera, R.; Kumar, V.; Lohite, K.; Karnik, S.; Kundu, G.C. Activation of JAK2/STAT3 signaling by osteopontin promotes tumor growth in human breast cancer cells. Carcinogenesis 2010, 31, 192–200. [Google Scholar] [CrossRef] [PubMed]
  49. Nunez, F.; Bravo, S.; Cruzat, F.; Montecino, M.; de Ferrari, G.V. Wnt/β-catenin signaling enhances cyclooxygenase-2 (COX2) transcriptional activity in gastric cancer cells. PLoS ONE 2011, 6, e18562. [Google Scholar] [CrossRef] [PubMed]
  50. Tetsu, O.; McCormick, F. β-Catenin regulates expression of cyclin D1 in colon carcinoma cells. Nature 1999, 398, 422–426. [Google Scholar] [PubMed]
  51. Takahashi, M.; Kamei, Y.; Ezaki, O. Mest/Peg1 imprinted gene enlarges adipocytes and is a marker of adipocyte size. Am. J. Physiol. Endocrinol. Metab. 2005, 288, E117–E124. [Google Scholar] [CrossRef] [PubMed]
  52. Ahn, J.H.; Choi, Y.S.; Choi, J.H. Leptin promotes human endometriotic cell migration and invasion by up-regulating MMP-2 through the JAK2/STAT3 signaling pathway. Mol. Hum. Reprod. 2015, 21, 792–802. [Google Scholar] [CrossRef] [PubMed]
  53. Yan, D.; Avtanski, D.; Saxena, N.K.; Sharma, D. Leptin-induced epithelial-mesenchymal transition in breast cancer cells requires β-catenin activation via Akt/GSK3- and MTA1/Wnt1 protein-dependent pathways. J. Biol. Chem. 2012, 287, 8598–8612. [Google Scholar] [CrossRef] [PubMed]
  54. Saucedo, R.; Rico, G.; Vega, G.; Basurto, L.; Cordova, L.; Galvan, R.; Hernandez, M.; Puello, E.; Zarate, A. Osteocalcin, under-carboxylated osteocalcin and osteopontin are not associated with gestational diabetes mellitus but are inversely associated with leptin in non-diabetic women. J. Endocrinol. Investig. 2015, 38, 519–526. [Google Scholar] [CrossRef] [PubMed]
  55. Chung, Y.C.; Chang, Y.F. Serum interleukin-6 levels reflect the disease status of colorectal cancer. J. Surg. Oncol. 2003, 83, 222–226. [Google Scholar] [CrossRef] [PubMed]
  56. Coletta, P.L.; Muller, A.M.; Jones, E.A.; Muhl, B.; Holwell, S.; Clarke, D.; Meade, J.L.; Cook, G.P.; Hawcroft, G.; Ponchel, F.; et al. Lymphodepletion in the ApcMin/+ mouse model of intestinal tumorigenesis. Blood 2004, 103, 1050–1058. [Google Scholar] [CrossRef] [PubMed]
  57. Condomines, M.; Veyrune, J.L.; Larroque, M.; Quittet, P.; Latry, P.; Lugagne, C.; Hertogh, C.; Kanouni, T.; Rossi, J.F.; Klein, B. Increased plasma-immune cytokines throughout the high-dose melphalan-induced lymphodepletion in patients with multiple myeloma: a window for adoptive immunotherapy. J. Immunol. 2010, 184, 1079–1084. [Google Scholar] [CrossRef] [PubMed]
  58. Inoue, M.; Noda, M.; Kurahashi, N.; Iwasaki, M.; Sasazuki, S.; Iso, H.; Tsugane, S. Impact of metabolic factors on subsequent cancer risk: results from a large-scale population-based cohort study in Japan. Eur. J. Cancer Prev. 2009, 18, 240–247. [Google Scholar] [CrossRef] [PubMed]
  59. Otani, T.; Iwasaki, M.; Ikeda, S.; Kozu, T.; Saito, H.; Mutoh, M.; Wakabayashi, K.; Tsugane, S. Serum triglycerides and colorectal adenoma in a case-control study among cancer screening examinees. Cancer Causes Control 2006, 17, 1245–1252. [Google Scholar] [CrossRef] [PubMed]
  60. Takasu, S.; Mutoh, M.; Takahashi, M.; Nakagama, H. Lipoprotein lipase as a candidate target for cancer prevention/therapy. Biochem. Res. Int. 2012, 2012, 398697. [Google Scholar] [CrossRef] [PubMed]
  61. An, Q.; Wu, D.; Ma, Y.; Zhou, B.; Liu, Q. Suppression of Evi1 promotes the osteogenic differentiation and inhibits the adipogenic differentiation of bone marrow-derived mesenchymal stem cells in vitro. Int. J. Mol. Med. 2015, 36, 1615–1622. [Google Scholar] [CrossRef] [PubMed]
  62. Zhang, K.; Zhang, F.J.; Zhao, W.J.; Xing, G.S.; Bai, X.; Wang, Y. Effects of parathyroid hormone-related protein on osteogenic and adipogenic differentiation of human mesenchymal stem cells. Eur. Rev. Med. Pharmacol. Sci. 2014, 18, 1610–1617. [Google Scholar] [PubMed]
  63. Qadri, S.M.; Mahmud, H.; Lang, E.; Gu, S.; Bobbala, D.; Zelenak, C.; Jilani, K.; Siegfried, A.; Foller, M.; Lang, F. Enhanced suicidal erythrocyte death in mice carrying a loss-of-function mutation of the adenomatous polyposis coli gene. J. Cell. Mol. Med. 2012, 16, 1085–1093. [Google Scholar] [CrossRef] [PubMed]
  64. Booker, C.D.; White, K.L., Jr. Benzo(a)pyrene-induced anemia and splenomegaly in NZB/WF1 mice. Food Chem. Toxicol. 2005, 43, 1423–1431. [Google Scholar] [CrossRef] [PubMed]
  65. Youngster, I.; Weiss, M.; Drobot, A.; Eitan, A. An unusual presacral mass: extramedullary hematopoiesis. J. Gastrointest. Surg. 2006, 10, 927–929. [Google Scholar] [CrossRef] [PubMed]
  66. Zhao, X.; Johnson, J.N.; Singh, K.; Singh, M. Impairment of myocardial angiogenic response in the absence of osteopontin. Microcirculation 2007, 14, 233–240. [Google Scholar] [CrossRef] [PubMed]
  67. Parsonnet, J.; Friedman, G.D.; Vandersteen, D.P.; Chang, Y.; Vogelman, J.H.; Orentreich, N.; Sibley, R.K. Helicobacter pylori infection and the risk of gastric carcinoma. N. Engl. J. Med. 1991, 325, 1127–1131. [Google Scholar] [CrossRef] [PubMed]
  68. Sipponen, P.; Kosunen, T.U.; Valle, J.; Riihela, M.; Seppala, K. Helicobacter pylori infection and chronic gastritis in gastric cancer. J. Clin. Pathol. 1992, 45, 319–323. [Google Scholar] [CrossRef] [PubMed]
  69. Park, J.W.; Lee, S.H.; Go du, M.; Kim, H.K.; Kwon, H.J.; Kim, D.Y. Osteopontin depletion decreases inflammation and gastric epithelial proliferation during Helicobacter pylori infection in mice. Lab. Investig. 2015, 95, 660–671. [Google Scholar] [CrossRef] [PubMed]
  70. Sharan, R.; Schoen, R.E. Cancer in inflammatory bowel disease. An evidence-based analysis and guide for physicians and patients. Gastroenterol. Clin. N. Am. 2002, 31, 237–254. [Google Scholar] [CrossRef]
  71. Solomon, M.J.; Schnitzler, M. Cancer and inflammatory bowel disease: Bias, epidemiology, surveillance, and treatment. World J. Surg. 1998, 22, 352–358. [Google Scholar] [CrossRef] [PubMed]
  72. Yoshino, T.; Nakase, H.; Takagi, T.; Bamba, S.; Okuyama, Y.; Kawamura, T.; Oki, T.; Obata, H.; Kawanami, C.; Katsushima, S.; et al. Risk factors for developing colorectal cancer in Japanese patients with ulcerative colitis: a retrospective observational study-CAPITAL (Cohort and Practice for IBD total management in Kyoto-Shiga Links) study I. BMJ Open Gastroenterol. 2016, 3, e000122. [Google Scholar] [CrossRef] [PubMed]
  73. Chen, F.; Liu, H.; Shen, Q.; Yuan, S.; Xu, L.; Cai, X.; Lian, J.; Chen, S.Y. Osteopontin: participation in inflammation or mucosal protection in inflammatory bowel diseases? Dig. Dis. Sci. 2013, 58, 1569–1580. [Google Scholar] [CrossRef] [PubMed]
  74. Heilmann, K.; Hoffmann, U.; Witte, E.; Loddenkemper, C.; Sina, C.; Schreiber, S.; Hayford, C.; Holzlohner, P.; Wolk, K.; Tchatchou, E.; et al. Osteopontin as two-sided mediator of intestinal inflammation. J. Cell. Mol. Med. 2009, 13, 1162–1174. [Google Scholar] [CrossRef] [PubMed]
  75. Komine-Aizawa, S.; Masuda, H.; Mazaki, T.; Shiono, M.; Hayakawa, S.; Takayama, T. Plasma osteopontin predicts inflammatory bowel disease activities. Int. Surg. 2015, 100, 38–43. [Google Scholar] [CrossRef] [PubMed]
  76. Masuda, H.; Takahashi, Y.; Asai, S.; Hemmi, A.; Takayama, T. Osteopontin expression in ulcerative colitis is distinctly different from that in Crohn’s disease and diverticulitis. J. Gastroenterol. 2005, 40, 409–413. [Google Scholar] [CrossRef] [PubMed]
  77. Mishima, R.; Takeshima, F.; Sawai, T.; Ohba, K.; Ohnita, K.; Isomoto, H.; Omagari, K.; Mizuta, Y.; Ozono, Y.; Kohno, S. High plasma osteopontin levels in patients with inflammatory bowel disease. J. Clin. Gastroenterol. 2007, 41, 167–172. [Google Scholar] [CrossRef] [PubMed]
  78. Sato, T.; Nakai, T.; Tamura, N.; Okamoto, S.; Matsuoka, K.; Sakuraba, A.; Fukushima, T.; Uede, T.; Hibi, T. Osteopontin/Eta-1 upregulated in Crohn’s disease regulates the Th1 immune response. Gut 2005, 54, 1254–1262. [Google Scholar] [CrossRef] [PubMed]
  79. Da Silva, A.P.; Pollett, A.; Rittling, S.R.; Denhardt, D.T.; Sodek, J.; Zohar, R. Exacerbated tissue destruction in DSS-induced acute colitis of OPN-null mice is associated with downregulation of TNF-α expression and non-programmed cell death. J. Cell. Physiol. 2006, 208, 629–639. [Google Scholar] [CrossRef] [PubMed]
  80. Zhong, J.; Eckhardt, E.R.; Oz, H.S.; Bruemmer, D.; de Villiers, W.J. Osteopontin deficiency protects mice from Dextran sodium sulfate-induced colitis. Inflamm. Bowel Dis. 2006, 12, 790–796. [Google Scholar] [CrossRef] [PubMed]
  81. Liaw, L.; Birk, D.E.; Ballas, C.B.; Whitsitt, J.S.; Davidson, J.M.; Hogan, B.L. Altered wound healing in mice lacking a functional osteopontin gene (spp1). J. Clin. Investig. 1998, 101, 1468–1478. [Google Scholar] [CrossRef] [PubMed]
  82. Nagate, T.; Chino, T.; Nishiyama, C.; Okuhara, D.; Tahara, T.; Maruyama, Y.; Kasahara, H.; Takashima, K.; Kobayashi, S.; Motokawa, Y.; et al. Diluted isoflurane as a suitable alternative for diethyl ether for rat anaesthesia in regular toxicology studies. J. Vet. Med. Sci. 2007, 69, 1137–1143. [Google Scholar] [CrossRef] [PubMed]
Figure 1. The effect of OPN deficiency on the size distribution of small intestinal polyps in Min mice. The number of polyps per mouse in each size class is given as a mean. Significant difference from Min/OPN(+/+) mice (* p < 0.05, ** p < 0.01).
Ijms 18 01058 g001
Figure 2. The effect of OPN deficiency on size distribution of colon tumors in Min mice. The number of tumors per mouse in each size class is given as a mean. Significant difference from Min/OPN(+/+) mice (* p < 0.05, ** p < 0.01).
Ijms 18 01058 g002
Figure 3. Scatter plots of serum triglyceride (TG) levels and intestinal polyp number in (a) Min/OPN(+/+), (b) Min/OPN(+/−), and (c) Min/OPN(−/−) mice, and (d) all genotypes. Scatter plots of spleen weight and intestinal polyp number in (e) Min/OPN(+/+), (f) Min/OPN(+/−), and (g) Min/OPN(−/−) mice, and (h) all genotypes. r, the Pearson correlation coefficient; rs, Spearman’s rank correlation coefficient; *, **, the correlation was statistically significant at p < 0.005, and p < 0.0005, respectively.
Ijms 18 01058 g003
Figure 4. Effects of OPN deficiency on mRNA expression levels. Values for relative mRNA expression levels (vs. glyceraldehyde 3-phosphate dehydrogenase (GAPDH) of (a) OPN, (b) matrix metalloproteinase (MMP)-3, (c) MMP-9, (d) MMP-13, (e) MMP-2, (f) MMP-7, (g) Bcl-2, (h) CyclinD1, (i) COX-2, (j) transforming growth factor (TGF) β1, (k) F4/80, (l) CD44, (m) Mest, (n) Snail, (o) Twist, and (p) Vimentin. Data are means ± SD. Values that do not share a common superscript are significantly different at p < 0.05.
Ijms 18 01058 g004aIjms 18 01058 g004b
Figure 5. Protein expression in colorectal tumor tissue. (ac) MMP-9 and (df) macrophage marker F4/80 were immunohistochemically stained in colorectal tumors in Min/OPN(+/+), Min/OPN(+/−), and Min/OPN(−/−) mice, respectively. Objective magnification: ×40.
Ijms 18 01058 g005
Table 1. Number of small intestinal polyps in osteopontin (OPN)-deficient Min mice.
GenotypeNo. of AnimalsSmall Intestinal Polyps
DuodenumMiddleDistalTotal
Male
 Min/OPN(+/+)155.1 ± 3.140.1 ± 33.9106.6 ± 66.6151.9 ± 101.8
 Min/OPN(+/−)295.0 ± 3.722.8 ± 16.972.7 ± 37.6100.5 ± 53.4
 Min/OPN(−/−)186.0 ± 2.527.4 ± 21.977.1 ± 42.9110.5 ± 63.9
Female
 Min/OPN(+/+)107.1 ± 4.540.1 ± 27.8106.9 ± 54.4154.1 ± 85.2
 Min/OPN(+/−)274.5 ± 2.322.2 ± 17.5 *65.0 ± 44.7 *91.7 ± 62.0 *
 Min/OPN(−/−)185.2 ± 3.328.2 ± 17.590.4 ± 44.3123.7 ± 61.9
Total
 Min/OPN(+/+)255.9 ± 3.840.1 ± 31.0106.7 ± 60.8152.8 ± 93.6
 Min/OPN(+/−)564.8 ± 3.122.5 ± 17.0 **69.0 ± 41.0 **96.3 ± 57.4 **
 Min/OPN(−/−)365.6 ± 2.927.8 ± 19.583.8 ± 43.5117.1 ± 62.4
OPN, osteopontin. Data are expressed as mean ± SD. Significant difference from Min/OPN(+/+) mice (* p < 0.05, ** p < 0.01).
Table 2. Incidence and multiplicity of colon tumors in OPN-deficient Min mice.
GenotypeAdenomaAdenocarcinomaTotal
Incidence (%)Multiplicity aIncidence (%)Multiplicity aIncidence (%)Multiplicity a
Male
Min/OPN(+/+)7/15 (47)1.0 ± 1.58/15 (53)0.7 ± 0.812/15 (80)1.7 ± 2.0
Min/OPN(+/−)4/29 (14) *0.1 ± 0.4 **13/29 (45)0.6 ± 0.816/29 (55)0.8 ± 0.8 *
Min/OPN(−/−)4/18 (22)0.2 ± 0.4 *8/18 (44)0.5 ± 0.611/18 (61)0.7 ± 0.7
Female
Min/OPN(+/+)4/10 (40)0.5 ± 0.77/10 (70)1.0 ± 0.98/10 (80)1.5 ± 1.3
Min/OPN(+/−)5/27 (19)0.2 ± 0.48/27 (30) *0.3 ± 0.6 *11/27 (41) *0.6 ± 0.7 *
Min/OPN(−/−)6/18 (33)0.4 ± 0.75/18 (28) *0.3 ± 0.6 *7/18 (39) *0.8 ± 1.2
Total
Min/OPN(+/+)11/25 (44)0.8 ± 1.215/25 (60)0.8 ± 0.920/25 (80)1.6 ± 1.7
Min/OPN(+/−)9/56 (16) **0.2 ± 0.4 **21/56 (38)0.5 ± 0.727/56 (48) **0.6 ± 0.8 **
Min/OPN(−/−)10/36 (28)0.3 ± 0.6 *13/36 (36)0.4 ± 0.618/36 (50) *0.8 ± 0.9 **
OPN, osteopontin. a Data are expressed as mean ± SD. Significant difference from Min/OPN(+/+) mice (* p < 0.05, ** p < 0.01).
Table 3. Effects of OPN deficiency on serum levels of OPN, interleukin (IL)-6, and triglycerides (TGs).
GenotypeSerum OPN (ng/mL)Serum IL-6 (pg/mL)Serum TGs (mg/dL)
Min/OPN(+/+)456.7 ± 144.7 a50.5 ± 16.7 a464 ± 383 a
Min/OPN(+/−)250.4 ± 73.4 b54.8 ± 27.7 a401 ± 454 a
Min/OPN(−/−)0 d22.8 ± 28.3 b360 ± 349 a
OPN(+/+)414.5 ± 192.9 a0 b94 ± 20 b
OPN(+/−)182.3 ± 88.2 c5.0 ± 14.6 b91 ± 25 b
OPN(−/−)0 d0 b97 ± 61 b
Data are means ± SD. Values that do not share a common superscript are significantly different at p < 0.01, except serum IL-6 levels in Min/OPN(+/+) and Min/OPN(+/−) (p < 0.05).

