
Transcriptomic Analysis of Calcium Remodeling in Colorectal Cancer


Abstract
:
1. Introduction
2. Results and Discussion
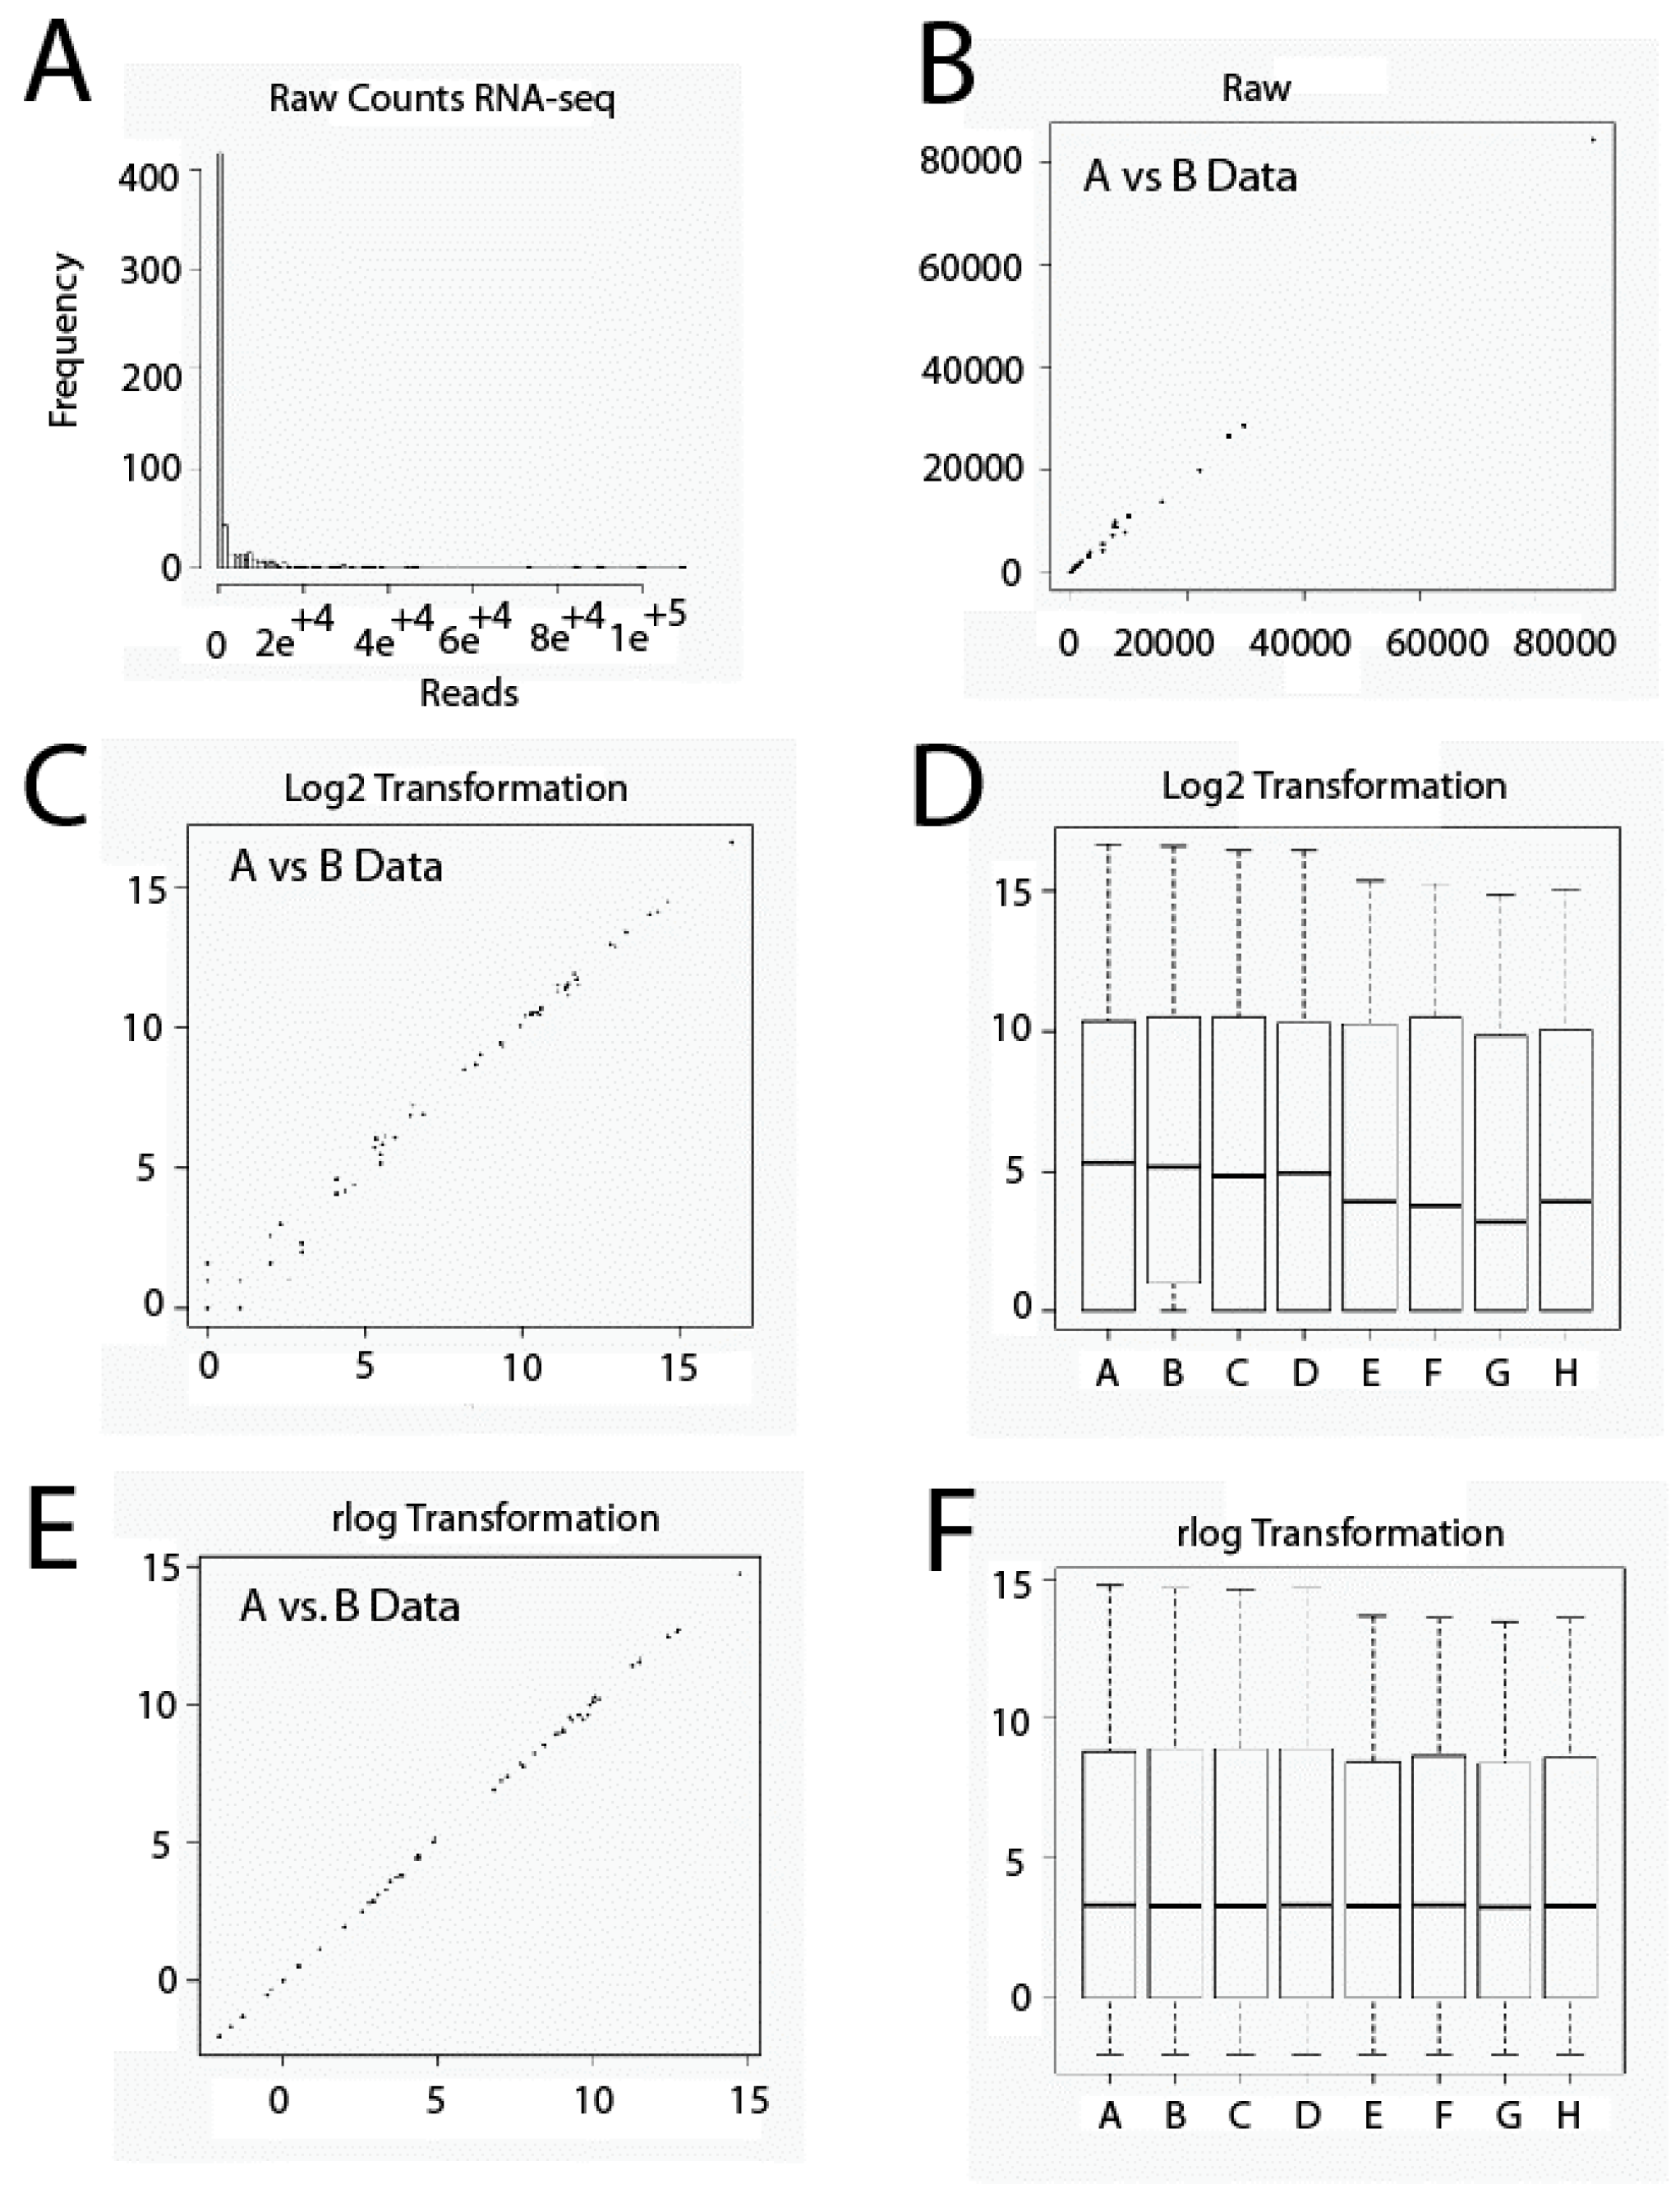
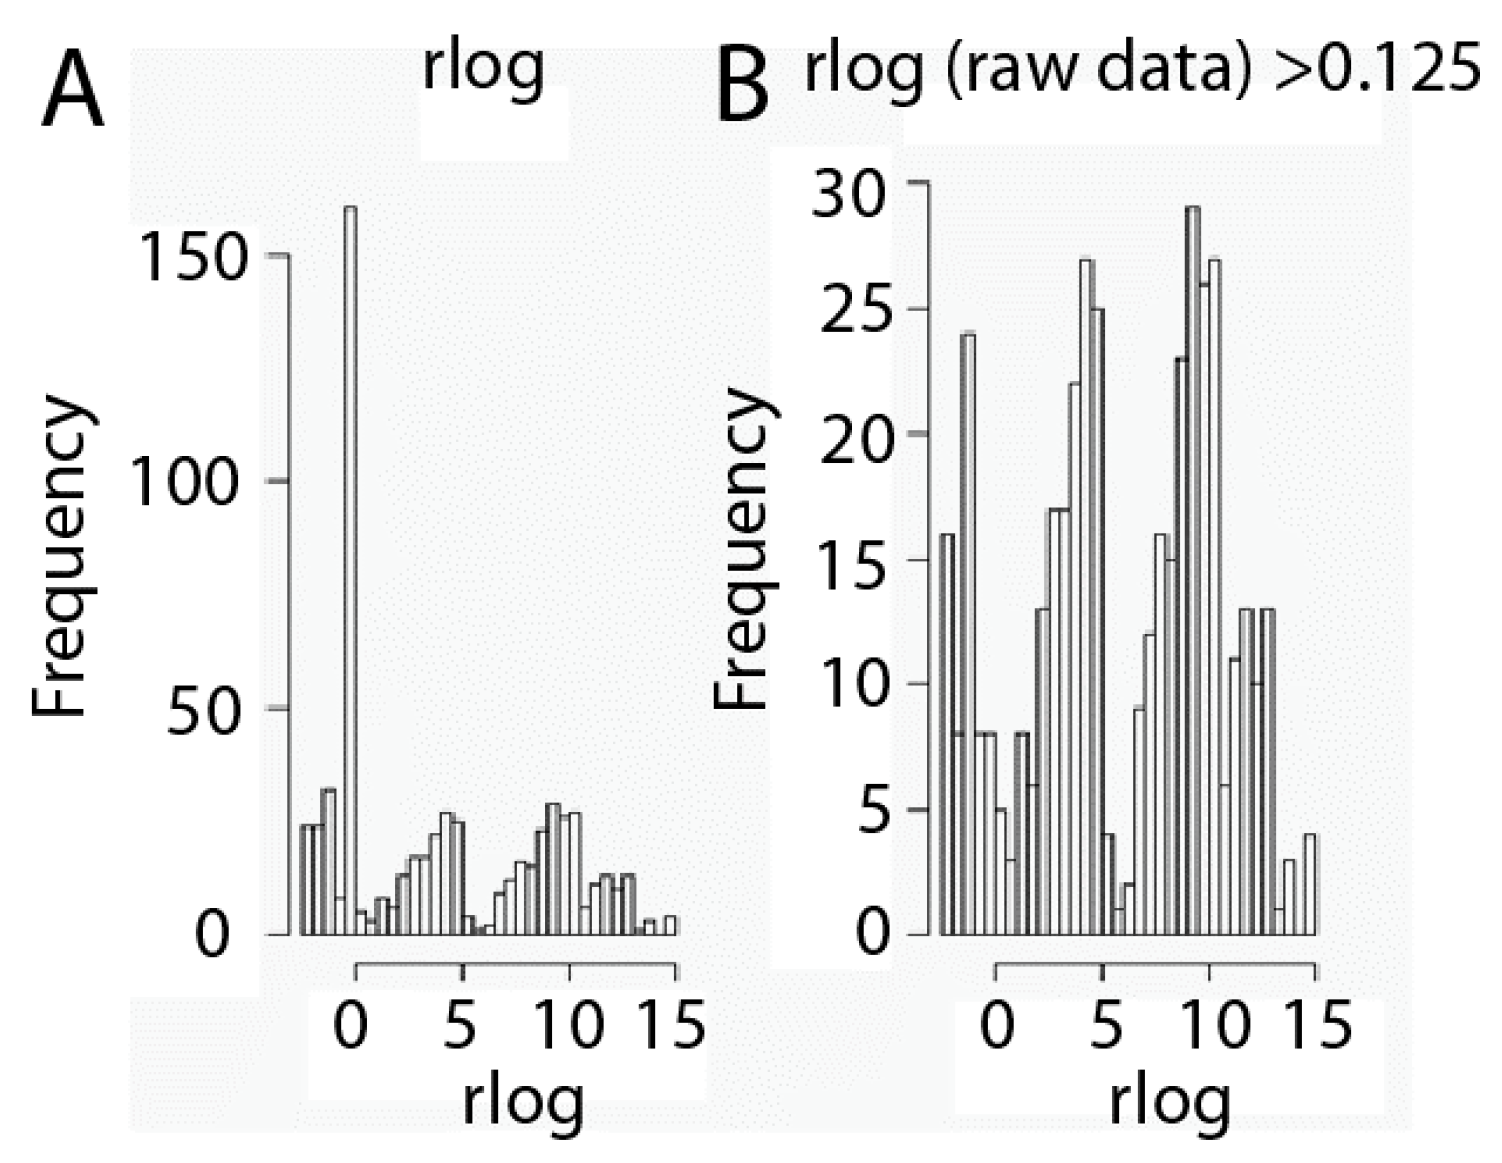
2.1. Data Set Transformation and Filtering
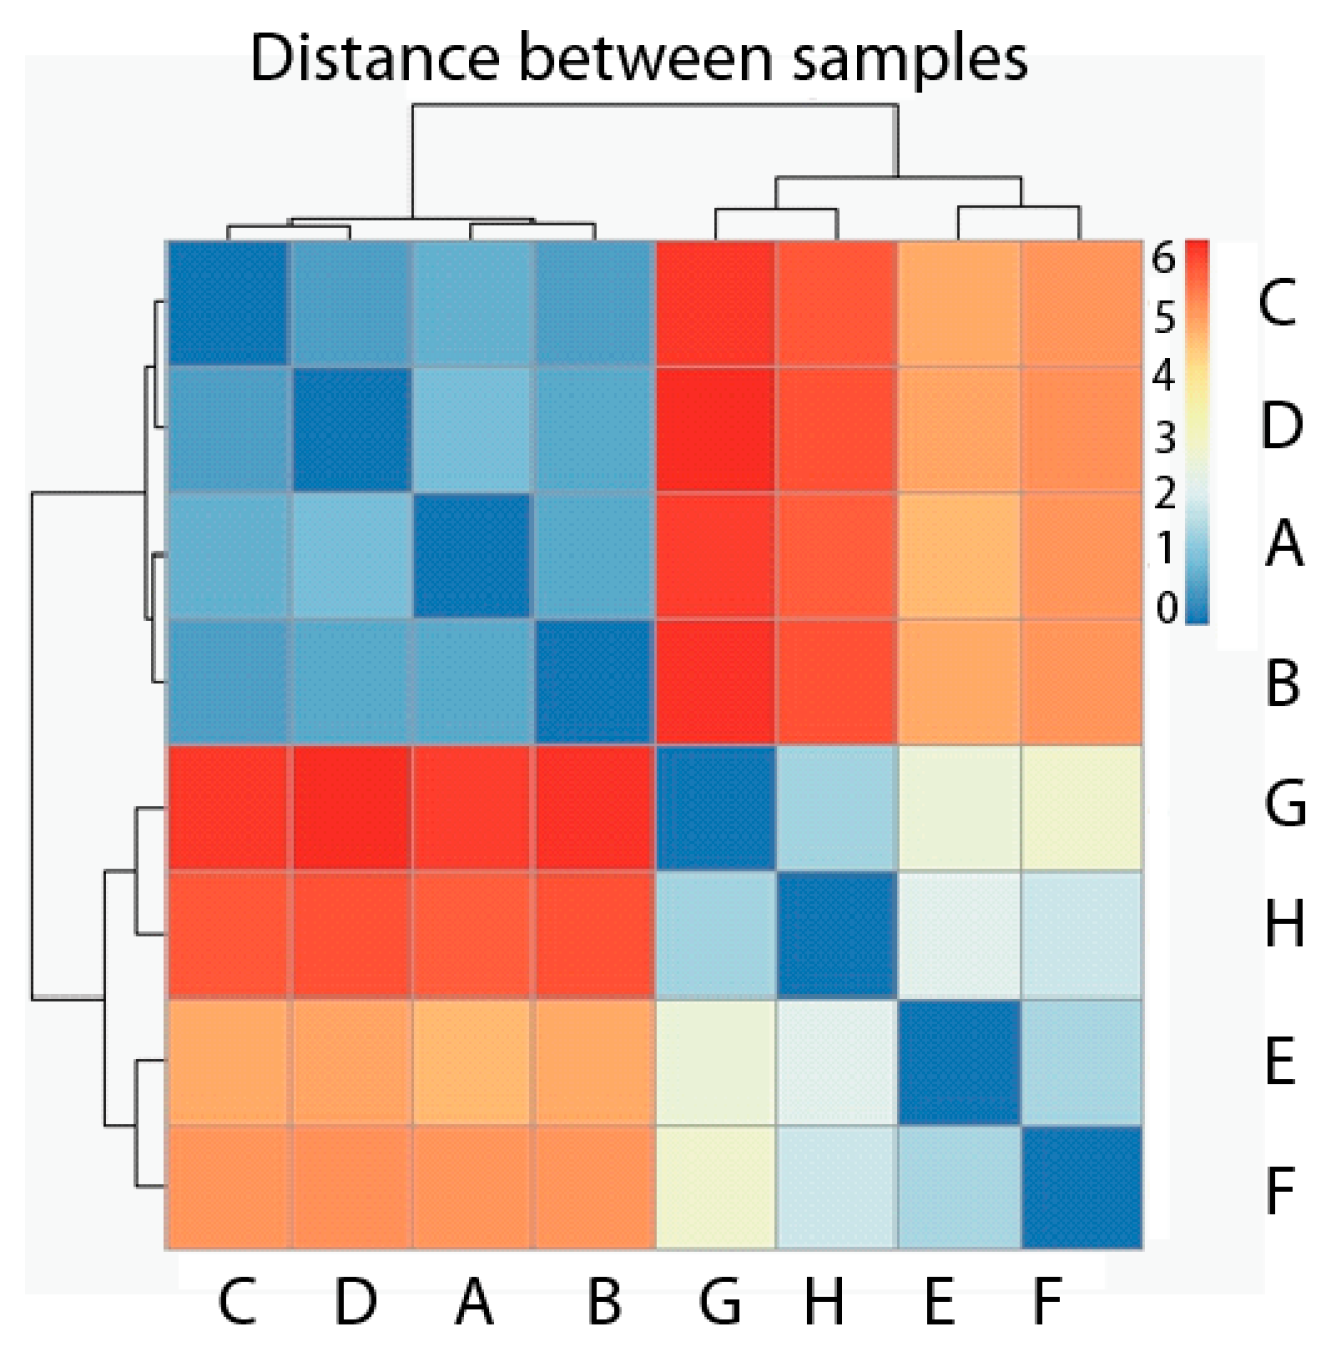
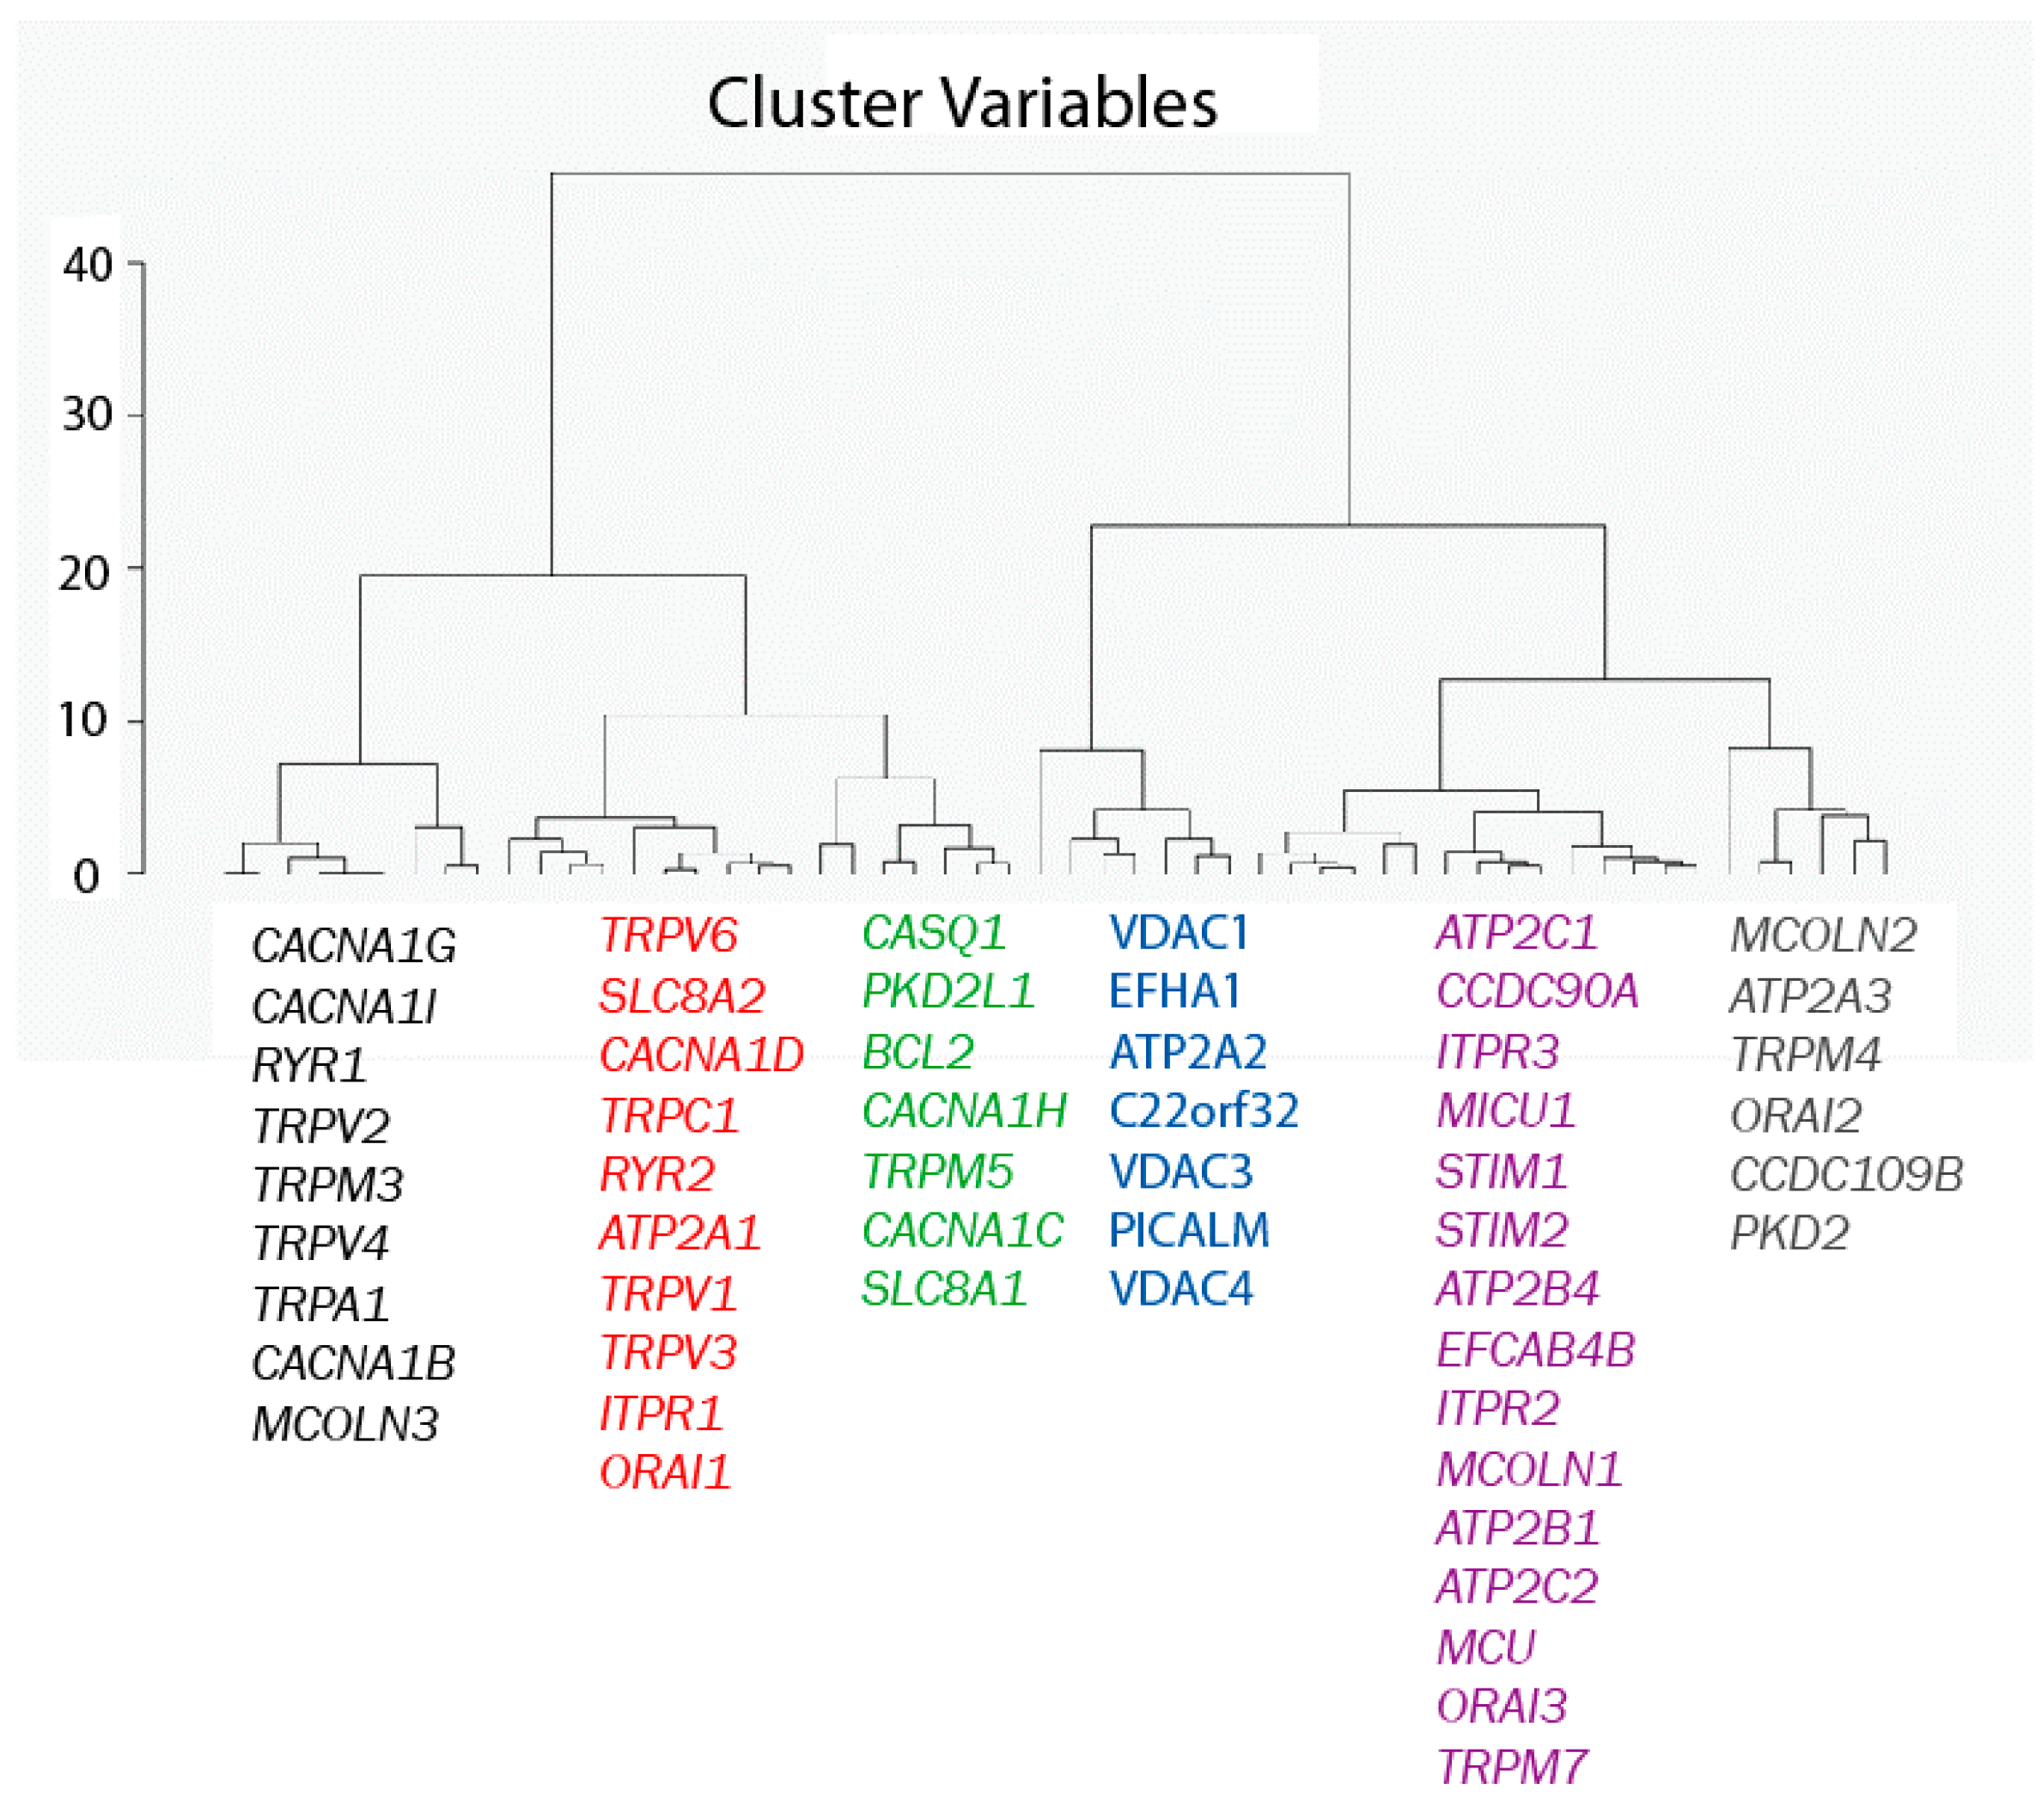
2.2. Exploratory Data Analysis: Hierarchical Clustering
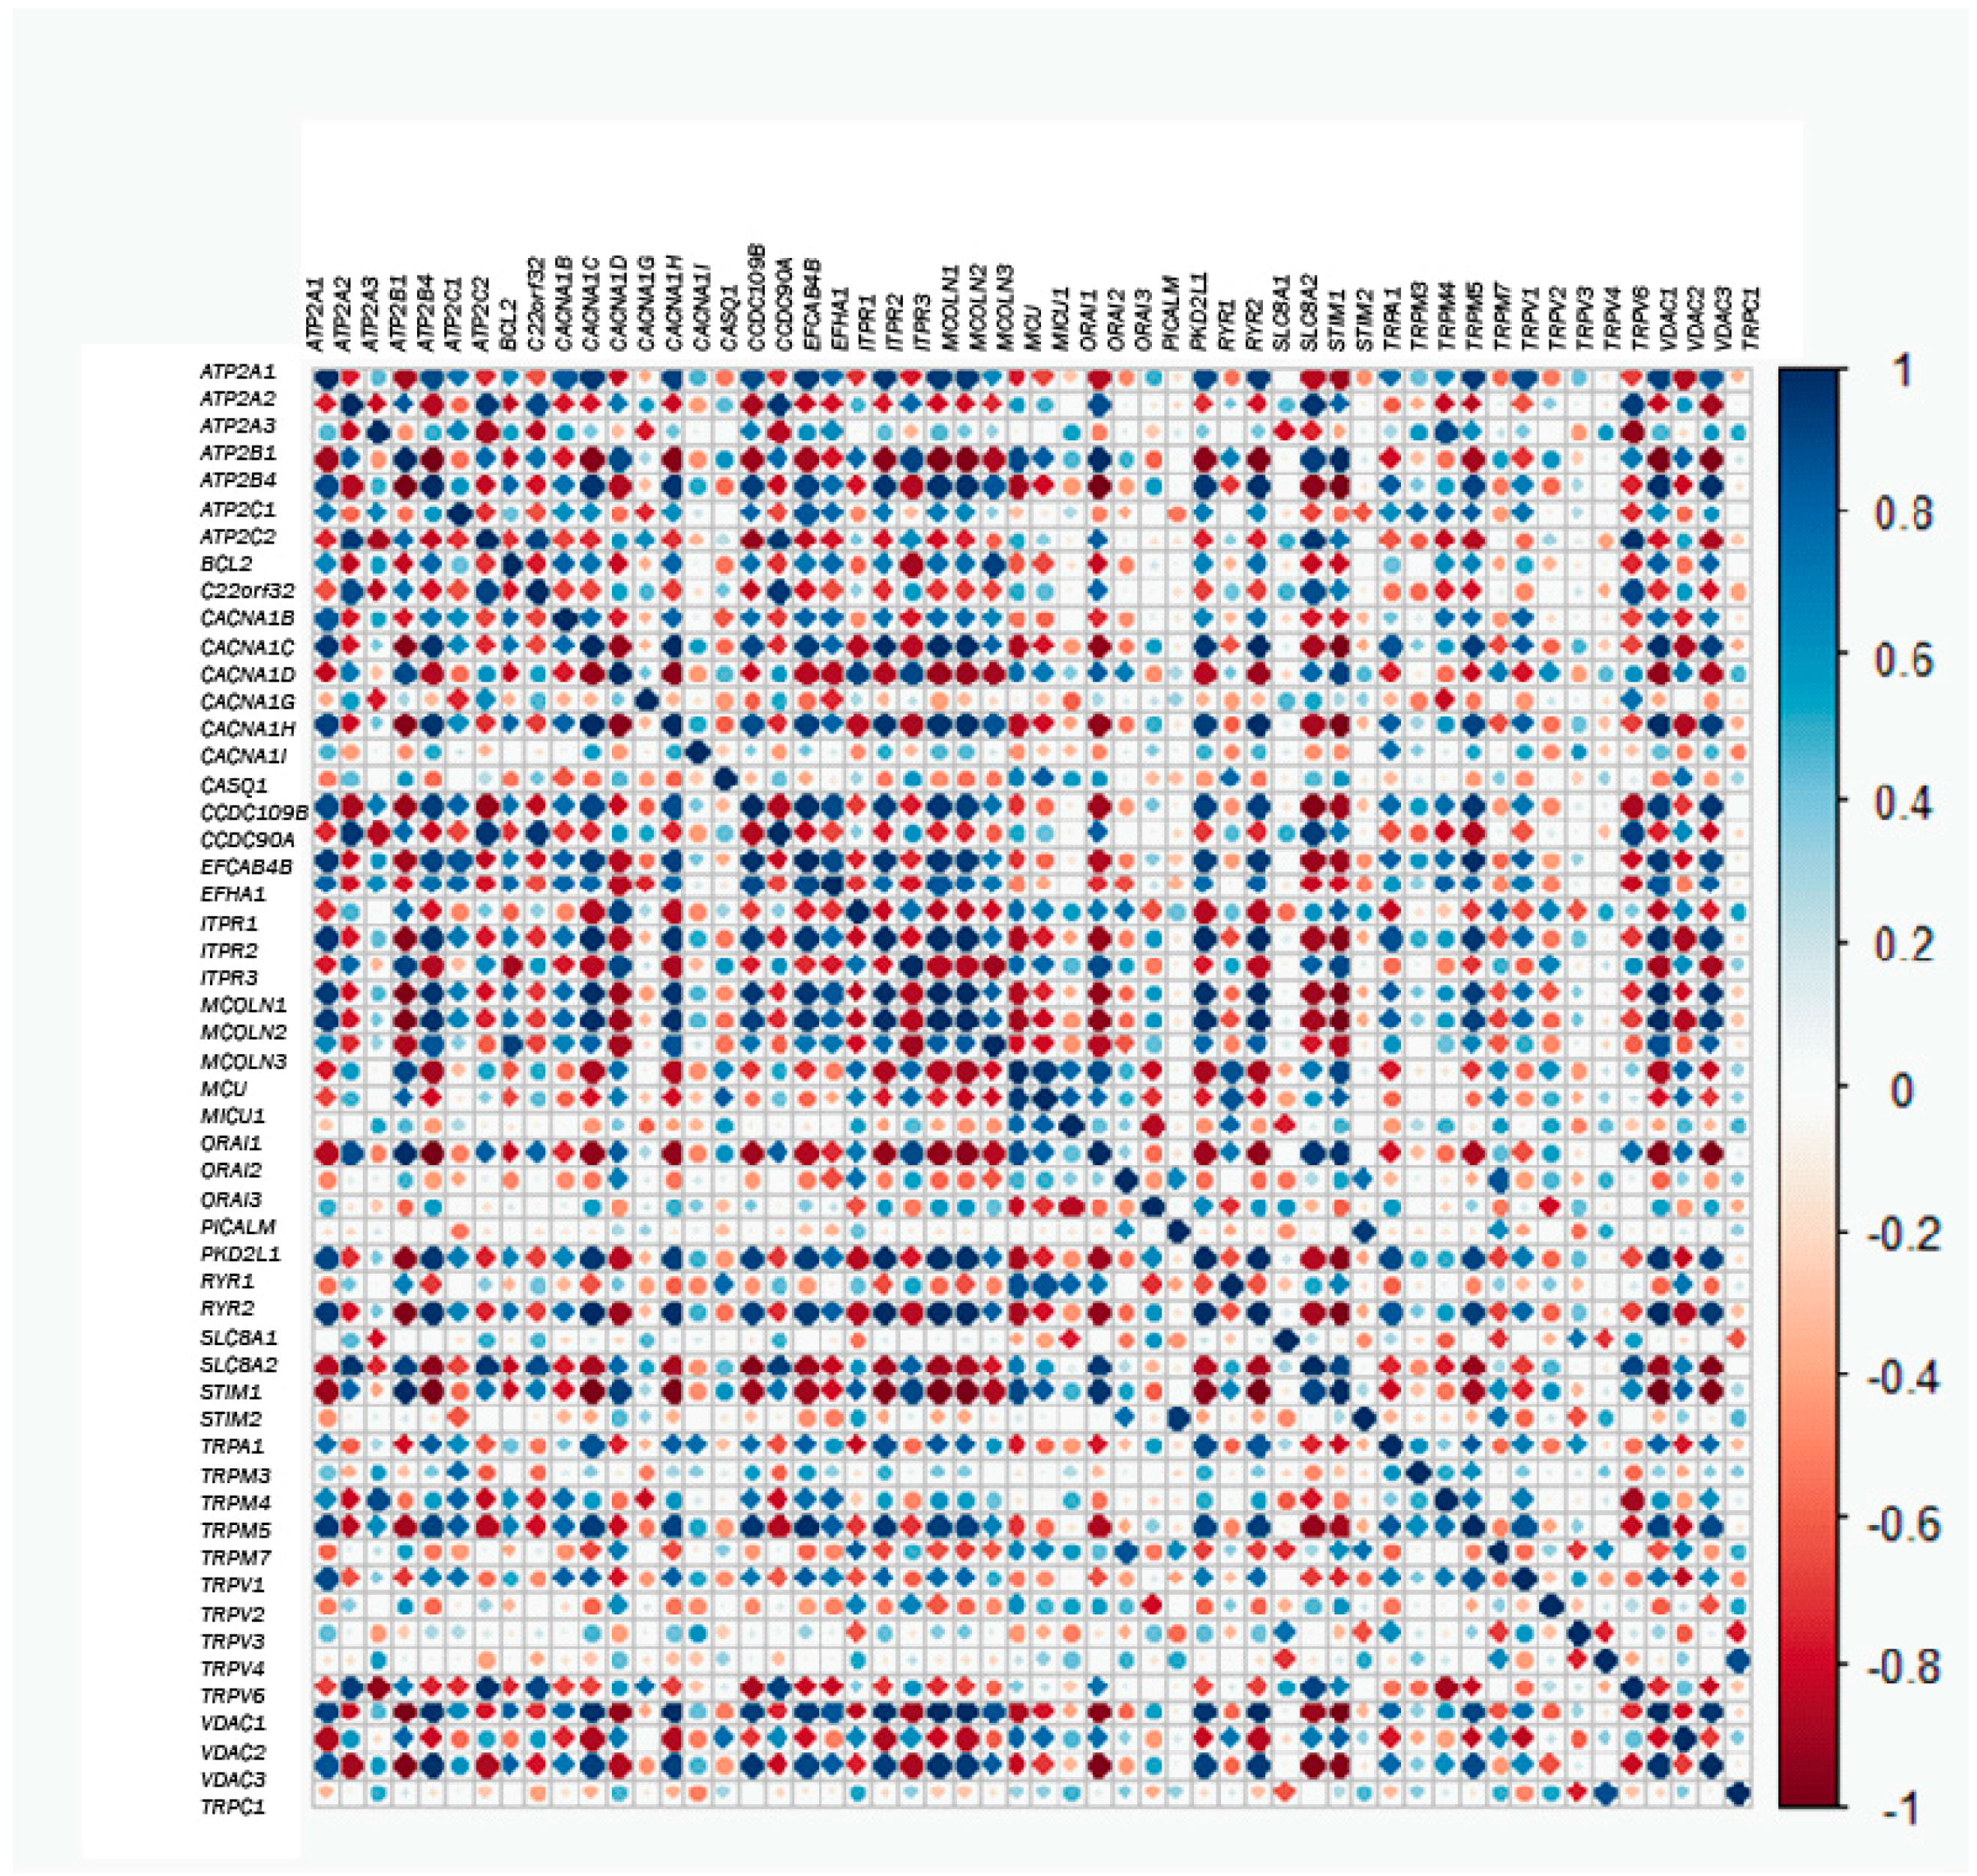
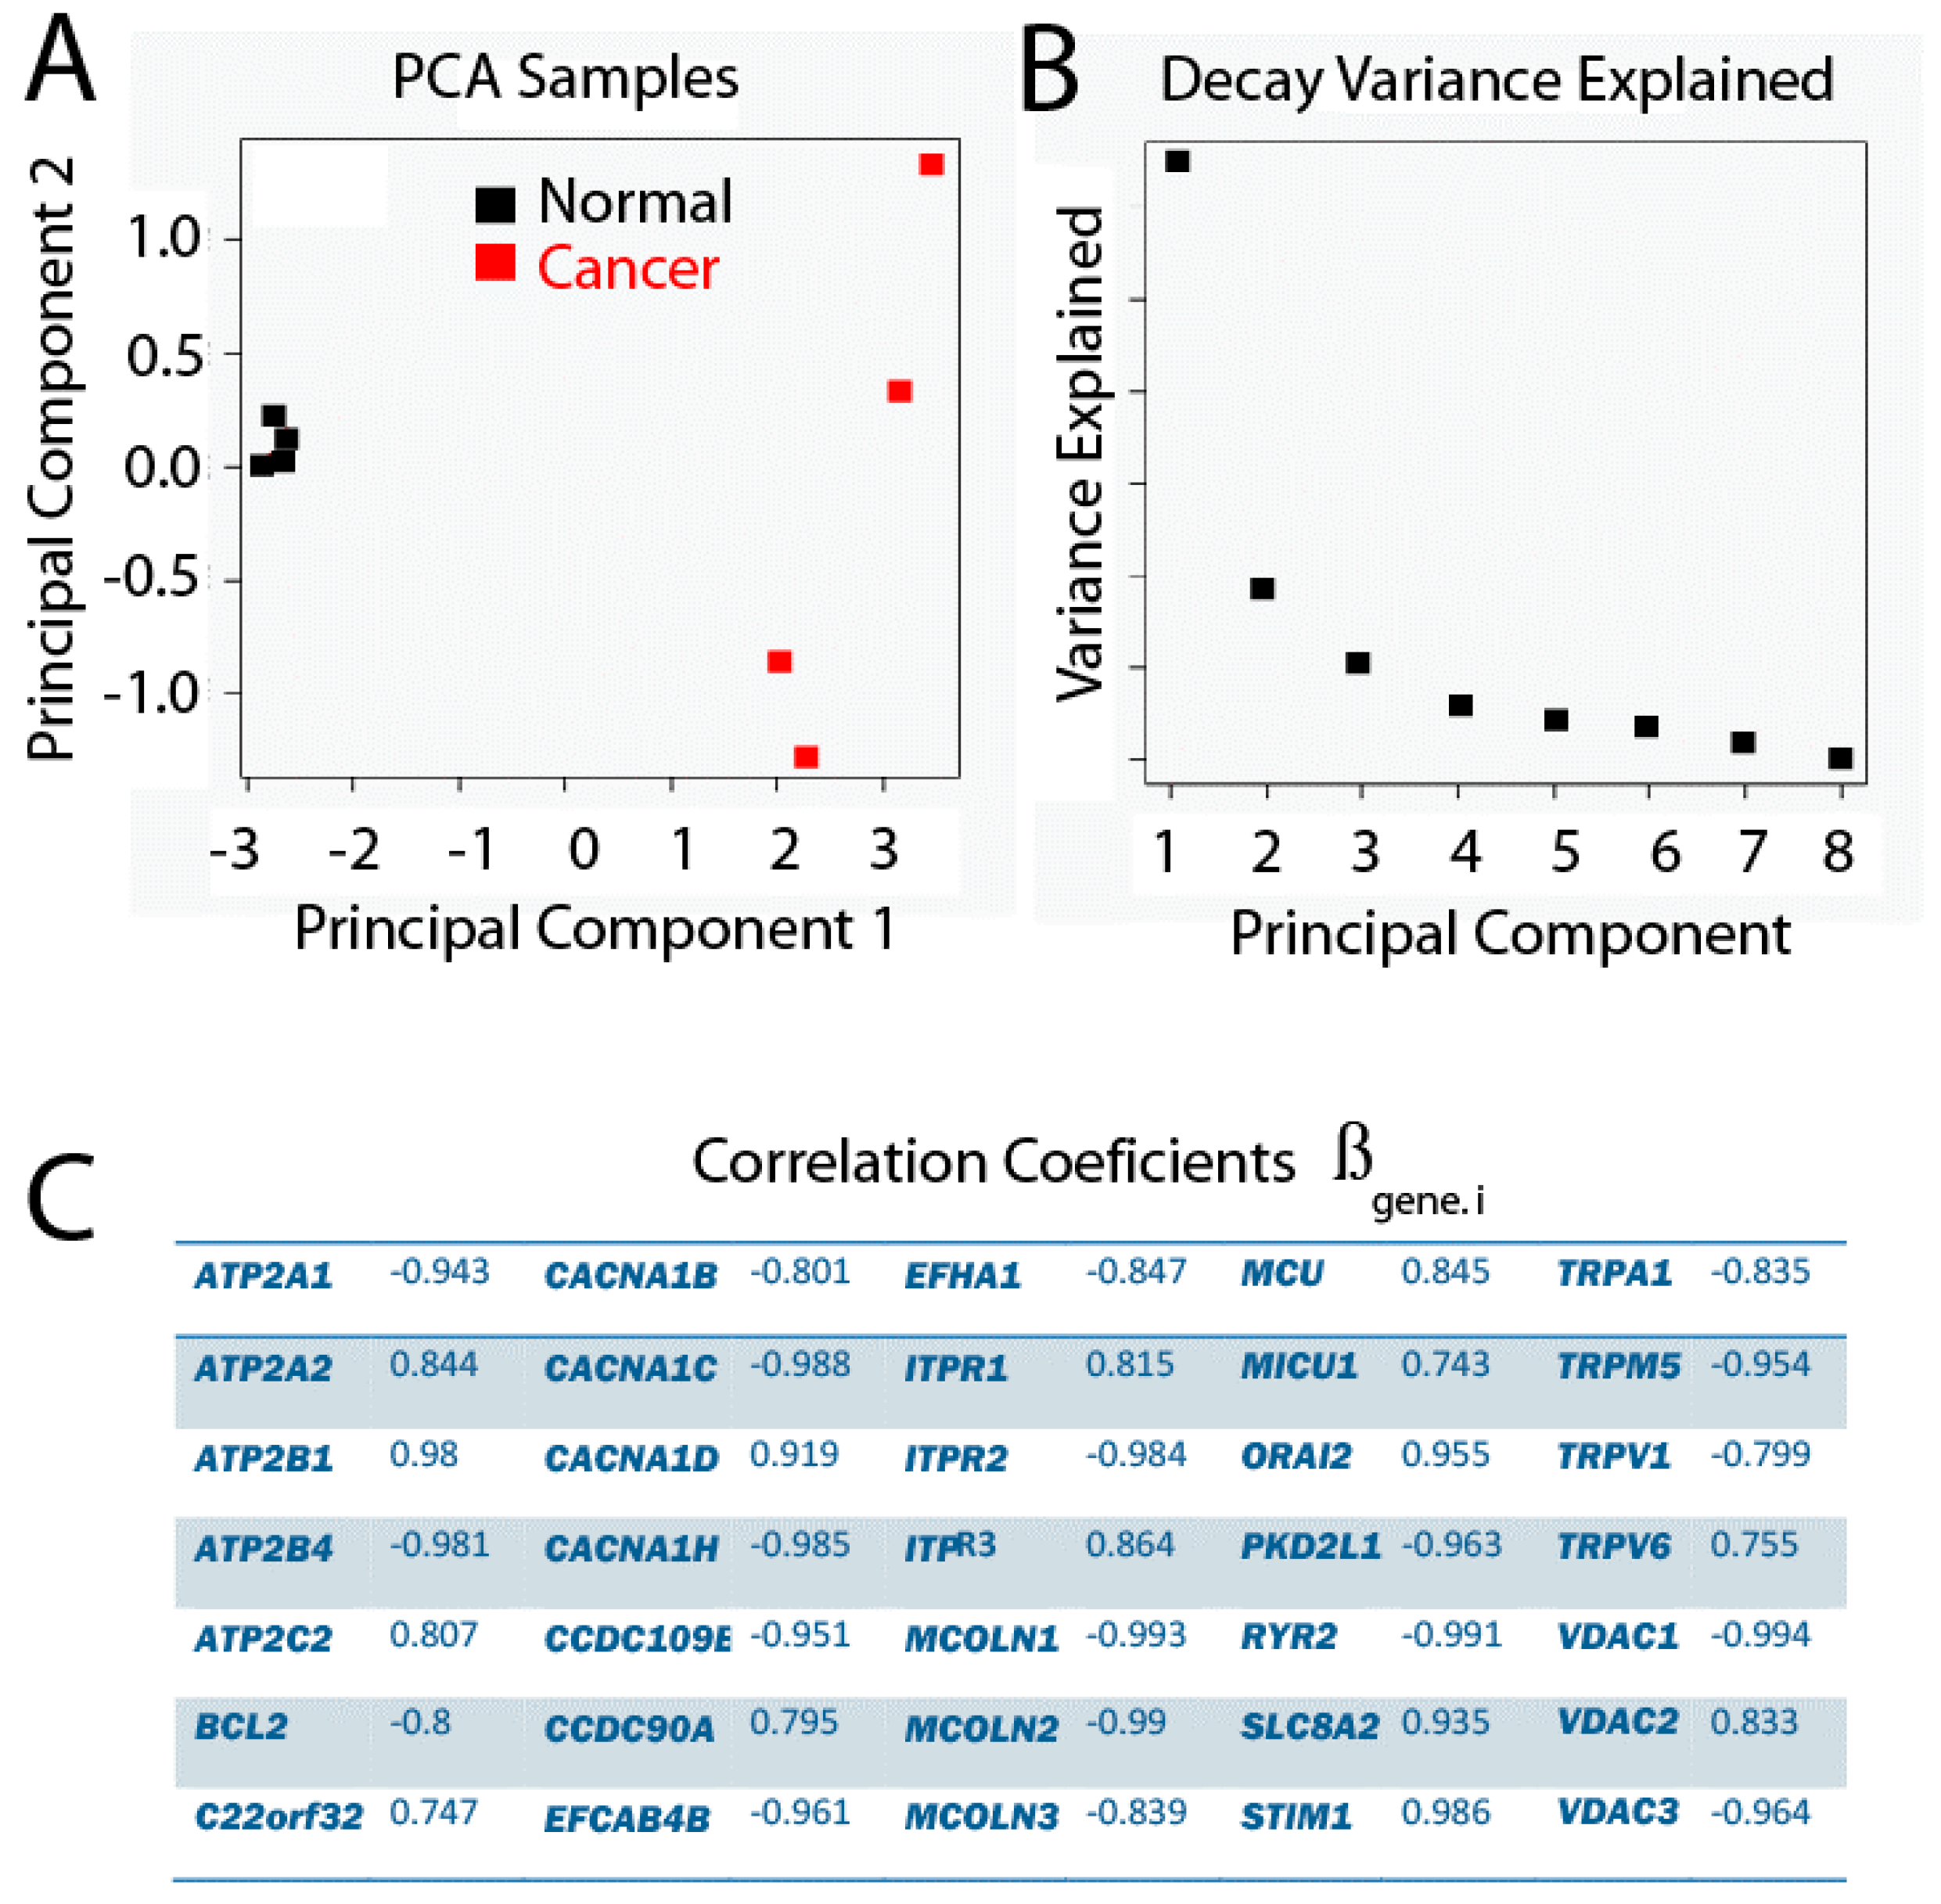
2.3. Gene Correlations
2.4. Principal Component Analysis
2.5. Differential Expression Analysis
3. Materials and Methods
3.1. Materials
3.2. Cell Culture
3.3. mRNA Isolation and Ion Torrent Reading
3.4. Transformation and Filtration of Raw Data Set
3.5. Exploratory Data Analysis
3.6. Differential Expression Analysis
Supplementary Materials
Acknowledgments
Author Contributions
Conflicts of Interest
Abbreviations
| CRC | Colorectal cancer |
| VOCC | Voltage-operated Ca2+ channels |
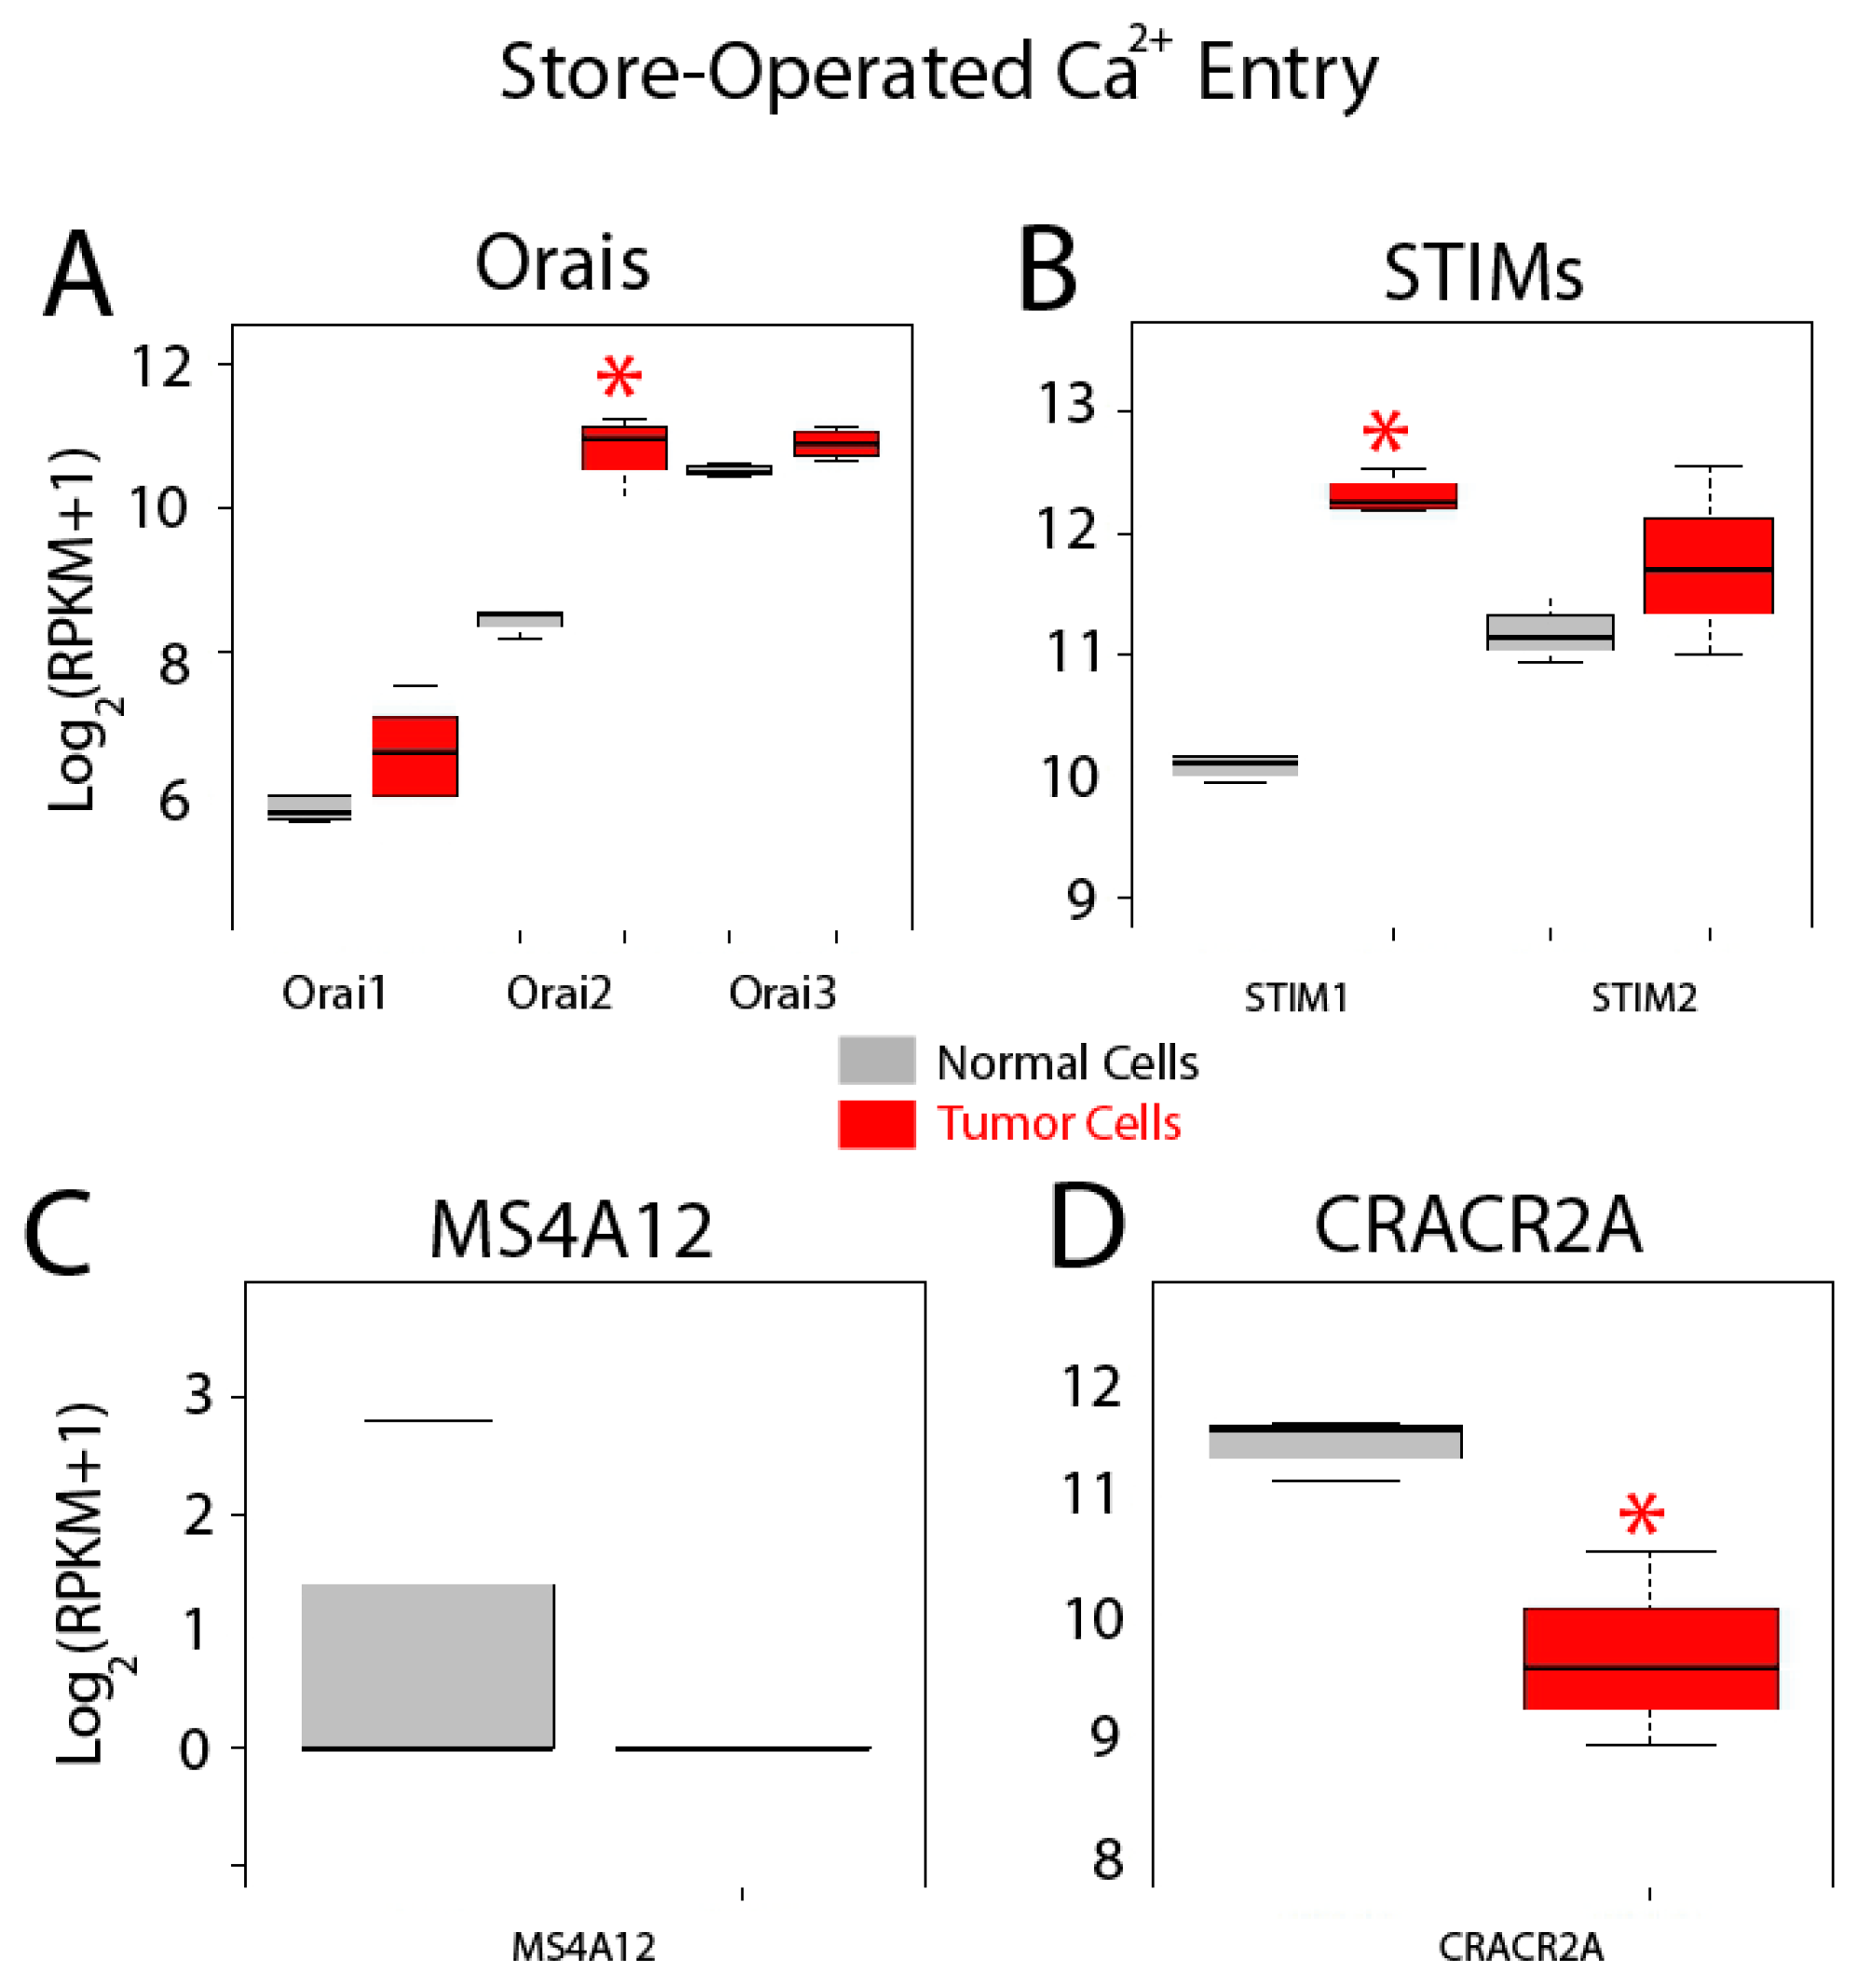
| SOCE | Store-operated Ca2+ entry |
| TRP | Transient receptor potential channels |
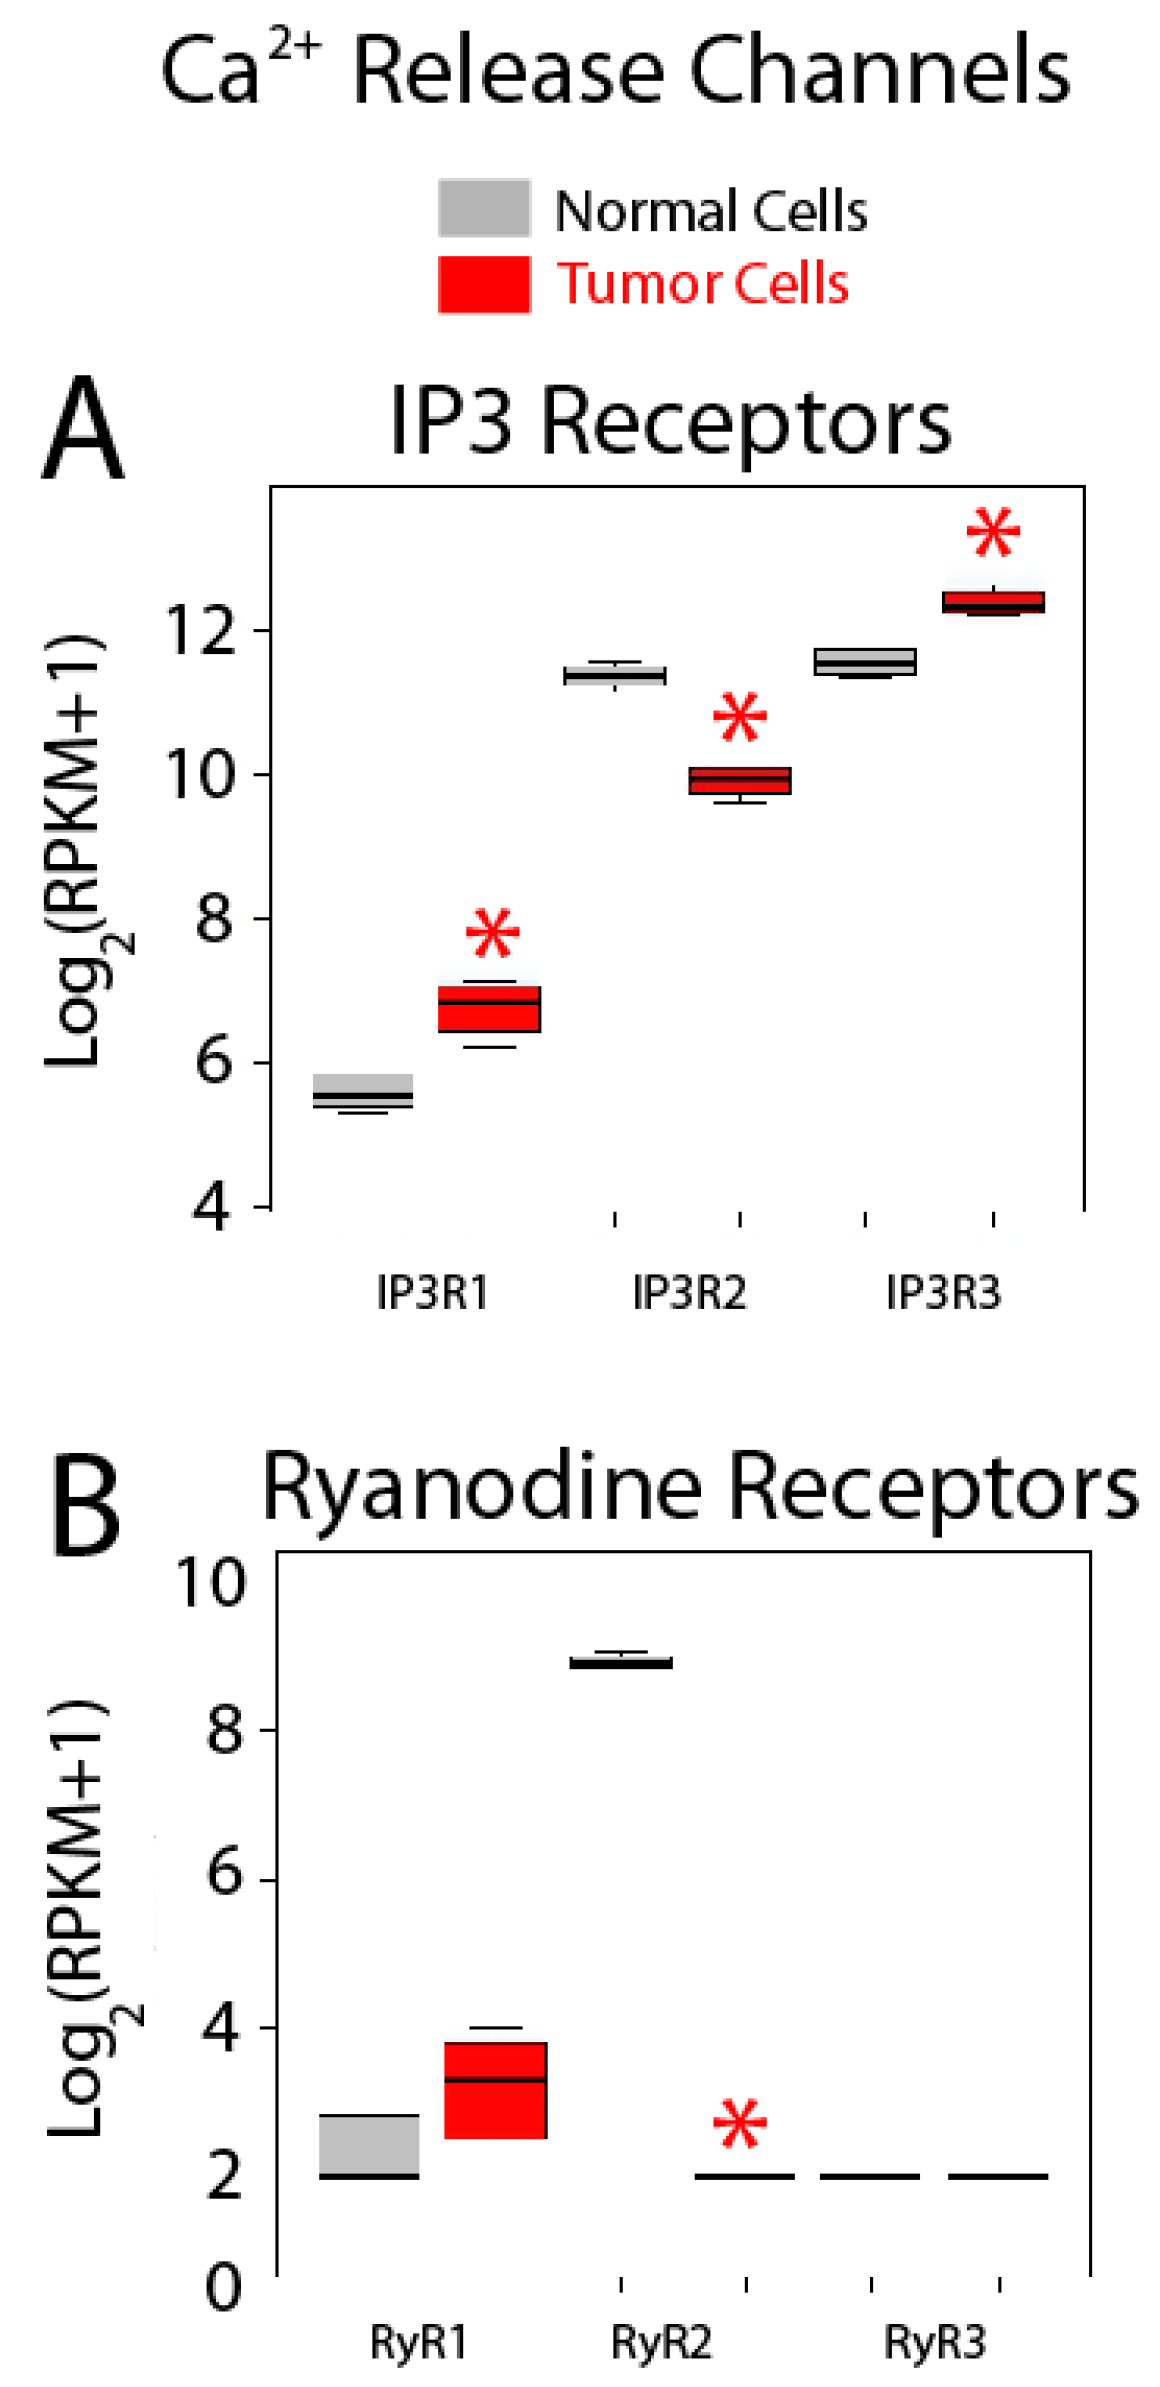
| IP3R | Inositol trisphosphate receptor |
| RyR | Ryanodine receptor |
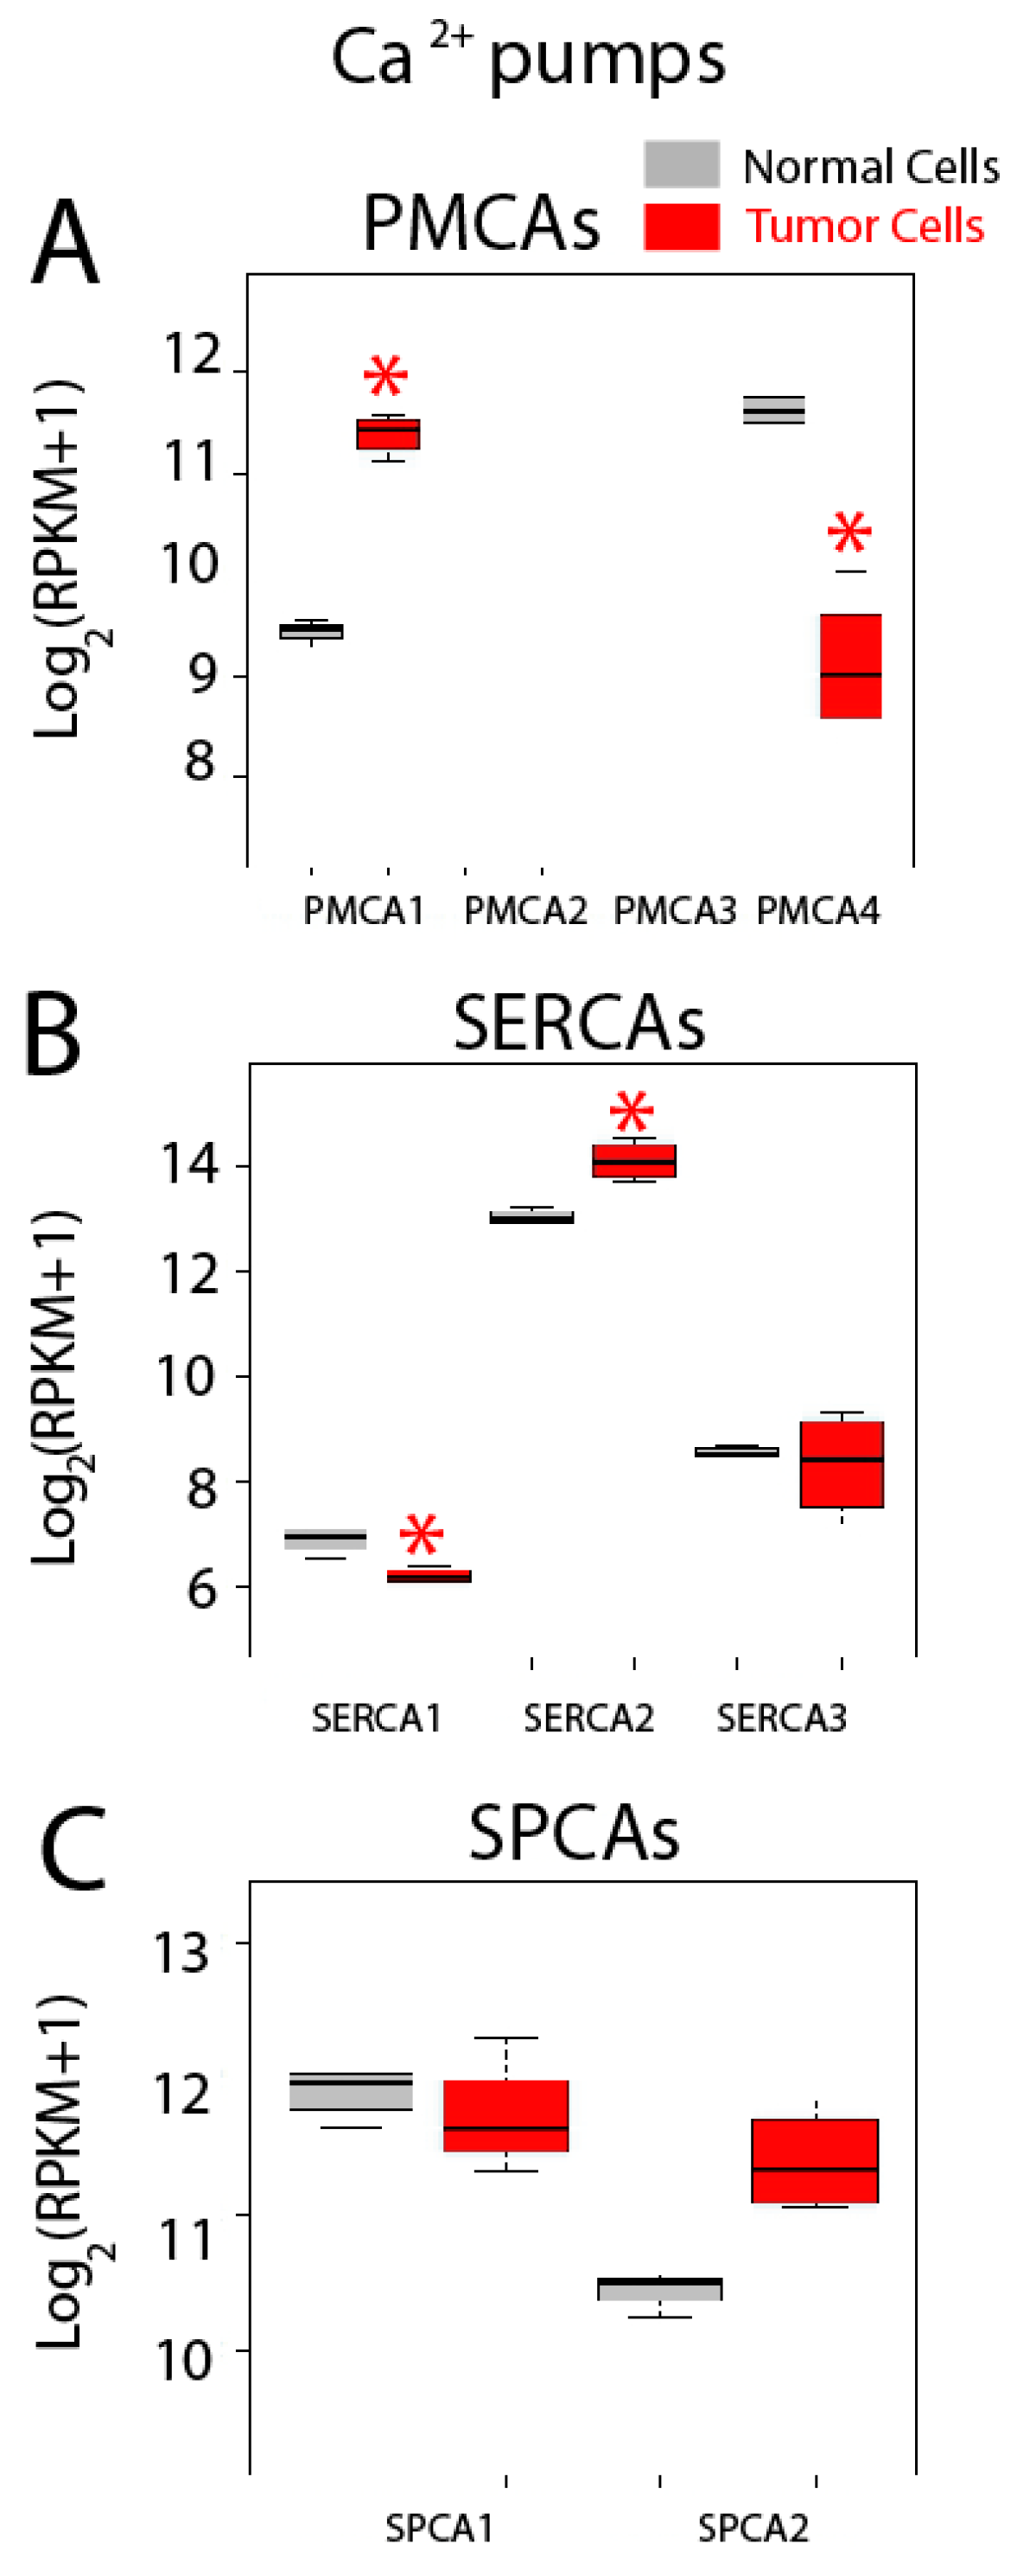
| PMCA | Plasma membrane Ca2+/ATPase |
| SERCA | Sarcoplasmic and endoplasmic reticulum Ca2+/ATPase |
| SPCA | Secretory pathway Ca2+/ATPase |
| MCU | Mitochondrial calcium uniporter |
References
- Berridge, M.J. The Inositol trisphosphate/calcium signaling pathway in health and disease. Physiol. Rev. 2016, 96, 1261–1296. [Google Scholar] [CrossRef] [PubMed]
- Prevarskaya, N.; Ouadid-Ahidouch, H.; Skryma, R.; Shuba, Y. Remodelling of Ca2+ transport in cancer: How it contributes to cancer hallmarks? Philos. Trans. R. Soc. Lond. B Biol. Sci. 2014, 369, 20130097. [Google Scholar] [CrossRef] [PubMed]
- Stewart, T.A.; Yapa, K.T.; Monteith, G.R. Altered calcium signaling in cancer cells. Biochim. Biophys. Acta 2015, 1848, 2502–2511. [Google Scholar] [CrossRef] [PubMed]
- Sobradillo, D.; Hernández-Morales, M.; Ubierna, D.; Moyer, M.P.; Núñez, L.; Villalobos, C. A reciprocal shift in transient receptor potential channel 1 (TRPC1) and stromal interaction molecule 2 (STIM2) contributes to Ca2+ remodeling and cancer hallmarks in colorectal carcinoma cells. J. Biol. Chem. 2014, 289, 28765–28782. [Google Scholar] [CrossRef] [PubMed]
- Villalobos, C.; Sobradillo, D.; Hernández-Morales, M.; Núñez, L. Remodeling of calcium entry pathways in cancer. Adv. Exp. Med. Biol. 2016, 898, 449–466. [Google Scholar] [PubMed]
- Villalobos, C.; Sobradillo, D.; Hernández-Morales, M.; Núñez, L. Calcium remodeling in colorectal cancer. Biochim. Biophys. Acta 2017. [Google Scholar] [CrossRef] [PubMed]
- Putney, J.W., Jr. A model for receptor-regulated calcium entry. Cell Calcium 1986, 7, 1–12. [Google Scholar] [CrossRef]
- Parekh, A.B.; Putney, J.W., Jr. Store-operated calcium channels. Physiol. Rev. 2005, 85, 757–810. [Google Scholar] [CrossRef] [PubMed]
- Liou, J.; Kim, M.L.; Heo, W.D.; Jones, J.T.; Myers, J.W.; Ferrell, J.E., Jr.; Meyer, T. STIM is a Ca2+ sensor essential for Ca2+-store-depletion-triggered Ca2+ influx. Curr. Biol. 2005, 15, 1235–1241. [Google Scholar] [CrossRef] [PubMed]
- Feske, S.; Gwack, Y.; Prakriya, M.; Srikanth, S.; Puppel, S.H.; Tanasa, B.; Hogan, P.G.; Lewis, R.S.; Daly, M.; Rao, A. A mutation in Orai1 causes immune deficiency by abrogating CRAC channel function. Nature 2006, 441, 179–185. [Google Scholar] [CrossRef] [PubMed]
- Cheng, K.T.; Ong, H.L.; Liu, X.; Ambudkar, I.S. Contribution and regulation of TRPC channels in store-operated Ca2+ entry. Curr. Top. Membr. 2013, 71, 149–179. [Google Scholar] [PubMed]
- Strehler, E.E. Plasma membrane calcium ATPases: From generic Ca2+ sump pumps to versatile systems for fine-tuning cellular Ca2+. Biochem. Biophys. Res. Commun. 2015, 460, 26–33. [Google Scholar] [CrossRef] [PubMed]
- Stammers, A.N.; Susser, S.E.; Hamm, N.C.; Hlynsky, M.W.; Kimber, D.E.; Kehler, D.S.; Duhamel, T.A. The regulation of sarco(endo)plasmic reticulum calcium-ATPases (SERCA). Can. J. Physiol. Pharmacol. 2015, 93, 843–854. [Google Scholar] [CrossRef] [PubMed]
- Brini, M.; Calì, T.; Ottolini, D.; Carafoli, E. Calcium pumps: Why so many? Compr. Physiol. 2012, 2, 1045–1060. [Google Scholar] [PubMed]
- Giladi, M.; Shor, R.; Lisnyansky, M.; Khananshvili, D. Structure-functional basis of ion transport in sodium-calcium exchanger (NCX) proteins. Int. J. Mol. Sci. 2016, 17, 1949. [Google Scholar] [CrossRef] [PubMed]
- De Stefani, D.; Patron, M.; Rizzuto, R. Structure and function of the mitochondrial calcium uniporter complex. Biochim. Biophys. Acta 2015, 1853, 2006–2011. [Google Scholar] [CrossRef] [PubMed]
- Villalobos, C.; Núñez, L.; Montero, M.; García, A.G.; Alonso, M.T.; Chamero, P.; Alvarez, J.; García-Sancho, J. Redistribution of Ca2+ among cytosol and organella during stimulation of bovine chromaffin cells. FASEB J. 2002, 16, 343–353. [Google Scholar] [CrossRef] [PubMed]
- Valero, R.A.; Senovilla, L.; Núñez, L.; Villalobos, C. The role of mitochondrial potential in control of calcium signals involved in cell proliferation. Cell Calcium 2008, 44, 259–269. [Google Scholar] [CrossRef] [PubMed]
- Bonnet, S.; Archer, S.L.; Allalunis-Turner, J.; Haromy, A.; Beaulieu, C.; Thompson, R.; Lee, C.T.; Lopaschuk, G.D.; Puttagunta, L.; Bonnet, S.; et al. A mitochondria-K+ channel axis is suppressed in cancer and its normalization promotes apoptosis and inhibits cancer growth. Cancer Cell 2007, 11, 37–51. [Google Scholar] [CrossRef] [PubMed]
- Hoth, M.; Fanger, C.M.; Lewis, R.S. Mitochondrial regulation of store-operated calcium signaling in T lymphocytes. J. Cell Biol. 1997, 137, 633–648. [Google Scholar] [CrossRef] [PubMed]
- Gilabert, J.A.; Parekh, A.B. Respiring mitochondria determine the pattern of activation and inactivation of the store-operated Ca2+ current ICRAC. EMBO J. 2000, 19, 6401–6407. [Google Scholar] [CrossRef] [PubMed]
- Núñez, L.; Valero, R.A.; Senovilla, L.; Sanz-Blasco, S.; García-Sancho, J.; Villalobos, C. Cell proliferation depends on mitochondrial Ca2+ uptake: Inhibition by salicylate. J. Physiol. 2006, 571, 57–73. [Google Scholar] [CrossRef] [PubMed]
- Robil, N.; Petel, F.; Kilhoffer, M.C.; Haiech, J. Glioblastoma and calcium signaling: Analysis of calcium toolbox expression. Int. J. Dev. Biol. 2015, 59, 407–415. [Google Scholar] [CrossRef] [PubMed]
- Moyer, M.P.; Manzano, L.A.; Merriman, R.L.; Stauffer, J.S.; Tanzer, L.R. NCM460, a normal human colon mucosal epithelial cell line. In Vitro Cell. Dev. Biol. Anim. 1996, 32, 315–317. [Google Scholar] [CrossRef] [PubMed]
- Alcarraz-Vizan, G.; Sánchez-Tena, S.; Moyer, M.P.; Cascante, M. Validation of NCM460 cell model as control in antitumor strategies targeting colon adenocarcinoma metabolic reprogramming: Trichostatin A as a case study. Biochim. Biophys. Acta 2013, 1840, 1634–1639. [Google Scholar] [CrossRef] [PubMed]
- Marshall, C.J.; Franks, L.M.; Carbonell, A.W. Markers of neoplastic transformation in epithelial cell lines derived from human carcinomas. J. Natl. Cancer Inst. 1977, 58, 1743–1751. [Google Scholar] [CrossRef] [PubMed]
- Hackett, N.R. RNA-Seq quantification of the human small airway epithelium transcriptome. BMC Genom. 2012, 13, 82. [Google Scholar] [CrossRef] [PubMed]
- Seyednasrollah, F. Comparison of software packages for detecting differential expression in RNA-seq studies. Brief. Bioinform. 2013, 16, 59–70. [Google Scholar] [CrossRef] [PubMed]
- Mortazavi, A. Mapping and quantifying mammalian transcriptomes by RNA-seq. Nat. Methods 2008, 5, 621–628. [Google Scholar] [CrossRef] [PubMed]
- Pérez, A.G. Métodos Avanzados de Estadística Aplicada; Técnicas Avanzadas; Universidad Nacional de Educación a Distancia: Madrid, Spain, 2014. (In Spanish) [Google Scholar]
- Zhang, Z.H. A Comparative Study of Techniques for Differential Expression Analysis on RNA-Seq Data. PLoS ONE 2014, 9, e103207. [Google Scholar] [CrossRef] [PubMed]
- Robinson, M.M. EdgeR: A Bioconductor package for. Bioinformatics 2010, 26, 139–140. [Google Scholar] [CrossRef] [PubMed]
- Anders, S. Differencial expression analysis for sequence count data. Genome Biol. 2010, 11, R106. [Google Scholar] [CrossRef] [PubMed]
- Smyth, G.K. Linear models and empirical bayes methods for assessing differential expression in microarray experiments. Stat. Appl. Genet. Mol. Biol. 2004, 3. [Google Scholar] [CrossRef] [PubMed]
- Geistlinger, L.; Csaba, G.; Zimmer, R. Bioconductor’s Enrichment Browser: Seamless navigation through combined results of set- & network-based enrichment analysis. BMC Bioinform. 2016, 17, 45. [Google Scholar]
- Dziegielewska, B.; Brautigan, D.L.; Larner, J.M.; Dziegielewski, J. T-type Ca2+ channel inhibition induces p53-dependent cell growth arrest and apoptosis through activation of p38-MAPK in colon cancer cells. Mol. Cancer Res. 2014, 12, 348–358. [Google Scholar] [CrossRef] [PubMed]
- Koslowski, M.; Sahin, U.; Dhaene, K.; Huber, C.; Türeci, O. MS4A12 is a colon-selective store-operated calcium channel promoting malignant cell processes. Cancer Res. 2008, 68, 3458–3466. [Google Scholar] [CrossRef] [PubMed]
- Lopez, J.J.; Albarran, L.; Gómez, L.J.; Smani, T.; Salido, G.M.; Rosado, J.A. Molecular modulators of store-operated calcium entry. Biochim. Biophys. Acta 2016, 1863, 2037–2043. [Google Scholar] [CrossRef] [PubMed]
- Shibao, K.; Fiedler, M.J.; Nagata, J.; Minagawa, N.; Hirata, K.; Nakayama, Y.; Iwakiri, Y.; Nathanson, M.H.; Yamaguchi, K. The type III inositol 1,4,5-trisphosphate receptor is associated with aggressiveness of colorectal carcinoma. Cell Calcium 2010, 48, 315–323. [Google Scholar] [CrossRef] [PubMed]
- Pierro, C.; Cook, S.J.; Foets, T.C.; Bootman, M.D.; Roderick, H.L. Oncogenic K-Ras suppresses IP3-dependent Ca²+ release through remodeling of the isoform composition of IP3Rs and ER luminal Ca²+ levels in colorectal cancer cell lines. J Cell Sci. 2014, 127, 1607–1619. [Google Scholar] [CrossRef] [PubMed]
- Ribiczey, P.; Tordai, A.; Andrikovics, H.; Filoteo, A.G.; Penniston, J.T.; Enouf, J.; Enyedi, A.; Papp, B.; Kovács, T. Isoform-specific up-regulation of plasma membrane Ca2+ ATPase expression during colon and gastric cancer cell differentiation. Cell Calcium 2007, 42, 590–605. [Google Scholar] [CrossRef] [PubMed]
- Ion Torrent Analysis. Available online: https://github.com/iontorrent/TS/tree/master/Analysis/TMAP (accessed on 3 June 2015).
- Dudoit, S.; van der Laan, M.J. Multiple Testing Procedures with Applications to Genomics; Springer: New York, NY, USA, 2008. [Google Scholar]
- Kolde, R. Pheatmap: Pretty Heatmaps; Package Manual; The Comprehensive R Archive Network: Vienna, Austria, 2015. [Google Scholar]
- Simko, T.W. Corrplot: Visualization of a Correlation; Package Manual; The Comprehensive R Archive Network: Vienna, Austria, 2016. [Google Scholar]
- Benjamini, Y. Controling the false discovery rate: A practical and powerful approach to multiple testing. J. R. Stat. Soc. B Methodol. 1995, 57, 289–300. [Google Scholar]


| Gene Group | Protein Name (Gene Name) |
|---|---|
| Voltage Operated Calcium Channels | Cav1.1 (CACNA1S); Cav1.2 (CACNA1C); Cav1.3 (CACNA1D); Cav1.4 (CACNA1F); Cav2.1 (CACNA1A); Cav2.2 (CACNA1B); Cav2.3 (CACNA1E); Cav3.1 (CACNA1G); Cav3.2 (CACNA1H); Cav3.3 (CACNA1I) |
| Store-Operated Calcium Entry Player | Orai1; Orai2; Orai3; STIM1; STIM2; CRACR2A (EFCAB4B); MS4A12 |
| TRP Channels | TRPC1; TRPC3; TRPC4; TRPC5; TRPC6; TRPC7; TRPV1; TRPV2; TRPV3; TRPV4; TRPV5; TRPV6; TRPM1; TRPM2; TRPM3; TRPM4; TRPM5; TRPM6; TRPM7; TRPM8; TRPA1; TRPML1 (MCOLN1); TRPML2 (MCOLN2); TRPML3 (MCOLN3); TRPP1 (PKD2); TRPP2 (PKD2L1); TRPP3 (PKD2L2) |
| Calcium Release Channels | IP3R1 (ITPR1); IP3R3 (ITPR2); IP3R3 (ITPR3); RYR1; RYR2; RYR3 |
| Calcium Pumps | PMCA1 (ATP2B1); PMCA2 (ATP2B2); PMCA3 (ATP2B3); PMCA4 (ATP2B4); SERCA1 (ATP2A1); SERCA2 (ATP2A2); SERCA3 (ATP2A3); SPCA1 (ATP2C1); SPCA2 (ATP2C2) |
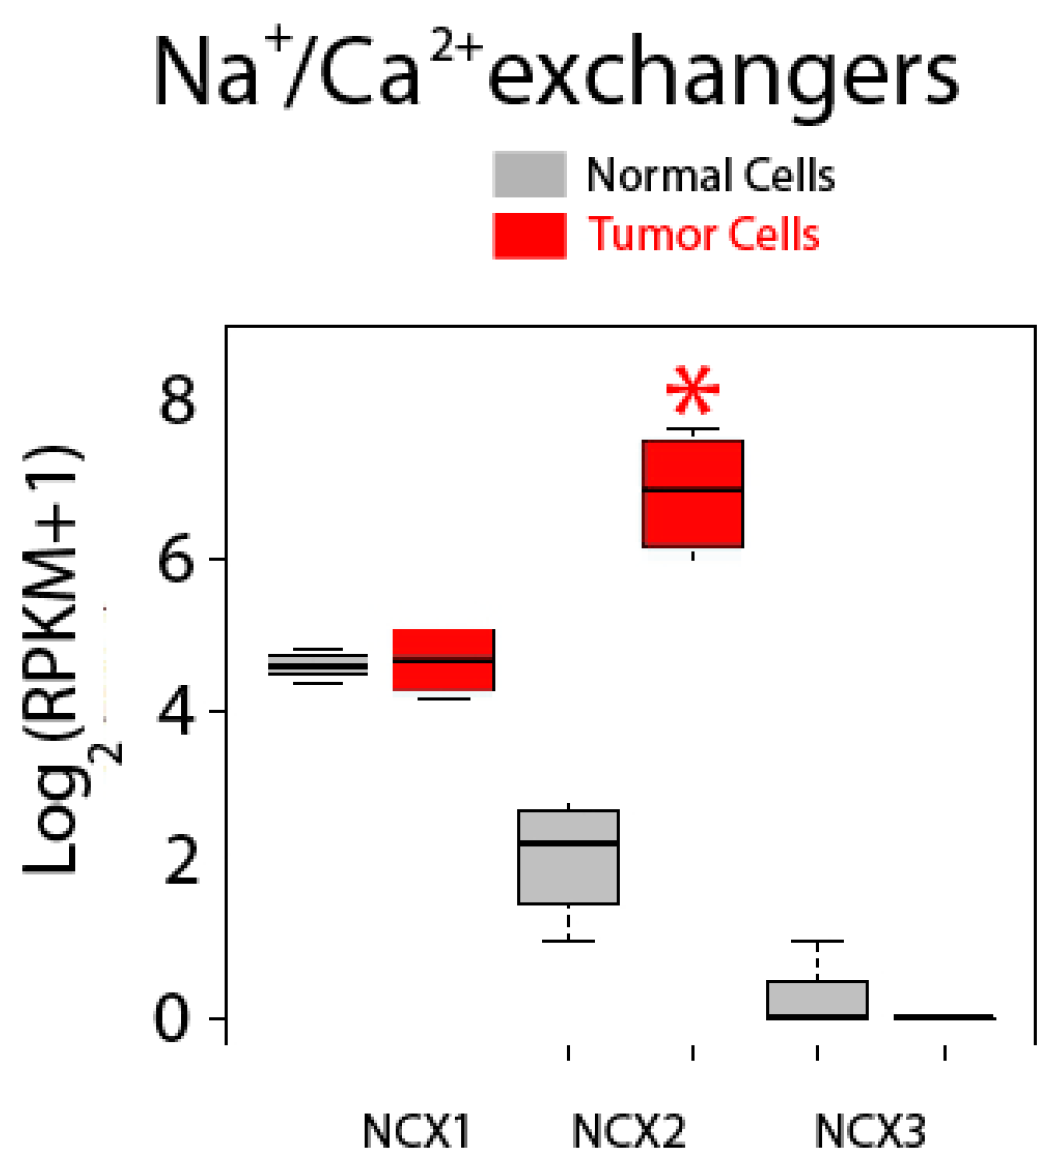
| Sodium Calcium Exchangers | NCX1 (SLC8A1); NCX2 (SLC8A2); NCX3 (SLC8A3) |
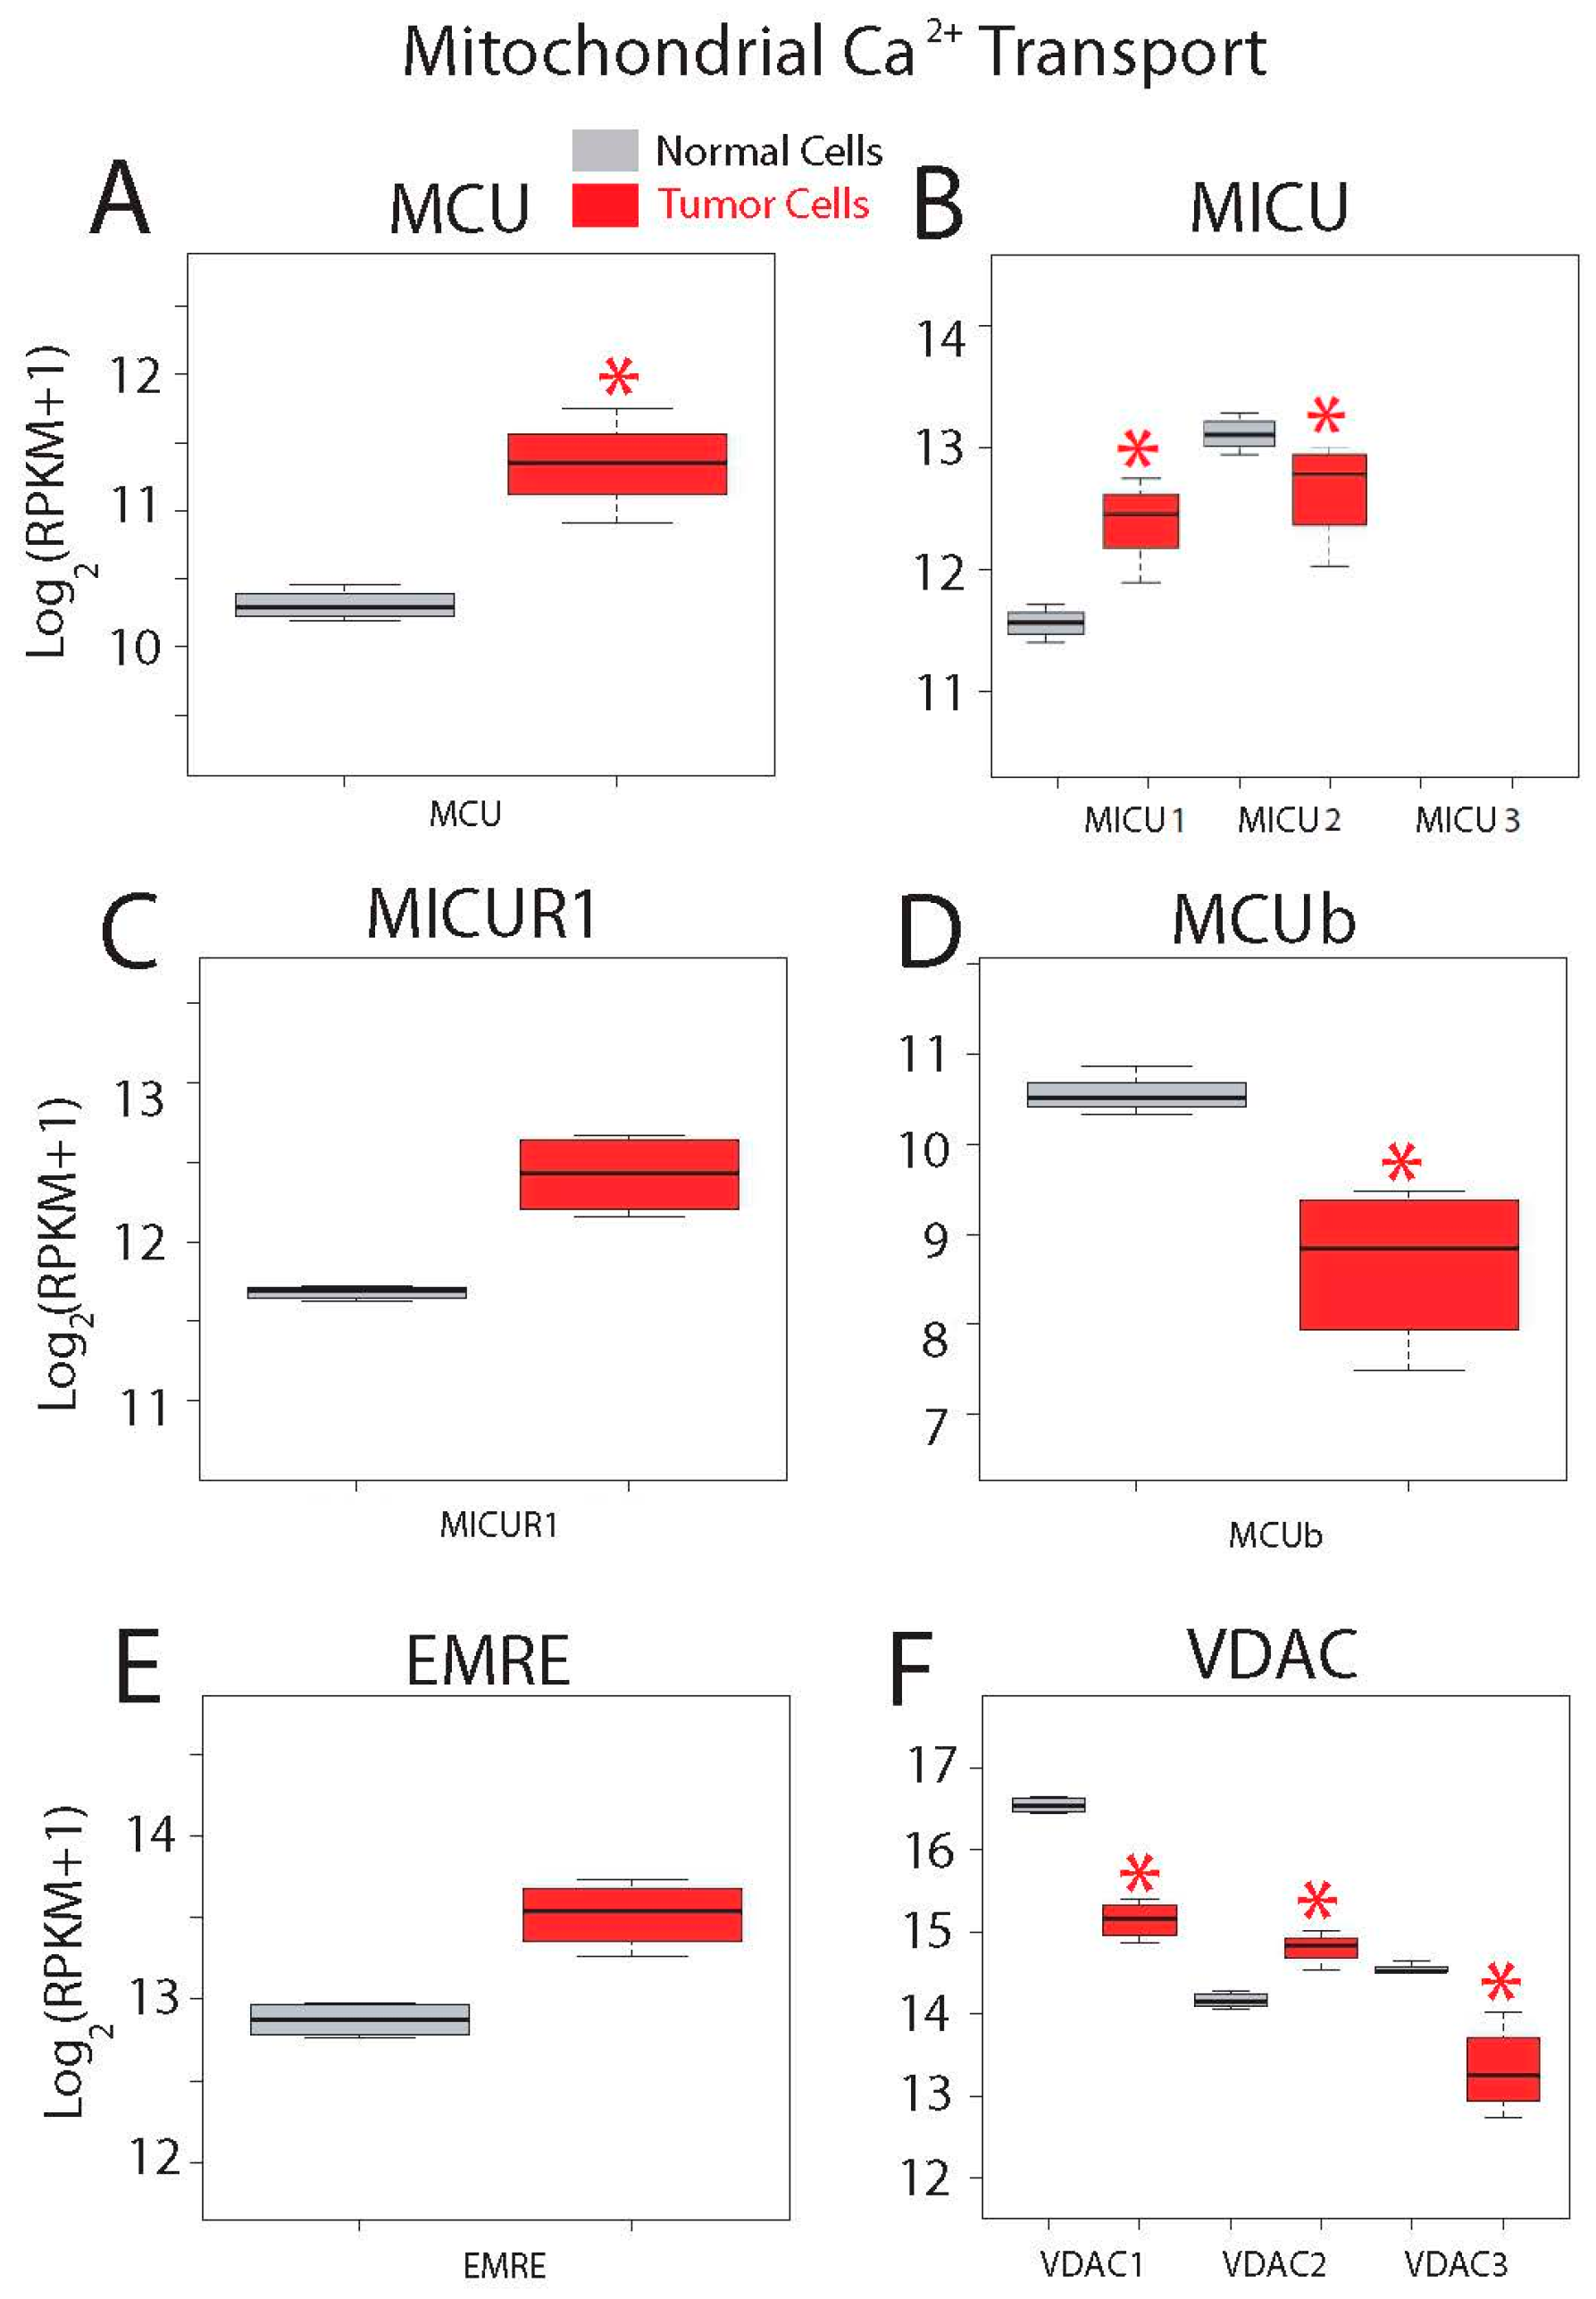
| Mitochondrial Calcium Transport Proteins | MCU; MICU1; MICU2 (EFHA1); MICU3 (EFHA2); MCUR1 (CCDC90A); EMRE (C22orf32); MCUb (CCDC109B); VDAC1; VDAC2; VDAC3 |
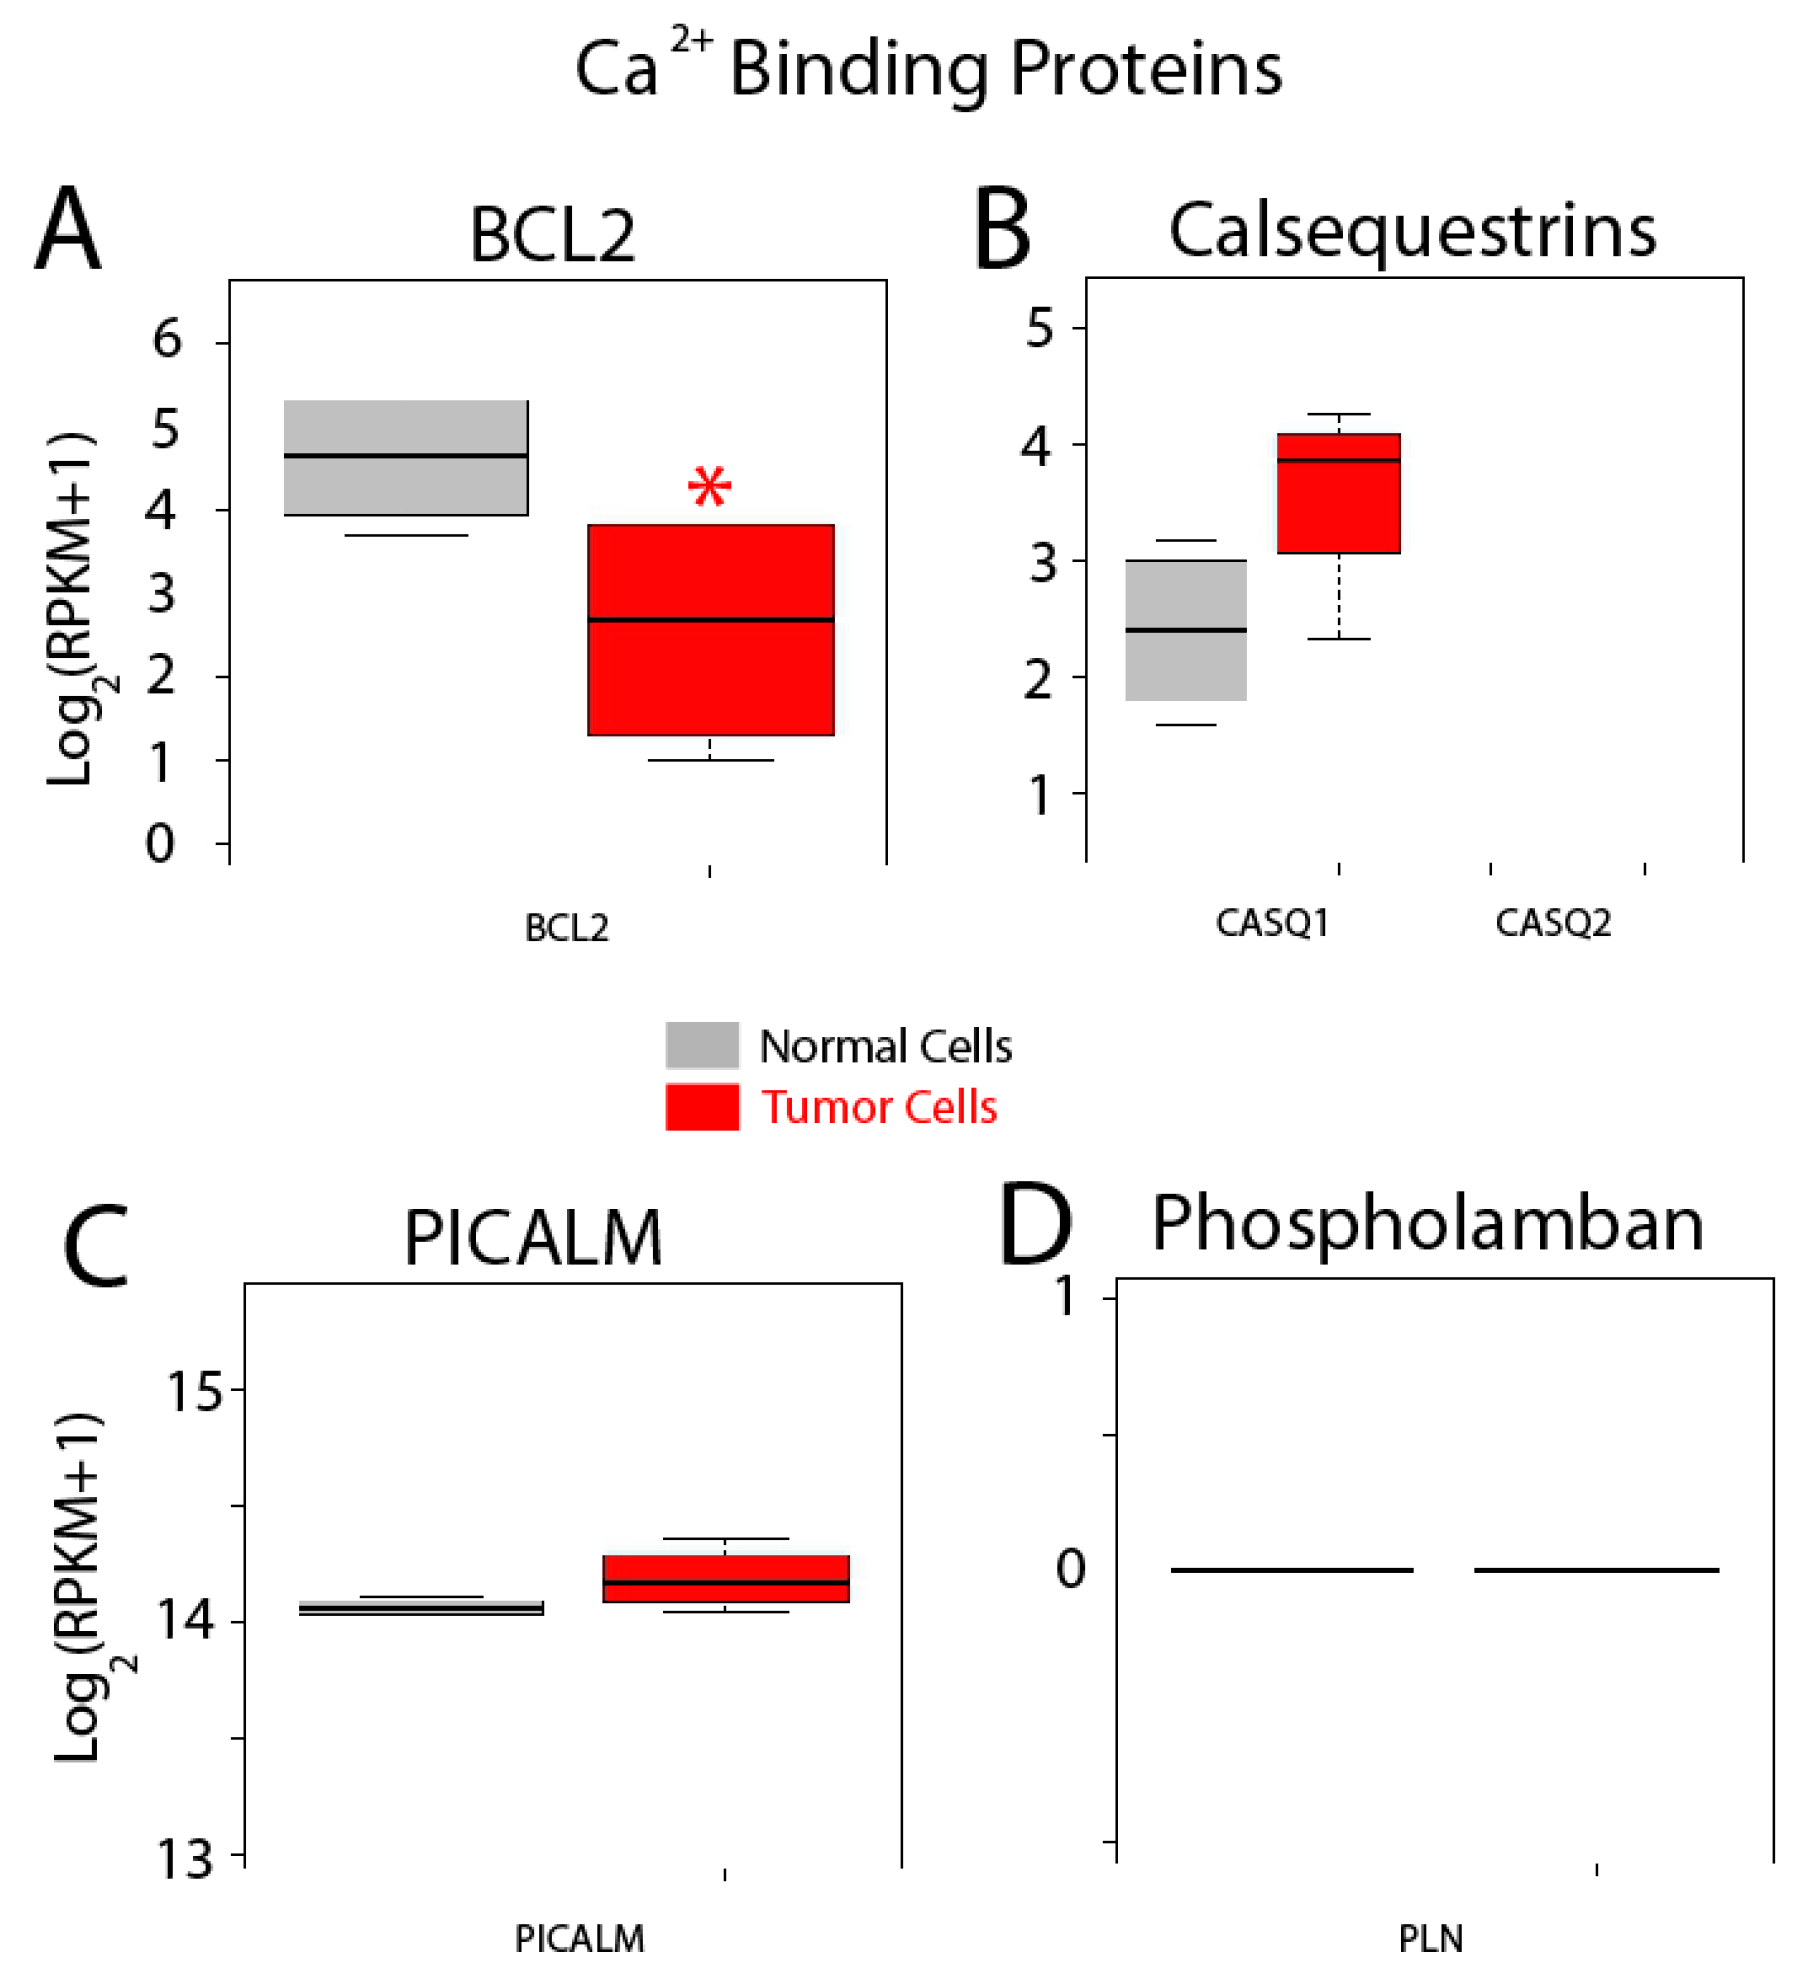
| Other Proteins | Bcl-2 (BCL2); Calsequestrin 1 (CASQ1); Calsequestrin 2 (CASQ2); PICALM; Phospholamban (PLN) |
| Gene | Expression | Gene | Expression | Gene | Expression | Gene | Expression | Gene | Expression |
|---|---|---|---|---|---|---|---|---|---|
| ATP2A1 | −0.166 | CACNA1C | −0.174 | ITPR1 | 0.143 | ORAI3 | 0.090 | TRPA1 | −0.147 |
| ATP2A2 | 0.148 | CACNA1D | 0.162 | ITPR2 | −0.173 | PICALM | −0.089 | TRPM3 | −0.070 |
| ATP2A3 | −0.088 | CACNA1G | 0.072 | ITPR3 | 0.152 | PKD2 | 0.020 | TRPM4 | −0.113 |
| ATP2B1 | 0.172 | CACNA1H | −0.173 | MCOLN1 | −0.175 | PKD2L1 | −0.169 | TRPM5 | −0.168 |
| ATP2B4 | −0.173 | CACNA1I | −0.084 | MCOLN2 | −0.174 | RYR1 | 0.103 | TRPM7 | 0.105 |
| ATP2C1 | −0.121 | CASQ1 | 0.093 | MCOLN3 | −0.148 | RYR2 | −0.174 | TRPV1 | −0.141 |
| ATP2C2 | 0.142 | CCDC109B | −0.167 | MCU | 0.149 | SLC8A1 | −0.010 | TRPV2 | 0.096 |
| BCL2 | −0.141 | CCDC90A | 0.140 | MICU1 | 0.131 | SLC8A2 | 0.165 | TRPV3 | −0.060 |
| C22orf32 | 0.131 | EFCAB4B | −0.169 | ORAI1 | 0.061 | STIM1 | 0.174 | TRPV4 | 0.026 |
| CACNA1B | −0.141 | EFHA1 | −0.149 | ORAI2 | 0.168 | STIM2 | 0.057 | TRPV6 | 0.133 |
| VDAC1 | −0.175 | VDAC2 | 0.147 | VDAC3 | −0.170 | TRPC1 | 0.041 |
| p-Value Adjusted by BH Method | ||||
|---|---|---|---|---|
| ID | Fold Change | BH.DESeq2 | BH.edgeR | BH.limma |
| ATP2A1 | 1.02810479 | 9.71 × 10⁻⁸ | 0.0027235 | 0.00160014 |
| ATP2A2 | 0.83492287 | 0.00142512 | 0.00029452 | 0.02416078 |
| ATP2B1 | 1.66289207 | 1.32 × 10⁻²⁹ | 1.69 × 10⁻¹³ | 1.58 × 10⁻⁵ |
| ATP2B4 | 2.75628322 | 5.53 × 10⁻¹⁸ | 7.86 × 10⁻²² | 3.01 × 10⁻⁶ |
| BCL2 | 2.34849379 | 0.00307301 | 0.00070215 | 0.00754796 |
| CACNA1B | 2.19132122 | 0.00190951 | 0.00050421 | 0.00207432 |
| CACNA1C | −11.408836 | 1.05 × 10⁻²⁴ | 1.40 × 10−53 | 1.24 × 10⁻⁹ |
| CACNA1D | 1.55721384 | 1.97 × 10−08 | 9.80 × 10−06 | 0.00077412 |
| CACNA1H | −4.7419621 | 2.25 × 10⁻²⁹ | 1.04 × 10⁻¹⁷ | 3.37 × 10⁻⁶ |
| CCDC109B | 2.08593613 | 4.67 × 10⁻⁸ | 2.73 × 10−09 | 0.00018476 |
| EFCAB4B | 2.03186213 | 4.66 × 10⁻¹¹ | 1.96 × 10⁻¹⁴ | 4.98 × 10⁻⁵ |
| EFHA1 | 0.74675824 | 0.00147429 | 0.00014479 | 0.00278932 |
| ITPR1 | 0.83887283 | 3.72 × 10⁻⁵ | 0.00927132 | 0.00956689 |
| ITPR2 | 1.76953569 | 4.12 × 10−46 | 5.79 × 10⁻²¹ | 3.01 × 10⁻⁶ |
| ITPR3 | 0.52236077 | 3.25 × 10⁻⁵ | 0.0068986 | 0.01284295 |
| MCOLN1 | 1.79737402 | 8.88 × 10−82 | 2.08 × 10⁻¹⁷ | 8.54 × 10⁻⁷ |
| MCU | 0.73588616 | 6.87 × 10⁻⁸ | 0.00151019 | 0.00278932 |
| MICU1 | 0.50129943 | 0.00011815 | 0.02325149 | 0.01284295 |
| ORAI2 | 2.15394804 | 4.74 × 10⁻¹⁵ | 3.48 × 10⁻¹⁴ | 0.00018476 |
| PKD2L1 | 5.34354792 | 1.49 × 10⁻⁸ | 2.43 × 10⁻¹⁰ | 3.01 × 10⁻⁶ |
| RYR2 | 12.5085599 | 1.17 × 10⁻³⁰ | 1.39 × 10−77 | 2.95 × 10⁻¹⁰ |
| SLC8A2 | 4.76101144 | 2.08 × 10⁻¹⁵ | 1.17 × 10⁻¹⁴ | 0.00010438 |
| STIM1 | 1.92340546 | 5.41 × 10−70 | 1.20 × 10⁻²³ | 1.80 × 10⁻⁶ |
| TRPA1 | −7.2445088 | 9.71 × 10⁻⁸ | 4.32 × 10⁻¹⁰ | 3.59 × 10⁻⁶ |
| TRPM5 | 1.57085974 | 7.99 × 10⁻⁶ | 0.00121578 | 0.00097882 |
| TRPV6 | 3.55456363 | 7.99 × 10⁻⁶ | 1.29 × 10⁻⁶ | 0.02627047 |
| VDAC1 | 1.70533848 | 1.03 × 10−75 | 1.02 × 10−39 | 1.03 × 10⁻⁸ |
| VDAC2 | 0.32791712 | 0.00017495 | 0.035753 | 0.00617185 |
| VDAC3 | 1.50237461 | 6.80 × 10⁻¹⁰ | 1.07 × 10⁻¹⁴ | 5.86 × 10⁻⁶ |
© 2017 by the authors. Licensee MDPI, Basel, Switzerland. This article is an open access article distributed under the terms and conditions of the Creative Commons Attribution (CC BY) license (http://creativecommons.org/licenses/by/4.0/).
Share and Cite
Pérez-Riesgo, E.; Gutiérrez, L.G.; Ubierna, D.; Acedo, A.; Moyer, M.P.; Núñez, L.; Villalobos, C. Transcriptomic Analysis of Calcium Remodeling in Colorectal Cancer. Int. J. Mol. Sci. 2017, 18, 922. https://doi.org/10.3390/ijms18050922
Pérez-Riesgo E, Gutiérrez LG, Ubierna D, Acedo A, Moyer MP, Núñez L, Villalobos C. Transcriptomic Analysis of Calcium Remodeling in Colorectal Cancer. International Journal of Molecular Sciences. 2017; 18(5):922. https://doi.org/10.3390/ijms18050922
Chicago/Turabian StylePérez-Riesgo, Enrique, Lucía G. Gutiérrez, Daniel Ubierna, Alberto Acedo, Mary P. Moyer, Lucía Núñez, and Carlos Villalobos. 2017. "Transcriptomic Analysis of Calcium Remodeling in Colorectal Cancer" International Journal of Molecular Sciences 18, no. 5: 922. https://doi.org/10.3390/ijms18050922