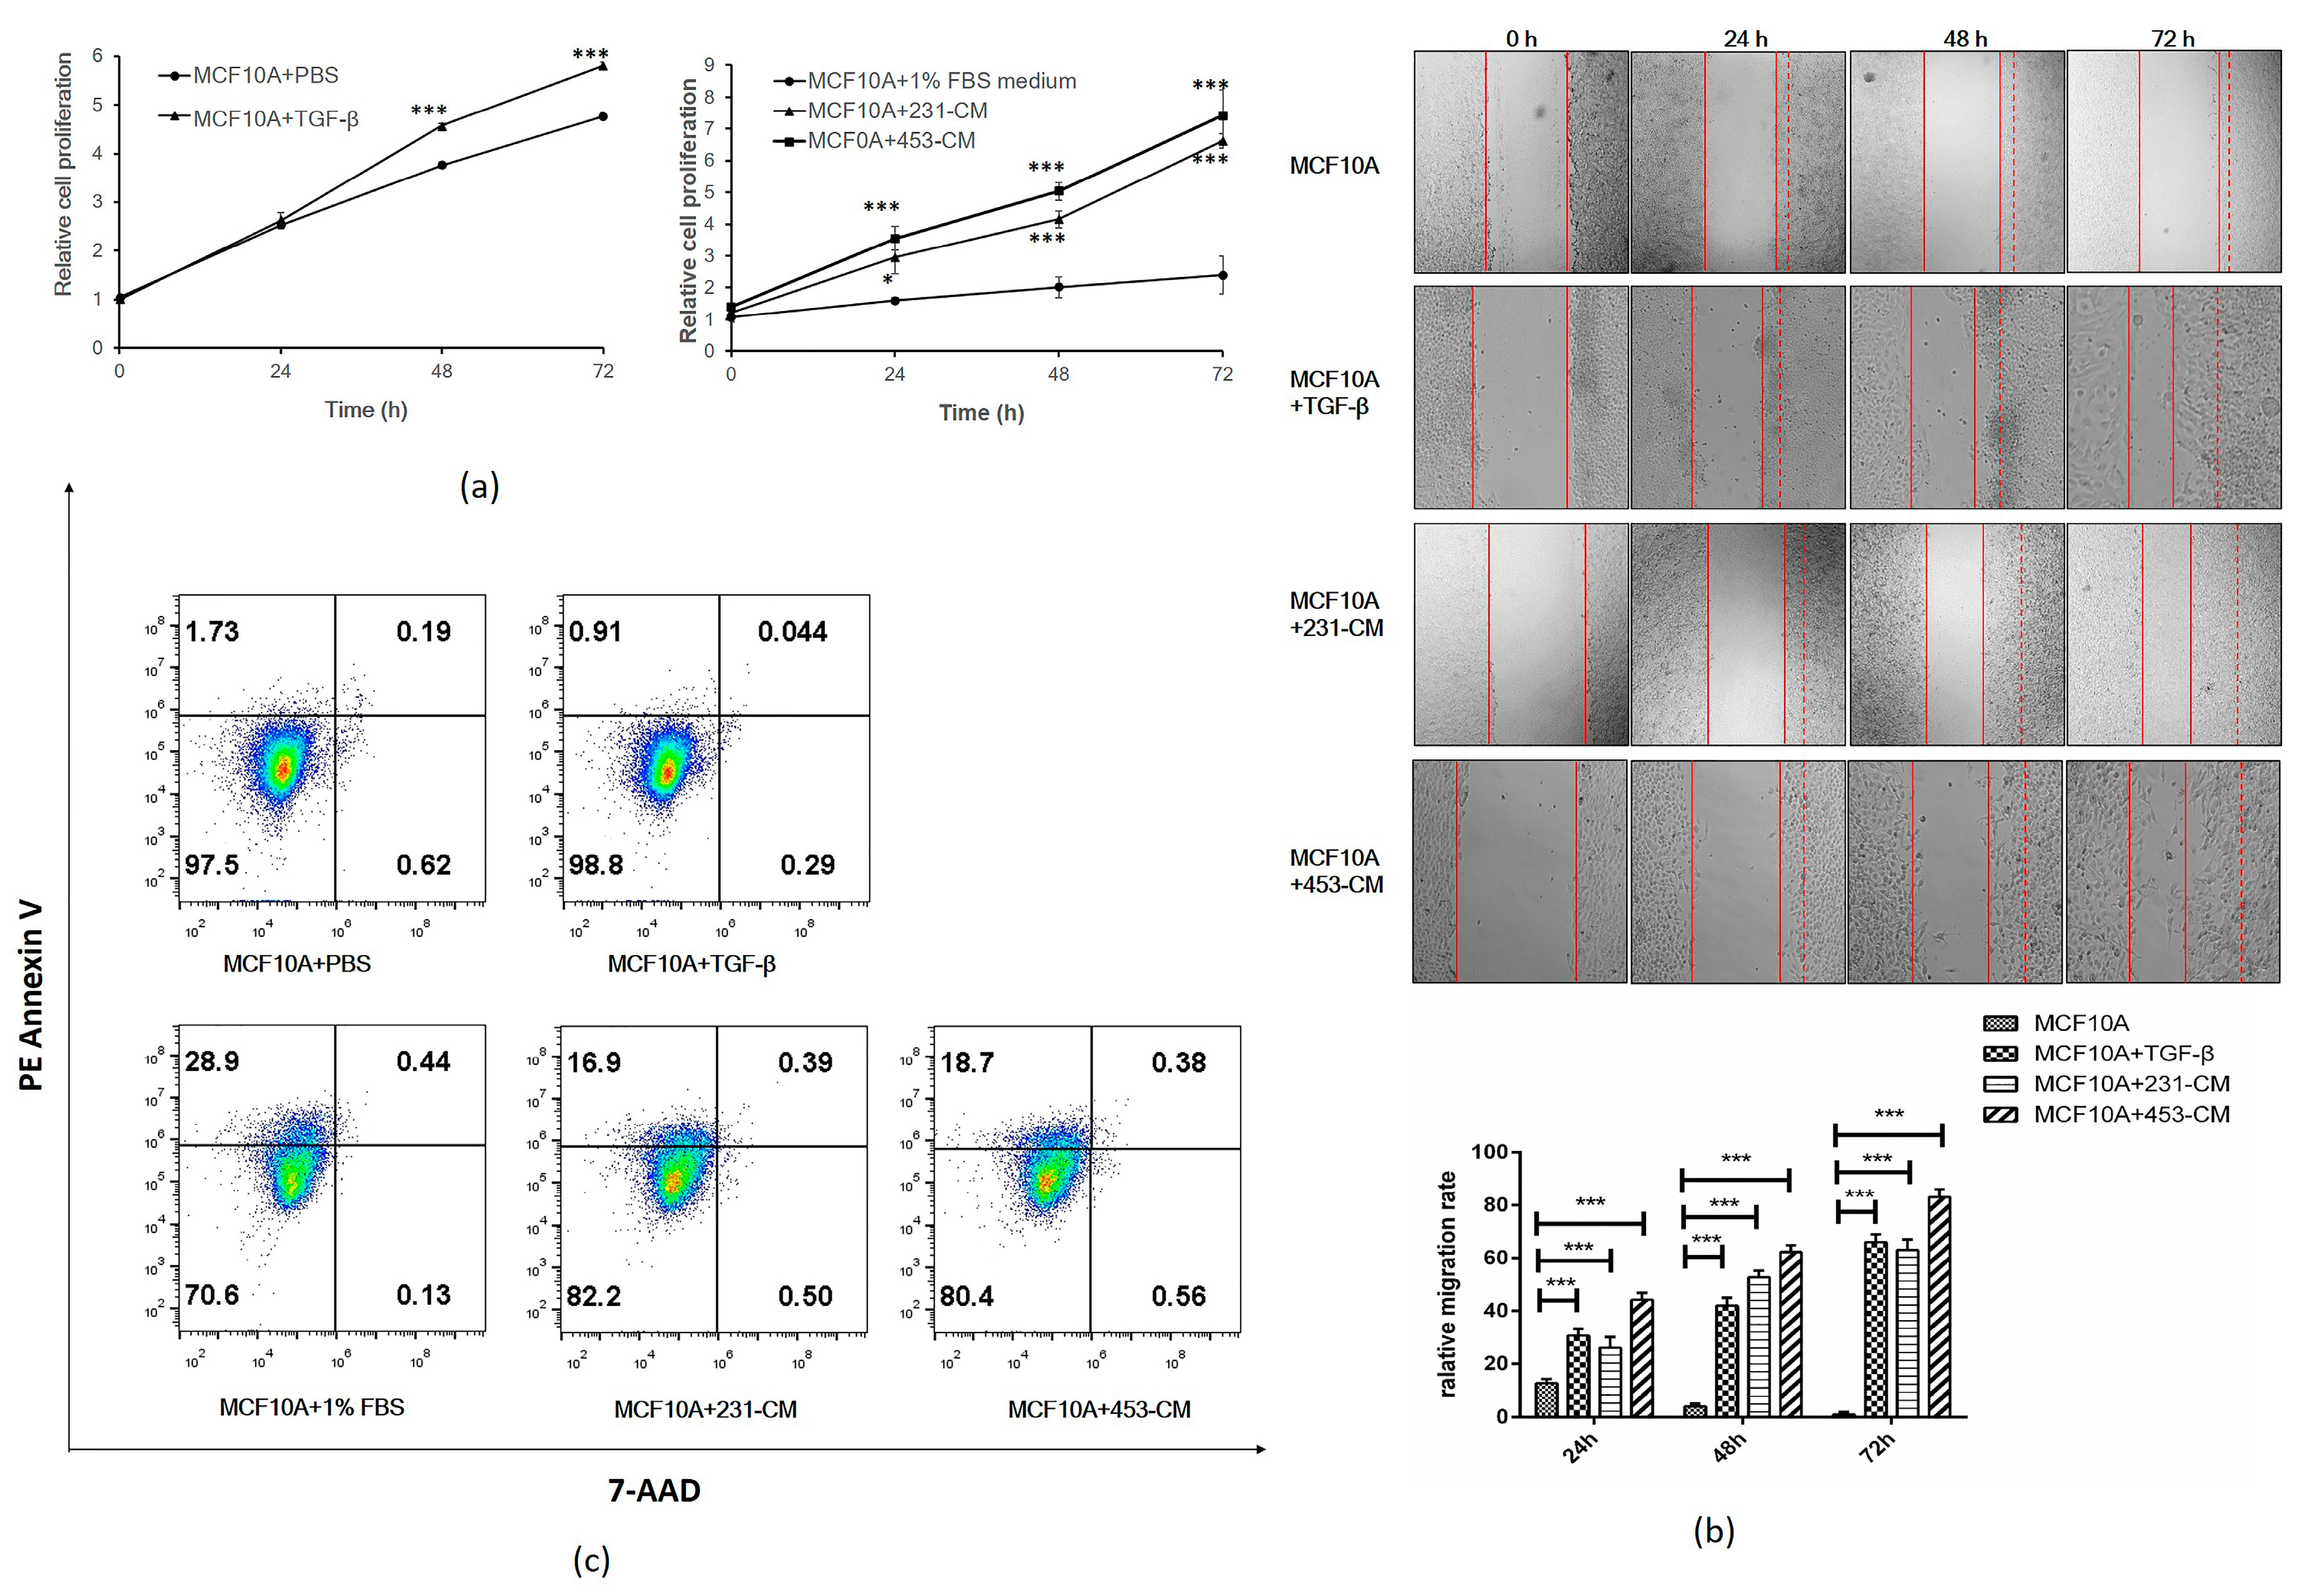
Conditioned Medium from Malignant Breast Cancer Cells Induces an EMT-Like Phenotype and an Altered N-Glycan Profile in Normal Epithelial MCF10A Cells


 , ,
, ,
Abstract
: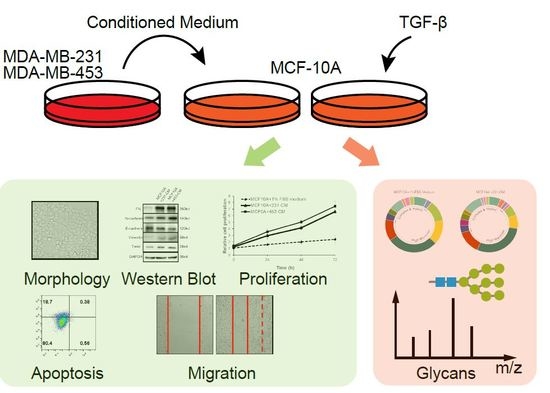
1. Introduction
2. Results
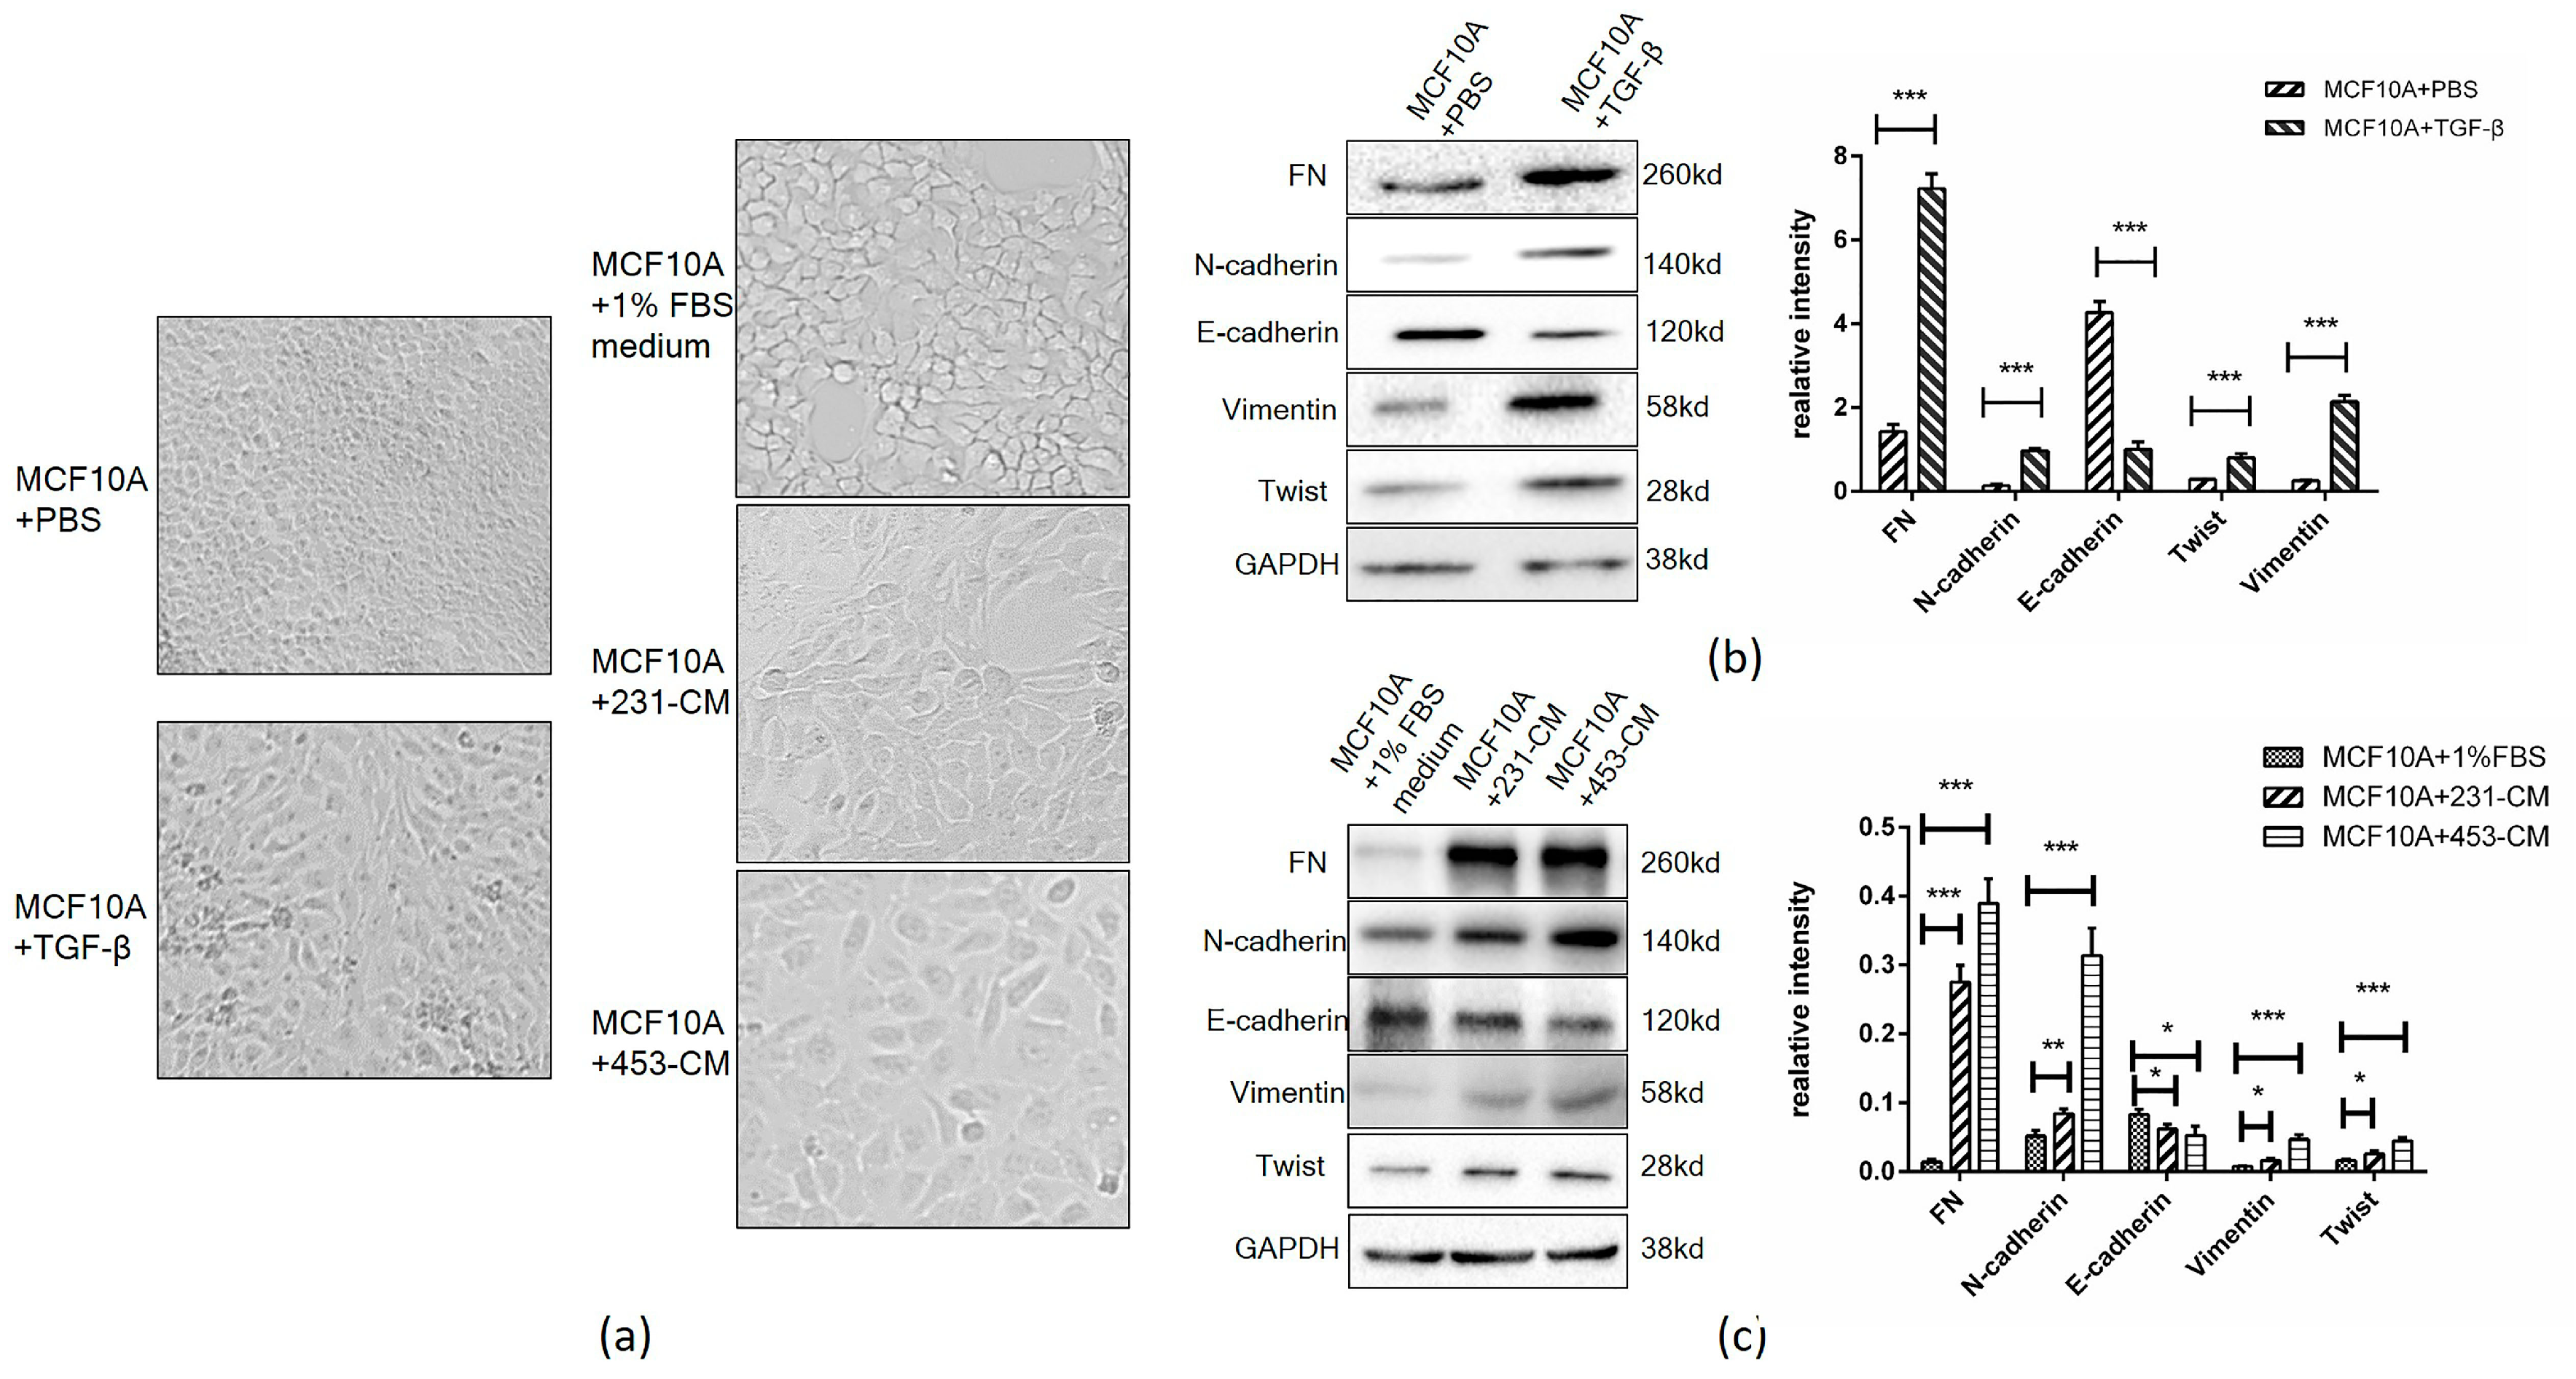
2.1. CM Induces an Increased Expression of EMT Markers in MCF10A Cells
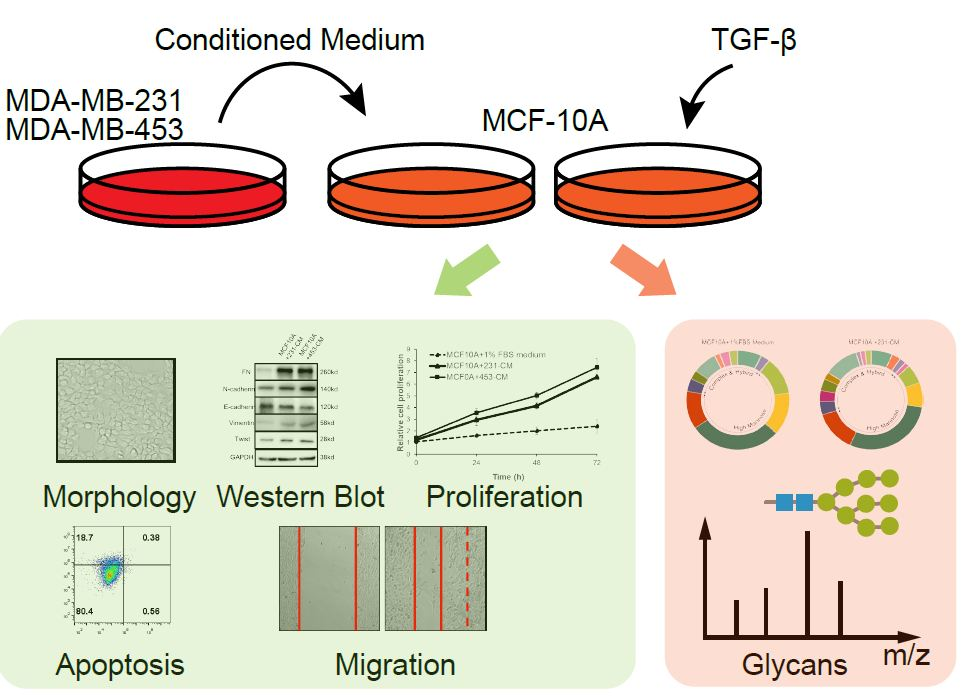
2.2. CM Promotes Proliferation and Migration But Inhibits the Apoptosis of MCF10A Cells
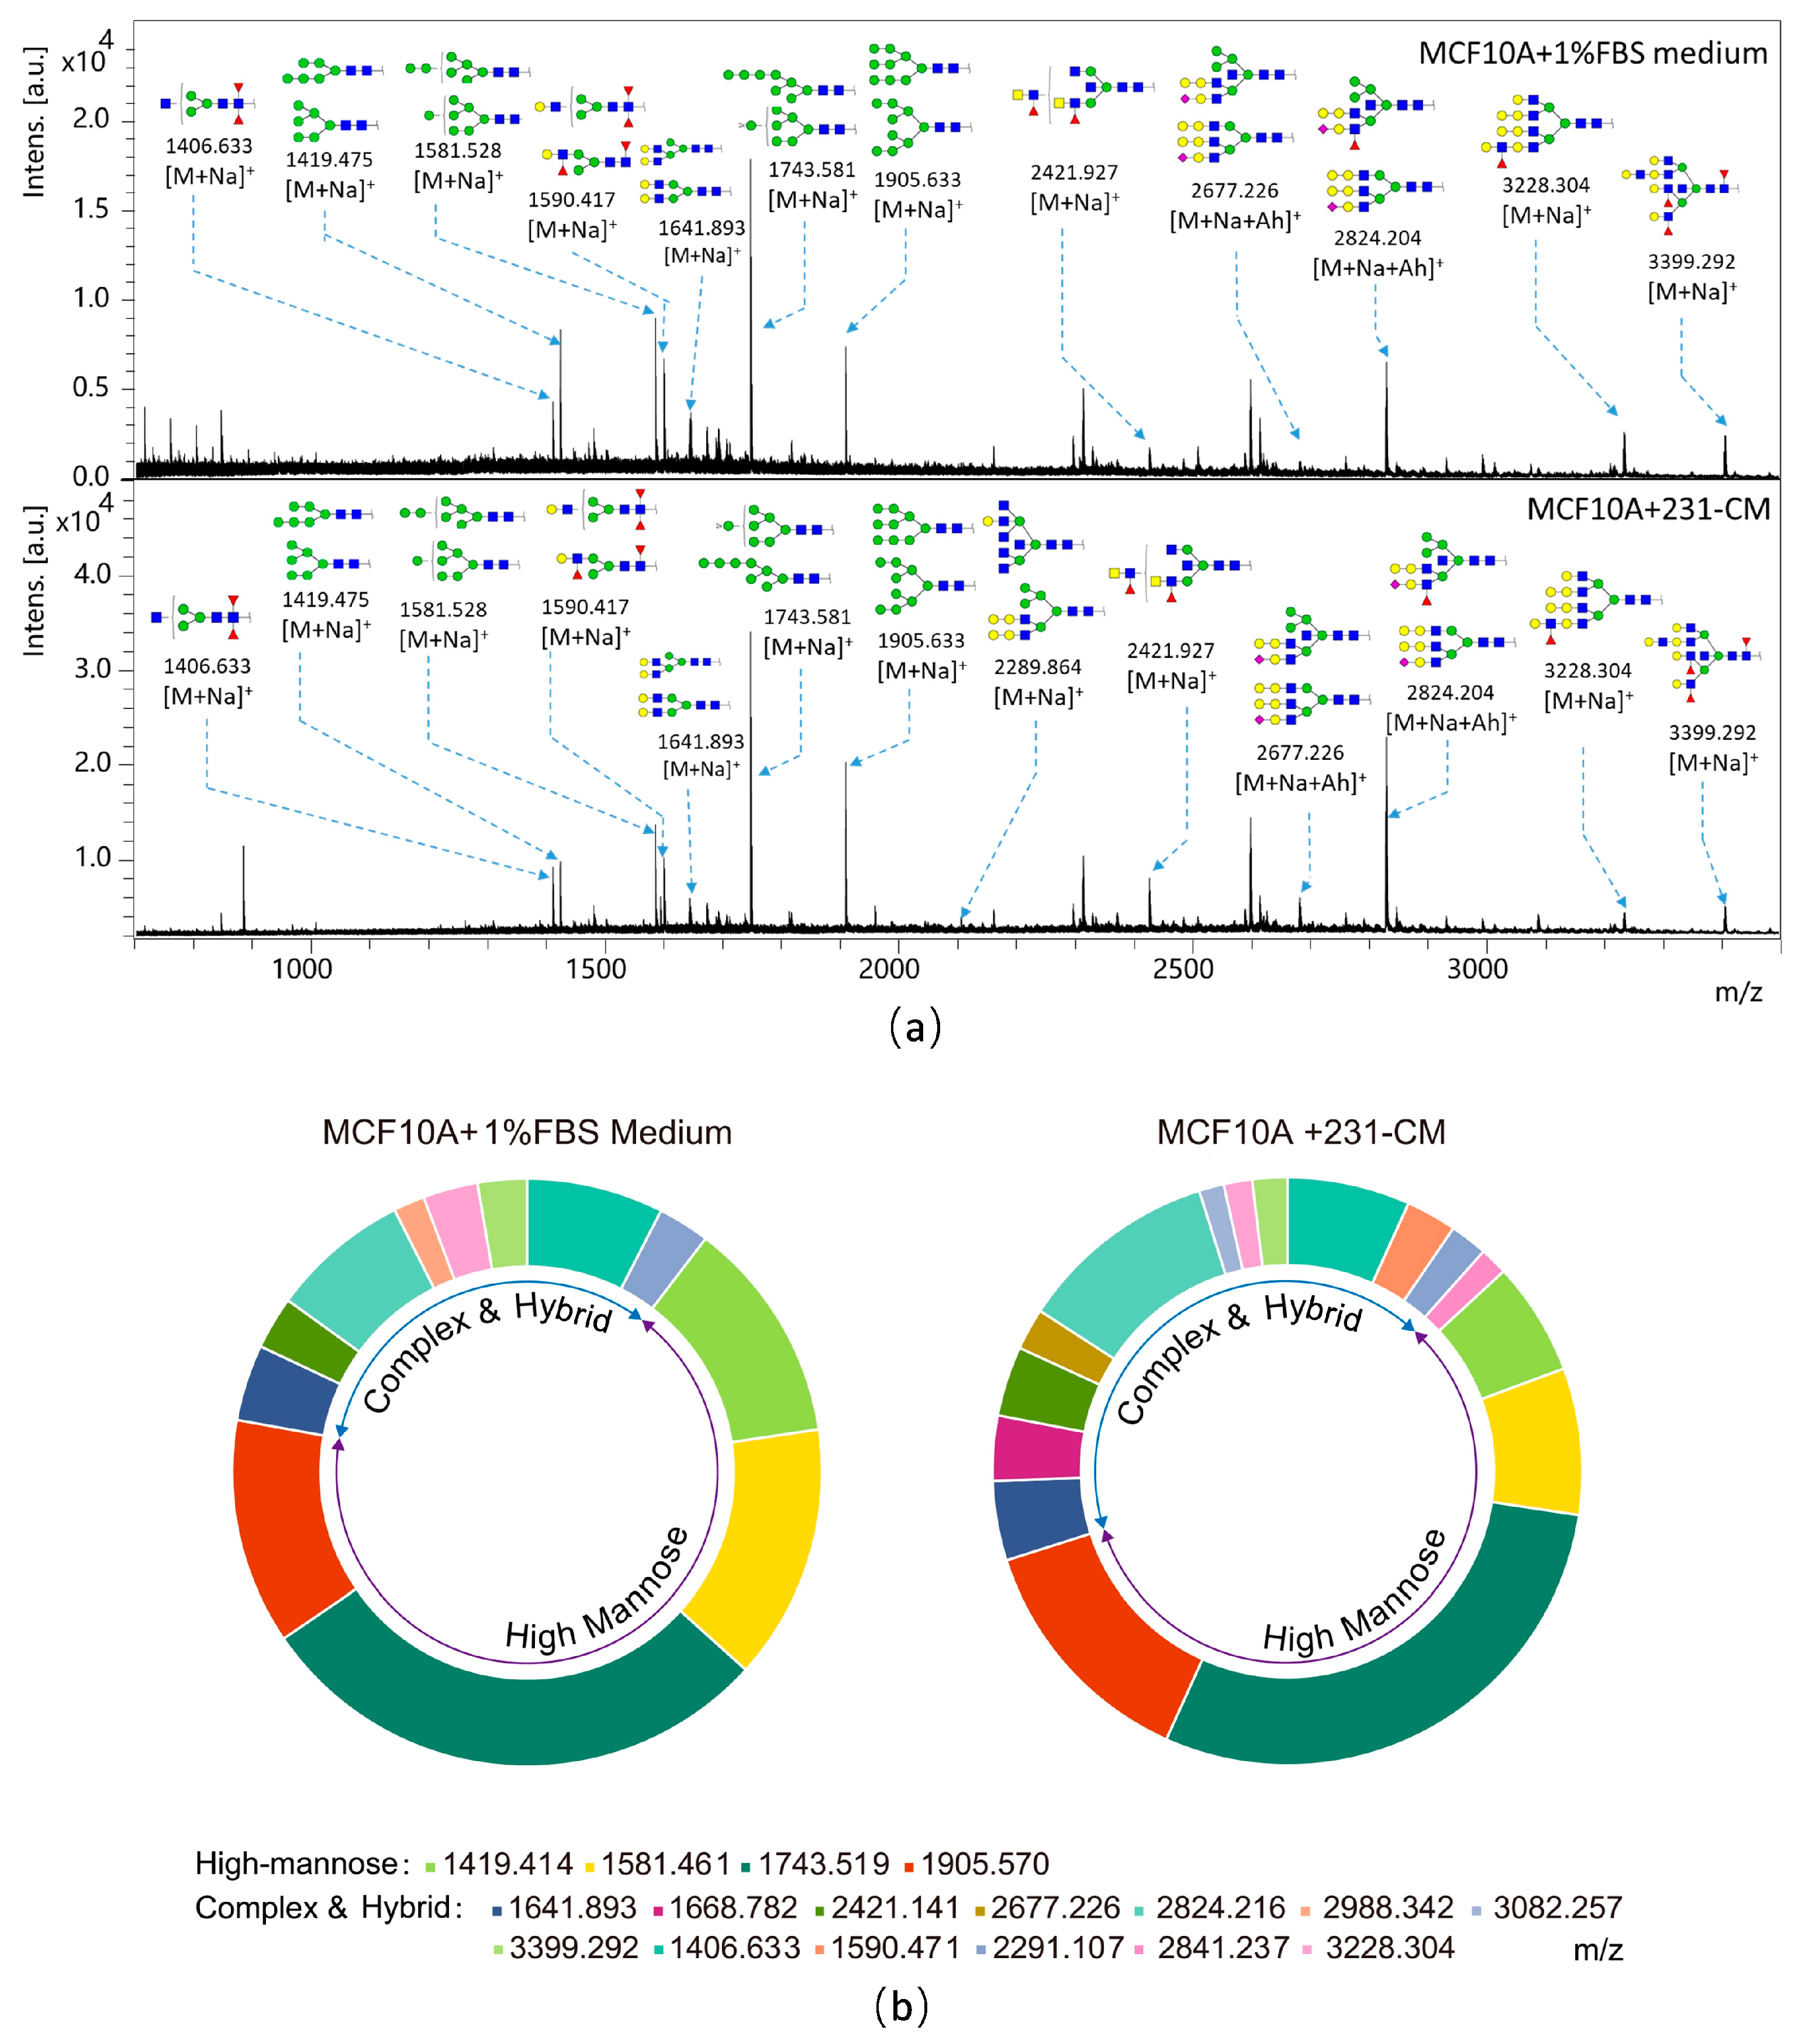
2.3. N-Glycan Profiling of CM-Treated MCF10A Cells by MALDI-TOF/TOF-MS
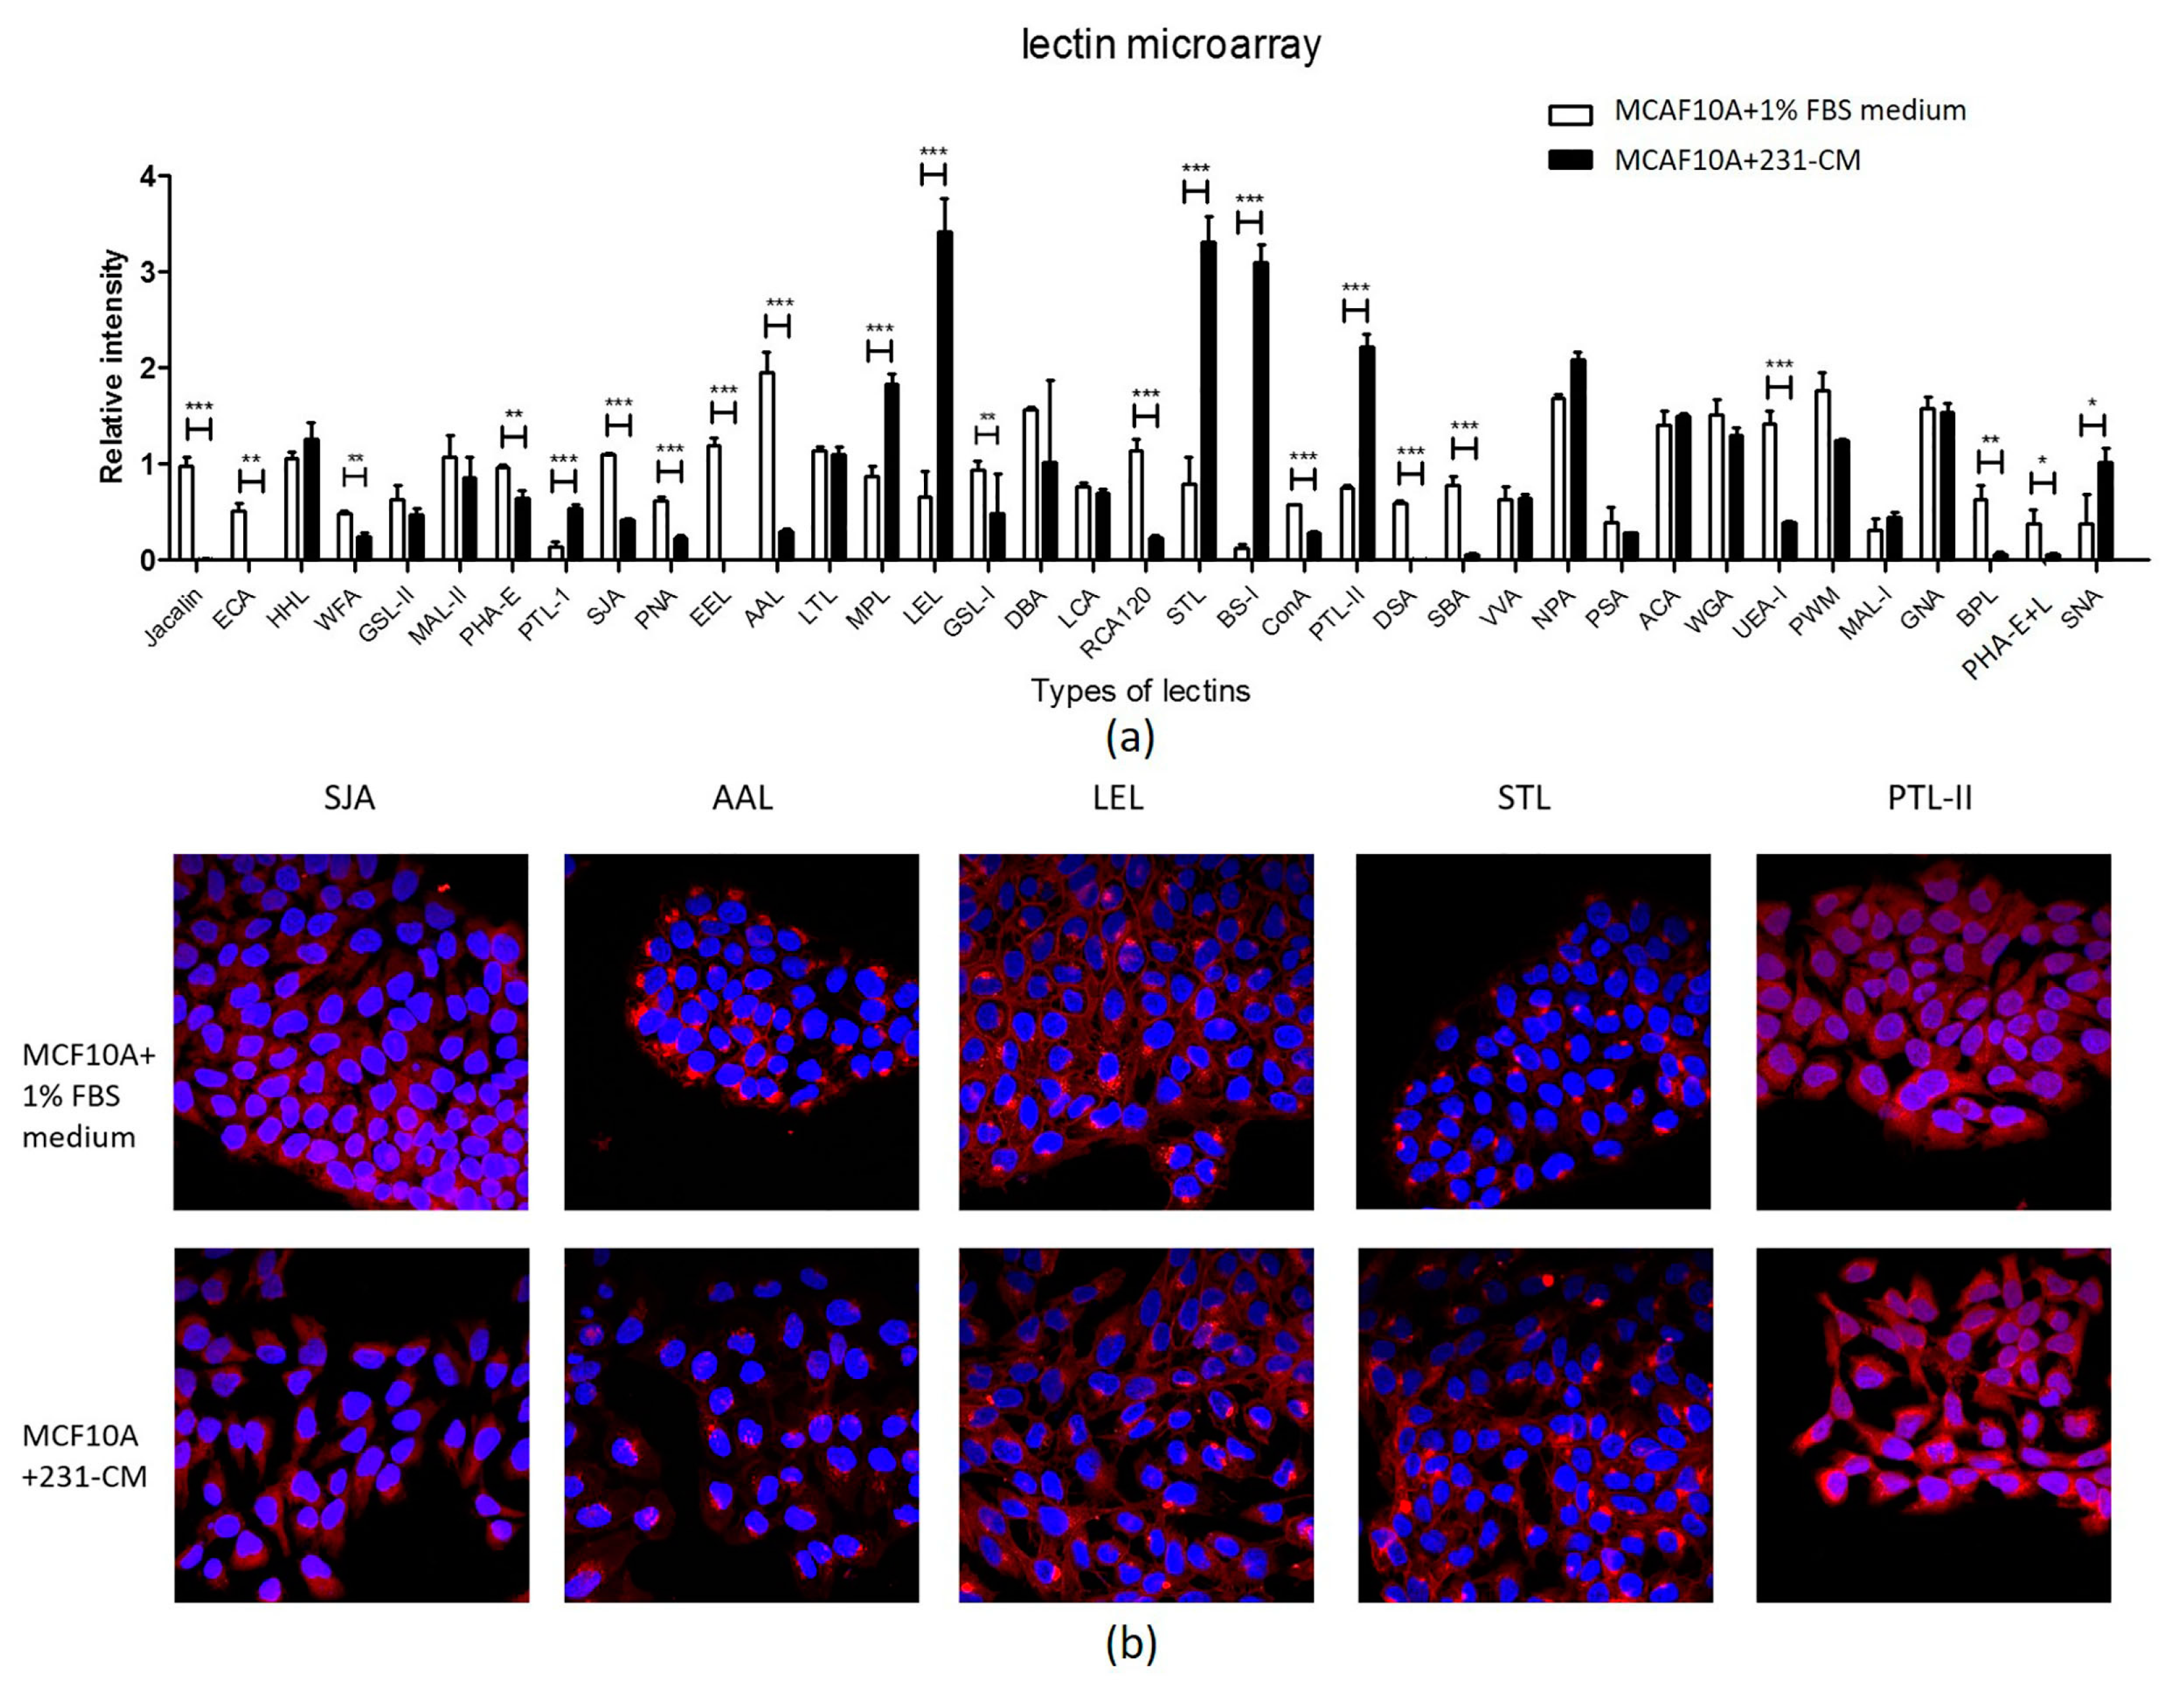
2.4. Lectin Microarray Analysis Reveals Altered Glycopattern in 231-CM-Treated MCF10A Cells
3. Discussion
4. Materials and Methods
4.1. Cell Lines and Cell Culture
4.2. Antibodies and Reagents
4.3. Conditioned Medium (CM)
4.4. Total Protein Extraction
4.5. Proliferation (MTT) Assay
4.6. Wound Assay
4.7. Apoptosis Detection
4.8. Release and Purification of N-Glycans
4.9. MALDI-TOF/TOF-MS Analysis of N-Glycans
4.10. Lectin Microarray Analysis and Data Analysis
4.11. Lectin Staining
4.12. Statistical Analysis
Supplementary Materials
Acknowledgments
Author Contributions
Conflicts of Interest
References
- Thiery, J.P.; Acloque, H.; Huang, R.Y.; Nieto, M.A. Epithelial-mesenchymal transitions in development and disease. Cell 2009, 139, 871–890. [Google Scholar] [CrossRef] [PubMed]
- Quaggin, S.E.; Kapus, A. Scar wars: Mapping the fate of epithelial-mesenchymal-myofibroblast transition. Kidney Int. 2011, 80, 41–50. [Google Scholar] [CrossRef] [PubMed]
- Taniguchi, N.; Kizuka, Y. Glycans and cancer: Role of N-glycans in cancer biomarker, progression and metastasis, and therapeutics. Adv. Cancer Res. 2015, 126, 11–51. [Google Scholar] [PubMed]
- Guan, F.; Schaffer, L.; Handa, K.; Hakomori, S.I. Functional role of gangliotetraosylceramide in epithelial-to-mesenchymal transition process induced by hypoxia and by TGF-β. FASEB J. 2010, 24, 4889–4903. [Google Scholar] [CrossRef] [PubMed]
- Li, S.; Mo, C.; Peng, Q.; Kang, X.; Sun, C.; Jiang, K.; Huang, L.; Lu, Y.; Sui, J.; Qin, X.; Liu, Y. Cell surface glycan alterations in epithelial mesenchymal transition process of Huh7 hepatocellular carcinoma cell. PLoS ONE 2013, 8, e71273. [Google Scholar] [CrossRef] [PubMed]
- Maupin, K.A.; Sinha, A.; Eugster, E.; Miller, J.; Ross, J.; Paulino, V.; Keshamouni, V.G.; Tran, N.; Berens, M.; Webb, C.; et al. Glycogene expression alterations associated with pancreatic cancer epithelial-mesenchymal transition in complementary model systems. PLoS ONE 2010, 5, e13002. [Google Scholar] [CrossRef] [PubMed]
- Tan, Z.; Lu, W.; Li, X.; Yang, G.; Guo, J.; Yu, H.; Li, Z.; Guan, F. Altered N-glycan expression profile in epithelial-to-mesenchymal transition of NMuMG cells revealed by an integrated strategy using mass spectrometry and glycogene and lectin microarray analysis. J. Proteome Res. 2014, 13, 2783–2795. [Google Scholar] [CrossRef] [PubMed]
- Guo, J.; Li, X.; Tan, Z.; Lu, W.; Yang, G.; Guan, F. Alteration of N-glycans and expression of their related glycogenes in the epithelial-mesenchymal transition of HCV29 bladder epithelial cells. Molecules 2014, 19, 20073–20090. [Google Scholar] [CrossRef] [PubMed]
- Muralidharan-Chari, V.; Clancy, J.W.; Sedgwick, A.; D′Souza-Schorey, C. Microvesicles: Mediators of extracellular communication during cancer progression. J. Cell Sci. 2010, 123, 1603–1611. [Google Scholar] [CrossRef] [PubMed]
- Gordon, K.J.; Blobe, G.C. Role of transforming growth factor-β superfamily signaling pathways in human disease. Biochim. Biophys. Acta 2008, 1782, 197–228. [Google Scholar] [CrossRef] [PubMed]
- Lin, S.Y.; Yang, J.; Everett, A.D.; Clevenger, C.V.; Koneru, M.; Mishra, P.J.; Kamen, B.; Banerjee, D.; Glod, J. The isolation of novel mesenchymal stromal cell chemotactic factors from the conditioned medium of tumor cells. Exp. Cell Res. 2008, 314, 3107–3117. [Google Scholar] [CrossRef] [PubMed]
- Kasashima, H.; Yashiro, M.; Nakamae, H.; Masuda, G.; Kinoshita, H.; Morisaki, T.; Fukuoka, T.; Hasegawa, T.; Sakurai, K.; Toyokawa, T.; et al. Bone marrow-derived stromal cells are associated with gastric cancer progression. Br. J. Cancer 2015, 113, 443–452. [Google Scholar] [CrossRef] [PubMed]
- Madera, L.; Greenshields, A.; Coombs, M.R.; Hoskin, D.W. 4T1 murine mammary carcinoma cells enhance macrophage-mediated innate inflammatory responses. PLoS ONE 2015, 10, e0133385. [Google Scholar] [CrossRef] [PubMed]
- Steinbichler, T.B.; Metzler, V.; Pritz, C.; Riechelmann, H.; Dudas, J. Tumor-associated fibroblast-conditioned medium induces CDDP resistance in HNSCC cells. Oncotarget 2016, 7, 2508–2518. [Google Scholar] [PubMed]
- Lau, K.S.; Dennis, J.W. N-Glycans in cancer progression. Glycobiology 2008, 18, 750–760. [Google Scholar] [CrossRef] [PubMed]
- Pawitan, J.A. Prospect of stem cell conditioned medium in regenerative medicine. BioMed Res. Int. 2014, 2014, 965849. [Google Scholar] [CrossRef] [PubMed]
- Kim, J.; Hwang, Y.S.; Chung, A.M.; Chung, B.G.; Khademhosseini, A. Liver cell line derived conditioned medium enhances myofibril organization of primary rat cardiomyocytes. Mol. Cells 2012, 34, 149–158. [Google Scholar] [CrossRef] [PubMed]
- Lee, E.; Pandey, N.B.; Popel, A.S. Crosstalk between cancer cells and blood endothelial and lymphatic endothelial cells in tumour and organ microenvironment. Expert Rev. Mol. Med. 2015, 17, e3. [Google Scholar] [CrossRef] [PubMed]
- Gupta, S.; Maitra, A. EMT: Matter of life or death? Cell 2016, 164, 840–842. [Google Scholar] [CrossRef] [PubMed]
- Heldin, C.H.; Vanlandewijck, M.; Moustakas, A. Regulation of EMT by TGFβ in cancer. FEBS Lett. 2012, 586, 1959–1970. [Google Scholar] [CrossRef] [PubMed]
- Fuster, M.M.; Esko, J.D. The sweet and sour of cancer: Glycans as novel therapeutic targets. Nat. Rev. Cancer 2005, 5, 526–542. [Google Scholar] [CrossRef] [PubMed]
- Chen, C.Y.; Jan, Y.H.; Juan, Y.H.; Yang, C.J.; Huang, M.S.; Yu, C.J.; Yang, P.C.; Hsiao, M.; Hsu, T.L.; Wong, C.H. Fucosyltransferase 8 as a functional regulator of nonsmall cell lung cancer. Proc. Natl. Acad. Sci. USA 2013, 110, 630–635. [Google Scholar] [CrossRef] [PubMed]
- Yue, L.; Han, C.; Li, Z.; Li, X.; Liu, D.; Liu, S.; Yu, H. Fucosyltransferase 8 expression in breast cancer patients: A high throughput tissue microarray analysis. Histol. Histopathol. 2016, 31, 547–555. [Google Scholar] [PubMed]
- Tu, Z.; Lin, Y.N.; Lin, C.H. Development of fucosyltransferase and fucosidase inhibitors. Chem. Soc. Rev. 2013, 42, 4459–4475. [Google Scholar] [CrossRef] [PubMed]
- Sethi, M.K.; Thaysen-Andersen, M.; Smith, J.T.; Baker, M.S.; Packer, N.H.; Hancock, W.S.; Fanayan, S. Comparative N-glycan profiling of colorectal cancer cell lines reveals unique bisecting GlcNAc and α-2,3-linked sialic acid determinants are associated with membrane proteins of the more metastatic/aggressive cell lines. J. Proteome Res. 2014, 13, 277–288. [Google Scholar] [CrossRef] [PubMed]
- Xu, Q.; Isaji, T.; Lu, Y.; Gu, W.; Kondo, M.; Fukuda, T.; Du, Y.; Gu, J. Roles of N-acetylglucosaminyltransferase III in epithelial-to-mesenchymal transition induced by transforming growth factor β1 (TGF-β1) in epithelial cell lines. J. Biol. Chem. 2012, 287, 16563–16574. [Google Scholar] [CrossRef] [PubMed]
- Huang, C.; Huang, M.; Chen, W.; Zhu, W.; Meng, H.; Guo, L.; Wei, T.; Zhang, J. N-acetylglucosaminyltransferase V modulates radiosensitivity and migration of small cell lung cancer through epithelial-mesenchymal transition. FEBS J. 2015, 282, 4295–4306. [Google Scholar] [CrossRef] [PubMed]
- Wang, Q.; Zhou, D.; Shao, D.; Shen, Z.; Gu, J. Effects of epidermal growth factor and insulin on the activity of N-acetylglucosaminyltransferase V. Biochem. J. 1997, 324, 543–545. [Google Scholar] [CrossRef] [PubMed]
- Miyoshi, E.; Moriwaki, K.; Nakagawa, T. Biological function of fucosylation in cancer biology. J. Biochem. 2008, 143, 725–729. [Google Scholar] [CrossRef] [PubMed]
- Ahn, J.M.; Sung, H.J.; Yoon, Y.H.; Kim, B.G.; Yang, W.S.; Lee, C.; Park, H.M.; Kim, B.J.; Kim, B.G.; Lee, S.Y.; An, H.J.; et al. Integrated glycoproteomics demonstrates fucosylated serum paraoxonase 1 alterations in small cell lung cancer. Mol. Cell Proteom. 2014, 13, 30–48. [Google Scholar] [CrossRef] [PubMed]
- Li, Y.; Wen, T.; Zhu, M.; Li, L.; Wei, J.; Wu, X.; Guo, M.; Liu, S.; Zhao, H.; Xia, S.; et al. Glycoproteomic analysis of tissues from patients with colon cancer using lectin microarrays and nanoLC-MS/MS. Mol. Biosyst. 2013, 9, 1877–1887. [Google Scholar] [CrossRef] [PubMed]
- Kizuka, Y.; Taniguchi, N. Enzymes for N-glycan branching and their genetic and nongenetic regulation in cancer. Biomolecules 2016, 6, 25. [Google Scholar] [CrossRef] [PubMed]
- Anugraham, M.; Jacob, F.; Nixdorf, S.; Everest-Dass, A.V.; Heinzelmann-Schwarz, V.; Packer, N.H. Specific glycosylation of membrane proteins in epithelial ovarian cancer cell lines: Glycan structures reflect gene expression and DNA methylation status. Mol. Cell. Proteom. 2014, 13, 2213–2232. [Google Scholar] [CrossRef] [PubMed]
- Drake, R.R. Glycosylation and cancer: Moving glycomics to the forefront. Adv. Cancer Res. 2015, 126, 1–10. [Google Scholar] [PubMed]
- Isaji, T.; Kariya, Y.; Xu, Q.; Fukuda, T.; Taniguchi, N.; Gu, J. Functional roles of the bisecting GlcNAc in integrin-mediated cell adhesion. Methods Enzymol. 2010, 480, 445–459. [Google Scholar] [PubMed]
- Lei, J.H.; Guan, F.; Xu, H.; Chen, L.; Su, B.T.; Zhou, Y.; Wang, T.; Li, Y.L.; Liu, W.Q. Application of an immunomagnetic bead ELISA based on IgY for detection of circulating antigen in urine of mice infected with Schistosoma Japonicum. Vet. Parasitol. 2012, 187, 196–202. [Google Scholar] [CrossRef] [PubMed]
- Straus, A.H.; Carter, W.G.; Wayner, E.A.; Hakomori, S. Mechanism of fibronectin-mediated cell migration: Dependence or independence of cell migration susceptibility on RGDS-directed receptor (integrin). Exp. Cell Res. 1989, 183, 126–139. [Google Scholar] [CrossRef]
- Yang, G.; Cui, T.; Wang, Y.; Sun, S.; Ma, T.; Wang, T.; Chen, Q.; Li, Z. Selective isolation and analysis of glycoprotein fractions and their glycomes from hepatocellular carcinoma sera. Proteomics 2013, 13, 1481–1498. [Google Scholar] [CrossRef] [PubMed]
- Yu, H.; Zhu, M.; Qin, Y.; Zhong, Y.; Yan, H.; Wang, Q.; Bian, H.; Li, Z. Analysis of glycan-related genes expression and glycan profiles in mice with liver fibrosis. J. Proteome Res. 2012, 11, 5277–5285. [Google Scholar] [CrossRef] [PubMed]
- Qin, Y.; Zhong, Y.; Dang, L.; Zhu, M.; Yu, H.; Chen, W.; Cui, J.; Bian, H.; Li, Z. Alteration of protein glycosylation in human hepatic stellate cells activated with transforming growth factor-β1. J. Proteom. 2012, 75, 4114–4123. [Google Scholar] [CrossRef] [PubMed]


| Experimental Spectrum | Glycan Structure | Relative Intensity | ||
|---|---|---|---|---|
| m/z | Type | MCF10A | MCF10A + 231-CM | |
| 1406.633 | M + Na+ |  | 0.0497 ± 0.0016 | 0.0502 ± 0.0022 |
| 1419.414 | M + Na+ | 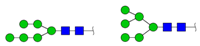 | 0.0816 ± 0.0066 | 0.0464 ± 0.0054 |
| 1581.461 | M + Na+ |  | 0.0930 ± 0.0052 | 0.0601 ± 0.0011 |
| 1590.471 | M + Na+ | 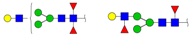 | 0.0207 ± 0.0002 | |
| 1641.893 | M + Na+ | 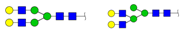 | 0.0278 ± 0.0060 | 0.0326 ± 0.0095 |
| 1668.782 | M + Na+ |  | 0.0266 ± 0.0010 | |
| 1743.519 | M + Na+ | 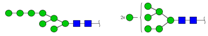 | 0.1904 ± 0.0026 | 0.2184 ± 0.0448 |
| 1905.570 | M + Na+ | 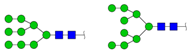 | 0.0821 ± 0.0047 | 0.0993 ± 0.0097 |
| 2291.107 | M + Na+ | 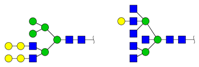 | 0.0188 ± 0.0050 | 0.0153 ± 0.0012 |
| 2421.141 | M + Na+ | 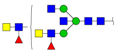 | 0.0192 ± 0.0009 | 0.0286 ± 0.0057 |
| 2677.226 | M + Ah (Acethydrazide) + Na+ | 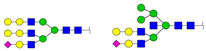 | 0.0170 ± 0.0036 | |
| 2824.216 | M + Ah + Na+ |  | 0.0505 ± 0.0022 | 0.0818 ± 0.0117 |
| 2841.237 | M + Ah + Na+ | 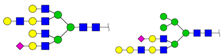 | 0.0114 ± 0.0015 | |
| 2988.342 | M + Na+ | 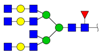 | 0.0113 ± 0.0000 | |
| 3082.257 | M + Ah + Na+ | 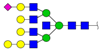 | 0.0102 ± 0.0000 | |
| 3228.304 | M + Na+M + Ah + Na+M + 2Ah + Na+ | 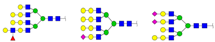 | 0.0199 ± 0.0000 | 0.0116 ± 0.0010 |
| 3399.292 | M + Na+M + Ah + Na+M + 2Ah + Na+ | 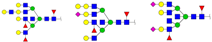 | 0.0179 ± 0.0000 | 0.0143 ± 0.0010 |
| Glycan Types | Relative Variation (%) | |
|---|---|---|
| MCF10A | MCF10A + 231-CM | |
| Hybrid | 10.35 | 13.09 |
| High-mannose | 67.50 | 56.99 |
| Complex | 22.14 | 29.92 |
| Biantennary | 8.69 | 10.89 |
| Triantennary | 9.22 | 10.55 |
| Tetra-antennary | 18.97 | 40.56 |
| Bisecting GlcNAc | 16.32 | 45.46 |
| Fucosylated | 17.71 | 45.91 |
| Lectin | Abbreviation | Specificity | Fold Change |
|---|---|---|---|
| Upregulated | |||
| Bandeiraea simplicifolia | BS-I | α-Gal (galactose) and α-GalNAc (N-acetylgalactosamine) | 25.7155 |
| Lycopersicon esculentum (tomato) lectin | LEL | sialylated and terminal Gal/GalNAc structures | 5.1599 |
| Solanum tuberosum (potato) lectin | STL | GlcNAc oligomer | 4.1605 |
| Psophocarpus tetragonolobus lectin I | PTL-I | αGalNAc and Gal | 3.8853 |
| Psophocarpus tetragonolobus lectin II | PTL-II | Gal | 2.9439 |
| Sambucus nigra lectin | SNA | Sia2-6Galβ1-4Glc(NAc) | 2.6970 |
| Maclura pomifera lectin | MPL | αGalNAc | 2.0992 |
| Downregulated | |||
| Phaseolus vulgaris agglutinin(E) | PHA-E | Bisecting GlcNAc and biantennary N-glycans | 0.6670 |
| Wisteria floribunda lectin | WFA | Terminal GalNAc | 0.5197 |
| Griffonia (Bandeiraea) simplicifolia lectin I | GSL-I | αGalNAc, GalNAcα-Ser/Thr (Tn), and αGal | 0.5126 |
| Canavalia ensiformis | ConA | branched and terminal mannose, terminal GlcNAc | 0.4926 |
| Sophora japonica agglutinin | SJA | Terminal GalNAc and Gal | 0.3750 |
| Peanut agglutinin | PNA | Galβ1-3GalNAcα-Ser/Thr(T) | 0.3664 |
| Ulex europaeus agglutinin I | UEA-I | Fucα1-2Galβ1-4Glc(NAc) | 0.2769 |
| Ricinus communis agglutinin I | RCA120 | β-Gal | 0.2070 |
| Phaseolus vulgaris agglutinin(E + L) | PHA-E+L | Bisecting GlcNAc, biantennary N-glycans, and tetra-antennary complex-type N-glycan | 0.1534 |
| Aleuria aurantia lectin | AAL | Fuc | 0.1521 |
| Bauhinia purpurea lectin | BPL | Galβ1-3GalNAc | 0.0939 |
| Soybean agglutinin | SBA | Terminal GalNAc (particularly GalNAcα1-3Gal) | 0.0703 |
| Datura stramonium | DSA | GlcNAc | 0.0106 |
| Artocarpus integrifolia | jacalin | Galβ1-3GalNAcα-Ser/Thr(T)and GalNAcα- Ser/Thr(T) | 0.0072 |
| Erythrina crista-galli | ECA | Galβ-1,4GlcNAc | 0.0017 |
| Euonymus europaeus lectin | EEL | Galα1-3(Fucα1-2)Gal | 0.0006 |
© 2017 by the authors. Licensee MDPI, Basel, Switzerland. This article is an open access article distributed under the terms and conditions of the Creative Commons Attribution (CC BY) license (http://creativecommons.org/licenses/by/4.0/).
Share and Cite
Guo, J.; Liu, C.; Zhou, X.; Xu, X.; Deng, L.; Li, X.; Guan, F. Conditioned Medium from Malignant Breast Cancer Cells Induces an EMT-Like Phenotype and an Altered N-Glycan Profile in Normal Epithelial MCF10A Cells. Int. J. Mol. Sci. 2017, 18, 1528. https://doi.org/10.3390/ijms18081528
Guo J, Liu C, Zhou X, Xu X, Deng L, Li X, Guan F. Conditioned Medium from Malignant Breast Cancer Cells Induces an EMT-Like Phenotype and an Altered N-Glycan Profile in Normal Epithelial MCF10A Cells. International Journal of Molecular Sciences. 2017; 18(8):1528. https://doi.org/10.3390/ijms18081528
Chicago/Turabian StyleGuo, Jia, Changmei Liu, Xiaoman Zhou, Xiaoqiang Xu, Linhong Deng, Xiang Li, and Feng Guan. 2017. "Conditioned Medium from Malignant Breast Cancer Cells Induces an EMT-Like Phenotype and an Altered N-Glycan Profile in Normal Epithelial MCF10A Cells" International Journal of Molecular Sciences 18, no. 8: 1528. https://doi.org/10.3390/ijms18081528