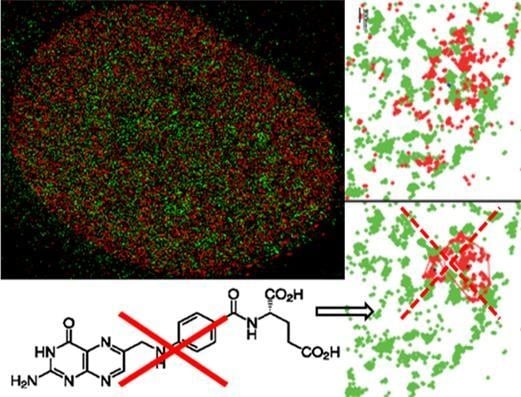
Super-Resolution Localization Microscopy of γ-H2AX and Heterochromatin after Folate Deficiency


Abstract
:
1. Introduction
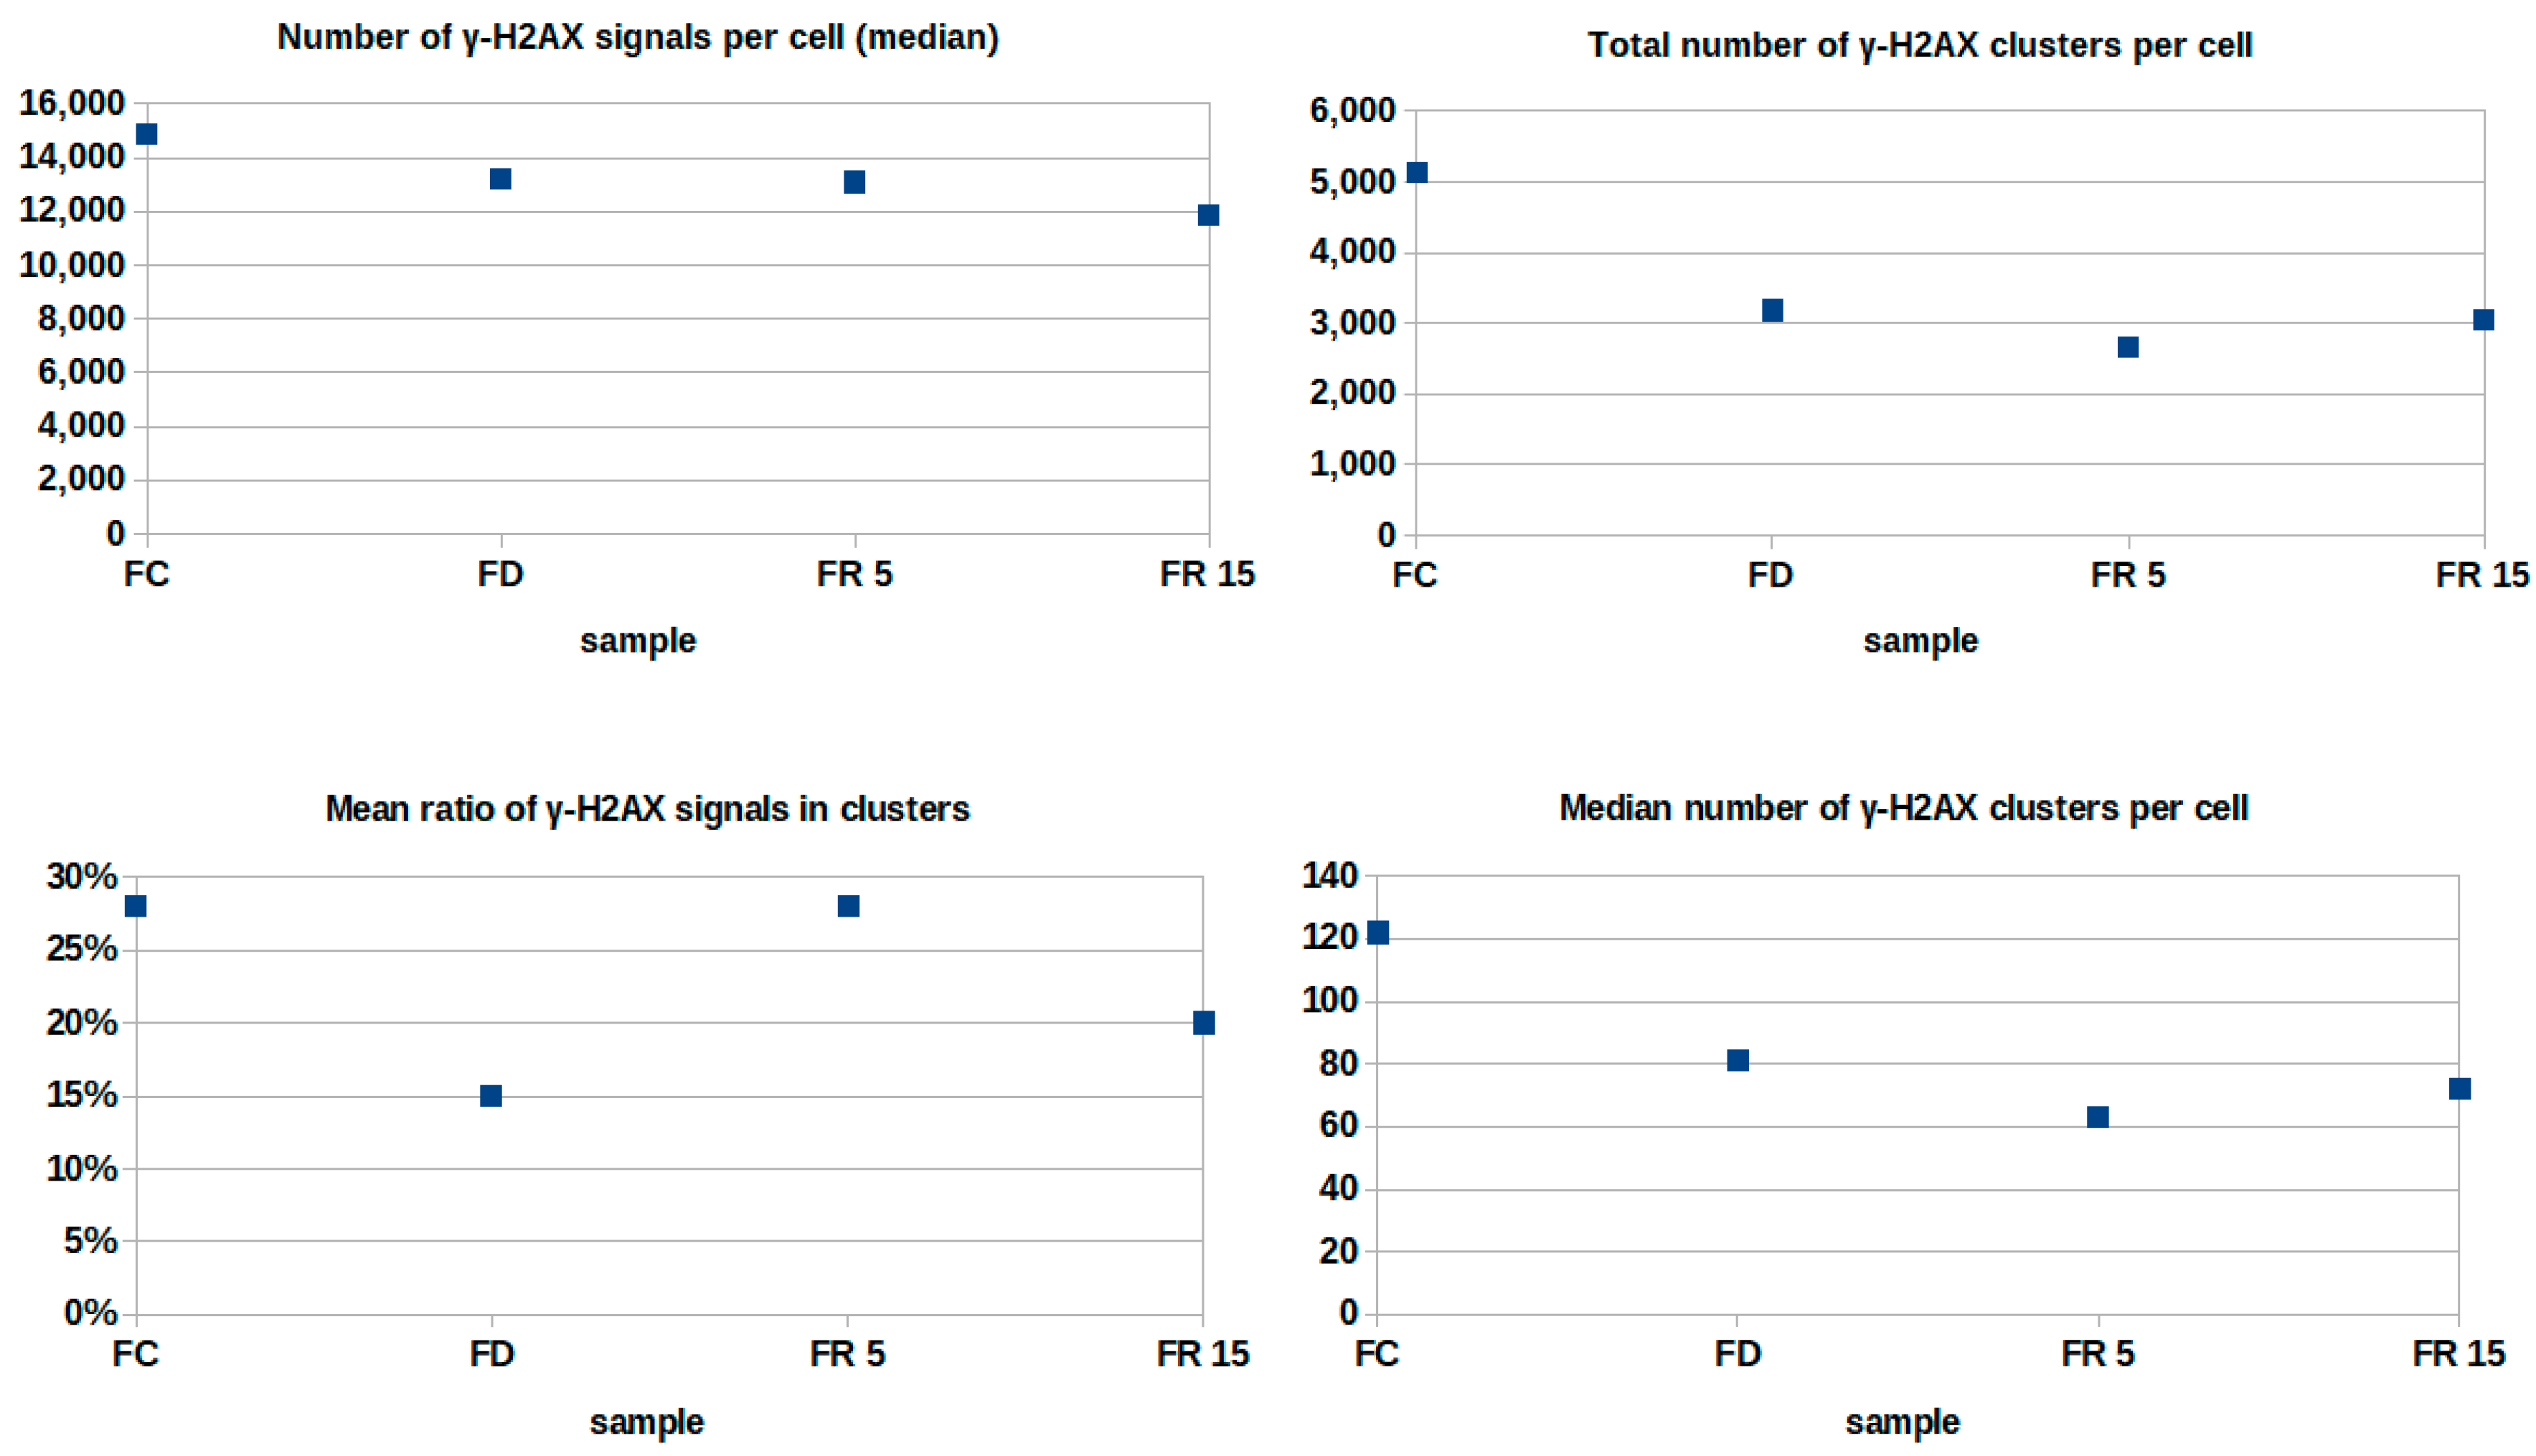
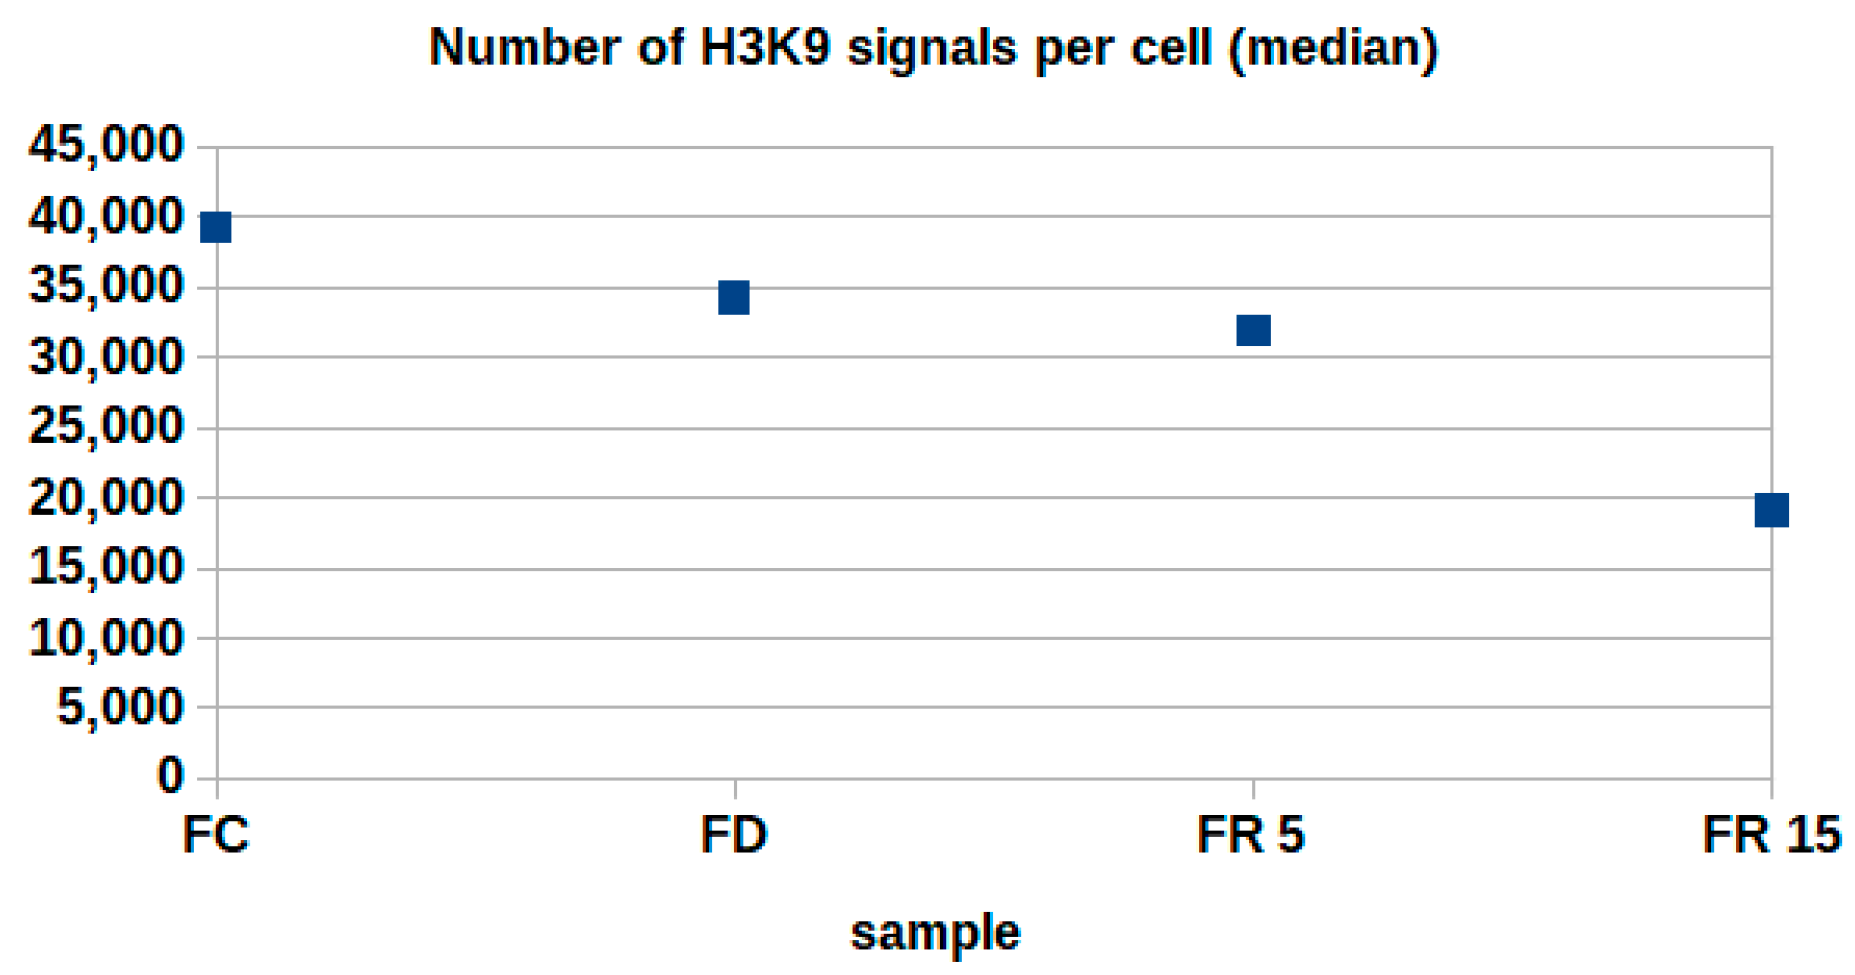
2. Results
3. Discussion
4. Materials and Methods
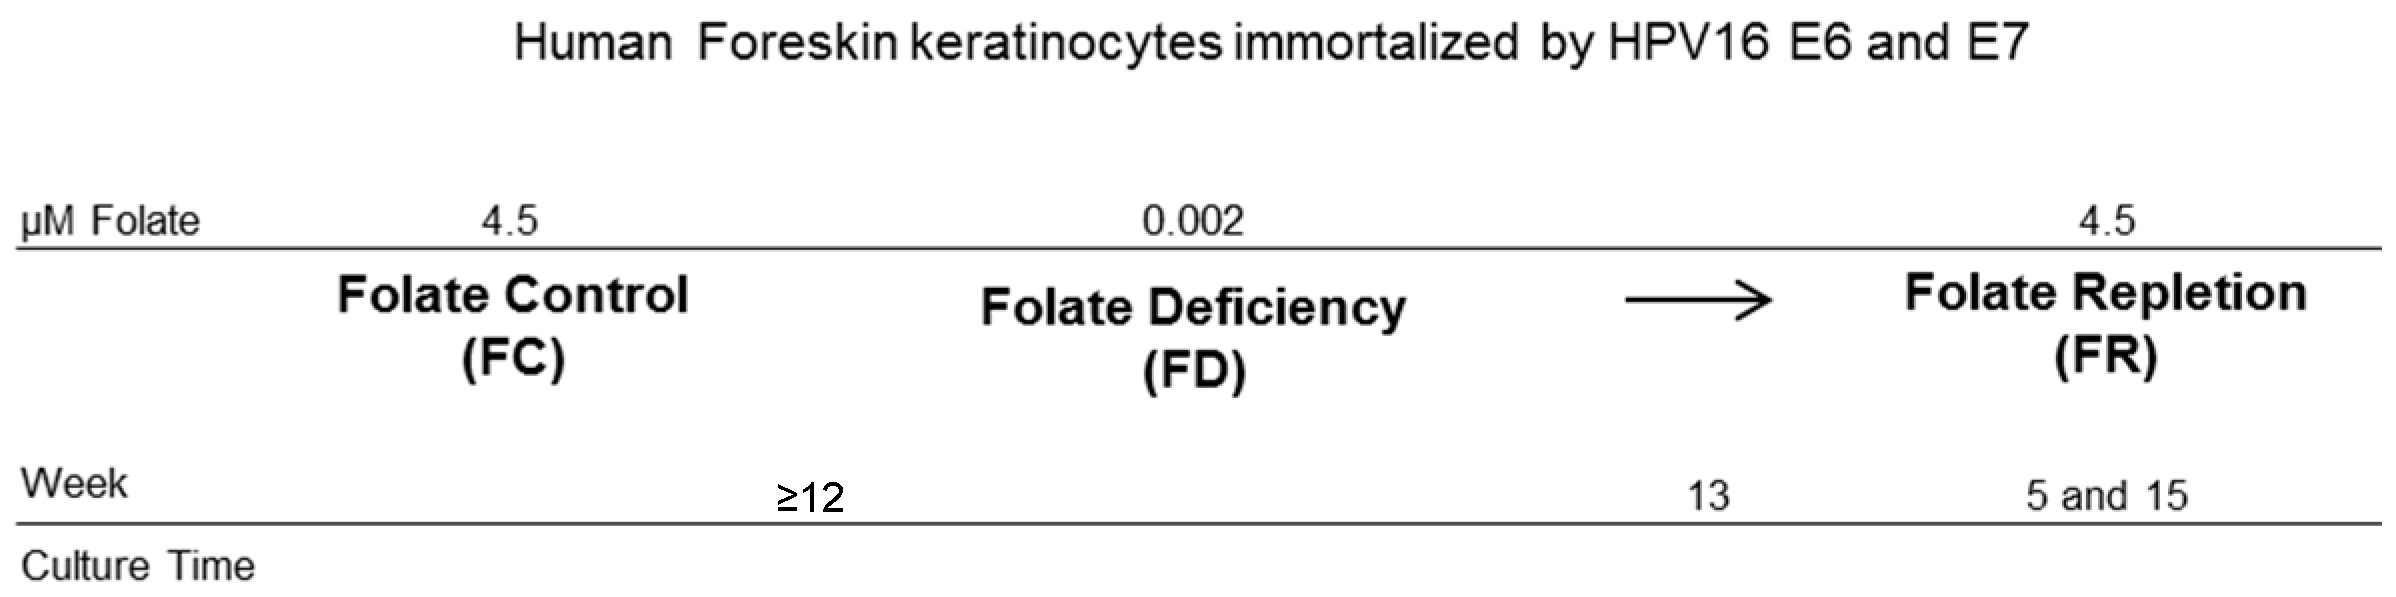
4.1. Cell Model and Culturing
4.2. Slide Preparation
4.3. Single Molecule Localization Microscopy (SMLM)
4.4. Data Acquisition and Processing
5. Conclusions
Acknowledgments
Author Contributions
Conflicts of Interest
References
- Stover, P.J. Physiology of folate and vitamin B12 in health and disease. Nutr. Rev. 2004, 62, 3–12. [Google Scholar] [CrossRef]
- Kimura, M.; Umegaki, K.; Higuchi, M.; Thomas, P.; Fenech, M. Methylenetetrahydrofolate reductase C677T polymorphism, folic acid and riboflavin are important determinants of genome stability in cultured human lympohocytes. J. Nutr. 2004, 133, 48–56. [Google Scholar]
- Jones, P.A.; Gonzalgo, M.L. Altered DNA methylation and genome instability: A new pathway to cancer? Proc. Natl. Acad. Sci. USA 1997, 94, 2103–2105. [Google Scholar] [CrossRef] [PubMed]
- Kim, Y.I. Folate and carcinogenesis: Evidence, mechanisms, and implications. J. Nutr. Biochem. 1999, 10, 66–88. [Google Scholar] [CrossRef]
- Piyathilake, C.J.; Henao, O.L.; Macaluso, M.; Cornwell, P.E.; Meleth, S.; Heimburger, D.C.; Partridge, E.E. Folate is associated with the natural history of high-risk human papillomaviruses. Cancer Res. 2004, 64, 8788–8793. [Google Scholar] [CrossRef] [PubMed]
- Pathak, S.; Bajpai, D.; Banerjee, A.; Bhatla, N.; Jain, S.K.; Jayaram, H.N.; Singh, N. Serum one-carbon metabolites and risk of cervical cancer. Nutr. Cancer 2014, 66, 818–824. [Google Scholar] [CrossRef] [PubMed]
- Pathak, S.; Bhatla, N.; Singh, N. Cervical cancer pathogenesis is associated with one-carbon metabolism. Mol. Cell. Biochem. 2012, 369, 1–7. [Google Scholar] [CrossRef] [PubMed]
- Piyathilake, C.J.; Macaluso, M.; Brill, I.; Heimburger, D.C.; Partridge, E.E. Lower red blood cell folate enhances the HPV-16-associated risk of cervical intraepithelial neoplasia. Nutrition 2007, 23, 203–210. [Google Scholar] [CrossRef] [PubMed]
- Giovannucci, E. Epidemiologic studies of folate and colorectal neoplasia: A review. J. Nutr. 2002, 132, 2350–2355. [Google Scholar]
- Francois, M.; Leifert, W.R.; Tellam, R.; Fenech, M.F. Folate deficiency and DNA methyltransferase inhibition moderate G-quadruplex frequency. Mutagenesis 2016, 31, 409–416. [Google Scholar] [CrossRef] [PubMed]
- Crider, K.S.; Yang, T.P.; Barry, R.J.; Bailey, L.B. Folate and DNA methylation. A review of molecular mechanisms and the evidence for folate’s role. Adv. Nutr. 2012, 3, 21–38. [Google Scholar] [CrossRef] [PubMed]
- Lamprecht, S.A.; Lipkin, M. Chemoprevention of colon cancer by calcium, vitamin D and folate: Molecular mechanisms. Nat. Rev. Cancer 2003, 3, 601–614. [Google Scholar] [CrossRef] [PubMed]
- Duthie, S.J. Folic acid deficiency and cancer: Mechanisms of DNA instability. Br. Med. Bull. 1999, 55, 578–592. [Google Scholar] [CrossRef] [PubMed]
- Choi, S.W.; Mason, J.B. Folate and carcinogenesis: An integrated scheme. J. Nutr. 2000, 130, 129–132. [Google Scholar] [PubMed]
- Bester, A.C.; Roniger, M.; Oren, Y.S.; Im, M.M.; Sarni, D.; Chaoat, M.; Bensimon, A.; Zamir, G.; Shewach, D.S.; Kerem, B. Nucleotide deficiency promotes genomic instability in early stages of cancer development. Cell 2011, 145, 435–446. [Google Scholar] [CrossRef] [PubMed]
- Pufulete, M.; Al-Ghnaniem, R.; Leather, A.J.; Appleby, P.; Gout, S.; Terry, C.; Emery, P.W.; Sanders, T.A. Folate status, genomic DNA hypomethylation, and risk of colorectal adenoma and cancer: A case control study. Gastroenterology 2003, 124, 1240–1248. [Google Scholar] [CrossRef]
- Piyathilake, C.J.; Macalusa, M.; Alvarez, R.D.; Chen, M.; Badiga, S.; Siddiqui, N.R.; Edberg, J.C.; Partridge, E.E.; Johanning, G.L. A higher degree of LINE-1 methylation in peripheral blood mononuclear cells, a one-carbon nutrient related epigenetic alteration, is associated with a lower risk of developing cervical intraepithelial neoplasia. Nutrition 2011, 27, 513–519. [Google Scholar] [CrossRef] [PubMed]
- Cremer, C.; Masters, B.R. Resolution enhancement techniques in microscopy. Eur. Phys. J. H 2013, 38, 281–344. [Google Scholar] [CrossRef]
- Becker, J.S.; Nicetta, D.; Zaret, K.S. H3K9me3-dependent heterochromatin: Barrier to cell fate changes. Trends Genet. 2016, 32, 29–42. [Google Scholar] [CrossRef] [PubMed]
- Halbert, C.L.; Demers, G.W.; Galloway, D.A. The E7 gene of human papillomavirus type 16 is sufficient for immortalization of human epithelial cells. J. Virol. 1991, 65, 473–478. [Google Scholar] [PubMed]
- Antony, A.; Tang, Y.S.; Khan, R.A.; Biju, M.P.; Xiao, X.; Li, Q.J.; Sun, X.L.; Jayaram, H.N.; Stabler, S.P. Translational upregulation of folate receptors is mediated by homocysteine via RNA-heterogeneous nuclear ribonucleoprotein E1 interactions. J. Clin. Investig. 2004, 113, 285–301. [Google Scholar] [CrossRef] [PubMed]
- Rogakou, E.P.; Pilch, D.R.; Orr, A.H.; Ivanova, V.S.; Bonner, W.M. DNA double-starnd breaks induce histone H2AX phosphorylation on serine 139. J. Biol. Chem. 1998, 273, 5858–5868. [Google Scholar] [CrossRef] [PubMed]
- Kuo, L.J.; Yang, L.X. γ-H2AX—A novel biomarker for DNA double-strand breaks. In Vivo 2008, 22, 305–310. [Google Scholar] [PubMed]
- Loebrich, M.; Shibata, A.; Beucher, A.; Fisher, A.; Ensminger, M.; Goodarzi, A.A.; Barton, O.; Jeggo, P.A. γ-H2AX foci analysis for monitoring DNA double-strand repair – strengths, limitations and optimization. Cell Cycle 2010, 9, 662–669. [Google Scholar] [CrossRef] [PubMed]
- Banath, J.P.; MacPhail, S.H.; Olive, P.L. Radiation sensitivity, H2AX phosphorylation, and kinetics of repair of DNA strand breaks in irradiated cervical cancer cell lines. Cancer Res. 2004, 64, 7144–7149. [Google Scholar] [CrossRef] [PubMed]
- Dikomey, E.; Dahm-Daphi, J.; Brammer, I.; Martensen, R.; Kaina, B. Correlation between cellular radiosensitivity and non-repaired double-strand breaks studied in nine mammalian cell lines. Int. J. Radiat. Biol. 1998, 73, 269–278. [Google Scholar] [CrossRef] [PubMed]
- Cremer, T.; Cremer, C. Chromosome territories, nuclear architecture and gene regulation in mammalian cells. Nat. Rev. Genet. 2001, 2, 292–301. [Google Scholar] [CrossRef] [PubMed]
- Cremer, T.; Cremer, C. Rise, fall and resurrection of chromosome territories: A historical perspective. Part I. The rise of chromosome territories. Part, I.I. Fall and resurrection of chromosome territories during the 1950s to 1980s. Part III. Chromosome territories and the functional nuclear architecture: Experiments and models from the 1990s to the present. Eur. J. Histochem. 2006, 50, 161–272. [Google Scholar] [PubMed]
- Bártová, E.; Krejčí, J.; Harničarová, A.; Galiová, G.; Kozubek, S. Histone modifications and nuclear architecture: A review. J. Histochem. Cytochem. 2008, 56, 711–721. [Google Scholar] [CrossRef] [PubMed]
- Falk, M.; Hausmann, M.; Lukášová, E.; Biswas, A.; Hildenbrand, G.; Davídková, M.; Krasavin, E.; Kleibl, Z.; Falková, I.; Ježková, L.; et al. Giving OMICS spatiotemporal dimensions by challenging microscopy: From functional networks to structural organization of cell nuclei elucidating mechanisms of complex radiation damage response and chromatin repair—PART A (Radiomics). PART B (Structuromics). Crit. Rev. Eukaryot. Gene Express 2014, 24, 205–247. [Google Scholar] [CrossRef]
- Zhang, Y.; Máté, G.; Müller, P.; Hillebrandt, S.; Krufczik, M.; Bach, M.; Kaufmann, R.; Hausmann, M.; Heermann, D.W. Radiation induced chromatin conformation changes analysed by fluorescent localization microscopy, statistical physics, and graph theory. PLoS ONE 2015, 10, e0128555. [Google Scholar] [CrossRef] [PubMed]
- Jakob, B.; Splinter, J.; Conrad, S.; Voss, K.O.; Zink, D.; Durante, M.; Löbrich, M.; Taucher-Scholz, G. DNA double-strand breaks in heterochromatin elicit fast repair protein recruitment, histone H2AX phosphorylation and relocation to euchromatin. Nucleic Acids Res. 2011, 39, 6489–6499. [Google Scholar] [CrossRef] [PubMed]
- Girst, S.; Hable, V.; Drexler, G.A.; Greubel, C.; Siebenwirth, C.; Haum, M.; Friedl, A.A.; Dollinger, G. Subdiffusion supports joining of correct ends during repair of DNA double-strand breaks. Sci. Rep. 2013, 3, 2511. [Google Scholar] [CrossRef] [PubMed]
- Bohn, M.; Diesinger, P.; Kaufmann, R.; Weiland, Y.; Müller, P.; Gunkel, M.; von Ketteler, A.; Lemmer, P.; Hausmann, M.; Heermann, D.W.; Cremer, C. Localization microscopy reveals expression-dependent parameters of chromatin nanostructure. Biophys. J. 2010, 99, 1358–1367. [Google Scholar] [CrossRef] [PubMed]
- Lemmer, P.; Gunkel, M.; Baddeley, D.; Kaufmann, R.; Urich, A.; Weiland, Y.; Reymann, J.; Müller, P.; Hausmann, M.; Cremer, C. SPDM—Light microscopy with single molecule resolution at the nanoscale. Appl. Phys. B 2008, 93, 1–12. [Google Scholar] [CrossRef]
- Abbe, E. Beiträge zur Theorie des Mikroskops und der mikroskopischenWahrnehmung. Archiv Für Mikroskopische Anatomie 1873, 9, 411–468. [Google Scholar] [CrossRef]
- Rauch, J.; Knoch, T.A.; Solovei, I.; Teller, K.; Stein, S.; Buiting, K.; Horsthemke, B.; Langowski, J.; Cremer, T.; Hausmann, M.; Cremer, C. Lightoptical precision measurements of the active and inactive Prader-Willi Syndrome imprinted regions in human cell nuclei. Differentiation 2008, 76, 66–82. [Google Scholar] [CrossRef] [PubMed]
- Lemmer, P.; Gunkel, M.; Weiland, Y.; Müller, P.; Baddeley, D.; Kaufmann, R.; Urich, A.; Eipel, H.; Amberger, R.; Hausmann, M.; Cremer, C. Using conventional fluorescent markers for far-field fluorescence localization nanoscopy allows resolution in the 10 nm range. J. Microsc. 2009, 235, 163–171. [Google Scholar] [CrossRef] [PubMed]
- Betzig, E.; Patterson, G.H.; Sougrat, R.; Hess, S.T. Imaging intracellular fluorescent proteins at nanometer resolution. Science 2006, 313, 1642–1645. [Google Scholar] [CrossRef] [PubMed]
- Rust, M.; Bates, M.; Zhuang, X. Sub-diffraction-limit imaging by stochastic optical reconstruction microscopy (STORM). Nat. Methods 2006, 3, 793–795. [Google Scholar] [CrossRef] [PubMed]
- Thompson, R.E.; Larson, D.R.; Webb, W.W. Precise nanometer localization analysis for individual fluorescent probes. Biophys. J. 2002, 82, 2775–2783. [Google Scholar] [CrossRef]
- Deschout, H.; Cella Zanacchi, F.; Mlodzianoski, M.; Diaspro, A.; Bewersdorf, J.; Hess, S.T.; Braeckmans, K. Precisely and accurately localizing single emitters in fluorescent microscopy. Nat. Methods 2014, 11, 253–266. [Google Scholar] [CrossRef] [PubMed]
- Kirmes, I.; Szcurek, A.T.; Prakash, K.; Charapitsa, I.; Heiser, C.; Musheev, M.; Schock, F.; Fornalczyk, K.; Ma, D.; Birk, U.; Cremer, C.; Reid, G. A transient ischemic environment induces reversible compaction of chromatin. Genome Biol. 2015, 16, 246. [Google Scholar] [CrossRef] [PubMed]
- Hausmann, M.; Wagner, E.; Krufczik, M.; Schrock, G.; Papenfuß, F.; Port, M.; Bestvater, F.; Scherthan, H. Super-resolution localization microscopy discloses radiation-induced histone H2AX phosphorylation in the periphery of heterochromatin clusters of human cells. Int. J. Mol. Sci. 2017. submitted. [Google Scholar]
- Adam, S.; Dabin, J.; Polo, S.E. Chromatin plasticity in response to DNA damage. The shape of things to come. DNA Repair 2015, 32, 120–126. [Google Scholar] [CrossRef] [PubMed]
- Smerdon, M.J.; Lieberman, M.W. Nucleosome rearrangement in human chromatin during UV-induced DNA repair-synthesis. Proc. Natl. Acad. Sci. USA 1978, 75, 4238–4241. [Google Scholar] [CrossRef] [PubMed]
- Nair, N.; Shoaib, M.; Soerensen, C.S. Chromatin dynamics in genome stability: Roles in suppressing endogenous DNA damage and facilitating DNA repair. Int. J. Mol. Sci. 2017, 18, 1486. [Google Scholar] [CrossRef] [PubMed]
- Rossberger, S.; Best, G.; Baddeley, D.; Heintzmann, R.; Birk, U.; Dithmar, S.; Cremer, C. Combination of structured illumination and single molecule localization microscopy in one setup. J. Opt. 2013, 15, 094003. [Google Scholar] [CrossRef]
- Boyd, P.S.; Struve, N.; Bach, M.; Eberle, J.P.; Gote, M.; Schock, F.; Cremer, C.; Kriegs, M.; Hausmann, M. Clustered localization of EGFRvIII in glioblastoma cells as detected by high precision localization microscopy. Nanoscale 2016, 8, 20037–20047. [Google Scholar] [CrossRef] [PubMed]
- Braden, B. The surveyor’s area formula. Coll. Math. J. 1986, 17, 326–337. [Google Scholar] [CrossRef]


© 2017 by the authors. Licensee MDPI, Basel, Switzerland. This article is an open access article distributed under the terms and conditions of the Creative Commons Attribution (CC BY) license (http://creativecommons.org/licenses/by/4.0/).
Share and Cite
Bach, M.; Savini, C.; Krufczik, M.; Cremer, C.; Rösl, F.; Hausmann, M. Super-Resolution Localization Microscopy of γ-H2AX and Heterochromatin after Folate Deficiency. Int. J. Mol. Sci. 2017, 18, 1726. https://doi.org/10.3390/ijms18081726
Bach M, Savini C, Krufczik M, Cremer C, Rösl F, Hausmann M. Super-Resolution Localization Microscopy of γ-H2AX and Heterochromatin after Folate Deficiency. International Journal of Molecular Sciences. 2017; 18(8):1726. https://doi.org/10.3390/ijms18081726
Chicago/Turabian StyleBach, Margund, Claudia Savini, Matthias Krufczik, Christoph Cremer, Frank Rösl, and Michael Hausmann. 2017. "Super-Resolution Localization Microscopy of γ-H2AX and Heterochromatin after Folate Deficiency" International Journal of Molecular Sciences 18, no. 8: 1726. https://doi.org/10.3390/ijms18081726