Article

Genome-Wide Identification and Characterization of the GmSnRK2 Family in Soybean

1
Key laboratory of Biology and Genetic Improvement of Oil Crops, Ministry of Agriculture, Oil Crops Research Institute, Chinese Academy of Agricultural Science, Wuhan 430062, China
2
Beijing Genomics Institute, Wuhan 430075, China
3
State Key Laboratory of Crop Biology, Agronomy College, Shandong Agricultural University, Tai’an 271018, China
*
Author to whom correspondence should be addressed.
These authors contributed equally to this work.
Int. J. Mol. Sci. 2017, 18(9), 1834; https://doi.org/10.3390/ijms18091834
Submission received: 1 July 2017 / Revised: 19 August 2017 / Accepted: 20 August 2017 / Published: 23 August 2017
(This article belongs to the Special Issue Abiotic Stress and Gene Networks in Plants 2017)

Abstract

:
Sucrose non-fermenting-1 (SNF1)-related protein kinase 2s (SnRK2s) that were reported to be involved in the transduction of abscisic acid (ABA) signaling, play important roles in response to biotic and abiotic stresses in plants. Compared to the systemic investigation of SnRK2s in Arabidopsis thaliana and Oryza sativa, little is known regarding SnRK2s in soybean, which is one of the most important oil and protein crops. In the present study, we performed genome-wide identification and characterization of GmSnRK2s in soybean. In summary, 22 GmSnRK2s were identified and clustered into four groups. Phylogenetic analysis indicated the expansion of SnRK2 gene family during the evolution of soybean. Various cis-acting elements such as ABA Response Elements (ABREs) were identified and analyzed in the promoter regions of GmSnRK2s. The results of RNA sequencing (RNA-Seq) data for different soybean tissues showed that GmSnRK2s exhibited spatio-temporally specific expression patterns during soybean growth and development. Certain GmSnRK2s could respond to the treatments including salinity, ABA and strigolactones. Our results provide a foundation for the further elucidation of the function of GmSnRK2 genes in soybean.

Graphical Abstract

1. Introduction

Plants are often exposed to various harmful environments, such as salinity, drought, pH variation, temperature and heavy metals. In order to cope with the adverse environmental conditions, plants have developed complex protective mechanisms during evolution [1]. Among them, the phytohormone pathways play important roles in the ability of plants to acclimatize to the stressful environments [2,3]. Abscisic acid (ABA) is one of important phytohormones, which has various physiological functions in mediating plant growth, development and stress responses, such as salt stress and water deficit stress [4,5,6]. Many factors such as Pyrabactin Resistance 1/PYR1-Like/Regulatory Component of ABA Receptor (PYR/PYL/RCAR), Clade A protein phosphatase 2Cs (PP2Cs), and ABA response element-binding factors (ABFs) are involved in the ABA signaling pathway [7]. Particularly, protein phosphorylation and dephosphorylation are essential events during ABA signal transduction [8,9].
SnRK2s belong to the family of sucrose non-fermenting-1 (SNF1)-related protein kinases (SnRKs), which is a class of serine/threonine (Ser/Thr) protein kinases [10,11,12]. The members of SnRK2s family have been found in various plant species including Arabidopsis thaliana (AtSnRK2.1–2.10), Oryza sativa (SAPK1–10) [11,13], Malus prunifolia (MpSnRK2.1–2.12) [14], maize (ZmSnRK2.1–2.11) [15], wheat (TaSnRK2.3, 2.4, 2.7, and 2.8) [16,17,18,19], Brassica napus (BnSnRK2.1–2.14) [20], Vitis vinifera (VvSnRK2.1–2.6) [21], Pak-choi (BcSnRK2.1–2.13) [22], and cotton (GhSnRK2.1–2.20) [23]. Each SnRK2 protein contains three functional domains, including an adenosine triphosphate (ATP) binding domain, a conserved Ser/Thr kinase domain, and a diverse regulatory C-terminal. In general, members of SnRK2 gene family can be classified into three groups as Group 1, Group 2 and Group 3. The SnRK2s of Group 1 are rich of glutamic acid (Glu), while members of Group 2 and Group 3 are rich in aspartic acid (Asp) [24]. Besides, the promoter regions of SnRK2s usually harbor cis-acting regulatory elements involved in stress responses, such as ABA responsive elements (ABRE), dehydration responsive elements/C-repeat elements (DRE/CRT), and low temperature responsive elements (LTRE) [15].
Recent studies demonstrated that SnRK2s play important roles in ABA signal transduction, which regulates various growth and developmental processes in plants, such as stomatal closure, seed development and dormancy, and flowering time regulation [25,26,27,28,29,30]. In Arabidopsis, SRK2E/SRK2.6 could affect the expression of RD22 and RD29B, which are ABA responsive genes [10]. SRK2D/SnRK2.2, SRK2E/SnRK2.6 and SRK2I/SnRK2.3 are redundant ABA-activated SnRK2s, and play essential roles in controlling seed development and dormancy [27]. The snrk2.2/2.3/2.6 triple-knockout mutant seedling was insensitive to ABA, produced few seeds, and flowered early [28,29]. Yeast two-hybrid analysis demonstrated that SnRK2.6 could interact with ABI1 (ABA Insensitive 1), which is a PP2C-type phosphatase and plays a critical role in the control of the ABA-induced stomatal closure in Arabidopsis [31]. Over-expression of SRK2C/SnRK2.8 could up-regulate stress-induced genes and increase drought tolerance in Arabidopsis [32]. In rice, SAPK6 could be activated in rice under dehydration stress, and further phosphorylate OREB1 (Oryza ABA-responsive element binding factor 1), a bZIP type transcript factor associated with ABA signaling [33]. Until now, four SnRK2 genes of SPK1, SPK2, SPK3 and SPK4, had been reported in soybean, of which, protein kinases SPK1 and SPK2 could be activated by hyperosmotic stress, and SPK3 and SPK4 could be induced by high salinity or dehydration [34,35].
Soybean, a leading oil and protein crop around the world, is an ancient tetraploid with a partially diploidized tetraploid [36]. Although several GmSnRK2s have been characterized, comprehensive analysis of GmSnRK2s at the genome-wide level in soybean is still needed. In this study, we identified and characterized the GmSnRK2 gene family at the genome-wide level in soybean. The cis-acting regulatory elements in the promoter regions of GmSnRK2s were also investigated. Based on the publicly available transcriptome data and quantitative real-time polymerase chain reaction (qRT-PCR) results, the expression patterns of GmSnRK2s were profiled at different tissues as well as different treatments including salinity, ABA and strigolactones (SLs). Our study will extend understanding of the GmSnRK2 gene family in soybean, and provide useful information for scientists to analyze the functions of GmSnRK2 in the future.

2. Results

2.1. Identification and Properties of SnRK2 Genes in Soybean

To investigate SnRK2 gene family in soybean, the peptides of SnRK2s of Arabidopsis thaliana and rice were used as queries to screen the soybean genome in silico (Table S1). Combined with the functional domains predicted by InterProScan (version 5.25-64.0, Hinxton, Cambridge, UK), we eventually determined 22 putative GmSnRK2 genes in the soybean genome (Table 1). These GmSnRK2 genes were distributed in 12 different chromosomes, of which, chromosome 5 (Chr05) contained the highest count of GmSnRK2 genes including GmSnRK2.6, GmSnRK2.7, GmSnRK2.8, and GmSnRK2.9. The previously reported four GmSnRK2 genes, SPK1, SPK2, SPK3, and SPK4, were named as GmSnRK2.2, GmSnRK2.16, GmSnRK2.15 and GmSnRK2.5 in this study, respectively [34,35]. The transcript length of GmSnRK2s ranged from 1.3 to 2.2 kb, but the length of GmSnRK2 proteins ranged from 309 to 364 aa (amino acid). Generally, the SnRK2 gene family has two conserved signatures: An adenosine triphosphate (ATP)-binding region signature, and a Serine/Threonine protein kinase active-site signature [13]. In our results, all the SnRK2s of soybean contained ATP binding sites (IPR017441) and Serine/threonine-protein kinase active sites (IPR008271) at the N-terminal (Table 1).
To explore the physical and chemical properties of these soybean SnRK2 proteins, the peptides of GmSnRK2s were profiled by ProtParam (available online: http://web.expasy.org/protparam/). The molecular weight of GmSnRK2s ranged from 35.37 to 41.49 kDa. The isoelectric point varied from 4.68 to 6.48, which revealed that GmSnRK2 proteins were acidic. The Grand Average of Hydropathy (GRAVY) values of GmSnRK2s were all negative, indicating that GmSnRK2s were hydrophilic and probably located in cytosol (Table 1).
Based on the inferred gene structure, GmSnRK2s exhibited similar exon-intron organizations and highly conserved intron phasing (Figure 1). The coding sequences of GmSnRK2s were disrupted by eight introns except for GmSnRK2.6, and the intron sizes varied greatly, ranging from 78 to 4640 bp (base pair).

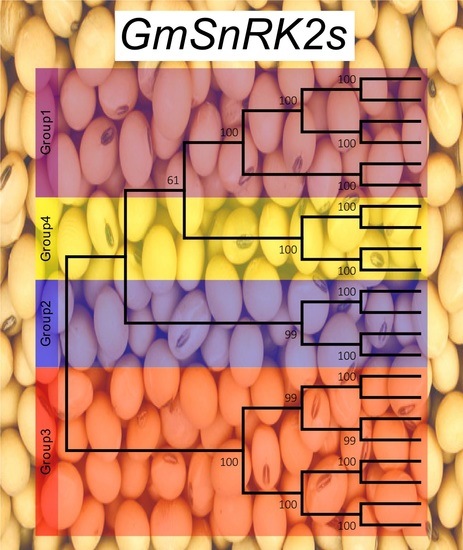
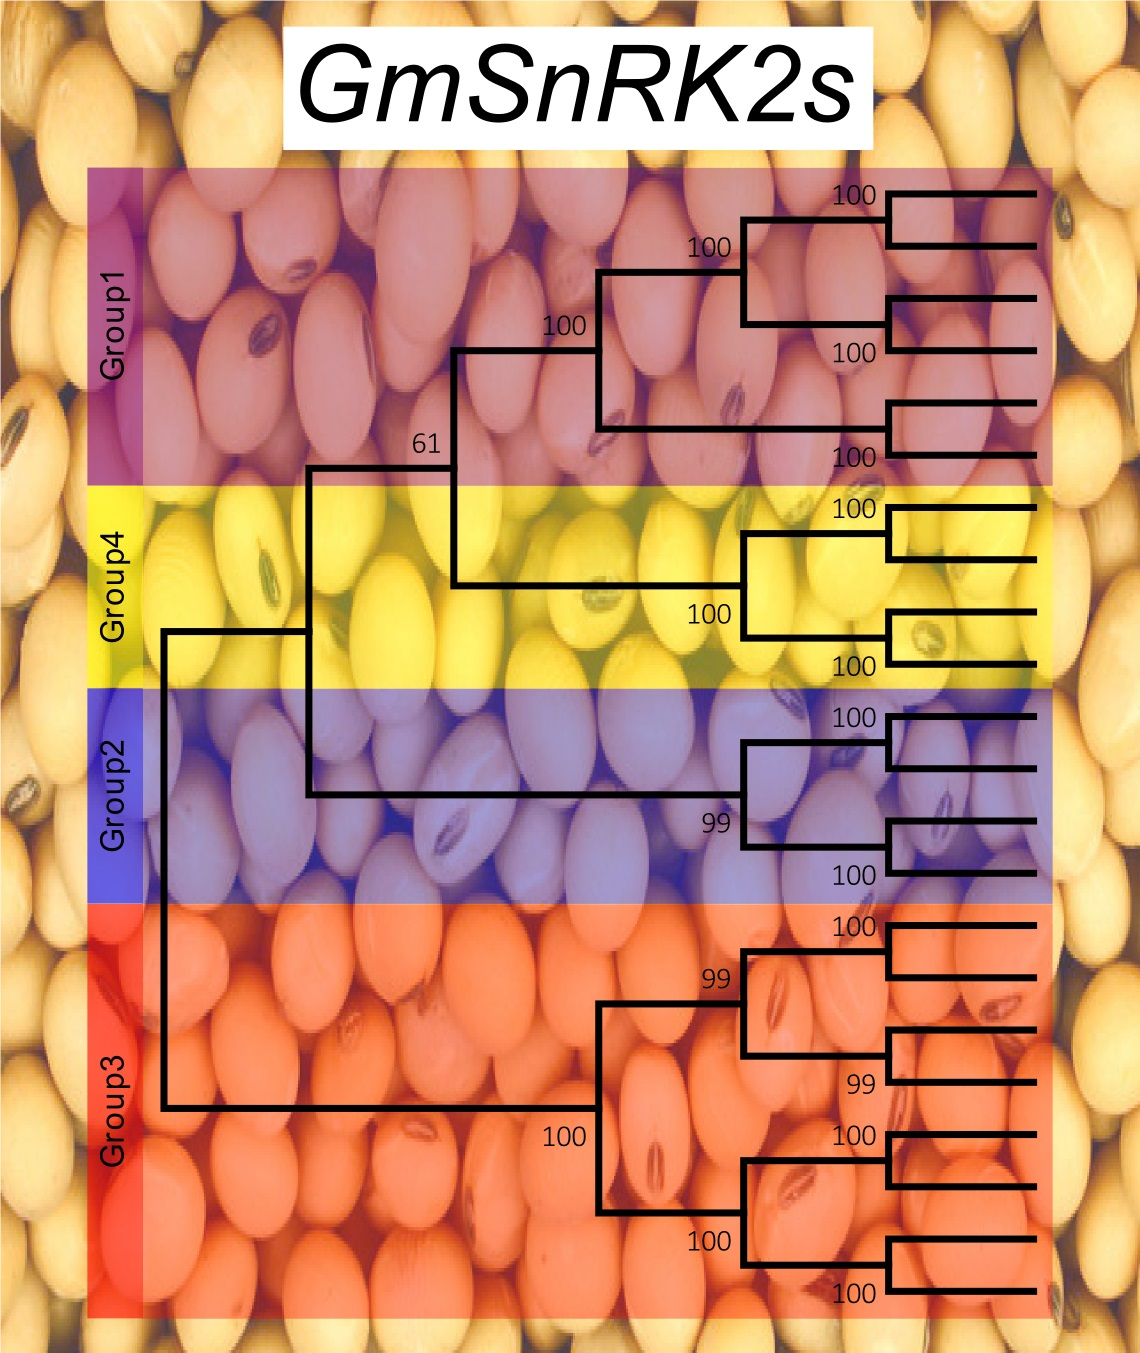
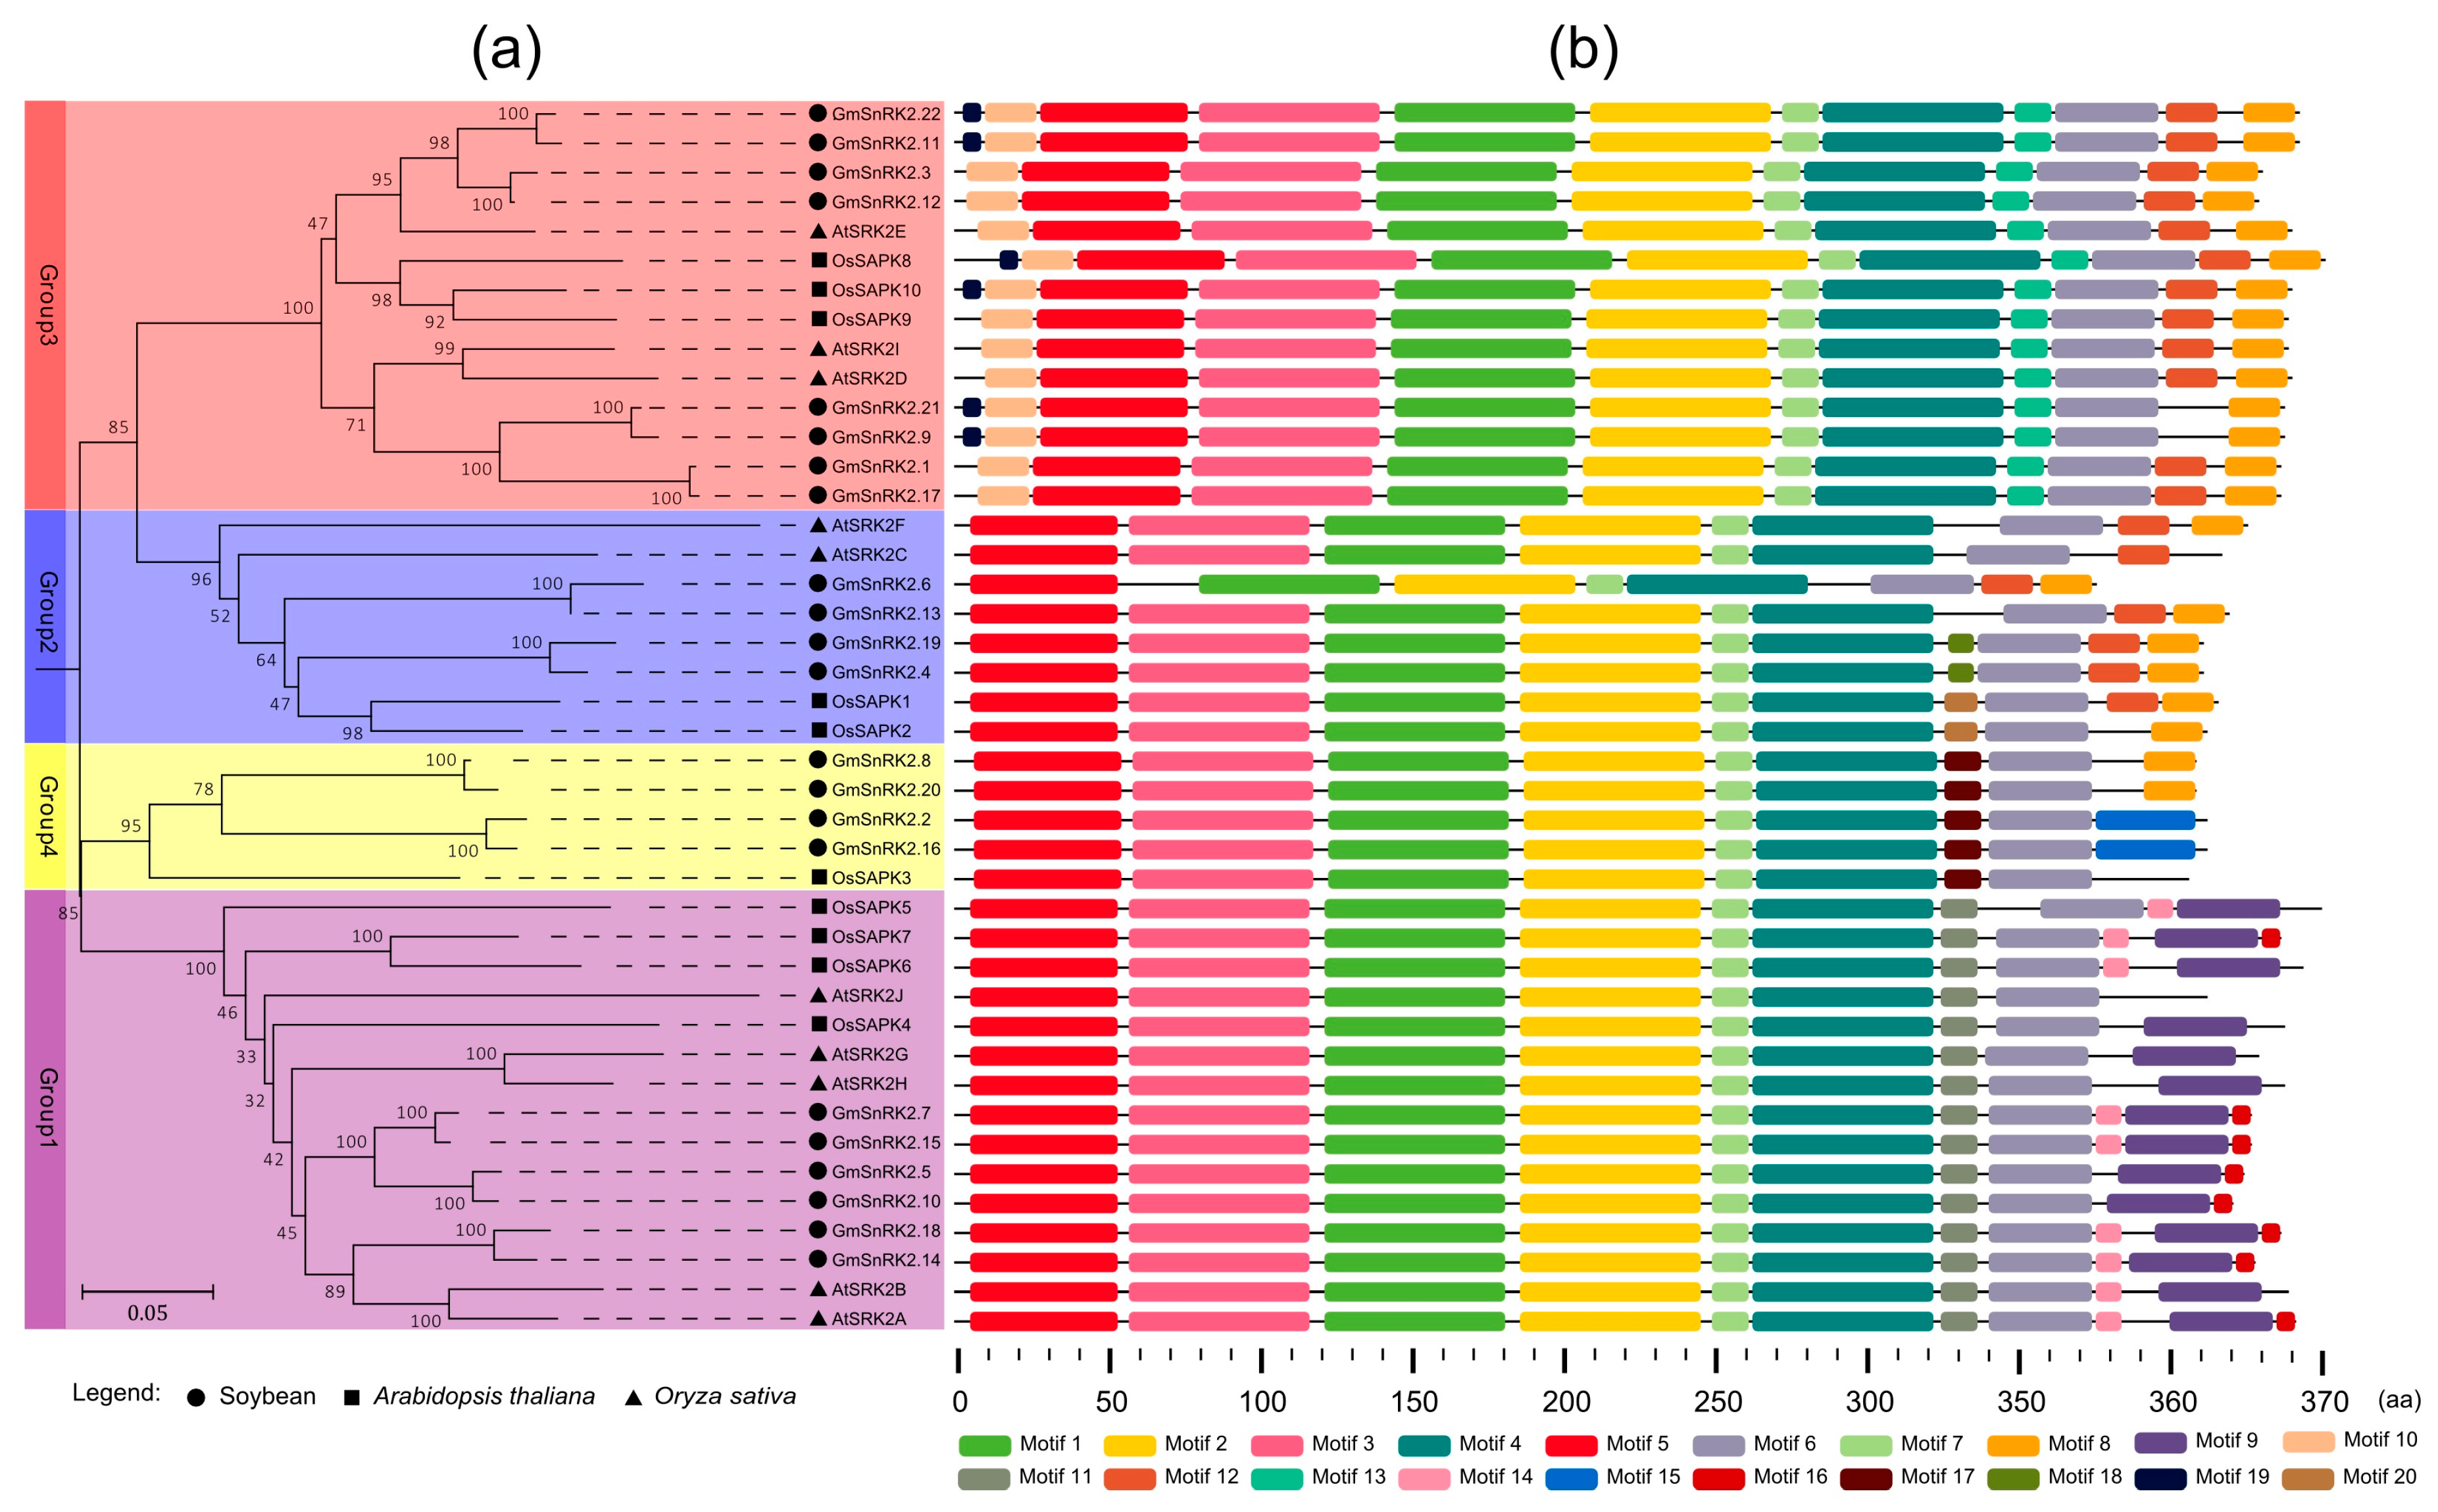
2.2. Phylogenetic and Motif Analysis of SnRK2 Genes in Soybean

To investigate the evolutionary relationships of the SnRK2 genes among Arabidopsis thaliana, rice and soybean, a neighbor-joining phylogenetic tree was constructed using the protein sequences of AtSnRK2s, OsSnRK2s and GmSnRK2s. These SnRK2s were clustered into four subgroups named as Group 1, Group 2, Group 3 and Group 4 (Figure 2a). Consistent with previous report, the 10 SnRK2s of Arabidopsis thaliana were distributed within three groups: Group 1, Group 2 and Group 3 [37]. The phylogenetic tree showed that Group 3 was the biggest group, with eight members. The next biggest group was Group 1 that had six GmSnRK2s. Group 2 had four GmSnRK2s. Group 4 was the smallest clade constituted by four GmSnRK2s and OsSAPK3. Compared with Arabidopsis thaliana and rice, soybean exhibited an expansion of SnRK2 gene family in each group (Figure 2a). Most of the GmSnRK2s clustered together in pairs in the phylogenetic tree, such as the clade of GmSnRK2.1, GmSnRK2.9, GmSnRK2.17 and GmSnRK2.21, the clade of GmSnRK2.2, GmSnRK2.8, GmSnRK2.16 and GmSnRK2.20, the clade of GmSnRK2.3, GmSnRK2.11, GmSnRK2.12 and GmSnRK2.22, and the clade of GmSnRK2.5, GmSnRK2.7, GmSnRK2.10 and GmSnRK2.15.
The conserved motifs of AtSnRK2s, OsSnRK2s and GmSnRK2s were identified using MEME (version 4.12.0, Seattle, WA, USA), and a total of 20 different motifs were found (Figure 2b). Six motifs (motifs 1–5 and motif 7) constituted the highly conserved N-terminal and were shared in almost all of the SnRK2s, whereas in GmSnRK2.6 motif 3 was lacking. However, in the C-terminal regions of SnRK2s, the motifs were diverse in each group. For example, motif 10 and motif 13 were specific to Group 3, while motif 9, motif 11, motif 14, and motif 16 only existed in Group 1. Similarly, motif 18 and motif 20 were specific to Group 2, while motif 15 and motif 17 were only found in Group 4. In addition, members of Group 2 and Group 3 contained motif 8 and motif 12 in the C-terminal. Most of the GmSnRK2 gene pairs contained the same motifs, such as GmSnRK2.1 and GmSnRK2.17, GmSnRK2.2 and GmSnRK2.16, GmSnRK2.3 and GmSnRK2.12, GmSnRK2.4 and GmSnRK2.19, GmSnRK2.5 and GmSnRK2.10, GmSnRK2.7 and GmSnRK2.15, GmSnRK2.8 and GmSnRK2.20, GmSnRK2.9 and GmSnRK2.21, GmSnRK2.11 and GmSnRK2.22, and GmSnRK2.14 and GmSnRK2.18.
The sequence homology of GmSnRK2 proteins was determined through multiple sequence alignment. GmSnRK2s exhibited an average of 66.7% amino acid sequence identity (Figure S1). Their N-terminals were mainly constituted by ATP binding domain and highly conserved serine/threonine protein kinases domain (Figure S1). Motif 5 represented the ATP binding domain, and motif 2 represented the conserved serine/threonine protein kinases domain (Figure 2). Similar to SnRK2s in Arabidopsis thaliana and rice, the GmSnRK2s of Group 1 showed an enrichment of Glu (E) at the C-terminal, while the members of Group 2 and Group 3 were Asp (D)-rich in soybean. However, the GmSnRK2s of Group 4 had no such D/E-rich pattern (Figure S1). Notably, GmSnRK2.6, the shortest SnRK2 of soybean, lacked 34 amino acid residues at the conserved N-terminal domain in comparison with other GmSnRK2s.

2.3. Cis-Acting Regulatory Elements in the Promoters of GmSnRK2 Genes

The genomic DNA sequences from the transcription initiation site (+1) to the 2 kb upstream of the GmSnRK2 genes were extracted for cis-acting elements profiling using PlantCARE. The results obtained from PlantCARE server showed that various cis-acting regulatory elements existed within promoter regions of GmSnRK2s (Table 2 and Table S3). For example, nine GmSnRK2s, including GmSnRK2.1, GmSnRK2.9, GmSnRK2.12, GmSnRK2.17 and GmSnRK2.21 of Group 3, GmSnRK2.18 of Group 1, GmSnRK2.4, and GmSnRK2.13 and GmSnRK2.19 of Group 2, had one or more ABREs. However, there were no ABREs found in the promoter regions of all the GmSnRK2s of Group 4 (Table 2). In addition, some other phytohormone response elements except for ABREs, such as AuxRR-core, P-box, TCA-element, TGACG-motif and ethylene response element (ERE), were also present in the promoter regions of GmSnRK2s, which suggested that the expression of GmSnRK2s might be also induced by auxin, salicylic acid, methyl jasmonic acid, gibberellin and ethylene (Table 2).
Notably, the cis-acting elements involved in response to biotic and abiotic stresses, including fungus, drought, heat and low-temperature, were also found within the upstream regions of GmSnRK2 genes, indicating that GmSnRK2s might be also induced by these biotic and abiotic stresses (Table S3). Moreover, there were 14 GmSnRK2s containing several cis-acting regulatory elements involved in circadian control, suggesting that the expression of these GmSnRK2s might be associated with circadian control (Table S3).

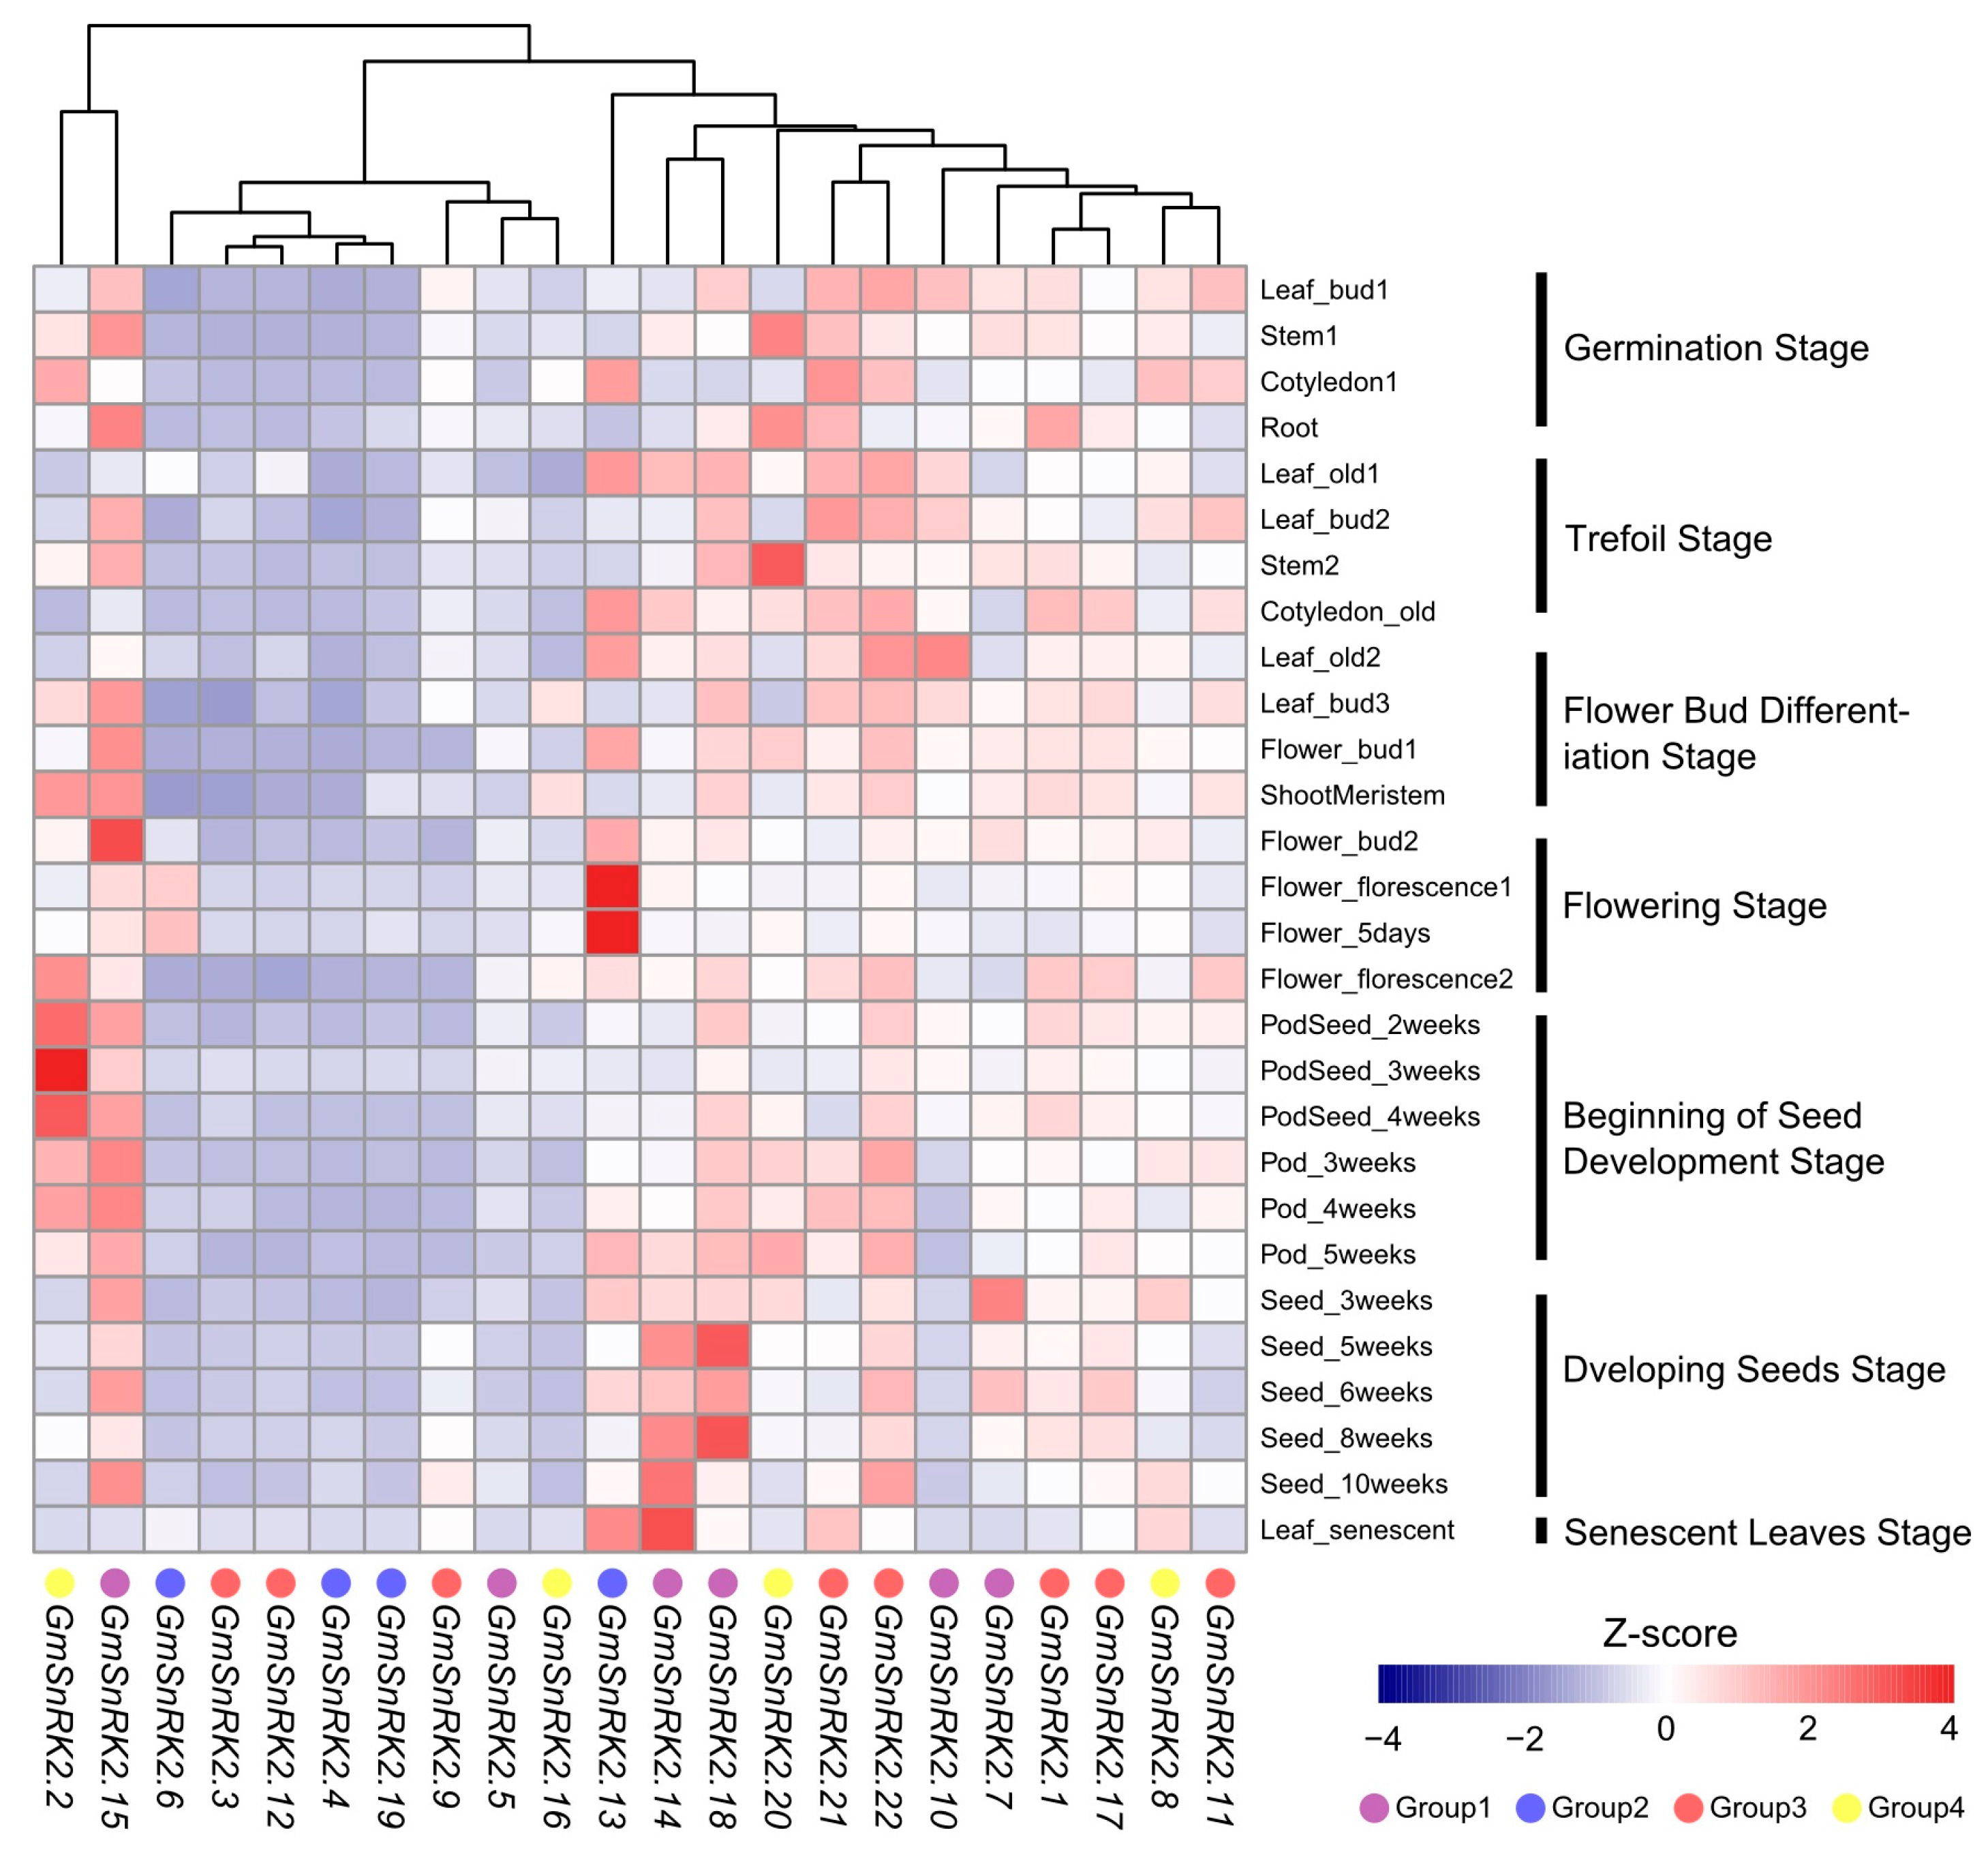
2.4. Expression Analysis of GmSnRK2 Genes during Growth and Development of Soybean

To examine the expression patterns of the GmSnRK2s during growth and development, we re-analyzed of the publicly available RNA-Seq dataset (SRP038111), which was obtained from different tissues at different developmental stages of soybean. GmSnRK2.2 of Group 4 was highly expressed in dividing and meristem tissues of young seedlings, stems and pods, but lowly expressed in seeds. GmSnRK2.16 of Group 4 was preferentially expressed in shoot meristem and leaf buds at the flower bud differentiation stage. GmSnRK2.15 and GmSnRK2.22 showed constitutive expression at high levels in all the examined tissues except for the senescent leaves. In contract, GmSnRK2.3, GmSnRK2.4, GmSnRK2.5, GmSnRK2.9, GmSnRK2.12 and GmSnRK2.19 showed relatively low expression levels in all the tissues. GmSnRK2.6 and GmSnRK2.13 were paralogous gene pairs, and both of them exhibited specifically higher expression in florescence flowers than in other tissues. Notably, during the development of seed, the expression of GmSnRK2.14 and GmSnRK2.15 of Group 1 were increased as the seed developed. GmSnRK2.7 of Group 1 exhibited relatively high expression level in the early stages of seed development, and GmSnRK2.18 of Group 1 showed relatively high expression level in the mid stages of seed development (Figure 3). Overall, the GmSnRK2 genes displayed diverse spatio-temporal expression patterns in soybean.

2.5. Differential Expression of GmSnRK2s in Response to Salt Stress, Abscisic Acid and Strigolactones

The members of SnRK2 gene family play important roles in response to various environmental stresses, such as hyperosmotic stress, high salinity and dehydration [24,38]. Besides, SnRK2s also play critical roles in regulation of phytohormone pathways, especially ABA signal transduction [25,39,40,41]. To explore the expression patterns of GmSnRK2 genes in response to biotic stresses and phytohormones, the expression levels of GmSnRK2s were evaluated by qRT-PCR under NaCl, ABA, and a synthetic analog of strigolactones (rac-GR24) treatments in soybean.
To elucidate the roles of GmSnRK2s under high salinity stress condition, the expression levels of 22 GmSnRK2 genes were examined in the leaves of seedlings of soybean under NaCl treatment at four time points: 0, 8, 16 and 24 h. Of the 22 GmSnRK2 genes, GmSnRK2.7, GmSnRK2.8, GmSnRK2.14, GmSnRK2.20 and GmSnRK2.22 were significantly up-regulated at three time points (8, 16 and 24 h) under NaCl stress compared to the control (p-value ≤ 0.05, Figure 4 and Figure S2). At 8 h after treatment, except for GmSnRK2.12 and GmSnRK2.13, all the other GmSnRK2 genes showed increased expression, among which GmSnRK2.5 and GmSnRK2.8 were significantly up-regulated by approximately 13- and 18-fold, respectively (Figure S2). The expression levels of GmSnRK2.2 (SPK1) and GmSnRK2.5 (SPK4) were up-regulated significantly at 8 h, and then were down-regulated to the basal level at 24 h, whereas the expression levels of GmSnRK2.16 (SPK2) and GmSnRK2.15 (SPK3) were increased slightly at each time point under salt stress, which suggested that the induction kinetics of the four GmSnRK2s under high salinity were different. The expression levels of GmSnRK2.1 and GmSnRK2.9 of Group 3 were significantly up-regulated at 8 h, and then down-regulated at 16 h after salt treatment (Figure 4a). The expression level of GmSnRK2.4 was increased from 1.1-fold at 8 h to 8.5-fold at 24 h after treatment compared to the control (Figure S2). In addition, GmSnRK2.6 expression showed no difference at each time point (Figure 4).
To expand our understanding of the physiological functions of GmSnRK2 genes in response to phytohormones, we examined their expression levels under exogenous ABA and SLs treatments using qRT-PCR. Following the ABA treatment, all GmSnRK2s, except for GmSnRK2.6, GmSnRK2.16 and GmSnRK2.18, showed differential expression at different time points after ABA treatment (p-value ≤ 0.05, Figure 4 and Figure S3). At 8 h after treatment, the expression levels of GmSnRK2.1, GmSnRK2.2, GmSnRK2.5, GmSnRK2.8 and GmSnRK2.12 were significantly up-regulated, while the expression levels of GmSnRK2.11, GmSnRK2.12 and GmSnRK2.20 were significantly down-regulated (Figure 4). At 16 h after treatment, GmSnRK2.7 and GmSnRK2.12 were down-regulated from 2.9-fold at 8 h to 0.5-fold at 16 h and from 3.9-fold at 8 h to 0.4-fold at 16 h, respectively (Figure S3). Besides, the expression levels of GmSnRK2.10, GmSnRK2.13 and GmSnRK2.17 were also significantly reduced nearly by half compared with the control (Figure 4 and Figure S3). The expression of GmSnRK2.20 and GmSnRK2.21 were significantly up-regulated at 16 h compared to the control after ABA treatment (Figure 4). At 24 h after treatment, GmSnRK2.4 and GmSnRK2.11 expression levels were significantly up-regulated from 1.5-fold at 8 h to 7.1-fold at 24 h and from 1.7-fold at 8 h to 9.5-fold at 24 h, respectively (Figure S3). The expression levels of GmSnRK2.3 and GmSnRK2.19 were slightly increased, while the expression of GmSnRK2.7 and GmSnRK2.9 were significantly down-regulated at 24 h compared to the control after ABA treatment (Figure 4).
To investigate the response of GmSnRK2s to SLs, a synthetic analog of strigolactones (rac-GR24) was applied to treat soybean seedlings. The results of qRT-PCR showed that SLs treatment caused a significant induction of the expression of nine GmSnRK2 genes including GmSnRK2.1, GmSnRK2.2, GmSnRK2.4, GmSnRK2.5, GmSnRK2.7, GmSnRK2.8, GmSnRK2.9, GmSnRK2.20, and GmSnRK2.21 (fold change ≥ 2 and p-value ≤ 0.05, Figure 4 and Figure S4). The expression levels of GmSnRK2.5 and GmSnRK2.8 were significantly up-regulated, whereas the expression of GmSnRK2.22 was down-regulated at each examined time point compared to the control after treatment (Figure 4). Members of Group 3, such as GmSnRK2.3, GmSnRK2.11, GmSnRK2.12 and GmSnRK2.22 were significantly down-regulated after SLs treatment at different time points. Both GmSnRK2.3 and GmSnRK2.12 were down-regulated from 1.2-fold at 8 h to 0.1-fold at 24 h, whereas GmSnRK2.19 of Group 2 was up-regulated from 0.3-fold at 8 h to 1.4-fold at 24 h after treatment compared to the control (Figure 4 and Figure S4). Members of Group 4 exhibited diverse expression patterns. For example, the paralogous gene pairs of GmSnRK2.8 and GmSnRK2.20 showed significantly up-regulated expression, while the paralogous gene pairs of GmSnRK2.2 and GmSnRK2.16 showed significantly down-regulated expression at 16 and 24 h compared to the control after treatment (Figure 4).
The expression of GmSnRK2s of Group 1, except for GmSnRK2.18, exhibited significant changes at different time points compared to the control after NaCl, ABA and SLs treatments. Notably, under NaCl, ABA and SLs treatments, GmSnRK2.5 (SPK4) showed similar expression patterns at different conditions, as well as GmSnRK2.14 (Figure 4). The expression of GmSnRK2.4 of Group 2 were significantly up-regulated at 24 h after NaCl, ABA and SLs treatments, while GmSnRK2.6 of Group 2 only showed differential expression at 16 h after SLs treatment (Figure 4). The expression of GmSnRK2.3 of Group 3 was down-regulated after NaCl and SLs treatments, while up-regulated after ABA treatment. Besides, the expression of GmSnRK2.12 of Group 3 was significantly down-regulated, while the expression of GmSnRK2.21 of Group 3 was significantly up-regulated at 16 h compared to the control after NaCl, ABA and SLs treatments (Figure 4). The expression levels of GmSnRK2.2 and GmSnRK2.8 were significantly up-regulated at 8 hr compared to the control after NaCl, ABA and SLs treatments (Figure 4).
GmSnRK2.4 and GmSnRK2.19 of Group 2 shared similar expression patterns, and both showed up-regulated expression at 24 h after ABA and NaCl treatments (Figure 4). GmSnRK2.4 and GmSnRK2.19 harbored one ABRE and one GARE-motif (gibberellin response element-motif) in their promoters (Table 2). Similarly, GmSnRK2.16 of Group 4 and GmSnRK2.22 of Group 3 exhibited down-regulated expression at 8 h after NaCl treatment, and both were also down-regulated at 16 and 24 h after SLs treatment compared to the control (Figure 4). Meanwhile, GmSnRK2.22 showed significantly differential expression, whereas the expression of GmSnRK2.16 had no changes after ABA treatment compare to the control (Figure 4). Both GmSnRK2.16 and GmSnRK2.22 had no ABREs, and contained some other phytohormone response elements in their promoters, including TGACG-motif, CGTCA-motif and TCA-element (Table 2). However, GmSnRK2.22 had one more TCA-element and TC-rich repeats element than GmSnRK2.16 (Table 2 and Table S3). By contrast, GmSnRK2.14 and GmSnRK2.18 exhibited different expression patterns under ABA and NaCl treatments. The expression of GmSnRK2.18 had no changes, while the expression of GmSnRK2.14 was significantly up-regulated at 16 and 24 h after ABA and NaCl treatments. GmSnRK2.18 contained one ABRE, whereas GmSnRK2.14 had no ABREs in the promoters; in addition, GmSnRK2.14 had one TATC-box (Table 2).

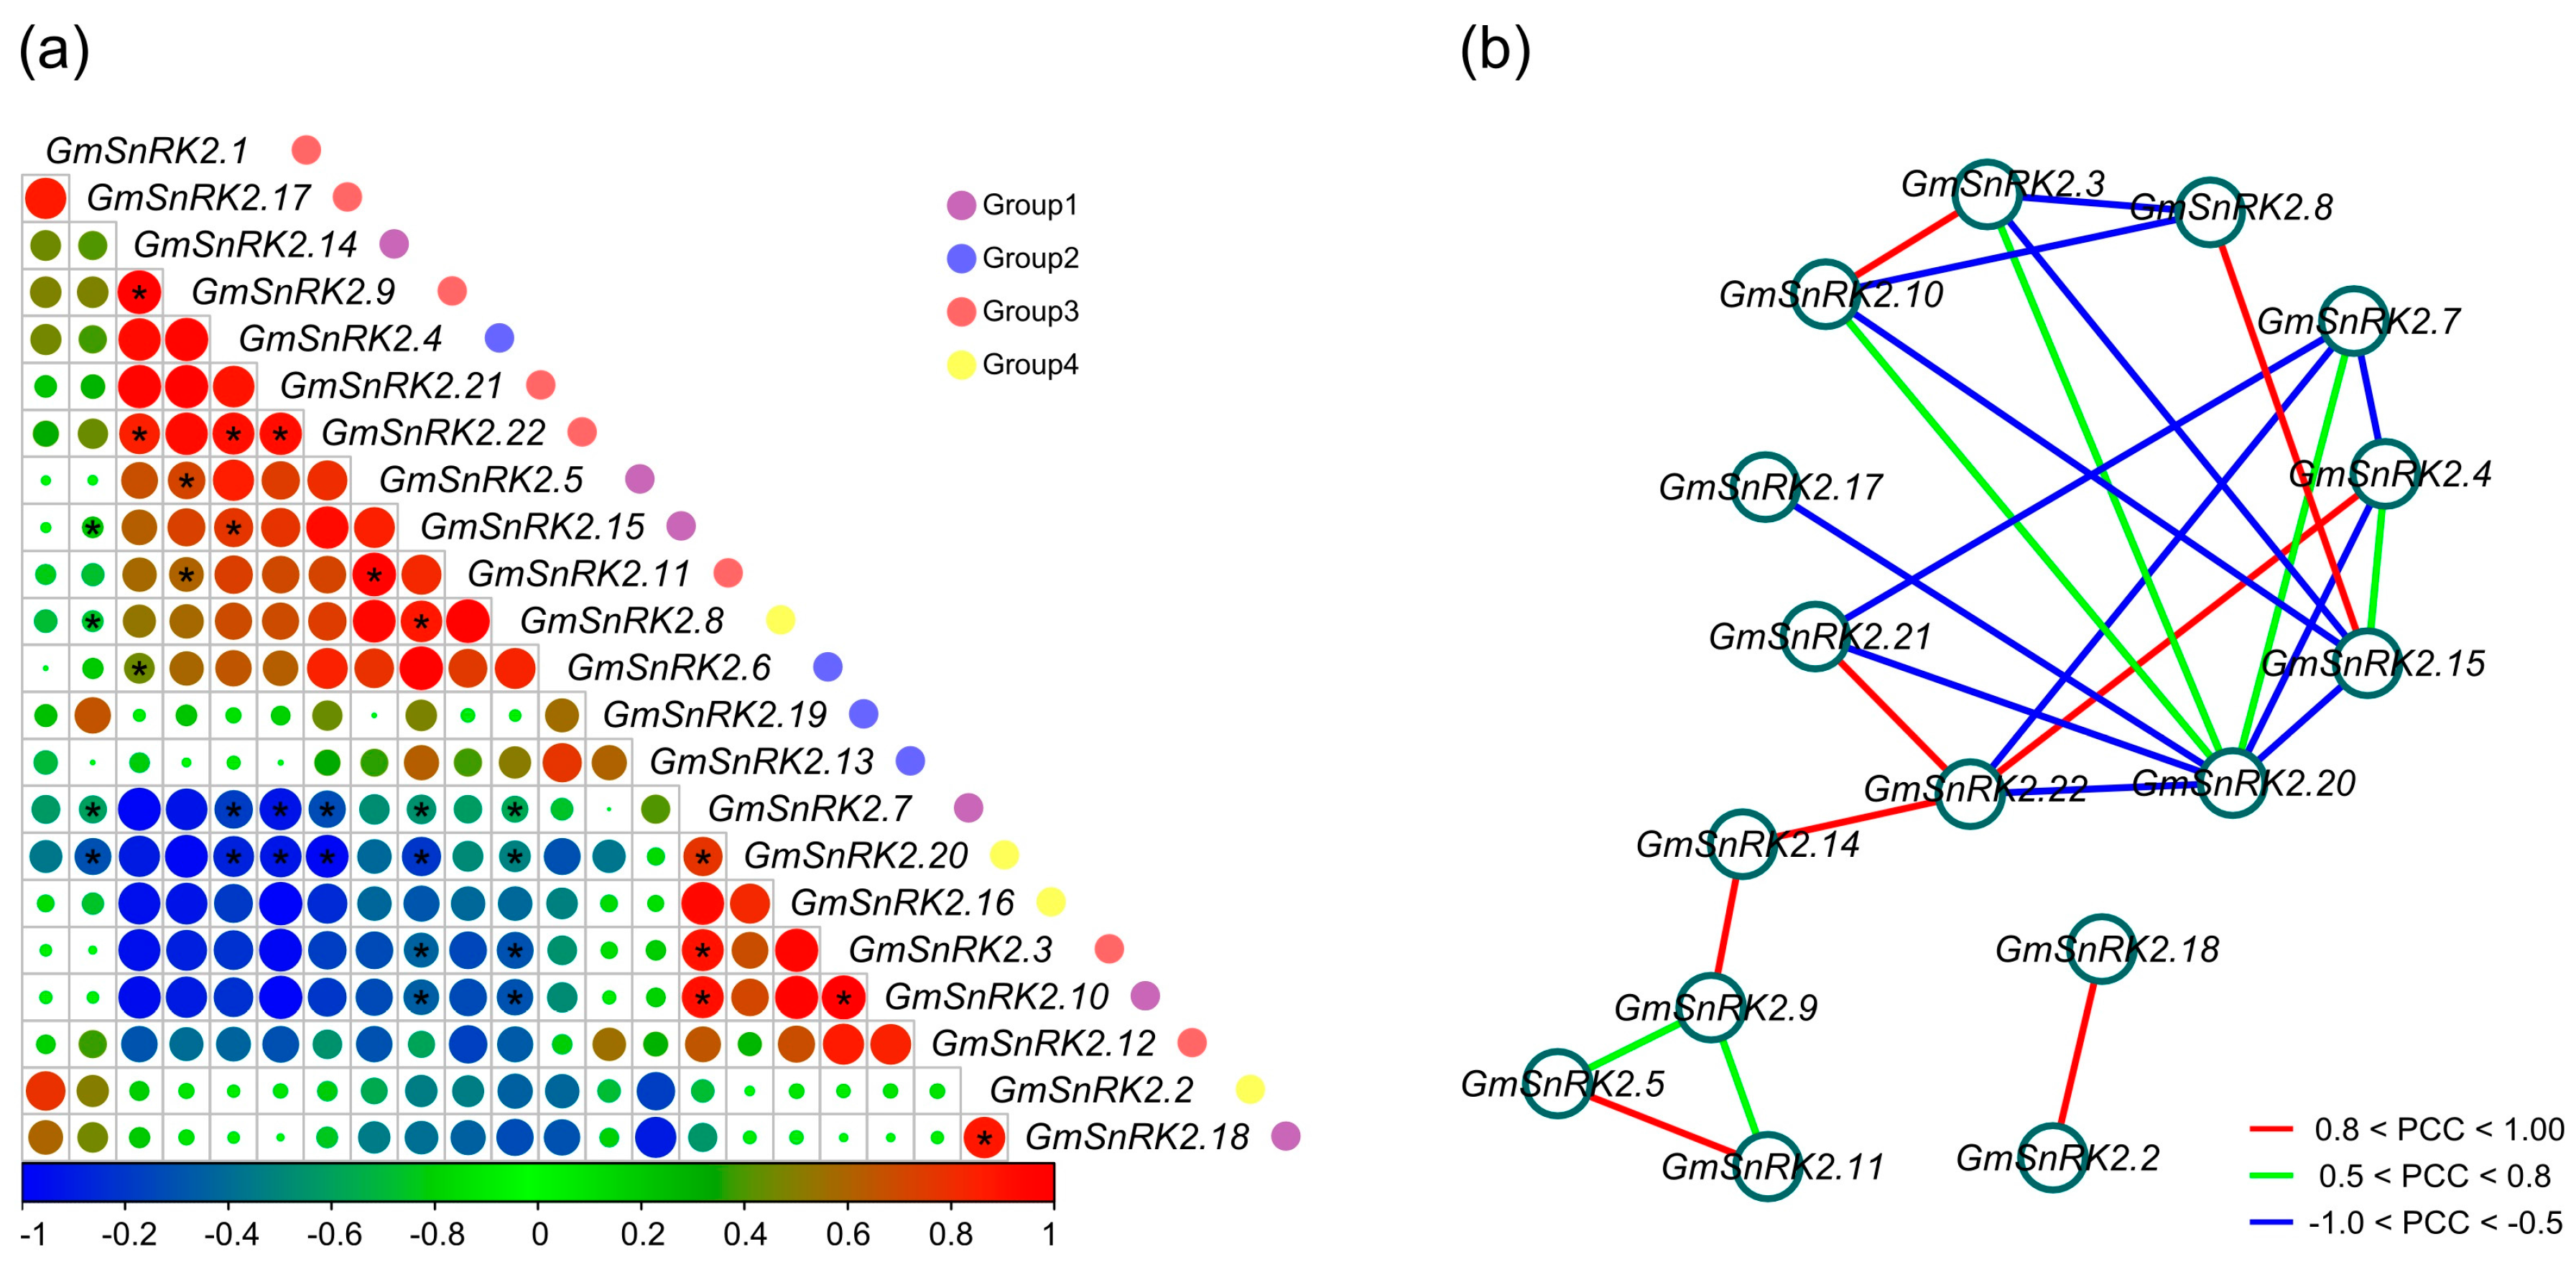
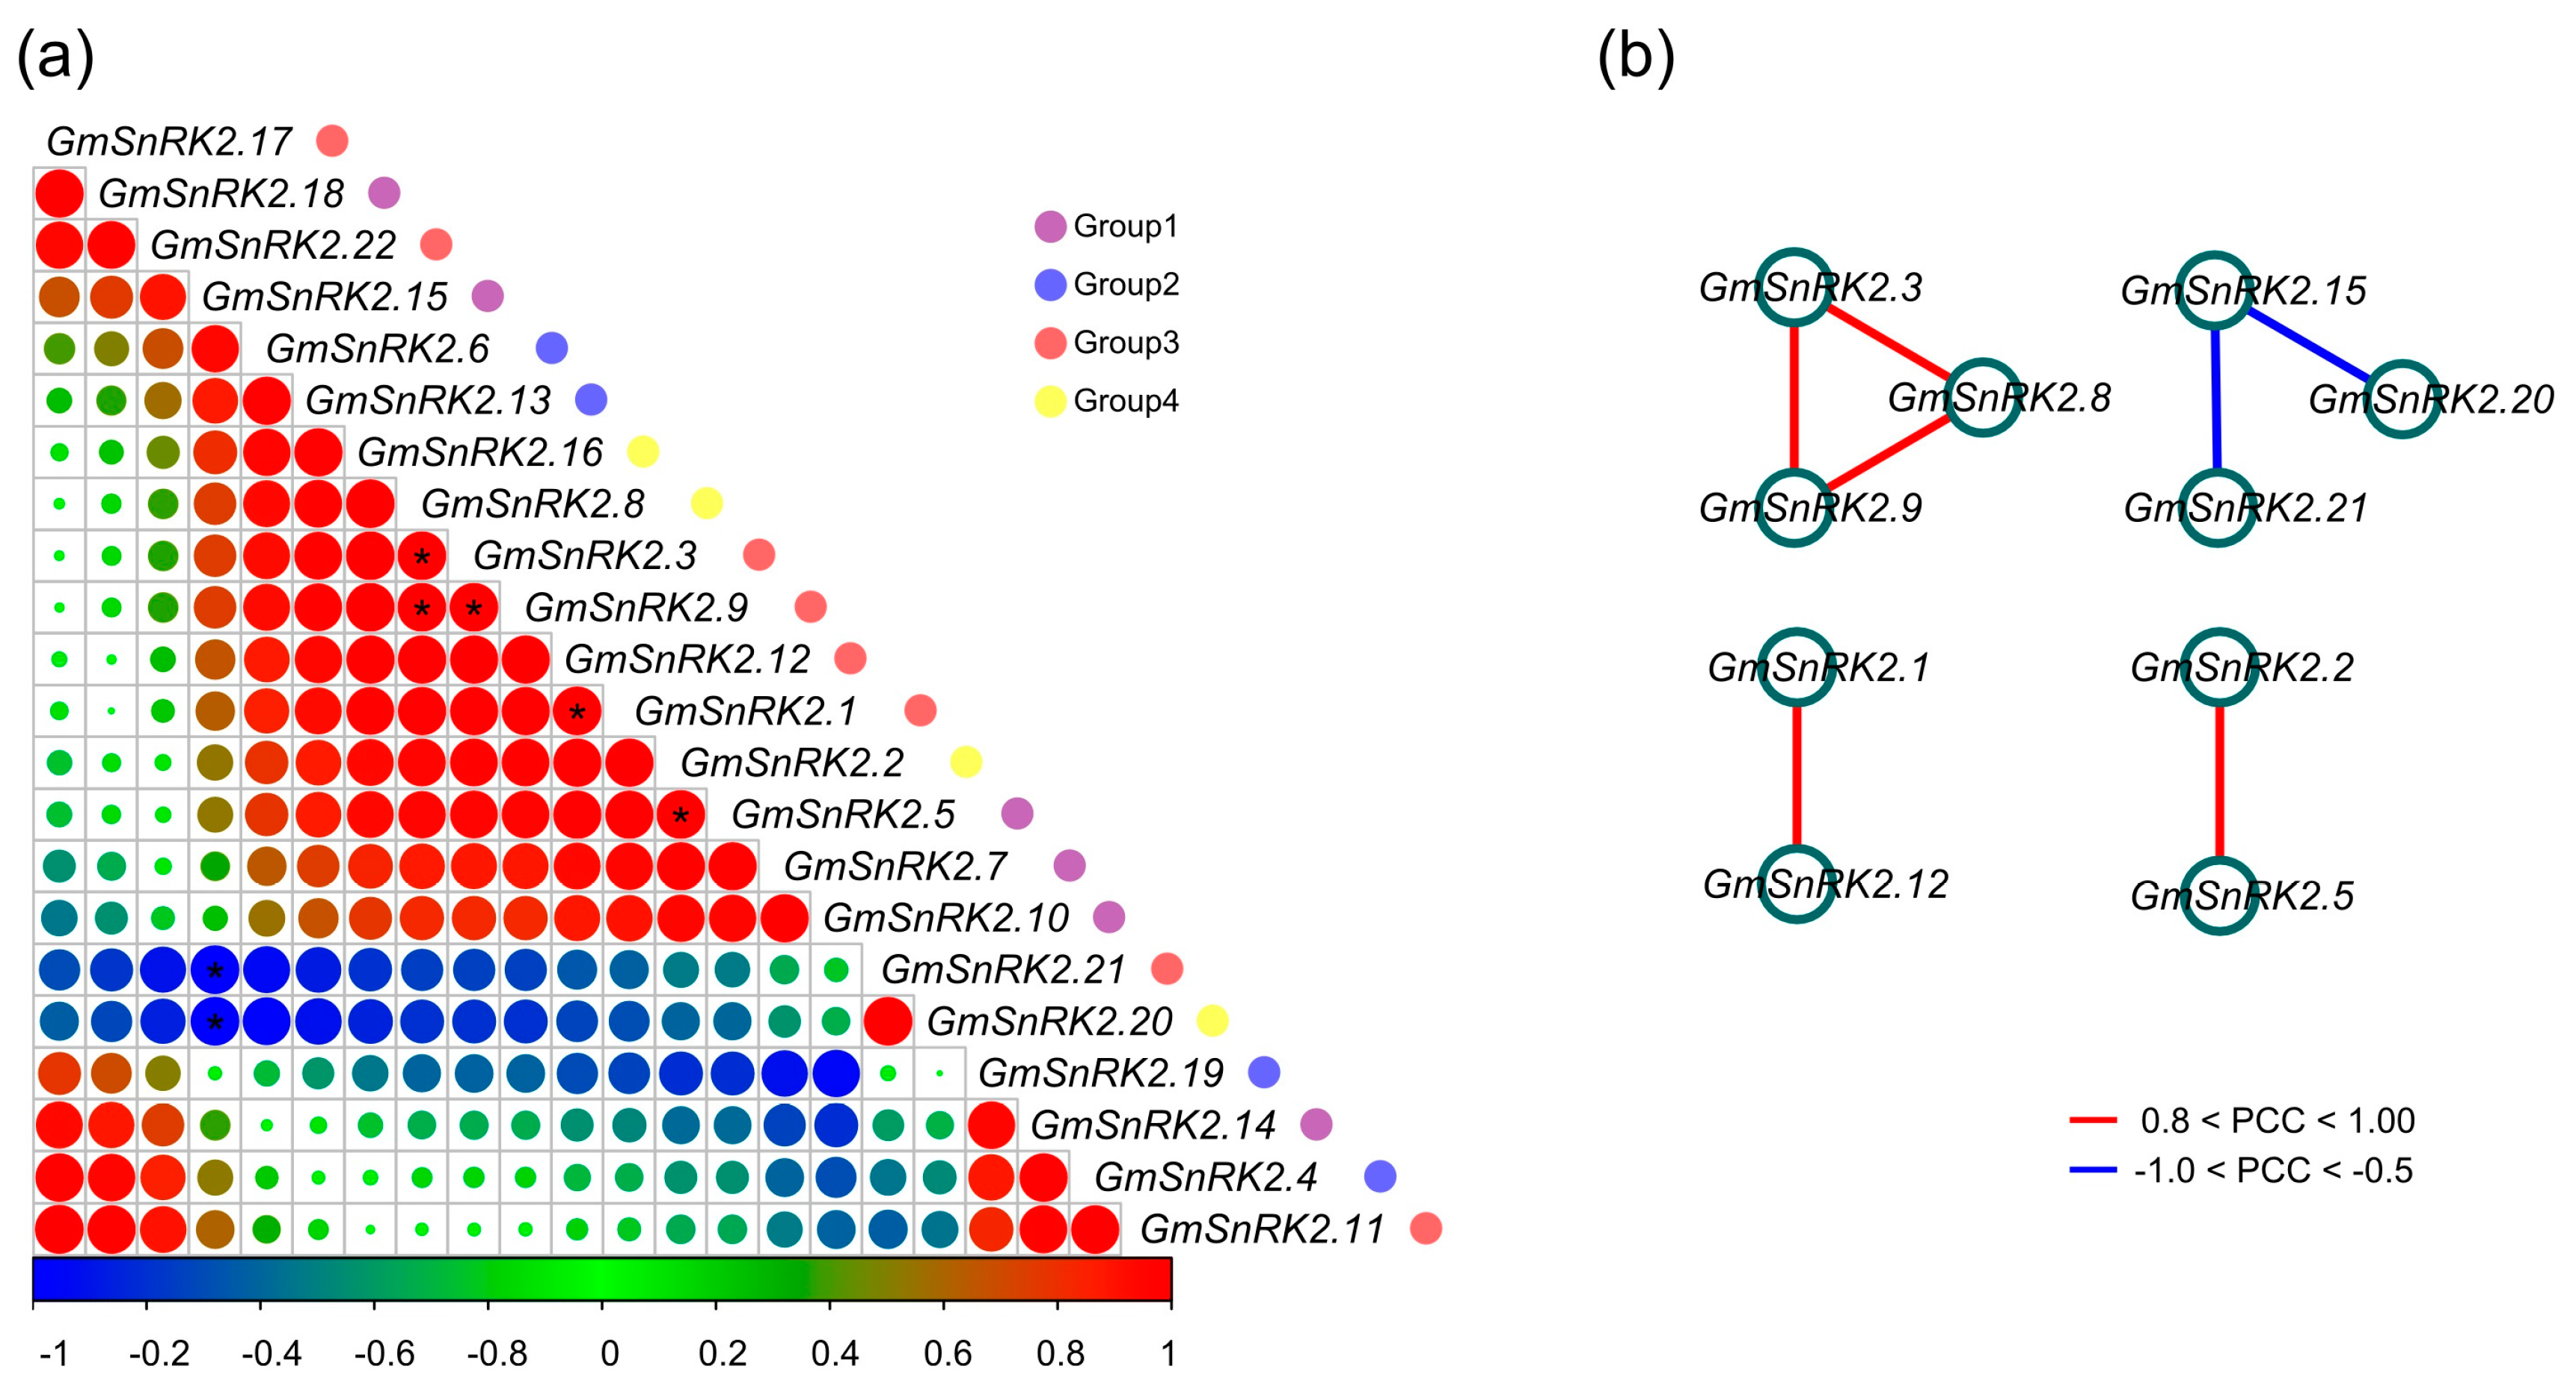
2.6. Co-Regulatory Networks of GmSnRK2s

By using the publicly available RNA-Seq dataset (SRP038111), we investigated the correlations of the 22 GmSnRK2s during seed development of soybean. We calculated the Pearson correlation coefficients (PCCs) of the expression levels of GmSnRK2s, and constructed co-regulatory networks. The expression profiles of GmSnRK2.14 of Group 1, GmSnRK2.4 of Group 2, and GmSnRK2.9, GmSnRK2.21 and GmSnRK2.22 of Group 3 exhibited positive correlations between one another. GmSnRK2.2 of Group 4 and GmSnRK2.18 of Group 1 showed positive correlation, and both showed negative correlations with GmSnRK2.13 of Group 2. Similarly, GmSnRK2.3 of Group 3, GmSnRK2.10 of Group 1, and GmSnRK2.16 of Group 4 exhibited positive correlations between each other, and all showed negative correlations with GmSnRK2.5, GmSnRK2.14 and GmSnRK2.15 of Group 1, GmSnRK2.4 and GmSnRK2.6 of Group 2, and GmSnRK2.9, GmSnRK2.11, GmSnRK2.21 and GmSnRK2.22 of Group 3 (Figure 5a). All the significant PCCs (p-value ≤ 0.05 and PCC > 0.5) of GmSnRK2s were extracted and used to construct seed development co-regulatory networks delineated by Cytoscape (version 3.1, Seattle, WA, USA) (Figure 5b). A total of 26 edges and 16 nodes were in the co-regulatory networks. There were 14 GmSnRK2 gene pairs showing positive correlations, of which eight pairs exhibited strongly positive correlations (p-value ≤ 0.05 and PCC > 0.8), including GmSnRK2.2 and GmSnRK2.18, GmSnRK2.3 and GmSnRK2.10, GmSnRK2.4 and GmSnRK2.22, GmSnRK2.5 and GmSnRK2.11, GmSnRK2.8 and GmSnRK2.15, GmSnRK2.9 and GmSnRK2.14, GmSnRK2.14 and GmSnRK2.22, and GmSnRK2.21 and GmSnRK2.22. Meanwhile, twelve GmSnRK2 gene pairs showed negative correlations (p-value ≤ 0.05 and PCC < −0.5) (Figure 5b).
Based on the qRT-PCR results, we also separately explored the correlations of GmSnRK2s in response to salt stress, ABA and SLs. Under ABA treatment, positive correlations were observed between GmSnRK2s, such as GmSnRK2.5, GmSnRK2.7 and GmSnRK2.15 of Group 1, GmSnRK2.6 and GmSnRK2.13 of Group 2, GmSnRK2.1, GmSnRK2.3, GmSnRK2.9 and GmSnRK2.12 of Group 3, and GmSnRK2.2, GmSnRK2.8 and GmSnRK2.16 of Group 4 (Figure 6a). Among them, GmSnRK2.1, GmSnRK2.3, GmSnRK2.5, GmSnRK2.6, GmSnRK2.7, GmSnRK2.8, GmSnRK2.9 and GmSnRK2.16 also showed positive correlations between each other under NaCl and SLs treatments (Figure S5). In addition, GmSnRK2.19 of Group 2, GmSnRK2.20 of Group 4, and GmSnRK2.21 of Group 3 showed negative correlation with most of the other GmSnRK2s under ABA treatment (Figure 6a). Particularly, GmSnRK2.20 only showed strongly positive correlation with GmSnRK2.21 of Group 3, GmSnRK2.13 of Group 2, and GmSnRK2.19 of Group 2 under ABA, NaCl and SLs treatments, respectively (Figure 6a and Figure S5).
The ABA-related, SLs-related and salinity-related co-regulatory networks of GmSnRK2s were also constructed separately. The ABA-related co-regulatory network of GmSnRK2s was constituted with seven edges and 10 nodes (Figure 6b). Five GmSnRK2 gene pairs showed significantly positive correlations (p-value ≤ 0.05 and PCC > 0.8), including GmSnRK2.1 and GmSnRK2.12, GmSnRK2.2 and GmSnRK2.5, GmSnRK2.3 and GmSnRK2.8, GmSnRK2.3 and GmSnRK2.9, GmSnRK2.8 and GmSnRK2.9. In addition, two GmSnRK2 gene pairs showed negative correlations (p-value ≤ 0.05 and PCC < −0.5) under ABA treatment (Figure 6b). The positive correlations among GmSnRK2.3, GmSnRK2.8 and GmSnRK2.9 also existed in the NaCl-related co-regulatory network of GmSnRK2s (Figure S5). Similarly, the positive correlation between GmSnRK2.11 and GmSnRK2.17 was present in both NaCl-related and SLs-related co-regulatory networks of GmSnRK2s (Figure S5). Notably, the significant correlations under NaCl, ABA and SLs treatments existed not only between GmSnRK2s of the same “Group”, such as GmSnRK2.3 of Group 3 and GmSnRK2.9 of Group 3 in the ABA-related and NaCl-related co-regulatory networks, and GmSnRK2.5 of Group 1 and GmSnRK2.7 of Group 1 in the SLs-related co-regulatory network, but also between members of the different “Group”, such as GmSnRK2.2 of Group 4 and GmSnRK2.5 of Group 1 in the ABA-related co-regulatory network, GmSnRK2.4 of Group 2 and GmSnRK2.22 of Group 3 in the NaCl-related co-regulatory network, and GmSnRK2.10 of Group 1 and GmSnRK2.11 of Group 3 in the SLs-related co-regulatory network (Figure 6b and Figure S5). However, among all the correlations in the ABA-related, salt-related and SLs-related co-regulatory networks, no significant correlations were observed between the paralogous gene pairs of GmSnRK2s (Figure 6b and Figure S5). In the co-regulatory networks, the GmSnRK2 genes with significant correlation contained common cis-active elements in their promoters. For example, GmSnRK2.3 and GmSnRK2.9 contained ERE, GARE-motif, MYB binding site involved in drought-inducibility (MBS) and TC-rich repeats elements in their promoters. GmSnRK2.1 and GmSnRK2.12 had ABRE, AuxRR-core, TCA-element and TC-rich repeats elements in their promoter regions. Additionally, GmSnRK2.2, GmSnRK2.5 and GmSnRK2.7 had MeJA response and TC-rich repeats elements, while GmSnRK2.10, GmSnRK2.11 and GmSnRK2.17 harbored MBS, heat stress responsiveness (HSE) and TC-rich repeats element in the promoters (Table 2 and Table S3).

3. Discussion

While being exposed to the harmful environments, plants could acclimate themselves to the stresses through various morphological, physiological, and molecular responses [3]. Among these processes, phosphorylation by stress-inducible protein kinases plays important roles for plants to sense and respond to environmental stresses [9]. SnRK2s, a subfamily of Ser/Thr protein kinases family, had critical functions in responses to hyperosmotic stress, high salinity and dehydration [24,38]. Besides, SnRK2s also play important roles in ABA signal transduction [25,39,41]. Here, we performed a comprehensive identification and characterization of soybean SnRK2 genes (GmSnRK2s). Compared to the number of SnRK2s found in other diploid plant species, such as 10 in Arabidopsis thaliana [11], 10 in Oryza sativa [13], 12 in Malus prunifolia [14] and 11 in maize [15], soybean contained much more SnRK2 genes, including 22 SnRK2s over the 12 chromosomes.
The exon-intron organizations of GmSnRK2s exhibited high similarity with Arabidopsis thaliana and rice [13]. The sizes of introns of GmSnRK2s varied a lot, but their intron phasing is highly conserved. Except for GmSnRK2.6, the coding sequences of GmSnRK2s were separated by eight introns, and most of GmSnRK2s contained nine exons. The similar distribution of eight introns and nine exons was also found in other species, such as Arabidopsis thaliana, rice, cotton and maize, indicating the high evolutionary conservation of gene structure of SnRK2s in higher plants [11,12,13,14,15].
Phylogenetic analysis revealed that SnRK2s of soybean were primarily classified into four phylogenetic groups as Group 1, Group 2, Group 3 and Group 4. Previous study demonstrated that SnRK2s of Arabidopsis thaliana and cotton were clustered into three groups [13,23,37]. SnRK2s of Group 1 and Group 2 were only activated under hyperosmotic stress [11], while members of Group 3 could be response to both ABA and hyperosmotic signal [31,37]. Unlike Group 1, Group 2 and Group 3, GmSnRK2s of the new subgroup of Group 4 with four GmSnRK2s and OsSAPK3 showed no enrichment for Glu(E) or Asp(D) in the C-terminal. The member of Group 4, OsSAPK3, was reported to be up-regulated by ABA treatment, and down-regulated by mannitol treatment in the roots [11]. Similarly, the expression levels of several members of Group 4 in soybean, such as GmSnRK2.2, GmSnRK2.8 and GmSnRK2.22, were significantly up-regulated after ABA treatment. In addition, OsSAPK3 could be autophosphorylated in a Ca2+-dependent manner and its expression was also up-regulated by Xanthomonas oryzae pv. oryzicola infection [42,43]. These indicated that the GmSnRK2s of Group 4 might be involved in response to both abiotic and biotic stresses. In all the four groups, SnRK2s of soybean showed expansion, which might be the result from two whole genome duplication events in the long-term evolution of soybean [36].
Previous report demonstrated that multiple ABREs or an ABRE coupled with other elements such as DRE/CRT was required for the expression of ABA-responsive genes [44]. Various cis-acting regulatory elements were found in the promoter regions of GmSnRK2 genes. Among those are the regulatory elements known to be involved in ABA response, defense and stress responsiveness, suggesting their roles under various biotic and abiotic stimuli. ABA plays important roles in a diverse range of biological processes including development and response to drought, salinity, cold and biotic stress [4,5]. The SnRK2s family plays a crucial role in plant response to abiotic stresses and ABA-dependent plant development [25,26,27,28,29,30]. In Arabidopsis, SRK2C, SRK2D, SRK2E, SRK2F, and SRK2I could be activated by ABA [8,28,29]. In rice, three members of SnRK2 genes (OsSAPK8, OsSAPK9 and OsSAPK10) were activated by ABA [11]. In this study, we demonstrated that the expression of 19 GmSnRK2 genes could be induced by exogenous ABA treatment in soybean. Interestingly, among three GmSnRK2 genes that did not respond to ABA treatment, GmSnRK2.6 and GmSnRK2.16 had no ABREs, and GmSnRK2.18 had only one ABRE in their promoter regions. The expression of GmSnRK2.5 (SPK4) was reported to be not affected by exogenous ABA previously [34]. However, our data exhibited that the expression level of GmSnRK2.5 was significantly increased at 8 h after ABA treatment, and then declined to the basal level at 16 and 24 h. This conflicting result might be caused by different concentration of exogenous ABA (100 μM for this study; 200 μM for previous study) and time points (0, 8, 16 and 24 h for this study; 0, 1, 3, 6, 12 and 24 h for previous study) that were used for treatment and detection. Additionally, we applied salt stress on soybean seedlings to explore the expression changes of GmSnRK2s. The expressions of most of GmSnRK2s were induced by salt stress. GmSnRK2.6 did not respond to NaCl treatment, while GmSnRK2.16 and GmSnRK2.18 showed significantly differential expression after NaCl treatment. GmSnRK2.16 and GmSnRK2.18 contained two MeJA response elements in their promoters compared to GmSnRK2.6, which had no MeJA response element in the promoter region. Members of GmSnRK2 gene family showed different and temporally dynamic expression patterns after NaCl and ABA treatments. The diverse expression patterns of GmSnRK2s under stresses might be attributed to different cis-acting elements in their promoters, which is worthy of being studied further. Although some SnRK2s were major regulators of ABA signal transduction, their transcript or protein levels might not be affected by ABA application, because the activities of SnRK2s were transiently regulated via reversible phosphorylation in plant cells [11,12]. Thus, to confirm the involvement of ABA pathway for the GmSnRK2s, further studies including the elucidation of their activation profile, interaction proteins and phenotypic changes of transgenic plants will be helpful to clarify the accurate biological role of each member of GmSnRK2 family in vivo.
The dynamic change of gene expression could provide useful information of gene functions. Through re-analysis of public RNA-Seq datasets, we found that SnRK2 genes exhibited diverse spatio-temporal expression patterns during the growth and development of different tissues in soybean. In Arabidopsis, SRK2B of Group 1 was expressed in various tissues, and SRK2F of Group 2 was mainly expressed in flowers [45,46]. Soybean and Arabidopsis SnRK2 genes in the same “Group” showed similar tissue and developmental stage-specific expression patterns. GmSnRK2.2 and GmSnRK2.16 of Group 4 were preferentially expressed in meristem. Notably, GmSnRK2s of Group 1, such as GmSnRK2.7, GmSnRK2.14, GmSnRK2.15 and GmSnRK2.18, showed specific expression patterns during seed development. GmSnRK2.14 and GmSnRK2.15 were highly expressed in the late stages of seed development, while GmSnRK2.7 and GmSnRK2.18 were highly expressed in the early and mid-stages respectively, which indicated that members of Group 1 might play different roles during seed development in soybean.
Strigolactones (SLs), as the most recently characterized plant hormones, could stimulate the branching and play important roles in the establishment of a symbiotic association between the plant and fungi in the rhizosphere [47]. To our knowledge, there were no reports regarding the interaction between SLs and SnRK2s. Our study revealed that some SnRK2 genes were strongly induced in soybean by SLs. Interestingly, GmSnRK2.6 did not respond to NaCl and ABA treatments, but was differentially expressed after SLs treatment, which indicated that GmSnRK2.6 might be specifically involved in SLs signaling pathway. Further elucidation of these SL-responsive SnRK2s might be helpful for scientists to reveal the molecular mechanisms underlying the interactions of between SLs and other different pathways.
In Brassica rapa ssp. Chinensis, some SnRK2 genes, such as BcSnRK2.1a, BcSnRK2.1b, BcSnRK2.4b and BcSnRK2.8b, showed close correlations in expression patterns under ABA and low temperature treatment [22]. Similarly, 10, 18 and 14 GmSnRK2s showed significant correlations in the changes of expression in the ABA-related, NaCl-related and SLs-related co-regulatory networks, respectively. Among them, the largest count of GmSnRK2 genes belongs to Group 3. Most of the members of Group 3, including GmSnRK2.1, GmSnRK2.3, GmSnRK2.9, GmSnRK2.12, GmSnRK2.17 and GmSnRK2.21, contained ABREs as well as various cis-active response elements, such as AuxRR-core, P-box, TCA-element, CGTCA-motif, TGACG-motif, ERE, GARE-motif, TATC-box, Circadian, low-temperature responsiveness (LTR), MBS, TC-rich repeats, wound-responsive element (WUN-motif) and Box-W1. Furthermore, the co-regulated GmSnRK2 genes with significant correlations shared similar cis-active elements in their promoters, which suggested that these elements might be responsible for stress-responsive co-expression of GmSnRK2s under different environmental conditions. Notably, there were common correlations of GmSnRK2 genes under different treatments, such as the positive correlations among GmSnRK2.3, GmSnRK2.8, and GmSnRK2.9 under ABA and NaCl treatments, the positive correlation between GmSnRK2.11 and GmSnRK2.17 under NaCl and SLs treatments, which indicated that these GmSnRK2s might exhibit synergistic effects of signal regulation in response to various stresses. Intriguingly, the paralogous gene pairs of GmSnRK2s showed no significant correlations with each other in the ABA-related, NaCl-related, and SLs-related co-regulated networks, which suggested that the paralogous GmSnRK2 genes exhibited functional divergence during the evolution of soybean. Gene co-regulatory networks play important roles in the growth and developmental processes for organisms [48]. Of 22 GmSnRK2 genes, 16 SnRK2s showed significant correlations in expression during seed development. GmSnRK2.5 and GmSnRK2.20 showed negative correlation in both seed development-related and ABA-related co-regulatory networks. By contrast, GmSnRK2.3 and GmSnRK2.8 had positive correlation under salt stress and ABA treatments, but had negative correlation during seed development. These results suggested that the correlations between GmSnRK2s varied under different conditions.
In this study, we presented a genome-wide identification and characterization of GmSnRK2 in soybean, in which gene structures, phylogenetic relation, cis-acting regulatory elements and expression patterns of GmSnRK2s in different tissues or treatments, were analyzed in comparison with two model plants, Arabidopsis and rice. Our study provides useful information for scientists to further elucidate the function of GmSnRK2 in soybean.

4. Materials and Methods

4.1. Plant Materials

Seeds of Glycine max L. Merr were germinated in vermiculite saturated with water. One week-old seedlings were transferred to a hydroponic system with half-strength Hoagland’s nutrient solution and grown in an incubator at 28 °C under a 16:8 (light:dark) photoperiod. After three weeks, for the gene expression analyses using qRT-PCR under salt, ABA and rac-GR24 stress, the seedlings were treated with half-strength Hoagland’s solution containing 150 mM NaCl, 100 μM ABA (Sigma-Aldrich, St. Louis, MO, USA) and 10 μM rac-GR24 (Sigma-Aldrich), respectively, at four time points (0, 8, 16 and 24 h). The seedlings with no treatment were used as a control. For all conditions, including control, three biological replicates were used. The treatments were performed at 0 h when the light period started. Leaves were collected at each time point, and immediately frozen in liquid nitrogen and stored at −80 °C.

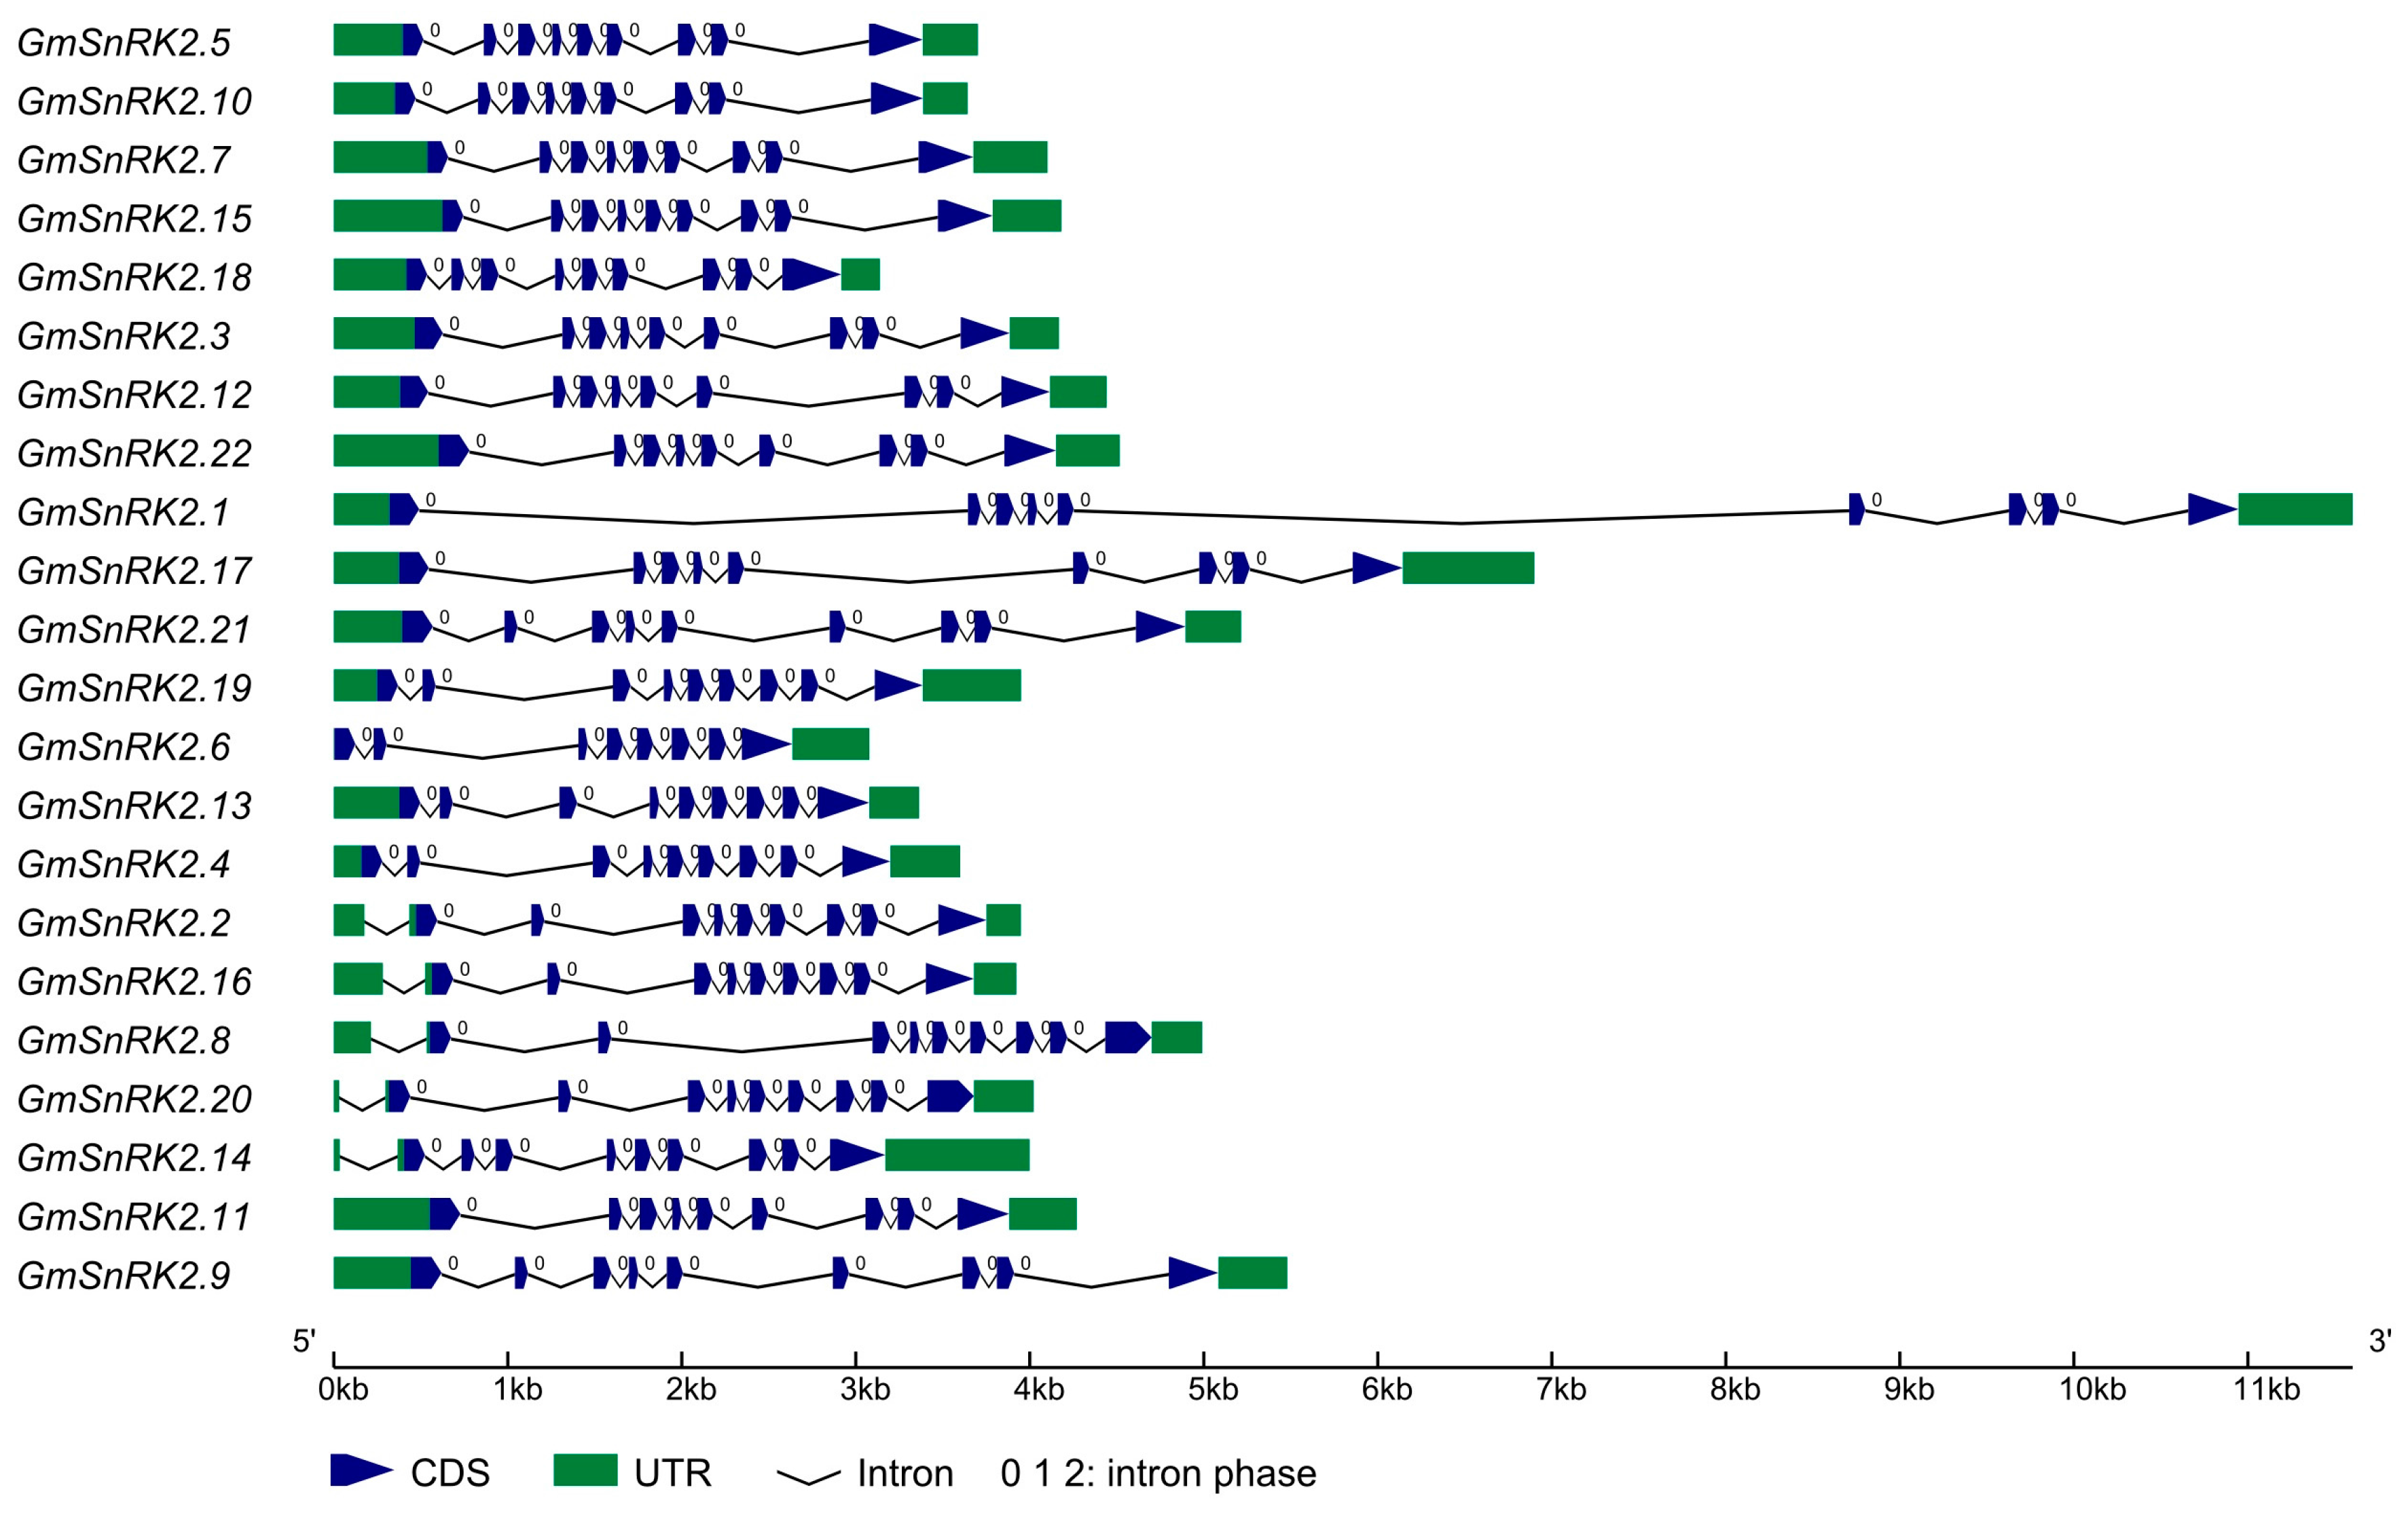
4.2. Identification of GmSnRK2 Genes and Gene Structure Analysis

The genome sequence and gene annotation of soybean (Glycine max L. Merr) were downloaded from the Joint Genome Institute (JGI) database (available online: https://phytozome.jgi.doe.gov/pz/portal.html#!info?alias=Org_Gmax). The peptides of SnRK2 proteins of Arabidopsis thaliana and Oryza sativa were used as queries in a TBLASTN (version 2.2.26, Bethesda, MD, USA) search against the soybean genome with an E-value threshold of 1 × 10⁻⁵. The accession numbers or locus IDs of SnRK2 genes of Arabidopsis thaliana and Oryza sativa were listed in supplementary materials (Table S1). DNA sequences of soybean genomic regions matching to AtSnRK2s and OsSnRK2s with high identity were extracted and used to infer the exon-intron structures of the GmSnRK2 genes by GeneWise2 (version 2.4.1, Hinxton, Cambridge, UK ) [49]. The protein sequences of the predicted GmSnRK2s were queried against all the annotated proteins of Arabidopsis thaliana and Oryza sativa using BLASTP (version 2.2.26, Bethesda, MD, USA). The putative GmSnRK2s with best hits of the Arabidopsis thaliana and Oryza sativa SnRK2s were remained, and further queried against the annotated genes of soybean in JGI database. According to the gene structures of predicted GmSnRK2s and their best hits in database, the exon-intron structures of the GmSnRK2s were refined, and the start/stop codon, 5′-unstranslated region (UTR) and 3′-UTR were also revised.

4.3. Functional Domain and Cis-Acting Regulatory Elements Analysis

The peptides of GmSnRK2 proteins were translated from coding DNA sequences with standard genetic code, and were further inspected and revised according to the alignment with soybean protein sequences in JGI database by BLASTP. The peptides of GmSnRK2s were submitted to InterProScan (version 5.25-64.0, Hinxton, Cambridge, UK) to examine the presence and completeness of the protein kinase domain. The physical and chemical properties including molecular weight, isoelectric point, aliphatic index, and GRAVY were calculated using Protparam (available online: http://web.expasy.org/protparam/). The upstream 2 kb regions from transcription start site (TSS) of each GmSnRK2 genes were extracted from soybean genome sequence, and used to identify cis-acting regulatory elements by PlantCARE server (available online: http://bioinformatics.psb.ugent.be/webtools/plantcare/html/) [50].

4.4. Multiple Sequence Alignment and Phylogenetic Analysis

The protein sequences of GmSnRK2s, AtSnRK2s and OsSnRK2s were used to perform multiple sequence alignment using MUSCLE (version 3.2, Hinxton, Cambridge, UK) [51]. Phylogenetic tree was inferred using the Neighbor-Joining (NJ) method available in MEGA5 (version 5.1 β, Hachioji, Tokyo, Japan) [52]. The robustness of each node in the tree was determined using 1000 bootstrap replicates.

4.5. Expression Analysis

The publicly available transcriptome dataset of soybean (accession number: SRP038111; March 2014) was downloaded from the National Center for Biotechnology Information (NCBI) Sequence Read Archive (SRA) database, and used for gene expression profiling [53]. Mapping of these RNA-Seq reads was done by Tophat2 (version 2.1.0, Baltimore, MD, USA) with the default settings [54]. Quantification of gene expression was done using the Fragments Per Kilobase Of Exon Per Million Fragments Mapped (FPKM) algorithm. The clustered heatmap of Z scaled resulting FPKM values per tissue for GmSnRK2s was generated using the pheatmap function of R package (version 3.2.2; available online: https://cran.r-project.org/web/packages/pheatmap/).

4.6. RNA Extraction and cDNA Synthesis

Total RNAs were extracted from each leaf sample using TRIzol reagent (Invitrogen, Carlsbad, CA, USA) following the manufacturer’s procedure. The quantity/quality of total RNA was measured with a NanoDrop® 1000 Spectrophotometer (Wilmington, DE, USA). Two μg of total RNA was used to synthesize copy DNA (cDNA) using TaKaRa PrimerScriptTM RT reagent kit with gDNA Eraser (Takara, Shiga, Japan) according to the manufacturer’s protocol.

4.7. Quantitative Real-Time Polymerase Chain Reaction

The expression analysis of the 22 GmSnRK2 genes was performed by qRT-PCR using a SYBR Green PCR kit (GeneCopoeia, Inc., Rockville, MD, USA) with ViiATM 7 Dx platform (ABI, Los Angeles, CA, USA). The amplified primers and internal controls were listed in supplementary materials (Table S2). The qRT-PCR reaction condition was as following: 95 °C for 30 s, 40 cycles at 95 °C for 5 s, 58 °C for 30 s, and 72 °C for 30 s. After amplification, the melting curve and amplification curve were checked to evaluate specific amplification. The relative expression levels of these genes were analyzed by the 2−ΔΔCt method, and the GmSKIP gene was used as the internal control. All qRT-PCR reactions were assayed in triplicates.

4.8. Pearson Correlation Analysis

Pearson correlation coefficients (PCCs) and p-value of expression levels of GmSnRK2 gene pairs were calculated using R package program based on the RNA-Seq and qRT-PCR results. Gene co-regulatory networks were constructed by Cytoscape (version 3.1, Seattle, WA, USA) based on the PCCs of GmSnRK2 gene pairs with a p-value significance level of 0.05 [55].

Supplementary Materials

Supplementary materials can be found at www.mdpi.com/1422-0067/18/9/1834/s1.

Acknowledgments

This work was supported by the National Transgenic Project (2016ZX08004003), the National Natural Science Foundation of China (31371654 and 31522042), National Key Research and the Development Program of China (2016YFD0100500), the Natural Science Foundation of Hubei (2016CFA049) and the Agricultural Science and Technology Innovation Program (Y2017JC14).

Author Contributions

Yong-Qing Jiao and Wei Zhao designed the research and wrote the article. Wei Zhao and Yi-Hui Cheng performed most of the data analysis and experiments. Chi Zhang, Xin-Jie Shen, Wei Guo, Qing-Bo You, Xiang Li, Xue-Jiao Song and Xin-An Zhou performed part of the experiments. Yong-Qing Jiao coordinated the study. All authors read and approved the final manuscript.

Conflicts of Interest

The authors declare no conflict of interest.

Abbreviations

ABAAbscisic acid
SLsStrigolactones
MeJAMethyl Jasmonic acid
EREEthylene response element
JGIJoint Genome Institute
LTRLow-temperature responsiveness
MBSMYB binding site involved in drought-inducibility
GAREGibberellin response element
HSEHeat stress responsiveness
WUN-motifWound-responsive element
qRT-PCRQuantitative real-time polymerase chain reaction
FPKMFragments Per Kilobase Of Exon Per Million Fragments Mapped
GRAVYGrand average of hydropathy
PCCsPearson correlation coefficients
CDSCoding sequence
TSSTranscription start site
MWMolecular weight
pIIsoelectric point
aaAmino acid
bpBase pair
kDaKilodalton

References

  1. Bohnert, H.J.; Gong, Q.; Li, P.; Ma, S. Unraveling abiotic stress tolerance mechanisms–Getting genomics going. Curr. Opin. Plant Biol. 2006, 9, 180–188. [Google Scholar] [CrossRef] [PubMed]
  2. Verma, V.; Ravindran, P.; Kumar, P.P. Plant hormone-mediated regulation of stress responses. BMC Plant Biol. 2016, 16, 86. [Google Scholar] [CrossRef] [PubMed]
  3. Fujita, M.; Fujita, Y.; Noutoshi, Y.; Takahashi, F.; Narusaka, Y.; Yamaguchi-Shinozaki, K.; Shinozaki, K. Crosstalk between abiotic and biotic stress responses: A current view from the points of convergence in the stress signaling networks. Curr. Opin. Plant Biol. 2006, 9, 436–442. [Google Scholar] [CrossRef] [PubMed]
  4. Golldack, D.; Li, C.; Mohan, H.; Probst, N. Gibberellins and abscisic acid signal crosstalk: Living and developing under unfavorable conditions. Plant Cell Rep. 2013, 32, 1007–1016. [Google Scholar] [CrossRef] [PubMed]
  5. Narusaka, Y.; Nakashima, K.; Shinwari, Z.K.; Sakuma, Y.; Furihata, T.; Abe, H.; Narusaka, M.; Shinozaki, K.; Yamaguchi-Shinozaki, K. Interaction between two cis-acting elements, ABRE and DRE, in ABA-dependent expression of Arabfidopsis rd29A gene in response to dehydration and high-salinity stresses. Plant J. 2003, 34, 137–148. [Google Scholar] [CrossRef] [PubMed]
  6. Zhang, J.H.; Jia, W.; Yang, J.C.; Ismail, A.M. Role of ABA in integrating plant responses to drought and salt stresses. Field Crop Res. 2006, 97, 111–119. [Google Scholar] [CrossRef]
  7. Klingler, J.P.; Batelli, G.; Zhu, J.K. ABA receptors: The START of a new paradigm in phytohormone signalling. J. Exp. Bot. 2010, 61, 3199–3210. [Google Scholar] [CrossRef] [PubMed]
  8. Furihata, T.; Maruyama, K.; Fujita, Y.; Umezawa, T.; Yoshida, R.; Shinozaki, K.; Yamaguchi-Shinozaki, K. Abscisic acid-dependent multisite phosphorylation regulates the activity of a transcription activator AREB1. Proc. Natl. Acad. Sci. USA 2006, 103, 1988–1993. [Google Scholar] [CrossRef] [PubMed]
  9. Ghillebert, R.; Swinnen, E.; Wen, J.; Vandesteene, L.; Ramon, M.; Norga, K.; Rolland, F.; Winderickx, J. The AMPK/SNF1/SnRK1 fuel gauge and energy regulator: Structure, function and regulation. FEBS J. 2011, 278, 3978–3990. [Google Scholar] [CrossRef] [PubMed]
  10. Yoshida, R.; Hobo, T.; Ichimura, K.; Mizoguchi, T.; Takahashi, F.; Aronso, J.; Ecker, J.R.; Shinozaki, K. ABA-activated SnRK2 protein kinase is required for dehydration stress signaling in Arabidopsis. Plant Cell Physiol. 2002, 43, 1473–1483. [Google Scholar] [CrossRef] [PubMed]
  11. Kobayashi, Y.; Yamamoto, S.; Minami, H.; Kagaya, Y.; Hattori, T. Differential activation of the rice sucrose nonfermenting1-related protein kinase2 family by hyperosmotic stress and abscisic acid. Plant Cell 2004, 16, 1163–1177. [Google Scholar] [CrossRef] [PubMed]
  12. Boudsocq, M.; Barbier-Brygoo, H.; Laurière, C. Identification of nine sucrose nonfermenting 1-related protein kinases 2 activated by hyperosmotic and saline stresses in Arabidopsis thaliana. J. Biol. Chem. 2004, 279, 41758–41766. [Google Scholar] [CrossRef] [PubMed]
  13. Saha, J.; Chatterjee, C.; Sengupta, A.; Gupta, K.; Gupta, B. Genome-wide analysis and evolutionary study of sucrose non-fermenting 1-related protein kinase 2 (SnRK2) gene family members in Arabidopsis and Oryza. Comput. Biol. Chem. 2014, 49, 59–70. [Google Scholar] [CrossRef] [PubMed]
  14. Shao, Y.; Qin, Y.; Zou, Y.; Ma, F. Genome-wide identification and expression profiling of the SnRK2 gene family in Malus prunifolia. Gene 2014, 552, 87–97. [Google Scholar] [CrossRef] [PubMed]
  15. Huai, J.; Wang, M.; He, J.; Zheng, J.; Dong, Z.; Lv, H.; Zhao, J.; Wang, G. Cloning and characterization of the SnRK2 gene family from Zea mays. Plant Cell Rep. 2008, 27, 1861–1868. [Google Scholar] [CrossRef] [PubMed]
  16. Tian, S.; Mao, X.; Zhang, H.; Chen, S.; Zhai, C.; Yang, S.; Jing, R. Cloning and characterization of TaSnRK2.3, a novel SnRK2 gene in common wheat. J. Exp. Bot. 2013, 64, 2063–2080. [Google Scholar] [CrossRef] [PubMed]
  17. Zhang, H.; Mao, X.; Jing, R.; Chang, X.; Xie, H. Characterization of a common wheat (Triticum aestivum L.) TaSnRK2.7 gene involved in abiotic stress responses. J. Exp. Bot. 2011, 62, 975–988. [Google Scholar] [CrossRef] [PubMed]
  18. Mao, X.; Zhang, H.; Tian, S.; Chang, X.; Jing, R. TaSnRK2.4, a SNF1-type serine-threonine protein kinase of wheat (Triticum aestivum L.) confers enhanced multi-stress tolerance in Arabidopsis. J. Exp. Bot. 2009, 61, 683–696. [Google Scholar] [CrossRef] [PubMed]
  19. Zhang, H.; Mao, X.; Wang, C.; Jing, R. Overexpression of a common wheat gene TaSnRK2.8 enhances tolerance to drought, salt and low temperature in Arabidopsis. PLoS ONE 2010, 5, e16041. [Google Scholar] [CrossRef] [PubMed]
  20. Yoo, M.J.; Ma, T.; Zhu, N.; Liu, L.; Harmon, A.C.; Wang, Q.; Chen, S. Genome-wide identification and homeolog-specific expression analysis of the SnRK2 genes in Brassica napus guard cells. Plant Mol. Biol. 2016, 91, 211–227. [Google Scholar] [CrossRef] [PubMed]
  21. Boneh, U.; Biton, I.; Schwartz, A.; Ben-Ari, G. Characterization of the ABA signal transduction pathway in Vitis vinifera. Plant Sci. 2012, 187, 89–96. [Google Scholar] [CrossRef] [PubMed]
  22. Huang, Z.; Tang, J.; Duan, W.; Wang, Z.; Song, X.; Hou, X. Molecular evolution, characterization, and expression analysis of SnRK2 gene family in Pak-choi (Brassica rapa ssp. chinensis). Front. Plant Sci. 2015, 6, 879. [Google Scholar] [CrossRef] [PubMed]
  23. Liu, Z.; Ge, X.; Yang, Z.; Zhang, C.; Zhao, G.; Chen, E.; Liu, J.; Zhang, X.; Li, F. Genome-wide identification and characterization of SnRK2 gene family in cotton (Gossypium hirsutum L.). BMC Genet. 2017, 18, 54. [Google Scholar] [CrossRef] [PubMed]
  24. Kulik, A.; Wawer, I.; Krzywinska, E.; Bucholc, M.; Dobrowolska, G. SnRK2 protein kinases—Key regulators of plant response to abiotic stresses. OMICS 2011, 15, 859–872. [Google Scholar] [CrossRef] [PubMed]
  25. Ma, Y.; Szostkiewicz, I.; Korte, A.; Moes, D.; Yang, Y.; Christmann, A.; Grill, E. Regulators of PP2C phosphatase activity function as abscisic acid sensors. Science 2009, 324, 1064–1068. [Google Scholar] [CrossRef] [PubMed]
  26. Soon, F.F.; Ng, L.M.; Zhou, X.E.; West, G.M.; Kovach, A.; Tan, M.H.; Suino-Powell, K.M.; He, Y.; Xu, Y.; Chalmers, M.J.; et al. Molecular mimicry regulates ABA signaling by SnRK2 kinases and PP2C phosphatases. Science 2012, 335, 85–88. [Google Scholar] [CrossRef] [PubMed]
  27. Nakashima, K.; Fujita, Y.; Kanamori, N.; Katagiri, T.; Umezawa, T.; Kidokoro, S.; Maruyama, K.; Yoshida, T.; Ishiyama, K.; Kobayashi, M.; et al. Three arabidopsis SnRK2 protein kinases, SRK2D/SnRK2.2, SRK2E/SnRK2.6/OST1 and SRK2I/SnRK2.3, involved in ABA signaling are essential for the control of seed development and dormancy. Plant Cell Physiol. 2009, 50, 1345–1363. [Google Scholar] [CrossRef] [PubMed]
  28. Fujii, H.; Zhu, J.K. Arabidopsis mutant deficient in 3 abscisic acid-activated protein kinases reveals critical roles in growth, reproduction, and stress. Proc. Natl. Acad. Sci. USA 2009, 106, 8380–8385. [Google Scholar] [CrossRef] [PubMed]
  29. Wang, P.; Xue, L.; Batelli, G.; Lee, S.; Hou, Y.J.; van Oosten, M.J.; Zhang, H.; Tao, W.A.; Zhu, J.K. Quantitative phosphoproteomics identifies SnRK2 protein kinase substrates and reveals the effectors of abscisic acid action. Proc. Natl. Acad. Sci. USA 2013, 110, 11205–11210. [Google Scholar] [CrossRef] [PubMed]
  30. Umezawa, T.; Sugiyama, N.; Takahashi, F.; Anderson, J.C.; Ishihama, Y.; Peck, S.C.; Shinozaki, K. Genetics and phosphoproteomics reveal a protein phosphorylation network in the abscisic acid signaling pathway in Arabidopsis thaliana. Sci. Signal. 2013, 6, rs8. [Google Scholar] [CrossRef] [PubMed]
  31. Yoshida, R.; Umezawa, T.; Mizoguchi, T.; Takahashi, S.; Takahashi, F.; Shinozaki, K. The regulatory domain of SRK2E/OST1/SnRK2.6 interacts with ABI1 and integrates abscisic acid (ABA) and osmotic stress signals controlling stomatal closure in Arabidopsis. J. Biol. Chem. 2006, 281, 5310–5318. [Google Scholar] [CrossRef] [PubMed]
  32. Umezawa, T.; Yoshida, R.; Maruyama, K.; Yamaguchi-Shinozaki, K.; Shinozaki, K. SRK2C, a SNF1-related protein kinase 2, improves drought tolerance by controlling stress-response gene expression in Arabidopsis thaliana. Proc. Natl. Acad. Sci. USA 2004, 101, 17306–17311. [Google Scholar] [CrossRef] [PubMed]
  33. Chae, M.J.; Lee, J.S.; Nam, M.H.; Cho, K.; Hong, J.Y.; Yi, S.A.; Suh, S.C.; Yoon, I.S. A rice dehydration-inducible SNF1-related protein kinase 2 phosphorylates an abscisic acid responsive element-binding factor and associates with ABA signaling. Plant Mol. Biol. 2007, 63, 151–169. [Google Scholar] [CrossRef] [PubMed]
  34. Yoon, H.W.; Kim, M.C.; Shin, P.G.; Kim, J.S.; Kim, C.Y.; Lee, S.Y.; Hwang, I.; Bahk, J.D.; Hong, J.C.; Han, C.; et al. Differential expression of two functional serine/threonine protein kinases from soybean that have an unusual acidic domain at the carboxy terminus. Mol. Gen. Genet. 1997, 255, 359–371. [Google Scholar] [CrossRef] [PubMed]
  35. Monks, D.E.; Aghoram, K.; Courtney, P.D.; DeWald, D.B.; Dewey, R.E. Hyperosmotic stress induces the rapid phosphorylation of a soybean phosphatidylinositol transfer protein homolog through activation of the protein kinases SPK1 and SPK2. Plant Cell 2001, 13, 1205–1219. [Google Scholar] [CrossRef] [PubMed]
  36. Schmutz, J.; Cannon, S.B.; Schlueter, J.; Ma, J.; Mitros, T.; Nelson, W.; Hyten, D.L.; Song, Q.; Thelen, J.J.; Cheng, J.; et al. Genome sequence of the palaeopolyploid soybean. Nature 2010, 463, 178–183. [Google Scholar] [CrossRef] [PubMed]
  37. Umezawa, T.; Nakashima, K.; Miyakawa, T.; Kuromori, T.; Tanokura, M.; Shinozaki, K.; Yamaguchi-Shinozaki, K. Molecular basis of the core regulatory network in ABA responses: Sensing, signaling and transport. Plant Cell Physiol. 2010, 51, 1821–1839. [Google Scholar] [CrossRef] [PubMed]
  38. Fujii, H.; Zhu, J.K. Osmotic stress signaling via protein kinases. Cell Mol. Life Sci. 2012, 69, 3165–3173. [Google Scholar] [CrossRef] [PubMed]
  39. Umezawa, T.; Sugiyama, N.; Mizoguchi, M.; Hayashi, S.; Myouga, F.; Yamaguchi-Shinozaki, K.; Ishihama, Y.; Hirayama, T.; Shinozaki, K. Type 2C protein phosphatases directly regulate abscisic acid-activated protein kinases in Arabidopsis. Proc. Natl. Acad. Sci. USA 2009, 106, 17588–17593. [Google Scholar] [CrossRef] [PubMed]
  40. Lin, Q.B.; Wu, F.Q.; Sheng, P.K.; Zhang, Z.; Zhang, X.; Guo, X.P.; Wang, J.L.; Cheng, Z.J.; Wang, J.; Wang, H.Y.; et al. The SnRK2-APC/CTE regulatory module mediates the antagonistic action of gibberellic acid and abscisic acid pathways. Nat. Commun. 2015, 6, 7981. [Google Scholar] [CrossRef] [PubMed]
  41. Park, S-Y.; Fung, P.; Nishimura, N.; Jensen, D.R.; Fujii, H.; Zhao, Y.; Lumba, S.; Santiago, J.; Rodrigues, A.; Chow, T.F.; et al. Abscisic acid inhibits type 2C protein phosphatases via the PYR/PYL family of START proteins. Science 2009, 324, 1068–1071. [Google Scholar] [CrossRef] [PubMed]
  42. Hotta, H.; Aoki, N.; Matsuda, T.; Adachi, T. Molecular analysis of a novel protein kinase in maturing rice seed. Gene 1998, 213, 47–54. [Google Scholar] [CrossRef]
  43. Xu, M.R.; Huang, L.Y.; Zhang, F.; Zhu, L.H.; Zhou, Y.L.; Li, Z.K. Genome-wide phylogenetic analysis of stress-activated protein kinase genes in rice (OsSAPKs) and expression profiling in response to Xanthomonas oryzae pv. oryzicola infection. Plant Mol. Biol. Rep. 2013, 31, 877. [Google Scholar] [CrossRef]
  44. Fujita, Y.; Yoshida, T.; Yamaguchi-Shinozaki, K. Pivotal role of the AREB/ABF-SnRK2 pathway in ABRE-mediated transcription in response to osmotic stress in plants. Physiol. Plant 2013, 147, 15–27. [Google Scholar] [CrossRef] [PubMed]
  45. Fujii, H.; Verslues, P.E.; Zhu, J.K. Identification of two protein kinases required for abscisic acid regulation of seed germination, root growth, and gene expression in Arabidopsis. Plant Cell 2007, 19, 485–494. [Google Scholar] [CrossRef] [PubMed]
  46. Zheng, Z.; Xu, X.; Crosley, R.A.; Greenwalt, S.A.; Sun, Y.; Blakeslee, B.; Wang, L.; Ni, W.; Sopko, M.S.; Yao, C.; et al. The protein kinase SnRK2.6 mediates the regulation of sucrose metabolism and plant growth in Arabidopsis. Plant Physiol. 2010, 153, 99–113. [Google Scholar] [CrossRef] [PubMed]
  47. Akiyama, K.; Matsuzaki, K.; Hayashi, H. Plant sesquiterpenes induce hyphal branching in arbuscular mycorrhizal fungi. Nature 2005, 435, 824–827. [Google Scholar] [CrossRef] [PubMed]
  48. Levine, M.; Davidson, E.H. Gene regulatory networks for development. Proc. Natl. Acad. Sci. USA 2005, 102, 4936–4942. [Google Scholar] [CrossRef] [PubMed]
  49. Birney, E.; Clamp, M.; Durbin, R. GeneWise and genomewise. Genome Res. 2004, 14, 988–995. [Google Scholar] [CrossRef] [PubMed]
  50. Rombauts, S.; Déhais, P.; Van Montagu, M.; Rouzé, P. PlantCARE, a plant cis-acting regulatory element database. Nucleic Acids Res. 1999, 27, 295–296. [Google Scholar] [CrossRef] [PubMed]
  51. Edgar, R.C. MUSCLE: Multiple sequence alignment with high accuracy and high throughput. Nucleic Acids Res. 2004, 32, 1792–1797. [Google Scholar] [CrossRef] [PubMed]
  52. Tamura, K.; Peterson, D.; Peterson, N.; Stecher, G.; Nei, M.; Kumar, S. MEGA5: Molecular evolutionary genetics analysis using maximum likelihood, evolutionary distance, and maximum parsimony methods. Mol. Biol. Evol. 2011, 28, 2731–2739. [Google Scholar] [CrossRef] [PubMed]
  53. Shen, Y.; Zhou, Z.; Wang, Z.; Li, W.; Fang, C.; Wu, M.; Ma, Y.; Liu, T.; Kong, L.A.; Peng, D.L.; et al. Global dissection of alternative splicing in paleopolyploid soybean. Plant Cell 2014, 26, 996–1008. [Google Scholar] [CrossRef] [PubMed]
  54. Kim, D.; Pertea, G.; Trapnell, C.; Pimentel, H.; Kelley, R.; Salzberg, S.L. TopHat2: Accurate alignment of transcriptomes in the presence of insertions, deletions and gene fusions. Genome Biol. 2013, 14, R36. [Google Scholar] [CrossRef] [PubMed] [Green Version]
  55. Shannon, P.; Markiel, A.; Ozier, O.; Baliga, N.S.; Wang, J.T.; Ramage, D.; Amin, N.; Schwikowski, B.; Ideker, T. Cytoscape: A software environment for integrated models of biomolecular interaction networks. Genome Res. 2003, 13, 2498–2504. [Google Scholar] [CrossRef] [PubMed]
Figure 1. Gene structure of GmSnRK2 genes. Introns are represented by black lines. Exons are represented by blue wedges. 5′ and 3′ untranslated regions (UTRs) are represented by green boxes. The intron phase is labeled above each intron. The scale of gene length is given at the bottom. CDS: Coding sequence.
Ijms 18 01834 g001
Figure 2. Phylogenetic tree and protein motif analysis of GmSnRK2s. (a) Phylogenetic tree of SnRK2s of Arabidopsis thaliana, Oryza sativa and soybean was constructed by the Neighbor-Joining (NJ) method using MEGA5 software (version 5.1 β, Hachioji, Tokyo, Japan). Group 1, Group 2, Group 3 and Group 4 are marked as purple, blue, red and yellow, respectively. Soybean, Arabidopsis thaliana and Oryza sativa SnRK2s are represented by black circle, square and triangle, respectively; (b) protein motifs of GmSnRK2s, AtSnRK2s and OsSnRK2s profiled by MEME (version 4.12.0, Seattle, WA, USA). The 20 conserved motifs are represented by colored boxes at the bottom. The scale of protein length is given below the schematic diagram.
Ijms 18 01834 g002
Figure 3. Expression analysis of GmSnRK2s during growth and development of different tissues of soybean. The RNA sequencing (RNA-Seq) dataset of 28 tissues of soybean collected from different development stages were obtained from the National Center for Biotechnology Information (accession number: SRP038111) to generate heatmap. The color scale indicating Z-score value is given below. Group 1, Group 2, Group 3 and Group 4 are marked as purple, blue, red and yellow circles, respectively. The different stages are marked by vertical black lines.
Ijms 18 01834 g003
Figure 4. Expression analysis of the GmSnRK2s under salt, abscisic acid (ABA) and strigolactones (SLs) treatments. Heatmaps showed the expression patterns in quantitative real time polymerase chain reaction (qRT-PCR) experiments for the 22 GmSnRK2 genes under the treatments of NaCl, ABA and rac-GR24. The transcript levels of the GmSnRK2s were normalized against GmSKIP transcript levels using 2−ΔΔCt. The clustered heatmaps was generated in R using the pheatmap function package. The color scale indicating Z-score value, the Group names of GmSnRK2s and time points are shown at the right. Statistically significant differences (Student’s t-test) are indicated as follows: * p < 0.05, ** p < 0.01.
Ijms 18 01834 g004
Figure 5. Correlations and co-regulatory networks of GmSnRK2 genes during seed development. (a) Correlation analysis of GmSnRK2 genes during seed development were performed based on the Pearson correlation coefficients (PCCs) of gene pairs calculated using R package program (version 3.2.2; available online: https://cran.r-project.org/web/packages/pheatmap/). Correlations are indicated by the size and color of circles. Below bar represents the correlation values of Pearson correlation coefficients (PCCs). Red and blue colors indicate positive correlation and negative correlation, respectively. Gene names are listed at the right. Group 1, Group 2, Group 3 and Group 4 are marked as purple, blue, red, and yellow circles, respectively. Black star represents the correlation with p-value ≤ 0.05; (b) co-regulatory network of GmSnRK2s during seed development was illustrated by Cytoscape (version 3.1, Seattle, WA, USA). The significant PCCs of gene pairs (p-value ≤ 0.05) are included, and the different correlation levels of gene pairs are marked by edge lines with different colors, as showed below the co-regulatory networks.
Ijms 18 01834 g005
Figure 6. Correlations and co-regulatory networks of GmSnRK2 genes under ABA treatment. (a) Correlation analysis of GmSnRK2 genes under ABA treatments were performed based on the PCCs of gene pairs calculated using R package program. Correlations were indicated by the size and color of circles. Below bar represented the correlation values of PCCs. Red and blue indicate positive correlation and negative correlation, respectively. Gene name was listed at the right. Group 1, Group 2, Group 3 and Group 4 were marked as purple, blue, red and yellow circles, respectively. Black star represented the correlation with p-value ≤ 0.05; (b) co-regulatory network of GmSnRK2s under ABA treatment was illustrated by Cytoscape. The significant PCCs of gene pairs (p-value ≤ 0.05) were included, and the different correlation levels of gene pairs were marked by edge line with different colors as showed below the co-regulatory networks.
Ijms 18 01834 g006
Table 1. Soybean SnRK2 gene family.
Gene NameLocus NameGene Location 1Transcript Length (bp)Protein Length (aa)Molecular Weight (kDa)Isoelectric Point (pI)Grand Average of Hydropathy (GRAVY)Best Hits of Arabidopsis and RiceDomain (Start–End aa) 2
GmSnRK2.1Glyma01g39020Chr01:50978690–50990291: −205635940.834.69−0.245AtSRK2I; OsSAPK10IPR017441 (27–50); IPR008271 (136–148)
GmSnRK2.2Glyma01g41260 (SPK1)Chr01:52822191–52826139: +143233938.566.44−0.432AtSRK2E; OsSAPK3IPR017441 (11–34); IPR008271 (120–132)
GmSnRK2.3Glyma02g15330Chr02:13828174–13832341: +181335440.215.04−0.359AtSRK2E; OsSAPK10IPR017441 (24–47); IPR008271 (133–145)
GmSnRK2.4Glyma02g37090Chr02:42422548–42426147: −157733838.35.38−0.267AtSRK2C; OsSAPK2IPR017441 (10–33); IPR008271 (119–131)
GmSnRK2.5Glyma04g38270 (SPK4)Chr04:44680353–44684054: +176334940.356.1−0.497AtSRK2A; OsSAPK7IPR017441 (10–33); IPR008271 (119–131)
GmSnRK2.6Glyma05g31000Chr05:36237913–36240990: +137630935.375.17−0.366AtSRK2C; OsSAPK2IPR017441 (10–33); IPR008271 (85–97)
GmSnRK2.7Glyma05g33170Chr05:37897658–37901759: −202035140.435.95−0.523AtSRK2A; OsSAPK7IPR017441 (10–33); IPR008271 (119–131)
GmSnRK2.8Glyma05g05540Chr05:4967484–4972474: −153233638.125.6−0.447AtSRK2E; OsSAPK3IPR017441 (11–34); IPR008271 (120–132)
GmSnRK2.9Glyma05g09460Chr05:9361881–9367360: −192236040.84.75−0.268AtSRK2I; OsSAPK10IPR017441 (29–52); IPR008271 (138–150)
GmSnRK2.10Glyma06g16780Chr06:13183468–13187110: −164834639.986.48−0.468AtSRK2A; OsSAPK7IPR017441 (10–33); IPR008271 (119–131)
GmSnRK2.11Glyma07g29500Chr07:34352503–34356772: −203436441.464.93−0.334AtSRK2E; OsSAPK10IPR017441 (29–52); IPR008271 (138–150)
GmSnRK2.12Glyma07g33120Chr07:38032643–38037084: −176935340.075.04−0.344AtSRK2E; OsSAPK10IPR017441 (24–47); IPR008271 (133–145)
GmSnRK2.13Glyma08g14210Chr08:10340382–10343745: +170134539.245.15−0.3AtSRK2E; OsSAPK1IPR017441 (10–33); IPR008271 (119–131)
GmSnRK2.14Glyma08g20090Chr08:15173104–15177102: −195935240.266.1−0.486AtSRK2B; OsSAPK7IPR017441 (10–33); IPR008271 (119–131)
GmSnRK2.15Glyma08g00770 (SPK3)Chr08:400210–404391: −207635140.395.75−0.529AtSRK2A; OsSAPK7IPR017441 (10–33); IPR008271 (119–131)
GmSnRK2.16Glyma11g04150 (SPK2)Chr11:2759687–2763609: −158533938.666.39−0.45AtSRK2E; OsSAPK3IPR017441 (11–34); IPR008271 (120–132)
GmSnRK2.17Glyma11g06250Chr11:4436484–4443383: +221135940.784.68−0.234AtSRK2I; OsSAPK10IPR017441 (27–50); IPR008271 (136–148)
GmSnRK2.18Glyma12g29130Chr12:32505082–32508220: +171935941.085.82−0.537AtSRK2B; OsSAPK7IPR017441 (10–33); IPR008271 (119–131)
GmSnRK2.19Glyma14g35380Chr14:44313521–44317470: −183133838.185.38−0.251AtSRK2C; OsSAPK1IPR017441 (10–33); IPR008271 (119–131)
GmSnRK2.20Glyma17g15860Chr17:12585658–12589679: −140533638.045.71−0.46AtSRK2E; OsSAPK3IPR017441 (11–34); IPR008271 (120–132)
GmSnRK2.21Glyma17g20610Chr17:19751156–19756370: +179636040.914.75−0.273AtSRK2I; OsSAPK10IPR017441 (29–52); IPR008271 (138–150)
GmSnRK2.22Glyma20g01240Chr20:846957–851473: −206436441.494.89−0.344AtSRK2E; OsSAPK10IPR017441 (29–52); IPR008271 (138–150)
1 Chromosome:start position–end position: strand, (–) means antisense strand of chromosome; (+) means positive-sense strand of chromosome. 2 Protein kinase, adenosine triphosphate (ATP) binding site (IPR017441); Serine/threonine-protein kinase, active site (IPR008271). bp: base pair; aa: amino acid.
Table 2. Phytohormone response elements in the promoters of GmSnRK2s.
GroupGene NameCis ElementsNumberSequence Pattern (5′-3′)Position (Strand)Function
Group 1GmSnRK2.5CGTCA-motif1CGTCA−410 bp (−)MeJA Response Element
ERE3ATTTCAAA−526 bp (−); −911 bp (+); −750 bp (+)Ethylene Response element
P-box2CCTTTTG; GCCTTTTGAGT−68 bp (−); −308 bp (−)Gibberellin Response Element
TGACG-motif1TGACG−410 bp (+)MeJA Response Element
GmSnRK2.7CGTCA-motif2CGTCA−717 bp (−); −834 bp (−)MeJA Response Element
TGACG-motif2TGACG−717 bp (+); −834 bp (+)MeJA Response Element
GARE-motif1TCTGTTG−293 bp (−)Gibberellin Response Element
TCA-element1CCATCTTTTT−1412 bp (−)Salicylic acid Response Element
TGA-element2AACGAC−836 bp (−); −1438 bp (+)Auxin Response Element
GmSnRK2.10ERE1ATTTCAAA−359 bp (−)Ethylene Response element
GmSnRK2.14ERE1ATTTCAAA−211 bp (+)Ethylene Response element
TATC-box1TATCCCA−1289 bp (−)Gibberellin Response Element
GmSnRK2.15AuxRR-core1GGTCCAT−1409 bp (−)Auxin Response Element
ERE1ATTTCAAA−972 bp (−)Ethylene Response element
TGA-element1AACGAC−559 bp (+)Auxin Response Element
GmSnRK2.18ABRE1TACGTG−516 bp (+)ABA Response Element
CGTCA-motif1CGTCA−1228 bp (−)MeJA Response Element
TGACG-motif1TGACG−1228 bp (+)MeJA Response Element
ERE2ATTTCAAA−394 bp (+); −628 bp (+)Ethylene Response element
TCA-element2GAGAAGAATA; CCATCTTTTT−325 bp (−); −377 bp (+)Salicylic acid Response Element
TGA-element1AACGAC−837 bp (+)Auxin Response Element
Group 2GmSnRK2.4ABRE1CACGTG−1258 bp (−)ABA Response Element
GARE-motif1AAACAGA−1347 bp (−)Gibberellin Response Element
GmSnRK2.6GARE-motif1AAACAGA−314 bp (+)Gibberellin Response Element
TCA-element3CAGAAAAGGA; CCATCTTTTT; CAGAAAAGGA−317 bp (+); −1352 bp (−); −564 bp (+)Salicylic acid Response Element
GmSnRK2.13ABRE2GACACGTGGC; TACGTG−657 bp (−); −1212 bp (−)ABA Response Element
ERE2ATTTCAAA−99 bp (−); −1336 bp (+)Ethylene Response element
P-box1GCCTTTTGAGT−510 bp (+)Gibberellin Response Element
TGA-element1AACGAC−84 bp (+)Auxin Response Element
GmSnRK2.19ABRE1CACGTG−1401 bp (−)ABA Response Element
GARE-motif1AAACAGA−1483 bp (−)Gibberellin Response Element
Group 3GmSnRK2.1ABRE1TACGTG−79 bp (+)ABA Response Element
AuxRR-core1GGTCCAT−1158 bp (−)Auxin Response Element
P-box1CCTTTTG−115 bp (−)Gibberellin Response Element
TCA-element2CCATCTTTTT; GAGAAGAATA−164 bp (−); −412 bp (−)Salicylic acid Response Element
GmSnRK2.3CGTCA-motif3CGTCA−261 bp (+); −1314 bp (+); −295 bp (+)MeJA Response Element
TGACG-motif3TGACG−261 bp (−); −1314 bp (−); −295 bp (−)MeJA Response Element
ERE1ATTTCAAA−481 bp (−)Ethylene Response element
GARE-motif1AAACAGA−62 bp (+)Gibberellin Response Element
P-box1CCTTTTG−1451 bp (−)Gibberellin Response Element
TCA-element1GAGAAGAATA−934 bp (+)Salicylic acid Response Element
GmSnRK2.9ABRE1CCGCGTAGGC−1360 bp (−)ABA Response Element
CGTCA-motif1CGTCA−1386 bp (+)MeJA Response Element
ERE1ATTTCAAA−334 bp (−)Ethylene Response element
GARE-motif1AAACAGA−403 bp (−)Gibberellin Response Element
GmSnRK2.11TCA-element2CCATCTTTTT−1352 bp (+); −1469 bp (−)Salicylic acid Response Element
GmSnRK2.12ABRE2CACGTG; TACGTG−538 bp (+); −1147 bp (−)ABA Response Element
AuxRR-core1GGTCCAT−1345 bp (+)Auxin Response Element
CGTCA-motif2CGTCA−117 bp (+); −1361 bp (+)MeJA Response Element
TGACG-motif2TGACG−117 bp (−); −1361 bp (−)MeJA Response Element
TCA-element2CCATCTTTTT−98 bp (−); −710 bp (+)Salicylic acid Response Element
GmSnRK2.17ABRE2CACGTG; AGTACGTGGC−207 bp (+); −410 bp (−)ABA Response Element
AuxRR-core1GGTCCAT−981 bp (−)Auxin Response Element
ERE1ATTTCAAA−371 bp (−)Ethylene Response element
GARE-motif1AAACAGA−126 bp (−)Gibberellin Response Element
TATC-box1TATCCCA−1305 bp (+)Gibberellin Response Element
TCA-element1CCATCTTTTT−780 bp (+)Salicylic acid Response Element
GmSnRK2.21ABRE3CCTACGTGGC; ACGTGGC; TACGTG−1349 bp (+); −1352 bp (+); −1351 bp (+)ABA Response Element
CGTCA-motif1CGTCA−1374 bp (+)MeJA Response Element
ERE1ATTTCAAA−309 bp (−)Ethylene Response element
TGACG-motif1TGACG−1374 bp (−)MeJA Response Element
GmSnRK2.22TGACG-motif1TGACG−705 bp (−)MeJA Response Element
CGTCA-motif1CGTCA−705 bp (+)MeJA Response Element
TCA-element2GAGAAGAATA; TCAGAAGAGG−425 bp (+); −792 bp (+)Salicylic acid Response Element
Group 4GmSnRK2.2CGTCA-motif1CGTCA−477 bp (−)MeJA Response Element
TGACG-motif1TGACG−477 bp (+)MeJA Response Element
TCA-element1CCATCTTTTT−82 bp (+)Salicylic acid Response Element
GmSnRK2.16CGTCA-motif1CGTCA−865 bp (−)MeJA Response Element
TGACG-motif1TGACG−865 bp (+)MeJA Response Element
TCA-element1CCATCTTTTT−449 bp (+)Salicylic acid Response Element
GmSnRK2.20GARE-motif1AAACAGA−281 bp (+)Gibberellin Response Element
MeJA: Methyl Jasmonic acid; GARE: Gibberellin response element.

