Article

Health-Promoting Effects of Thymus herba-barona, Thymus pseudolanuginosus, and Thymus caespititius Decoctions

by
Andrea F. Afonso
1,2,
Olívia R. Pereira
3,
Rodrigo T. Neto
1,
Artur M. S. Silva
1 and
Susana M. Cardoso
1,*
1
Department of Chemistry & QOPNA, University of Aveiro, 3810-193 Aveiro, Portugal
2
Public Health Laboratory of Bragança, Local Health Unit, Rua Eng. Adelino Amaro da Costa, 5300-146 Bragança, Portugal
3
Department of Diagnostic and Therapeutic Technologies, School of Health Sciences, Polytechnic Institute of Bragança, Av. D. Afonso V, 5300-121 Bragança, Portugal
*
Author to whom correspondence should be addressed.
Int. J. Mol. Sci. 2017, 18(9), 1879; https://doi.org/10.3390/ijms18091879
Submission received: 4 August 2017 / Revised: 22 August 2017 / Accepted: 26 August 2017 / Published: 31 August 2017
(This article belongs to the Section Bioactives and Nutraceuticals)

Abstract

:
Thymus herba-barona, Thymus pseudolanuginosus, and Thymus caespititius decoctions were screened for their phenolic constituents, along with their potential antioxidant, anti-inflammatory, and antibacterial activities. The total phenolic compounds in the extracts of the three plants ranged from 236.0 ± 26.6 mgGAE/g (T. caespititus) to 293.0 ± 30.5 mgGAE/g of extract (T. pseudolanuginosus), being particularly rich in caffeic acid derivatives, namely rosmarinic acid and its structural isomers, as well as flavones, such as luteolin-O-glucuronide. The T. pseudolanuginosus extract presented the best DPPH radical scavenging ability (EC50 = 10.9 ± 0.7 µg/mL), a high reducing power (EC50 = 32.2 ± 8.2 µg/mL), and effectively inhibited the oxidation of β-carotene (EC50 = 2.4 ± 0.2 µg/mL). The extracts also showed NO scavenging activity close to that of ascorbic acid, and thus might be useful as anti-inflammatory agents. In addition, they exhibited antibacterial activity against gram-negative and gram-positive bacteria. Staphylococcus aureus strains were the most sensitive bacteria to thyme extracts, with minimum inhibitory concentration and minimum bactericidal concentration values in the range of 0.6–3.5 mg/mL. Overall, this work is an important contribution for the phytochemical characterization and the potential antioxidant, anti-inflammatory, and antimicrobial activities of these three Thymus species, which have been poorly explored.

Graphical Abstract

1. Introduction

The Thymus genus encloses about 350 species, which are particularly well adapted to the hot and dry climate of the Mediterranean region and widespread in the arid parts of the Iberian Peninsula [1,2]. As for the vast majority of Lamiaceae plants, Thymus are recognized as being strongly aromatic and are widely used as spices to enhance sensory attributes such as the taste and aroma of foods [1]. These properties highlight the potential application of Thymus plants in the food industry, e.g., in meat, butter, chewing gum, liqueurs, ice cream, and candy production. Besides flavouring, their usage also improves the preservation of food, contributing to the prevention of food oxidation and color changes [3,4]. Likewise, these plants have some potential applications in pharmaceutical and cosmetic industries due to their biological and medicinal benefits. They are largely used in the manufacturing of perfumes, pharmaceutical products, and toilet articles [4,5,6,7]. Although these applications have been mostly associated with essential oils, nowadays, Thymus polar extracts are an attractive target for the screening of health-promoting properties for possible industrial applications in food, cosmetics, or pharmaceutical industries, among others [1,8].
Several authors have demonstrated that Lamiaceae, and particularly Thymus plants, are rich in bioactive phytochemicals, including phenolic acids and flavonoids [1,3,9,10], which in turn, have been shown to reduce the risk of diseases due to their extensive biological properties, including those which are antioxidant, cardioprotective, anticancer, anti-ageing, anti-inflammatory, and antibacterial [5,6,8,11].
The screening of the potential bioactive effects of Thymus polar extracts has been mainly conducted for Thymus vulgaris [12,13,14,15] and Thymus serpyllum (wild thyme) [2,16], although other species, including Thymus pulegioides [4,15], Thymus praecox [15], Thymus sipyleus [17], Thymus striatus [15], Thymus longicaulis [15], Thymus mastichina [18], have also been studied with respect to their antioxidant activities. Overall, aqueous or alcoholic extracts from Thymus have been shown to exhibit strong antioxidant activities in in vitro [17,19] or in vivo models [20]. Moreover, other effects reported in the polar extracts of thyme species include antimicrobial [21,22], antidiabetic [8,19], neuroprotective [15], and inflammatory properties [23].
In contrast to the above mentioned studies, the potential applications of the polar extracts from less-widespread Thymus like Thymus herba-barona, Thymus pseudolanuginosus, and Thymus caespititius remain unexplored. These three species are particularly known for being well-adapted to the Atlantic climate, thus growing spontaneously in the Iberian Peninsula and Mediterranean islands. As reported, their essential oils exhibit antioxidant, antimicrobial, and insecticidal effects and can potentially be used as preservatives in storage products for food flavouring, and as deodorants and disinfectants [24,25]. The present study aims to contribute to the clarification of phenolic constituents of T. herba-barona, T. pseudolanuginosus, and T. caespititius, as well as to exploit their free radical scavenging, antibacterial, and anti-inflammatory activities.

2. Results and Discussion

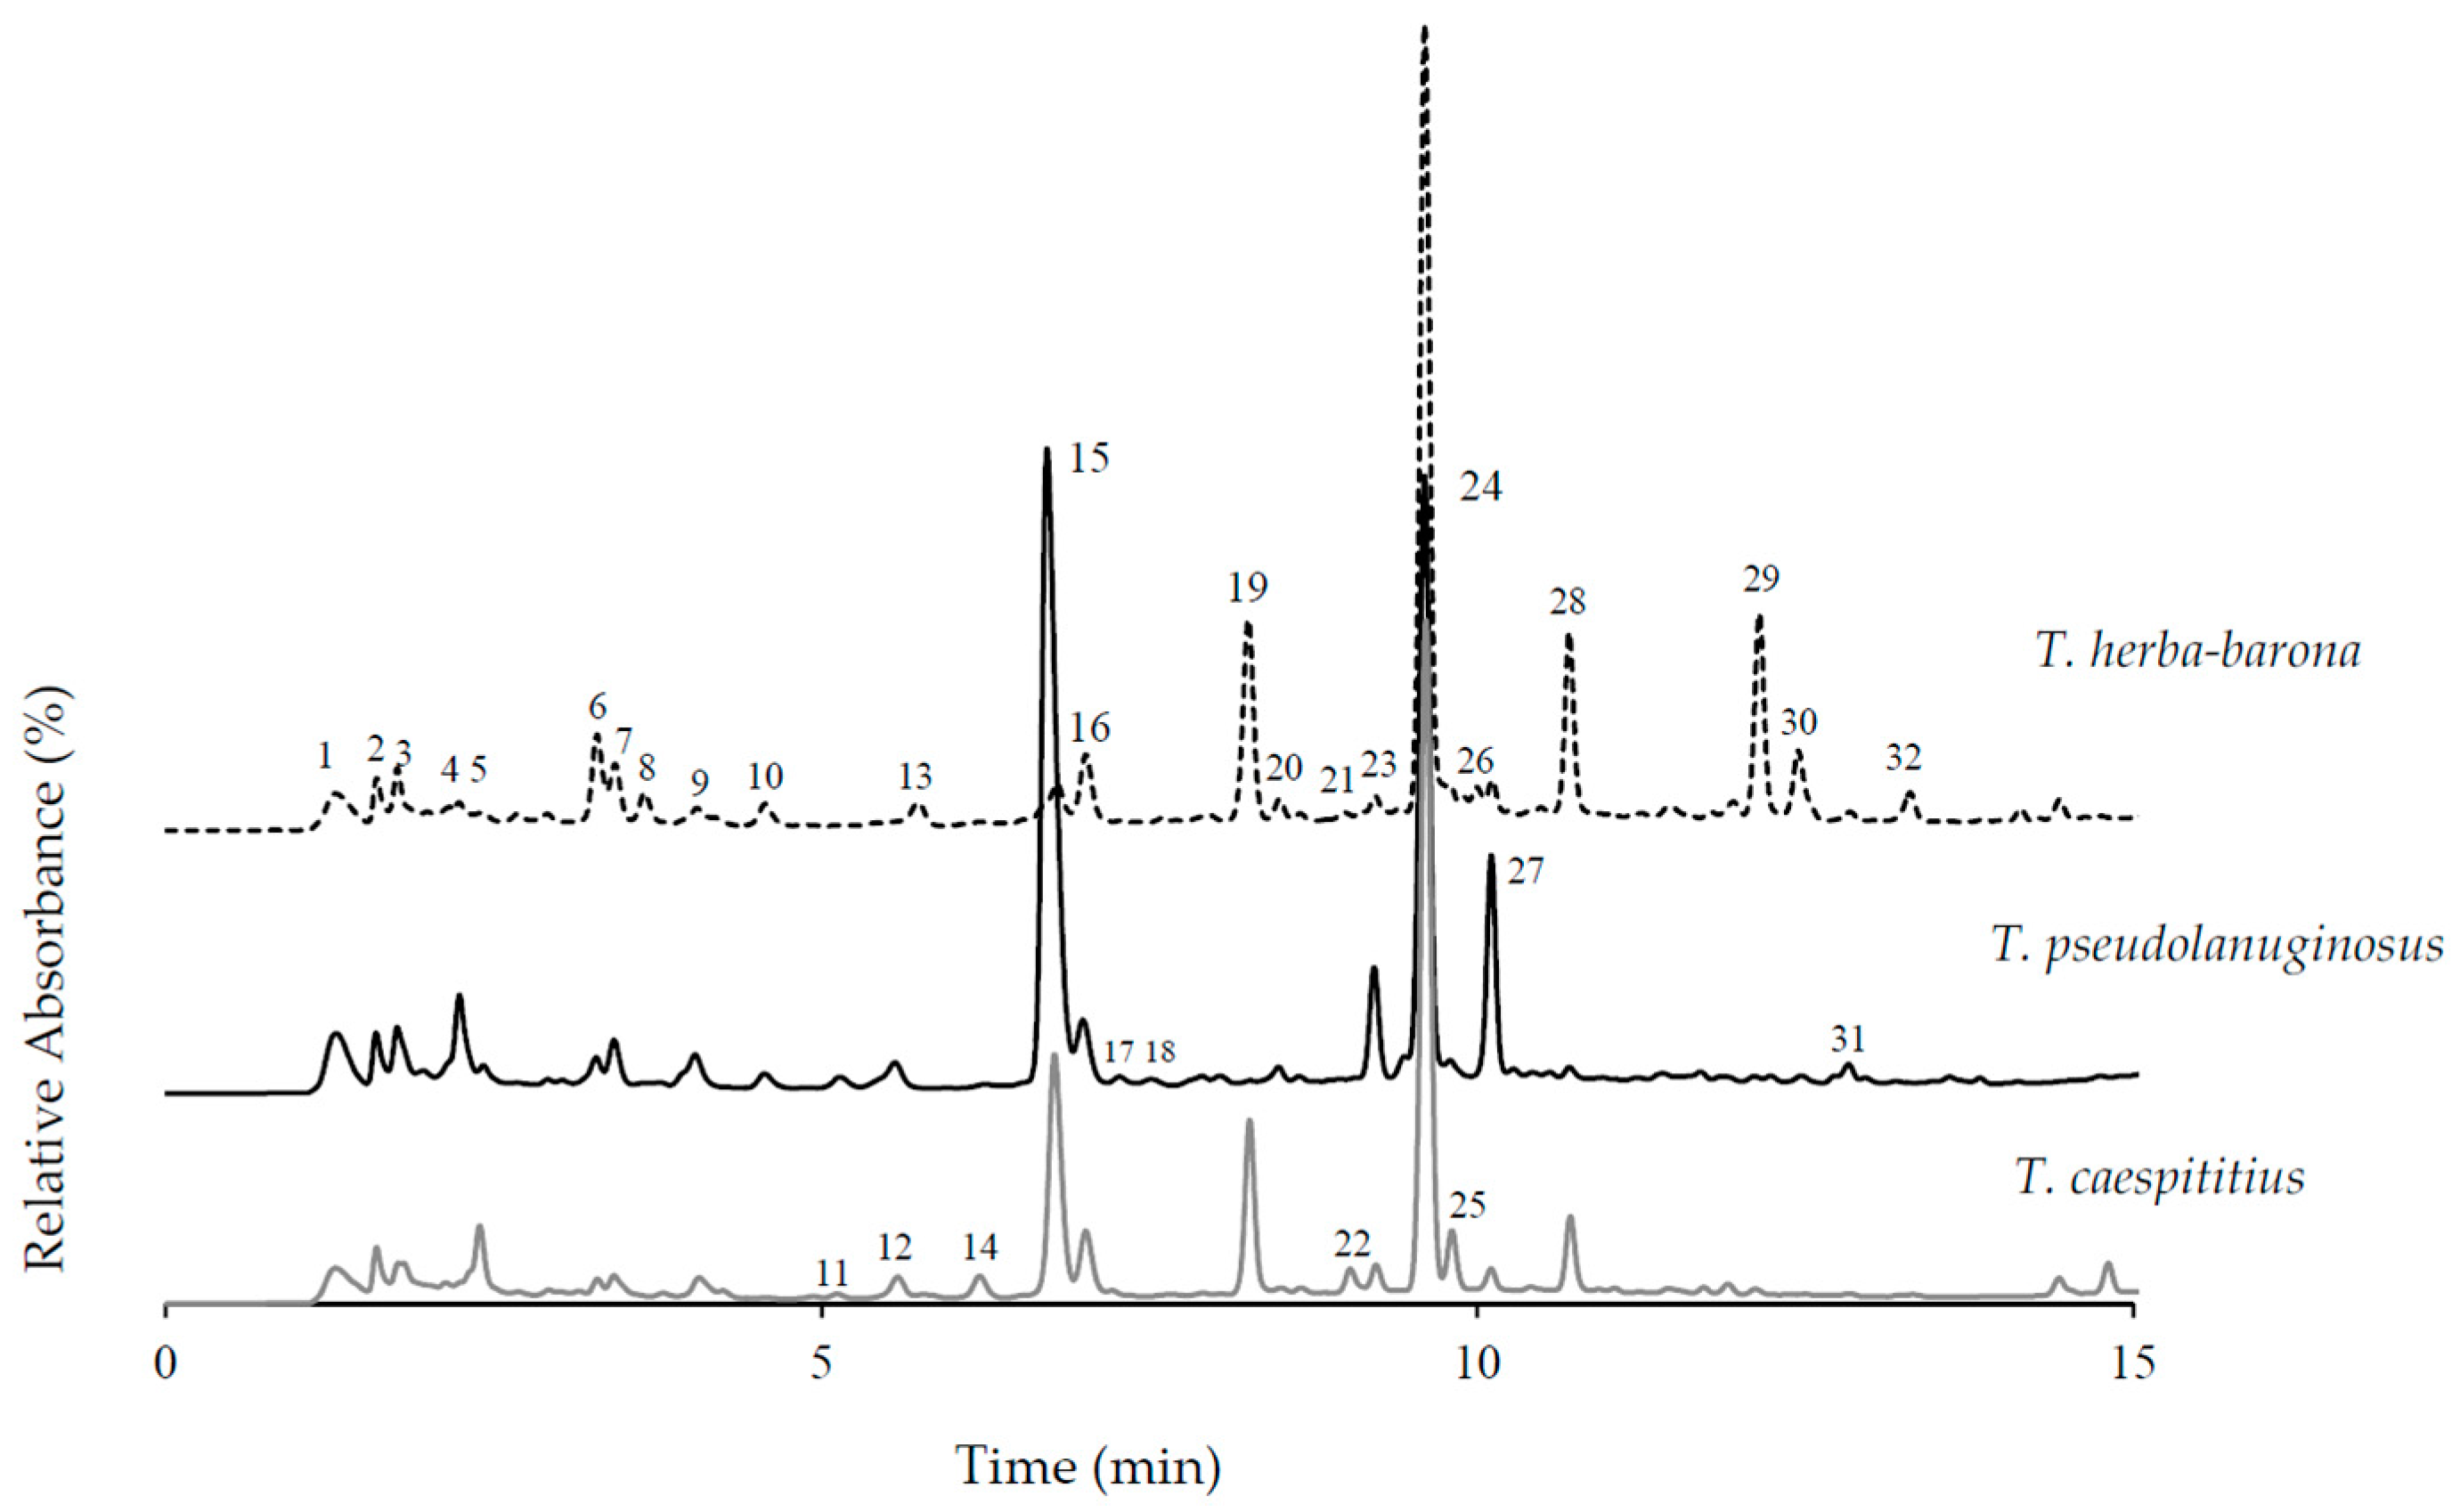
2.1. Phenolic Compounds in Thymus Aqueous Extracts

The mass yield of thyme aqueous extracts ranged from 15% to 20%, with T. caespititius being the most predominant (Table 1). In turn, the latter showed a lower total phenolic content (236 ± 26.6 mg GAE/g extract, equivalent to 47.0 mg GAE/g dry plant) in comparison to the mean values obtained for the T. herba-barona and T. pseudolanuginosus extracts (273 and 293 mg GAE/g extract or 41.6 and 49.2 mg GAE/g dry plant, respectively). However, it is important to note that these three aqueous extracts had a considerably higher total phenolic content than those found by other authors in distinct Thymus plants. In particular, aqueous extracts obtained from wild thyme (T. serpyllum) at 50 and 100ºC were found to contain 79.02 ± 6.62 and 91.07 ± 9.25 mg GAE/g extract, respectively [16], while aqueous extracts obtained from Thymus zygis leaves at 20ºC produced a 25.8 ± 2.0 mg GAE/g dry sample [3]. In addition, the phenolic content in phosphate buffer or hydromethanolic extracts from T. vulgaris were reported to account for 2.1 ± 0.1 mg GAE/g fresh leaves [26] or 19.2 ± 0.3 mg GAE/g of fresh weight [14], respectively.
Individual phenolic constituents of the three thyme aqueous extracts were elucidated by ultra high performance liquid chromatography coupled to diode array detector and an a electrospray mass spectrometer (UHPLC-DAD-ESI-MSn), taking into consideration the gathered ultraviolet-visible (UV-Vis) and mass spectrometry (MS) spectra data of the eluted chromatographic peaks (Figure 1, Table 2) and in comparison to those of standard compounds and/or in comparison to literature data.
Note that despite the fact that Thymus plants are generally known for their richness in rosmarinic acid [1], the specific phenolic composition of thyme extracts is dependent on several factors, including the botanical species and the applied extraction conditions. To the best of our knowledge, there is no reported literature regarding the phenolic composition of T. herba-barona, T. pseudolanuginosus, and T. caespititius extracts.
Rosmarinic acid was a major phenolic component in the three thyme extracts, accounting for 55.8 ± 2.8 mg/g in T. herba-barona and 40.2 ± 0.9 and 43.2 ± 3.2 mg/g in T. pseudolanuginosus and T. caespititius, respectively. Despite the common abundance, rosmarinic acid was clearly less representative in the T. pseudolanuginosus extract (30% of total quantified phenolics) in comparison to the other two, in which it amounted for 45–52% of the total quantified phenolics. This difference was mainly due to the high abundance of luteolin-O-glucuronide (6.8 min, [M − H] at m/z 461→285) in the T. pseudolanuginosus extract, which accounted for 54.1 ± 0.6 mg/g, while its levels were only 17.3 ± 1.1 mg/g and 4.4 ± 0.02 mg/g in the T. caespititius and T. herba-barona extracts, respectively. Globally, the two O-glucuronide derivatives of luteolin eluted in fractions 15 and 16 (RT 6.8 and 7.0 min respectively) in the T. pseudolanuginosus extract accounted for 61.2 mg/g of the extract and represented 46% of its total phenolics. This caused a clear differentiation between the extracts, with T. pseudolanuginosus phenolic components being mainly represented by flavones. Note that O-glucuronide derivatives of luteolin and other flavone glycosides such as luteolin-C-glucoside, apigenin-O-glucuronide and apigenin-O-glucoside herein detected have also been previously described for other Thymus species, but still, their levels, particularly those of luteolin-O-glucuronide derivatives, are higher in T. pseudolanuginosus than in previously reported data (8–14 mg/g of dry plant) [1,17,27].
Apart from rosmarinic acid, the remaining caffeic acid derivatives represented 8%, 13%, and 34% of the total quantified phenolic compounds in T. caespititius, T. pseudolanuginosus, and T. herba-barona extracts, respectively. Among the three plant species, the latter was clearly the richest in this group of compounds, comprising simple compounds, namely caffeic acid (4.3 ± 0.1 mg/g extract) and t-5-O-CQA (in vestigial concentrations), as well as several depsides (Table 2), namely 3′-O-(8″-Z-caffeoyl)rosmarinic acid (a compound previously described in other thyme species [28]) and/or its isomers (MW 538 Da, fractions 25, 28 and 32), together with dihydro-salvianolic acid B (fraction 19; MW 716 Da). On the other hand, salvianolic acids K (fraction 27, [M − H] at m/z 555 → 493 → 359) and B (fraction 19, [M − H] at m/z 717 → 519 → 475) were found in the T. pseudolanuginosus and T. caespititius extracts, with levels of 10.5 ± 0.1 and 6.9 ± 0.5 mg/g of the extract, respectively.

2.2. Antioxidant Capacity

The overproduction of oxidants is responsible for the pathogenesis of many chronic diseases. In turn, distinct phytochemicals from foods and medicinal plants exhibit antioxidant properties that might be beneficial to counteract oxidative events [11]. In this context, the three Thymus aqueous extracts were investigated for their antioxidant abilities through distinct in vitro methods, namely DPPH, reducing power and β-carotene bleaching assays. The DPPH scavenging method evaluates the free radical scavenging ability of the plant extracts to trap the synthetic free radicals DPPH, while the reducing power and β-carotene bleaching methods measure the extract’s ability to reduce Fe3+ to Fe2+ or to inhibit lipidic peroxidation, respectively.
The antioxidant potentialities of T. herba-barona, T. pseudolanuginosus, and T. caespititius aqueous extracts are detailed in Table 1, in terms of their EC50 values. Considering the results, one can conclude that all three Thymus extracts showed a high antioxidant capacity, which was particularly evident in the DPPH and reducing power tests, for which the EC50 values are 1.6–2.0 higher than those of the reference commercial compounds. Among the three extracts, there is a tendency for the better activity of T. pseudolanuginosus (EC50 of 10.9 ± 0.7 and 32.2 ± 8.2 µg/mL for DPPH and reducing power tests, respectively), although differences are not statistically significant.
The high antioxidant ability herein reported is in accordance with the literature data found for Thymus plants. Indeed, low DPPH EC50 values were previously registered for T. serpyllum L. aqueous extracts (EC50 of 13.75 ± 1.14 and 11.76 ± 0.25 µg/mL for extracts obtained at 50 and 100 °C, respectively) [16] and for the ethanolic extracts from T. longicaulis, T. praecox, T. pulegioides, T. serpyllum, T. striatus, and T. vulgaris, which exhibited DPPH EC50 values in the range of 3.01–6.01 µg/mL, i.e., 1.8–3.6 higher than those of the reference commercial compounds [15]. Less promising results were previously reported for Thymus capitatus methanolic and hexane extracts, with EC50 = 44.5 ± 1.9 and 38.2 ± 1.2 µg/mL, respectively (eight to nine times less active than the positive control EC50 = 5.0 ± 0.8) [29] and for hydroalcoholic extracts from Thymus pubescens, Thymus kotschyanus, and Thymus daenensis (EC50 range between 31.47 and 48.68 µg/mL), also six to nine times less active that the positive control, i.e., galic acid [30]; for T. vulgaris and wild thyme infusions, the EC50 values were 300 and 450 µg/mL, respectively, and corresponded to a 17–25 times lower efficacy than butylated hydroxytoluene [12]. The ability of Thymus species to reduce Fe3+ to Fe2+ is not reported as often; however, Kindl et al. have reported a strong ability for ethanolic extracts from T. longicaulis, T. praecox, T. pulegioides, T. serpyllum, T. striatus, and T. vulgaris (EC50 = 11.4–15.1 µg/mL), with the best results being registered for T. pulegioides, whose EC50 was only 1.7 higher than the reference control [15].
Contrary to the results of the above antioxidant methods, the three Thymus extracts presented clear differences in the β-carotene bleaching assay. The oxidation of β-carotene was effectively inhibited by T. pseudolanuginosus (EC50 = 2.4 ± 0.2 µg/mL), followed by T. caespititius (EC50 = 6.1 ± 0.2 µg/mL), while T. herba-barona was ineffective (Table 1). Notably, literature data also point out promising activity toward the β-carotene oxidation protection from other thymes. In particular, Iauk et al. [29] described an EC50 value for a T. capitatus methanolic extract that was close to that of 0.7 ± 0.03 µg/mL in 30 min and 1.9 ± 0.6 µg/mL in 60 min. Higher values were observed for the ethanolic extracts from T. daenensis, T. kotschyanus, and T. pubescens (EC50 = 23.7, 35.2, and 92.9 µg/mL, respectively) [30].
The combined information from the three antioxidant methods, together with that from the phenolic compounds´ levels, suggests that these last constituents are not the only actors dictating the antioxidant potential of the extracts. Indeed, although phenolic compounds are abundant (particularly flavones) in the T. pseudolanuginosus extract, which can be correlated to its superior antioxidant ability in comparison to those of the remaining extracts, the direct phenolic content and antioxidant activity were not observed for those of the two remaining plant species in the β-carotene bleaching assay. This phenomenon could be due to the presence of oxidative—inducer components in the T. herba-barona extract, thus mitigating the activity of the antioxidant phenolic compounds.

2.3. Anti-Inflammatory Activity

Because of the major relevance of inflammatory processes in the onset of numerous diseases (cancer, Alzheimer, heart failure, ischemic stroke, and others), the search for low-toxic natural extracts able to counteract pivotal inflammatory players has increased dramatically in the last years [31,32]. The aqueous extracts from the three plant species were screened for their ability to counteract two key inflammatory events, namely the increment of NO (i.e., a main proinflammatory mediator produced by macrofages) and lipoxygenase (LOX) activity (i.e., the enzyme that controls the production of proinflammatory leukotrienes) [7,33]. As detailed in Table 1, all the extracts revealed a high NO scavenging ability. Curiously, this effect was more evident for T. caespititius, which exhibited the same potency as ascorbic acid (EC50 of 229.7 ± 21.5 µg/mL and 228.0 ± 20.7 µg/mL, respectively). Despite having a low ability to inhibit LOX activity, T. caespetitius was also the most relevant amongst the three samples (EC50 = 590.5 ± 166.3 µg/mL). Hence, the gathered results suggest that Thymus aqueous extracts of the selected plants might have potential applications as anti-inflammatory agents, acting through anti-radical capacities towards NO. The fact that this ability is not directly associated the extracts´ phenolic content (T. caespititius extract was the less rich in phenolics) also suggests that non-phenolic compounds can have major roles in this action. To our knowledge, the NO scavenging ability of Thymus polar extracts has only been previously reported for ethanolic extracts of six Thymus species: T. serpyllum subsp. serpyllum (EC50 = 176.6 ± 8.1 µg/mL), T. praecox subsp. polytrichus (EC50 = 139.0 ± 5.7 µg/mL), T. vulgaris (EC50 = 97.9 ± 2.9 µg/mL), T. striatus (EC50 = 91.1 ± 5.3 µg/mL), T. longicaulis (EC50 = 71.6 ± 4.9 µg/mL), and T. pulegioides (EC50 = 69.8 ± 4.4 µg/mL) [15], which showed EC50 values 1.3–3.2 times higher than the tested standard compound (Trolox), while that of LOX inhibition activity was not exploited.

2.4. Antibacterial Activity

The resistance to antibiotics has been associated with diseases and high mortality rates [34]. Research into new antimicrobial substances, such as purified natural compounds from plants, can serve as one of the therapeutic strategies for the synthesis of new generation and alternative chemical drugs with low toxicity. In this field, phenolic compounds have been gaining magnitude [35]. The antibacterial activity of the Lamiaceae family has been extensively studied, with promising results being observed for Thymus essential oils [36,37], while little knowledge has been gathered regarding polar extracts from a thyme origin.
Overall, the collected data showed that, among the five tested strains (Table 3), Staphylococcus aureus was the most sensitive to the three Thymus extracts, which were able to inhibit both its growth and viability at 0.6, 1.6, and 3.5 mg/mL for T. herba-barona, T. pseudolanuginosus, and T. caespititius, respectively. These results are consistent with those reported for other Thymus species, such as in the study described by Benbelaïd et al. for a water extract of Thymus lanceolatus, which exhibited a minimum inhibitory concentration (MIC) value of 1.0 mg/ml for S. aureus, as evaluated by the broth microdilution method [22]. Results acquired using the agar dilution method showed MIC values of 0.78 mg/ml for ethanolic extracts of Thymus caramanicus when exposed to S. aureus [21].
The three Thymus plants also exhibited a relevant antibacterial effect against the remaining tested bacteria, although with less potency than the food preservative nisin. In detail, MIC values of 5.0 and 6.5 mg/mL were registered for T. herba-barona and T. pseudolanuginosus, respectively, against Salmonella typhimurium, Staphylococcus epidermidis, Escherichia coli, and Pseudomonas aeruginosa. Despite T. caespititius generally being the less active extract, its activity towards S. epidermidis (MIC of 3.5 mg/mL) was more effective than the remaining ones. Note that the MIC concentrations herein found are close to those previously reported for T. vulgaris ethanolic extracts, against the same panel of bacteria (MIC in the range 6.25–12.5 mg/mL) [21] or to that of T. lanceolatus aqueous extracts against S. typhimurium (MIC of 4.0 mg/mL) [22], although they are less effective than a T. caramanicus hydroethanolic extract towards E. coli and P. aeruginosa (MIC values of 1.56 mg/mL and 1.30 mg/mL, respectively) [21].
Overall, the gathered results showed that the thyme extracts were not lethal to some gram-negative bacteria (S. typhimurium, E. coli, and P. aeruginosa), with a high minimum bactericidal concentration (MBC) (Table 3). T. herba-barona is effective against S. typhimurium, but needs a concentration superior to 5.0 mg/mL to kill E. coli and P. aeruginosa; a concentration of 6.5 mg/mL of T. pseudolanuginosus was not effective against S. typhimurium, E. coli, and P. aeruginosa; T. caespititius can be lethal to E. coli, but required a concentration superior to 7.0 mg/mL to eliminate S. typhimurium and P. aeruginosa). Additionally, gram-negative bacteria were more resistant (MIC between 5.0 and 7.0 mg/mL) than gram-positive bacteria, particularly S. aureus (MIC in the range 0.6 –3.5 mg/mL). These results are in agreement with those of other authors, who tested aqueous extracts for T. lanceolatus (MIC = 4.0 mg/mL against S. typhimurium and MIC = 0.83 mg/mL against S. aureus) [22]. The same evidence was observed in several researches that tested oils extracted from Thymus plants [36,37].

3. Materials and Methods

3.1. Chemicals

Rosmarinic acid, apigenin-7-O-glucoside, luteolin-7-O-glucoside, eriodictyol-7-O-glucoside, luteolin-8-C-glucoside, quinic acid, caffeic acid, and t-5-O-caffeoylquinic acid were obtained from Extrasynthese (Genay Cedex, France). Gallic acid and nisin were obtained from Sigma Chemical Co. (St. Louis, MO, USA). Folin-Ciocalteu reagent, Na2CO3, formic acid, and ethanol were purchased from Panreac (Barcelona, Spain). n-hexane, methanol, and acetonitrile with HPLC purity were purchased from Lab-Scan (Lisbon, Portugal). Mueller-Hinton agar was obtained from VWR, Prolabo Chemicals, West Chester, PA, USA. Water was treated in a Direct-Q® water purification system (Merck Life Science, Germany).

3.2. Plant Materials

T. herba-barona, T. caespititus, and T. pseudolanuginosus species were purchased as a mixture of flowers, leaves, and stems from Ervital (Viseu, Portugal). The plants had been cultivated under an organic regime and, after collection, their aerial parts (flowers, leaves, and stems) were dried in a ventilated incubator at 20–35 °C, for three to five days.

3.3. Extraction of Phenolic Compounds

Phenolic compounds were extracted by decoction, as according to Martins et al. [38], thyme phenolic compounds are efficiently recovered by this methodology. Decoction was performed according to the method described by Ferreira et al. [39], with adaptations. A total of 100 mL of distilled water was added to 5 g of plant material (0.5 mm mesh powder) and the mixture was heated and then boiled for 15 min. After extraction, the mixture was left to stand for 5 min, followed by filtration under reduced pressure through a G3 sintered plates filter. The resulting filtrated solution was concentrated in a rotary evaporator (BUCHI Labortechnik AG, Flawil, Switzerland) at 37 °C, followed by deffating with n-hexane (1:1 v/v). The aqueous defatted fraction was frozen, freeze-dried, and kept under vacuum in a desiccator in the dark, for subsequent use. Three extracts were obtained for each plant.

3.4. Identification and Quantification of Phenolic Compounds

The total phenolic content of each Thymus extract was determined according to the adapted Folin-Ciocalteu colorimetric method, as described by Pereira et al. [40]. The individual phenolic compounds were identified by a UHPLC-DAD-ESI-MSn analysis of extracts (5 mg/mL), performed on Ultimate 3000 (Dionex Co., Sunnyvale, CA, USA) apparatus equipped with an ultimate 3000 Diode Array Detector (Dionex Co.) and coupled to a mass spectrometer. The chromatographic apparatus was composed of a quaternary pump, an autossampler, a photodiode-array detector, and an automatic thermostatic column compartment. The column used had a 100 mm length, 2.1 mm i.d., 1.9 µm particle diameter, and end-capped Hypersil Gold C18 column (Thermo Scientific, Waltham, MA, USA), and its temperature was maintained at 30 °C. Gradient elution was carried out with a mixture of 0.1% (v/v) of formic acid in water (solvent A) and acetonitrile (solvent B), which were degassed and filtered before use. The solvent gradient consisted of a series of linear gradients, starting with 15–28% of solvent B over 5.6 min, increasing to 29% at 8.8 min, 100% of solvent B at 13.1 min, and maintaining this value up to 17 min, followed by the return to the initial conditions, with a total running time of 20 min. The flow rate used was 0.2 mL·min−1 and the UV–Vis spectral data for all peaks were accumulated in the range 200–600 nm. The chromatographic profiles were recorded at 280, 320, and 340 nm.
The mass spectrometer used was a Thermo LTQ XL (Thermo Scientific) ion trap MS equipped with an ESI source. Control and data acquisition were carried out with the Thermo Xcalibur Qual Browser data system (Thermo Scientific). Nitrogen above 99% purity was used and the gas pressure was 520 kPa (75 psi). The instrument was operated in negative-ion mode with an ESI needle voltage set at 5.00 kV and an ESI capillary temperature of 275 °C. The full scan covered the mass range from m/z 100 to 2000. CID–MS/MS and MSn experiments were simultaneously acquired for precursor ions using helium as the collision gas with a collision energy of 25–35 arbitrary units.
For quantitative analysis, the limits of detection (LOD) and quantification (LOQ) were calculated from the parameters of the calibration curves obtained by an injection of known concentrations of the exact or structurally-related standard compounds, represented in Table S1.

3.5. Bioactivity Tests

3.5.1. DPPH Scavenging Test

The radical scavenging capacity of T. herba-barona, T. pseudolanuginosus, and T. caespititius extracts was evaluated by a DPPH radical test, according to the previously described methodology [41]. Ascorbic acid was used as the positive control.

3.5.2. Reducing Power Test

The ability of T. herba-barona, T. pseudolanuginosus, and T. caespititius (0.05–0.25 mg/mL) aqueous extracts in reducing iron (III) was assessed by the method previously described [41]. Butylated hydroxyanisole (BHA) was used as the positive control.

3.5.3. β-Carotene Bleaching Carotene

The assay was performed as previously described by Juntachote and Berghofer [42]. A stock emulsion of β-carotene/linoleic acid was initially prepared by dissolving 20 mg of β-carotene in 10 mL of chloroform. A total of 1 mL of the β-carotene solution was added to 1 g of tween 80 and, after chloroform removal, 50 mg of linoleic acid was added. Distilled water (100 mL) was added to the mixture and homogenized using the rotary evaporator. Aliquots of β-carotene/linoleic acid emulsion (250 µL) were mixed with 50 µL of extract at different concentrations and the initial absorbance at 470 nm was immediately recorded. After incubation at 50 °C for 2 h, the reaction was stopped using an ice bath and the absorbance at 470 nm was measured. The blank used was prepared by adding chloroform without β-carotene. BHA was used as the positive control. The % of inhibition was calculated using the formula:
%   of   inhibition   =   ( C t   =   0 C t   =   2 ) - ( E t   =   0 E t   =   2 )   ( C t   =   0 C t   =   2 ) × 100
where Ct=0 corresponds to the absorbance of control at t = 0 min; Ct=2 corresponds to the absorbance of control at t = 120 min; Et=0, Absorbance of extract at t = 0 min; Et=2, Absorbance of extract at t = 120 min.

3.5.4. NO Scavenging Test

This assay was performed according to the method described by Bor et al. [43]. In brief, 100 µL of sodium nitroprusside (3.33 mM) in PBS 100 mM (pH = 7.4) was added to 100 µL of extract solution at different concentrations (0.07–0.5 mg/mL) and incubated for 15 min at room temperature under light irradiation. The generated NO interacts with molecular oxygen, producing NO2−, which in the presence of 100 µL of Griess reagent (1% of sulfanilamide and 0.1% of naphthylethylenediamine dihydrochloride in 2.5% of phosphoric acid) produces a purple azo dye. The measurement of the absorbance was determined spectrophotometrically at 562 nm and ascorbic acid was used as the positive control.

3.5.5. Inhibition of 5-Lipoxygenase

The LOX inhibitory assay was performed in a quartz 96-well plate according to the Tappel et al. procedure, with some modifications [44]. During this procedure, 20 µL of the ascorbic acid or extract sample solutions and 20µL of the LOX work solution were added to each well and incubated at 37 °C in the plate reader for 10 min. After incubation, 40 µL of linoleic acid, previously heated at 37 °C, was added and quickly placed in the plate reader. The reaction was followed for 20 min taking measurements every minute at 234 nm. The reaction rate at each inhibitor concentration was calculated by determining the slope of the experimental values and the percentage of inhibition by the following formula:
%   of   inhibition   = v 0 v [ inhibitor ] v 0 × 100
where v 0 corresponds to the reaction rate of control and v [ inhibitor ] is the reaction rate of the extract.

3.5.6. Antimicrobial Activity

The antibacterial potential of the Thymus polar extracts were evaluated against five bacterial strains, including gram-positive bacteria (S. epidermidis NCTC 11047 and S. aureus NCTC 6571) and gram-negative bacteria (S. typhimurium NCTC 12023, E. coli NCTC 9001, and P. aeruginosa NCTC 10662) from the National Collection of Type Cultures, operated by Public Health England. All strains were cultured in Mueller-Hinton agar and incubated at 37 °C for 24 h.
The MIC and MBC of plant extracts were determined by the broth microdilution method using a modified standard protocol [45]. Bacterial suspensions were prepared by direct colony suspensions in sterile distilled water and adjusted to obtain 1.5 × 10⁸ colony-forming units (CFU)/mL, approximately equivalent to 0.5 McFarland units. A final inoculum of 1.5 × 10⁵ CFU/mL was required for suspensions diluted in a 1:100 ratio in Mueller-Hinton broth.
One hundred microliters of Mueller-Hinton broth was dispensed into wells of 96-well micro titer plates (BioTek Instruments, Inc., Winooski, VT, USA). Aqueous solutions of T. herba-barona, T. pseudolanuginosus, and T. caespititius extracts were added at a final concentration of 10, 13, and 14 mg/mL, respectively, and were then serially diluted four times across the plate. One hundred microliters of bacteria suspension was finally added to each well and the plates were incubated at 37 °C for 24 h. The assay for each pathogen was repeated three times.
The MIC was defined as the lowest concentration at which visible growth was inhibited while the MBC is the lowest concentration of the tested substance which has a bactericidal effect. MBC values were determined by subculturing 10 µL of the culture from each negative well onto Mueller-Hinton agar and then determining the dilution at which growth was detected [46].
The solvent without extracts served as the negative control and nisin was used as the positive control. Nisin is an antibacterial polypeptide approved as a food preservative whose stock solution was prepared by dissolving 2 mg of nisin in 1 mL of HCl 0.02 N [47].

3.6. Statistical Analysis

All data are presented as mean ± standard deviations. One-way analysis of variance (ANOVA) followed by a Tukey’s test were used to detect any significant differences among different means. A p-value of less than 0.05 was assumed to indicate a significant difference. The results were analyzed using GraphPad Prism (GraphPad Software, CA, USA, version 6.0).

4. Conclusions

This work elucidates the phenolic composition of T. herba-barona, T. pseudolanuginosus, and T. caespititius decoctions, whilst also exploiting their antioxidant, anti-inflammatory, and antimicrobial activities. The three aqueous extracts were mainly characterized by the presence of phenolic acids and flavonoids, which are in part related to their biological activities. T. pseudolanuginosus presented the best antioxidant results concerning the three methods used. The selected Thymus plants extracts exhibited antibacterial activity against the panel of tested bacteria (S. typhimurium, S. epidermidis, S. aureus, E. coli, and P. aeruginosa ), especially S. aureus strains, which were in general the most sensitive. T. caespititius appears to have anti-inflammatory potential, based on its promising inhibitory activity on NO production. Bearing in mind the increasing demand for bioactive extracts of a botanical origin, this work opens a door for the expansion of the commercial exploitation of the thyme species.

Supplementary Materials

Supplementary materials can be found at www.mdpi.com/1422-0067/18/9/1879/s1.

Acknowledgments

The authors acknowledge to the Foundation for Science and Technology (FCT), the European Union, the National Strategic Reference Framework (QREN), the European Regional Development Fund (FEDER), and Operational Programme Competitiveness Factors (COMPETE), for funding the Organic Chemistry Research Unit (QOPNA) (project PEst-C/QUI/UI0062/2013; FCOMP-01-0124-FEDER-037296).

Author Contributions

Andrea F. Afonso and Olívia R. Pereira performed the experimental work, the analysis, and the interpretation of data, and wrote the paper; Rodrigo T. Neto contributed to some antioxidant assays; Artur M.S. Silva co-wrote the manuscript; Susana M. Cardoso coordinated the work and co-wrote the paper.

Conflicts of Interest

The authors declare no conflict of interest.

References

  1. Pereira, O.R.; Cardoso, S.M. Overview on Mentha and Thymus Polyphenols. Curr. Anal. Chem. 2012, 9, 1–15. [Google Scholar] [CrossRef]
  2. Horwath, A.B.; Grayer, R.J.; Keith-Lucas, D.M.; Simmonds, M.S.J. Chemical characterisation of wild populations of Thymus from different climatic regions in southeast Spain. Biochem. Syst. Ecol. 2008, 36, 117–133. [Google Scholar] [CrossRef]
  3. Nieto, G.; Huvaere, K.; Skibsted, L.H. Antioxidant activity of rosemary and thyme by-products and synergism with added antioxidant in a liposome system. Eur. Food Res. Technol. 2011, 233, 11–18. [Google Scholar] [CrossRef]
  4. Fernandes, Â.S.F.; Barros, L.; Carvalho, A.M.; Ferreira, R.; Isabel, C.F. Lipophilic and hydrophilic antioxidants, lipid peroxidation inhibition and radical scavenging activity of two Lamiaceae food plants. Eur. J. Lipid Sci. Technol. 2010, 112, 1115–1121. [Google Scholar] [CrossRef]
  5. Li, A.N.; Li, S.; Zhang, Y.J.; Xu, X.R.; Chen, Y.M.; Li, H. Bin Resources and biological activities of natural polyphenols. Nutrients 2014, 6, 6020–6047. [Google Scholar] [CrossRef] [PubMed]
  6. Kumar, S.; Pandey, A.K. Chemistry and biological activities of flavonoids: An overview. Sci. World J. 2013. [Google Scholar] [CrossRef] [PubMed]
  7. Bisht, R.; Bhattacharya, S.; Jaliwala, Y.A. COX and LOX inhibitory potential of Abroma augusta and Desmodium gangeticum. J. Phytopharm. 2014, 3, 168–175. [Google Scholar]
  8. Ozkan, G.; Kamiloglu, S.; Ozdal, T.; Boyacioglu, D. Potential Use of Turkish Medicinal Plants in the treatment of various diseases. Molecules 2016, 3, 257. [Google Scholar] [CrossRef] [PubMed]
  9. Hossain, M.B.; Rai, D.K.; Brunton, N.P.; Martin-Diana, A.B.; Barry-Ryan, C. Characterization of phenolic composition in Lamiaceae spices by LC-ESI-MS/MS. J. Agric. Food Chem. 2010, 58, 10576–10581. [Google Scholar] [CrossRef] [PubMed]
  10. Özgen, U.; Mavi, Z.; Terzi, A.; Yιldιrιm, M.; Coşkun, M.; Houghton, P.J. Antioxidant Properties of Some Medicinal Lamiaceae (Labiatae) Species. Pharm. Biol. 2006, 44, 107–112. [Google Scholar] [CrossRef]
  11. Zhang, Y.-J.; Gan, R.-Y.; Li, S.; Zhou, Y.; Li, A.-N.; Xu, D.-P.; Li, H.-B. Antioxidant Phytochemicals for the Prevention and Treatment of Chronic Diseases. Molecules 2015, 20, 21138–21156. [Google Scholar] [CrossRef] [PubMed]
  12. Kuli, T.; Dragovi, V.; Milo, M. Antioxidant Activity of Aqueous Tea Infusions Prepared from Oregano, Thyme and Wild Thyme. Food Technol. Biotechnol. 2006, 44, 485–492. [Google Scholar]
  13. Shan, B.; Cai, Y.Z.; Sun, M.; Corke, H. Antioxidant capacity of 26 spice extracts and characterization of their phenolic constituents. J. Agric. Food Chem. 2005, 53, 7749–7759. [Google Scholar] [CrossRef] [PubMed]
  14. Proestos, C.P.; Horianopoulos, N.C.; Ychas, G.E.N.; Omaitis, M.K. RP-HPLC Analysis of the Phenolic Compounds of Plant Extracts. Investigation of Their Antioxidant Capacity and Antimicrobial Activity. J. Agric. Food Chem. 2005, 53, 1190–1195. [Google Scholar] [CrossRef] [PubMed]
  15. Kindl, M.; Blažeković, B.; Bucar, F.; Vladimir-Knežević, S. Antioxidant and anticholinesterase potential of six thymus species. Evid. Based Complement. Altern. Med. 2015. [Google Scholar] [CrossRef] [PubMed]
  16. Miron, T.L.; Plaza, M.; Bahrim, G.; Ibáñez, E.; Herrero, M. Chemical composition of bioactive pressurized extracts of Romanian aromatic plants. J. Chromatogr. A 2011, 1218, 4918–4927. [Google Scholar] [CrossRef] [PubMed] [Green Version]
  17. Özgen, U.; Mavi, A.; Terzi, Z.; Kazaz, C.; Ali, A.; Kaya, Y.; Seçen, H. Relationship Between Chemical Structure and Antioxidant Activity of Luteolin and Its Glycosides Isolated from Thymus sipyleus subsp. sipyleus var. sipyleus. Rec. Nat. Prod. 2011, 1, 12–21. [Google Scholar] [CrossRef]
  18. Barros, L.; Heleno, S.A.; Carvalho, A.M.; Ferreira, I.C.F.R. Lamiaceae often used in Portuguese folk medicine as a source of powerful antioxidants: Vitamins and phenolics. LWT Food Sci. Technol. 2010, 43, 544–550. [Google Scholar] [CrossRef]
  19. Büyükbalci, A.; El, S.N. Determination of in vitro antidiabetic effects, antioxidant activities and phenol contents of some herbal teas. Plant Foods Hum. Nutr. 2008, 63, 27–33. [Google Scholar] [CrossRef] [PubMed]
  20. Abd, M.A.; Kader, E.; Mohamed, N.Z. Evaluation of Protective and Antioxidant Activity of Thyme (Thymus Vulgaris) Extract on Paracetamol-Induced Toxicity in Rats. Aust. J. Basic Appl. Sci. 2012, 6, 467–474. [Google Scholar]
  21. Mahboubi, A.; Kamalinejad, M.; Ayatollahi, A.M.; Babaeian, M. Total phenolic content and antibacterial activity of five plants of labiatae against four foodborne and some other bacteria. Iran. J. Pharm. Res. 2014, 13, 559–566. [Google Scholar] [PubMed]
  22. Benbelaid, F.; Khadir, A.; Abdoune, M.A.; Bendahou, M. Phytochemical screening and in vitro antimicrobial activity of Thymus lanceolatus from Algeria. Asian Pacific J. Trop. Dis. 2013, 3, 454–459. [Google Scholar] [CrossRef]
  23. Chohan, M.; Naughton, D.P.; Jones, L.; Opara, E.I. An investigation of the relationship between the anti-inflammatory activity, polyphenolic content, and antioxidant activities of cooked and in vitro digested culinary herbs. Oxid. Med. Cell. Longev. 2012. [Google Scholar] [CrossRef] [PubMed]
  24. Miguel, G.; Simões, M.; Figueiredo, A.C.; Barroso, J.G.; Pedro, L.G.; Carvalho, L. Composition and antioxidant activities of the essential oils of Thymus caespititius, Thymus camphoratus and Thymus mastichina. Food Chem. 2004, 86, 183–188. [Google Scholar] [CrossRef]
  25. Bown, D. The Royal Horticultural Society New Encyclopedia of Herbs and Their Uses; Dorling Kindersley: London, UK, 2002; pp. 266–286. [Google Scholar]
  26. Zheng, W.; Wang, S.Y. Antioxidant Activity and Phenolic Compounds in Selected Herbs. J. Agric. Food Chem. 2001, 49. [Google Scholar] [CrossRef]
  27. Nagy, T.O.; Solar, S.; Sontag, G.; Koenig, J. Identification of phenolic components in dried spices and influence of irradiation. Food Chem. 2011, 128, 530–534. [Google Scholar] [CrossRef] [PubMed]
  28. Pereira, O.R.; Peres, A.M.; Silva, A.M.S.; Domingues, M.R.M.; Cardoso, S. M. Simultaneous characterization and quantification of phenolic compounds in Thymus x citriodorus using a validated HPLC-UV and ESI-MS combined method. Food Res. Int. 2013, 54, 1773–1780. [Google Scholar] [CrossRef]
  29. Iauk, L.; Acquaviva, R.; Mastrojeni, S.; Amodeo, A.; Pugliese, M.; Ragusa, M.; Loizzo, M.R.; Menichini, F.; Tundis, R. Antibacterial, antioxidant and hypoglycaemic effects of Thymus capitatus (L.) Hoffmanns. et Link leaves’ fractions. J. Enzyme Inhib. Med. Chem. 2015, 30, 360–365. [Google Scholar] [CrossRef] [PubMed]
  30. Nickavar, B.; Esbati, N. Evaluation of the Antioxidant Capacity and Phenolic Content of Three Thymus Species. J. Acupunct. Meridian Stud. 2012, 5, 119–125. [Google Scholar] [CrossRef] [PubMed]
  31. Debnath, T.; Kim, D.H.; Lim, B.O. Natural products as a source of anti-inflammatory agents associated with inflammatory bowel disease. Molecules 2013, 18, 7253–7270. [Google Scholar] [CrossRef] [PubMed]
  32. Atta-ur-Rahman, F.R.S. (Ed.) The Anti-inflammatory Potential of Flavonoids: Mechanistic Aspects. In Studies in Natural Products Chemistry; Elsevier: Amsterdam, The Netherlands, 2016; Volume 48, pp. 65–99. [Google Scholar]
  33. Pelletier, J. Therapeutic role of dual inhibitors of 5-LOX and COX, selective and non-selective non-steroidal anti-inflammatory drugs. Ann. Rheum. Dis. 2003, 62, 501–509. [Google Scholar] [CrossRef]
  34. World Health Organization. Antimicrobial Resistance: Global Report on Surveillance; World Health Organization: Geneva, Switzerland, 2014. [Google Scholar]
  35. Nielsen, T.R.H.; Kuete, V.; Jäger, A.K.; Meyer, J.J.M.; Lall, N. Antimicrobial activity of selected South African medicinal plants. BMC Complement. Altern. Med. 2012, 12, 74. [Google Scholar] [CrossRef] [PubMed]
  36. Figueiredo, A.; Barroso, J.; Pedro, L.; Salgueiro, L.; Miguel, M.; Faleiro, M. Portuguese Thymbra and Thymus Species Volatiles: Chemical Composition and Biological Activities. Curr. Pharm. Des. 2008, 14, 3120–3140. [Google Scholar] [CrossRef] [PubMed]
  37. Fournomiti, M.; Kimbaris, A.; Mantzourani, I.; Plessas, S.; Theodoridou, I.; Papaemmanouil, V.; Kapsiotis, I.; Panopoulou, M.; Stavropoulou, E.; Bezirtzoglou, E.E.; et al. Antimicrobial activity of essential oils of cultivated oregano (Origanum vulgare), sage (Salvia officinalis), and thyme (Thymus vulgaris) against clinical isolates of Escherichia coli, Klebsiella oxytoca, and Klebsiella pneumoniae. Microb. Ecol. Health Dis. 2015, 1, 1–7. [Google Scholar] [CrossRef] [PubMed]
  38. Martins, N.; Barros, L.; Santos-Buelga, C.; Silva, S.; Henriques, M.; Ferreira, I.C.F.R. Decoction, infusion and hydroalcoholic extract of cultivated thyme: Antioxidant and antibacterial activities, and phenolic characterisation. Food Chem. 2015, 167, 131–137. [Google Scholar] [CrossRef] [PubMed] [Green Version]
  39. Ferreira, F.M.; Dinis, L.T.; Azedo, P.; Galhano, C.I.C.; Simões, A.; Cardoso, S.M.; Domingues, M.R.M.; Pereira, O.R.; Palmeira, C.M.; Peixoto, F.P. Antioxidant capacity and toxicological evaluation of Pterospartum tridentatum flower extracts. CYTA J. Food 2012, 10, 92–102. [Google Scholar] [CrossRef]
  40. Pereira, O.R.; Silva, A.M.S.; Domingues, M.R.M.; Cardoso, S.M. Identification of phenolic constituents of Cytisus multiflorus. Food Chem. 2012, 131, 652–659. [Google Scholar] [CrossRef]
  41. Catarino, M.D.; Silva, A.M.S.; Saraiva, S.C.; Sobral, A.J.F.N.; Cardoso, S.M. Characterization of phenolic constituents and evaluation of antioxidant properties of leaves and stems of Eriocephalus africanus. Arab. J. Chem. 2017, in press. [Google Scholar] [CrossRef]
  42. Juntachote, E. B. Antioxidative properties and stability of ethanolic extracts of Holy basil and Galangal. Food Chem. 2005, 92, 193–202. [Google Scholar] [CrossRef]
  43. Bor, J.Y.; Chen, H.Y.; Yen, G.C. Evaluation of Antioxidant Activity and Inhibitory Effect on Nitric Oxide Production of Some Common Vegetables. J. Agric. Food Chem. 2006, 54, 1680–1686. [Google Scholar] [CrossRef] [PubMed]
  44. Tappel, A.L.; Lundberg, W.O.; Boyer, P.D. Effect of temperature and antioxidants upon the lipoxidase-catalyzed oxidation of sodium linoleate. Arch. Biochem. Biophys. 1953, 42, 293–304. [Google Scholar] [CrossRef]
  45. Andrews, J.M.; Andrews, J.M. Determination of minimum inhibitory concentrations. J. Antimicrob. Chemother. 2001, 48, 5–16. [Google Scholar] [CrossRef] [PubMed]
  46. Shami, A.-M.M.; Philip, K.; Muniandy, S. Synergy of antibacterial and antioxidant activities from crude extracts and peptides of selected plant mixture. BMC Complement. Altern. Med. 2013, 13, 360. [Google Scholar] [CrossRef] [PubMed]
  47. Ruiz, S.P.; Anjos, M.M.D.; Carrara, V.S.; deLima, J.N.; Cortez, D.A.G.; Nakamura, T.U.; Nakamura, C.V.; de Abreu Filho, B.A. Evaluation of the antibacterial activity of piperaceae extracts and nisin on alicyclobacillus acidoterrestris. J. Food Sci. 2013, 78, M1772–M1777. [Google Scholar] [CrossRef] [PubMed]
Figure 1. Chromatographic profiles at 280 nm of T. herba-barona, T. pseudolanuginosus, and T. caespititius aqueous extracts (The numbers in the figure correspond to the LC-MSn fractions indicated in Table 2).
Ijms 18 01879 g001
Table 1. Yield of extraction (%), total phenolic content (mg GAE/g of extract), and antioxidant and anti-inflammatory activities (EC50, µg/mL) of T. herba-barona, T. pseudolanuginosus, and T. caespititius aqueous extracts.
Plant ExtractYield (%)TPCDPPHRPβ-CaroteneNO5-LOX
T. herba-barona15.3 ± 1.80 a273 ± 16.6 a,c11.6 ± 0.90 a35.1± 4.50 a>26.70 a286 ± 32.6 a841 ± 138 a
T. pseudolanuginosus16.8 ± 0.90 a293 ± 30.5 a10.9 ± 0.70 a32.2± 8.20 a2.40 ± 0.20 b299 ± 23.4 a814 ± 87.2 a
T. caespititius19.9 ± 2.40 a236 ± 26.6 b,c13.8 ± 0.60 a39.3 ± 2.70 a6.10 ± 0.20 c230 ± 21.5 b591 ± 166 a
AA 6.70 ± 0.70 b 228 ± 20.7 b7.80 ± 1.00 b
BHA 16.0 ± 2.00 b0.40 ± 0.02 d
Mean values ± standard deviations. Statistical analysis was performed by one-way ANOVA, followed by a Tukey test. In each column, different letters (a–d) stand for significant statistical different data (p < 0.05). TPC: Total Phenolic Compounds; RP: Reducing Power; AA: Ascorbic acid; BHA: Butylated hydroxyanisole; LOX: lipoxygenase.
Table 2. Identification and quantification of UHPLC (ultra high performance chromatography) eluting fractions by UHPLC-DAD-MSn of T. herba-barona, T. pseudolanuginosus, and T. caespititius aqueous extracts.
FractionRT (min)λmax (nm)Compound[M-H]Main Fragments ESI-MSn(mg/g Extract)
T. h-bT. pseudT. caesp
11.3270Quinic acid A191MS2 [191]: 111, 173DDD
21.6278Syringic acid-O-hex B359MS2 [359]: 197, 179, 161, 153, 135DDD
31.8281Danshensu B197MS2 [197]: 179DDD
292, 3234-O-CQA B353MS2 [353]: 173, 179, 191DD
42.2286, 322t-5-O-CQA A353MS2 [353]: 191 , 179, 161, 135, 119D6.4 ± 0.4D
52.4271, 333Apigenin di-C-glc B593MS2 [539]: 473, 353, 383, 503, 575, 297DD4.0 ± 0.2
63.3289, 321Caffeic acid A179MS2 [179]: 135, 151, 161, 107, 974.3 ± 0.1DD
73.4287, 318SA F der B375MS2 [375]: 313, 269, 179, 135, MS3 [313]: 269, 161DDD
277RA der B377MS2 [377]: 359; MS3 [359]: 161, 179, 197, 223, 133 D
83.7283Eriodictyol-O-glc A449MS2 [449]: 287, 269, 259, 2671.9 ± 0.01
94.1281, 342Quercetin-O-glcA B477MS2 [477]: 301, 343, 3972.3 ± 0.13.4 ± 0.041.1 ± 0.08
104.6341Luteolin-C-glc A447MS2 [447]: 357, 285, 3275.1 ± 0.12.9 ± 0.02
115.1282RA sulfate B439MS2 [439]: 259, 421, 225, 371, 359, 197; MS3 [259]: 161D
125.6253, 287, 312SA I B537MS2 [537]: 339, 493; MS3 [339]: 295, 229, 293DD
135.7289, 318SA F der B519MS2 [519]: 475, 313; MS3 [475]: 313, 269, 179, 431D
146.2254, 266, 345Luteolin-O-rut B593MS2 [593]: 2852.2 ± 0.1
156.8281, 331Luteolin-O-glcA (isom 1) B461MS2 [461]: 285, 175; MS3 [285]: 267, 239, 241, 213, 1854.4 ± 0.0254.1 ± 0.617.3 ± 1.1
167.0255, 265, 345Luteolin-O-glcA (isom 2) B461MS2 [461]: 285; MS3 [285]: 241, 199, 175, 151, 26710.5 ± 0.27.1 ± 0.26.8 ± 0.4
177.3261, 331Apigenin-O-glc (isom 1) A431MS2 [431]: 2690.9 ± 0.15
188.0285, 333SA C der B553MS2 [553]: 491, 399, 179, 429, 473; MS3 [491]: 473D
198.3254, 283, 344SA B (isom1) B717MS2 [717]: 519, 475, 339; MS3 [519]: 475, 3396.9 ± 0.5
289, 318Dedihydro-SA B (isom 1) B715MS2 [715]: 313, 627, 671, 269; MS2 [313]: 179, 13510.8 ± 0.1
208.5289, 337Chrysoeriol-O-glc B461MS2 [461]: 299, 284; MS3 [299]: 284DD
219.0228, 282, 331Apigenin-O-glc (isom 2) B431MS2 [431]: 269; MS3 [269]: 225, 149, 117, 183, 167, 199D
229.0252, 267, 342Chrysoeriol-O-rut B607MS2 [607]: 299, 284 ; MS3 [299]: 284D
239.1267, 333Apigenin-O-glcA B445MS2 [445]: 269, 1752.1 ± 0.038.3 ± 0.051.97 ± 0.1
249.6287, 325RA A359MS2 [359]: 161, 179, 197, 22355.8 ± 2.840.2 ± 0.943.2 ± 3.2
259.8287, 3113′-O-(8″-Z-Caffeoyl) RA (isom 1) B537MS2 [537]: 493, 515, 375, 357, 339, 313, 197DDD
269.0289, 319Dedihydro- SA B (isom 2) B715MS2 [715]: 313, 671, 627, 269D
2710.1288, 326SA B (isom 2) B717MS2 [717]: 519, 357, 555 MS3 [519]: 357, 475, 295DDD
287, 324SA K B555MS2 [555]: 493, 357, 393, 313; MS3 [493]: 359, 313, 161D10.5 ± 0.1
2810.7290, 3233′-O-(8″-Z-Caffeoyl) RA (isom 2) B537MS2 [537]: 493, 359; MS3 [493]: 359, 313, 295, 16112.0 ± 0.2DD
2912.2288, 322Caffeoyl RA (isom 1) B537MS2 [537]: 375, 493, 359, 51910.5 ± 0.06DD
3012.5287, 328Caffeoyl RA (isom 2) B537MS2 [537]: 439, 519, 357, 493, 323, 1974.2 ± 0.1
3112.8288, 323Caffeoyl RA (isom 3) B537MS2 [537]: 519, 359, 357, 339, 235, 493; MS3 [519]: 357D
3213.3287, 3233′-O-(8″-Z-Caffeoyl) RA (isom 3) B537MS2 [537]: 493, 375, 359; MS3 [493]: 359, 197DDD
Phenolic compounds groupsCaffeic acid and derivatives97.6 ± 2.6 a57.1 ± 1.3 b50.0 ± 3.8 c
Flavones22.0 ± 0.3 a73.3 ± 1.0 b32.2 ± 2.0 c
Flavonols2.3 ± 0.1 a3.6 ± 0.04 b1.1 ± 0.1 c
Flavanones1.9 ± 0.01
Total123.9 ± 2.8 a134.0 ± 2.4 b83.4 ± 5.8 c
T. h-b: Thymus herba-barona; T. pseud: Thymus pseudolanuginosus; T. caes: Thymus caespititius; D: detected; RT: retention time; CQA: caffeoylquinic acid; Der: derivative; Glc: glucoside; GlucA: glucuronide; Hex: hexoside; isom: isomer; RA: rosmarinic acid; Rut: rutinoside; SA: salvianolic acid; A compound identification was based on comparison to standard; B compound identification was based on interpretation of UV spectral and MS data, plus comparison to literature; Mean values ± standard deviations of three independent assays; Statistical analysis was performed by one-way ANOVA (Tukey’s test). In each row, different letters (a–c) stand for significant statistical different data (p < 0.05).
Table 3. MIC (mg/mL) and MBC (mg/mL) of plant extracts and nisin (mg/mL) against selected test pathogens.
BacteriaT. herba-baronaT. pseudolanuginosusT. caespititiusNisin
MBCMICMBCMICMBCMICMBCMIC
Salmonella typhimurium5.05.0>6.56.5>7.07.00.50.5
Staphylococcus epidermidis5.05.06.56.57.03.5<0.03<0.03
Staphylococcus aureus0.60.61.61.63.53.50.250.25
Escherichia coli>5.05.0>6.56.57.07.00.50.5
Pseudomonas aeruginosa>5.05.0>6.56.5>7.07.01.00.5
Mean values; MIC: minimum inhibitory concentration; MBC: minimum bactericidal concentration.

