Article

Dual Strands of Pre-miR-149 Inhibit Cancer Cell Migration and Invasion through Targeting FOXM1 in Renal Cell Carcinoma

1
Department of Functional Genomics, Chiba University Graduate School of Medicine, 2608670 Chiba, Japan
2
Department of Urology, Chiba University Graduate School of Medicine, 2608670 Chiba, Japan
3
Department of Biomedical Science, Chiba University Graduate School of Medicine, 2608670 Chiba, Japan
4
Department of Urology, Teikyo University Chiba Medical Center, 2990111 Ichihara, Japan
*
Author to whom correspondence should be addressed.
Int. J. Mol. Sci. 2017, 18(9), 1969; https://doi.org/10.3390/ijms18091969
Submission received: 31 July 2017 / Revised: 7 September 2017 / Accepted: 7 September 2017 / Published: 13 September 2017
(This article belongs to the Special Issue Molecular Research on Urology)

Abstract

:
Our recent studies revealed that dual strands of certain pre-microRNAs, e.g., pre-miR-144, pre-miR-145, and pre-miR-150, act as antitumor microRNAs (miRNAs) in several cancers. The involvement of passenger strands of miRNAs in cancer pathogenesis is a novel concept in miRNA research. The analysis of a miRNA expression signature in clear cell renal cell carcinoma (ccRCC) has revealed that the guide strand of pre-miR-149 is significantly downregulated in cancer tissues. The aims of this study were to investigate the functional significance of miR-149’s guide strand (miR-149-5p) and passenger strand (miR-149-3p), and to identify the oncogenic genes regulated by these miRNAs in ccRCC cells. The ectopic expression of these miRNAs significantly inhibited cancer cell migration and invasion in ccRCC cells. Forkhead box protein M1 (FOXM1) was directly regulated by miR-149-5p and miR-149-3p in ccRCC cells. Knockdown studies using si-FOXM1 showed that the expression of FOXM1 enhanced RCC cell aggressiveness. Interestingly, the analysis of a large number of patients in the The Cancer Genome Atlas (TCGA) database (n = 260) demonstrated that patients with high FOXM1 expression had significantly shorter survival than did those with low FOXM1 expression (p = 1.5 × 10⁻⁶). Taken together, dual strands of pre-miR-149 (miR-149-5p and miR-149-3p) acted as antitumor miRNAs through the targeting of FOXM1 in ccRCC cells.

Graphical Abstract

1. Introduction

Renal cell carcinoma (RCC) is the most common neoplasm of the kidney, and approximately 70–80% of RCCs are classified as clear cell-type (ccRCC) [1]. More than 270,000 patients are diagnosed with RCC every year, which is estimated to constitute approximately 3% of adult malignancies. The incidence and mortality rates of RCC are increasing at a rate of 2–3% per decade [2]. Although surgical resection remains the only known curative treatment for localized RCC, a significant percentage of these patients develop relapses or metastatic disease, which are associated with a poor prognosis [3]. Recently developed targeted molecular therapies and immunomodulatory agents are currently being widely used for patients with metastatic or recurrent RCC [4]. However, those curative approaches are restricted to RCC patients in advanced stages of disease and the 5-year survival rate of the patients is only 5–10% [5]. Therefore, to improve outcomes in patients with RCC, it is necessary to fully elucidate the molecular mechanisms of metastatic RCC based on new genomic approaches.
MicroRNAs (miRNAs) belong to a class of noncoding RNA molecules that fine-tune the expression of protein coding/noncoding RNAs by repressing translation or cleaving RNA transcripts in a sequence-dependent manner [6]. Overexpression of oncogenic miRNAs and dysfunction of antitumor miRNAs are associated with human cancer pathogenesis [7]. A single miRNA species can regulate the expression of hundreds or thousands of different mRNAs, and an individual species of mRNA can be regulated by multiple different miRNAs in normal cells [8]. Therefore, aberrantly expressed miRNAs can disrupt regulatory miRNA–mRNA networks in cancer cells.
The construction of expression signatures of miRNAs in human cancers is an effective strategy to identify aberrantly expressed miRNAs in cancer cells. We have constructed miRNA signatures in several types of human cancers, including RCC [9,10,11,12]. From analyses of the signatures, we have found that some passenger strands of miRNAs were significantly reduced in cancer tissues, suggesting that passenger strands of miRNAs have an antitumor function in cancer cells, as do guide strands of miRNAs. In miRNA biogenesis, one strand of mature miRNA (the guide strand) is loaded into the miRNA-induced silencing complex (RISC) that targets mRNA degradation and translational repression in processing bodies [13]. In contrast, the passenger strand of miRNA was previously thought to be degraded and to have no function [14,15,16]. Interestingly, our recent studies demonstrated that the dual strands (guide strand and passenger strand) of certain pre-miRNAs, such as pre-miR-144, pre-miR-145, pre-miR-139, and pre-miR-150, acted as antitumor miRNAs through the targeting of several oncogenic genes in several cancers [17,18,19]. Novel approaches to the analysis of dual strand miRNA-regulated RNA networks in cancer cells may provide new insights into the pathogenic development of human cancers.
Our original miRNA signature of RCC led us to focus on the dual strands of pre-miR-149, i.e., miR-149-5p (the guide strand) and miR-149-3p (the passenger strand) [9]. The aims of this study were to investigate the functional significance of these miRNAs and to identify coordinately regulated oncogenic genes in RCC cells. The identification of the function of passenger strands of miRNAs and novel mechanisms of miRNA-mediated gene regulation enhance our understanding of the molecular pathways underlying RCC initiation, development, and metastasis.

2. Results

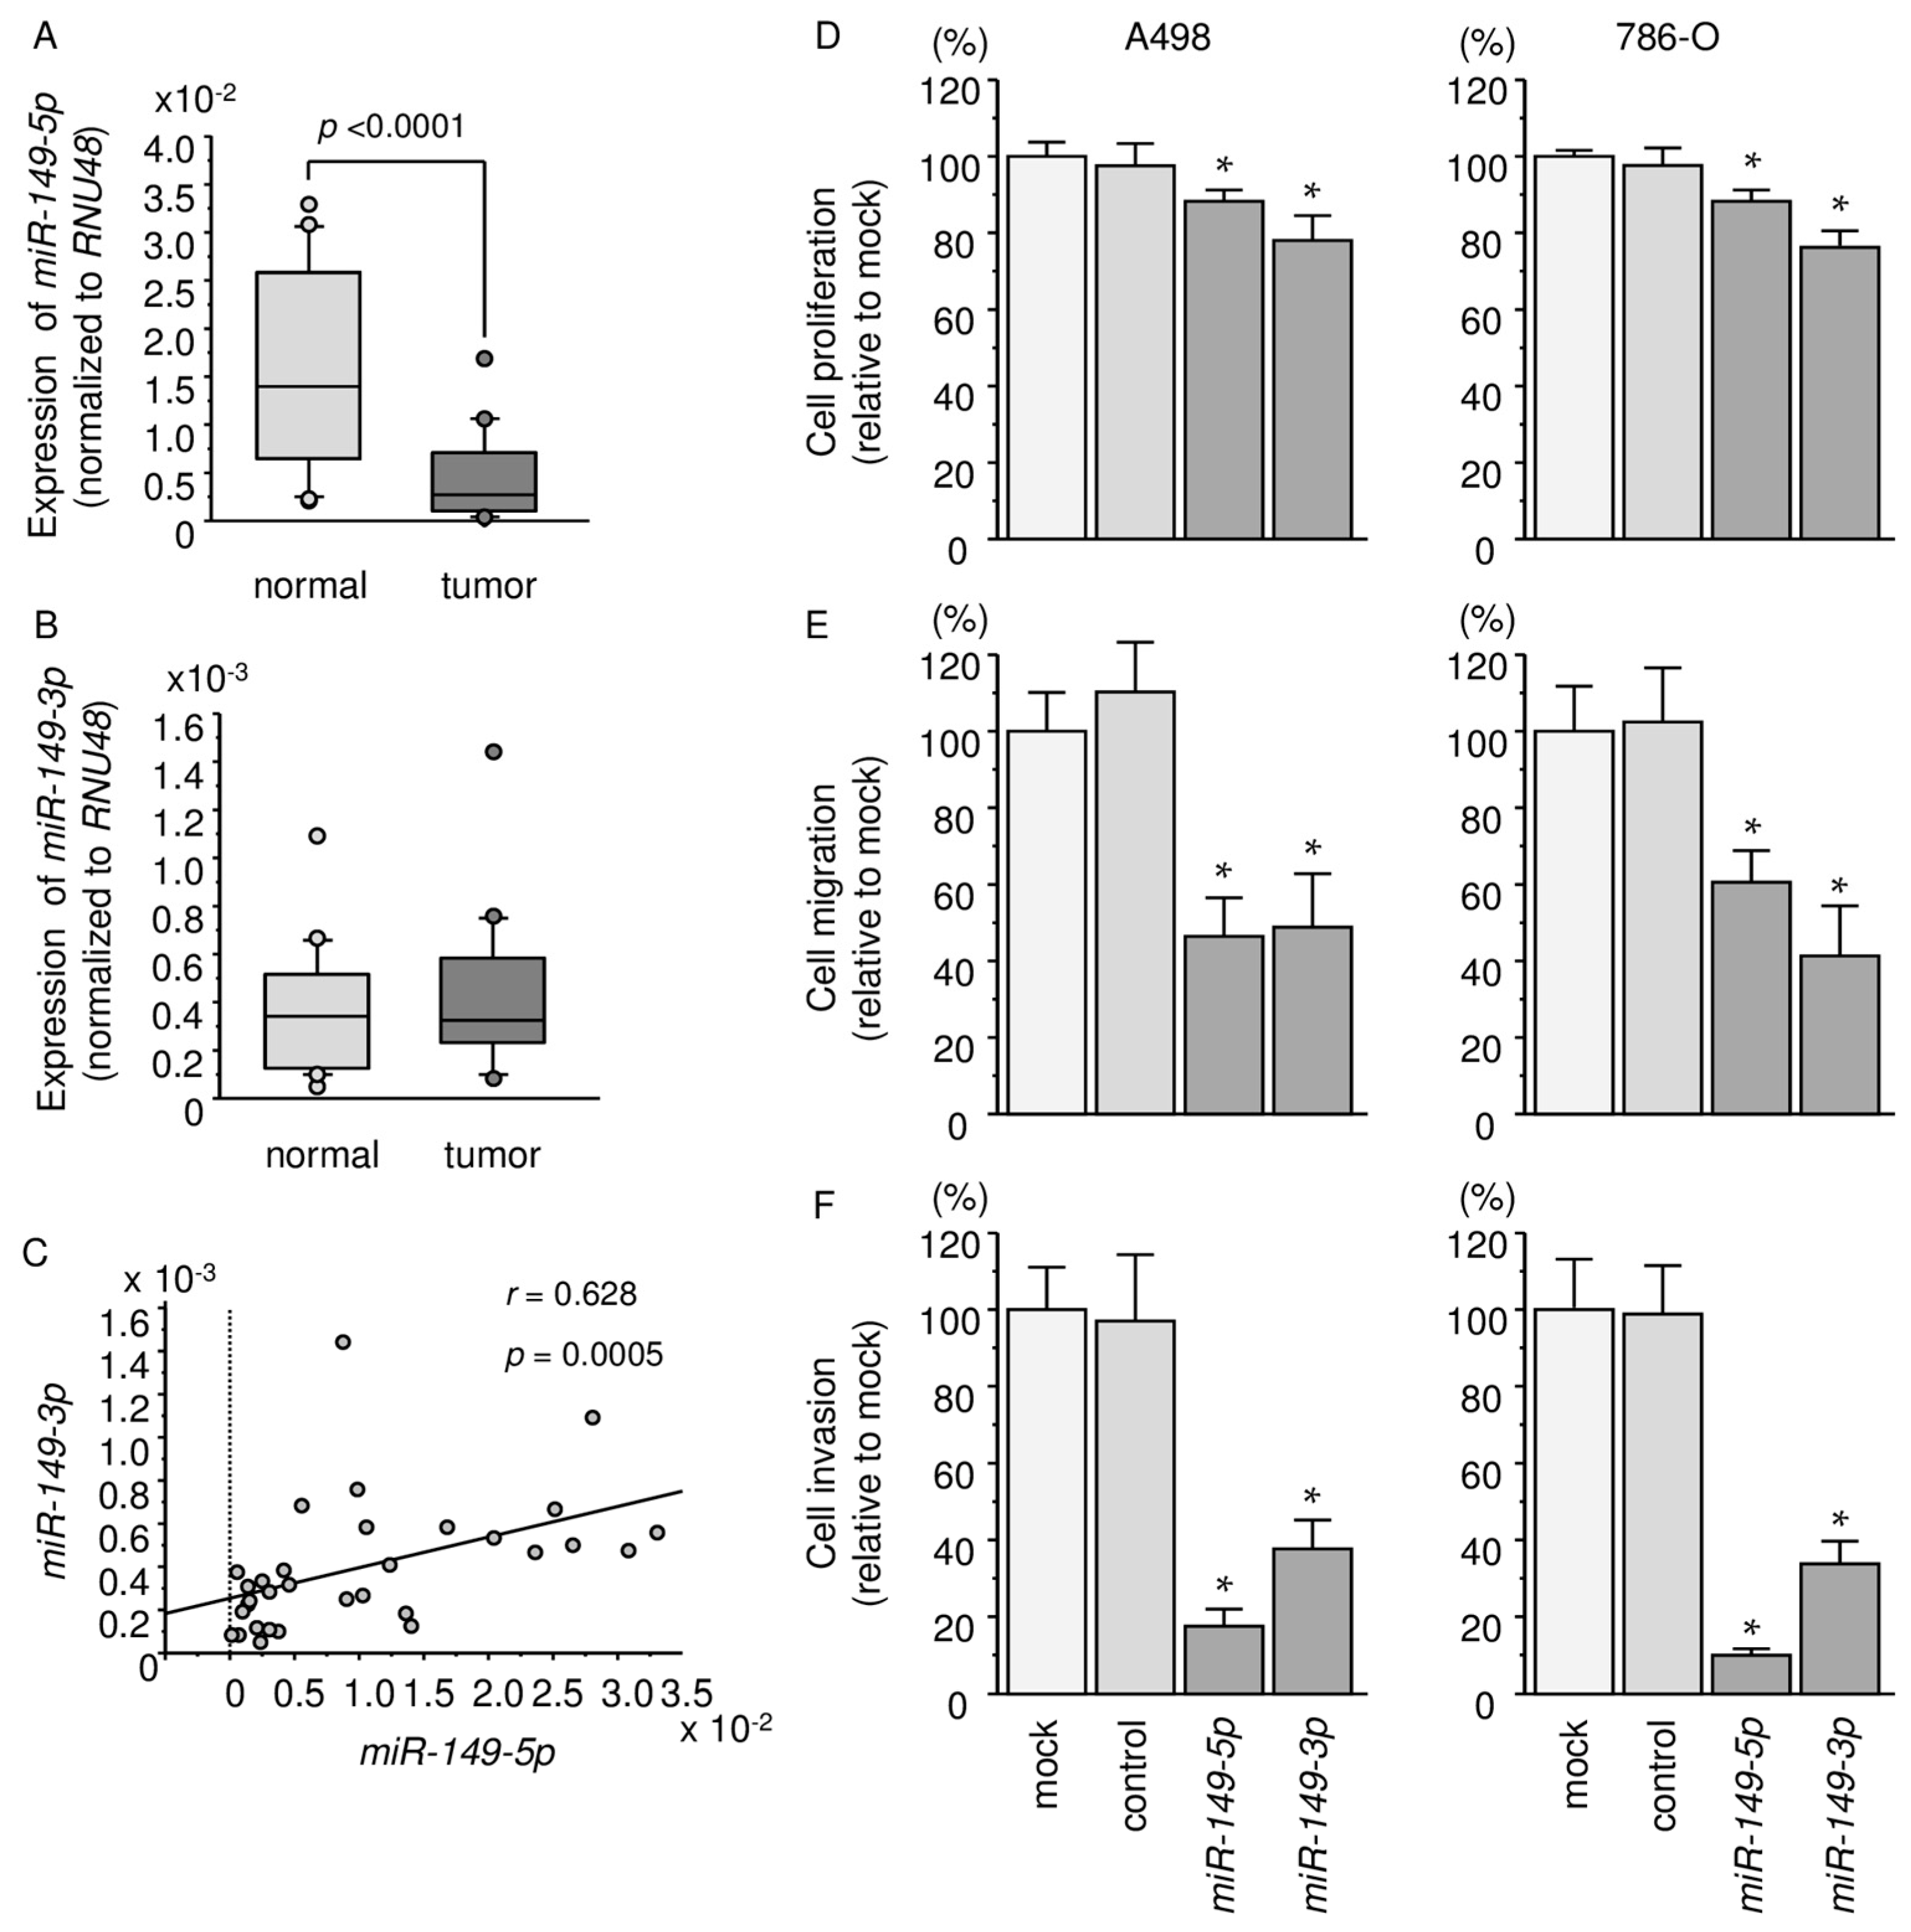
2.1. Expression Levels of miR-149-5p and miR-149-3p in ccRCC Specimens and Cell Lines

We evaluated the expression levels of miR-149-5p and miR-149-3p in kidney tissues (cancerous specimens and adjacent non-cancerous specimens). The patients’ backgrounds are summarized in Table 1. The expression levels of miR-149-5p were significantly lower in cancerous tissues than in normal tissues, but there were no significant differences in the expression levels of miR-149-3p between cancerous tissues and non-cancerous tissues (miR-149-5p: p < 0.0001, miR-149-3p: p = 0.473; Figure 1A,B). Comparing the expression levels of two miRNAs, miR-149-5p (guide strand) and miR-149-3p (passenger strand) in RCC cells, our data showed that the expression level of the miR-149-5p strand is more abundant than that of the miR-149-3p strand in RCC cells (Figure 1A,B). Spearman’s rank tests showed positive correlations between the expression level of miR-149-5p and miR-149-3p (r = 0.628 and p = 0.0005; Figure 1C).

2.2. Effects of Ectopic Expression of miR-149-5p and miR-149-3p on Cell Proliferation, Migration, and Invasion Assays in RCC Cell Lines

To examine the functional roles of miR-149-5p and miR-149-3p, we performed gain-of-function studies by using A498 and 786-O cells transfected with mature miRNAs.
XTT assays revealed that proliferation was significantly inhibited in A498 and 786-O cells transfected with miR-149-5p and miR-149-3p in comparison with mock or miR-control-transfected cells (p < 0.0001; Figure 1D). Wound-healing and Matrigel invasion assays demonstrated significant inhibition of cell migration and invasion in miR-149-5p and miR-149-3p transfectants (p < 0.0001; Figure 1E,F).

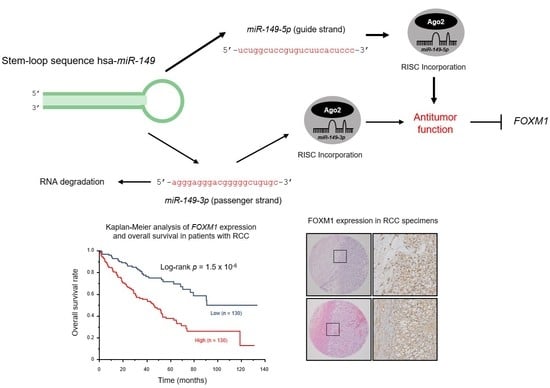
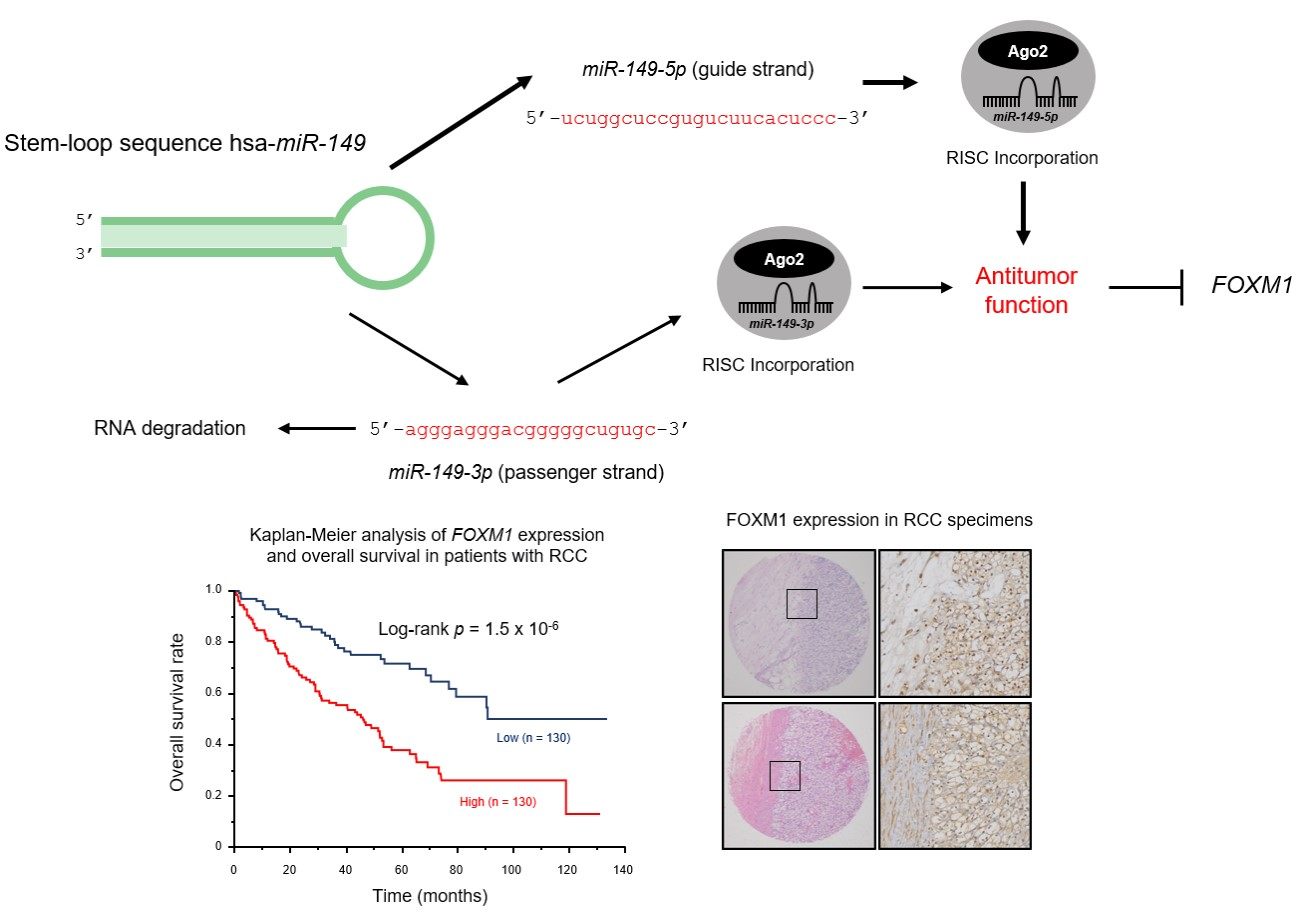
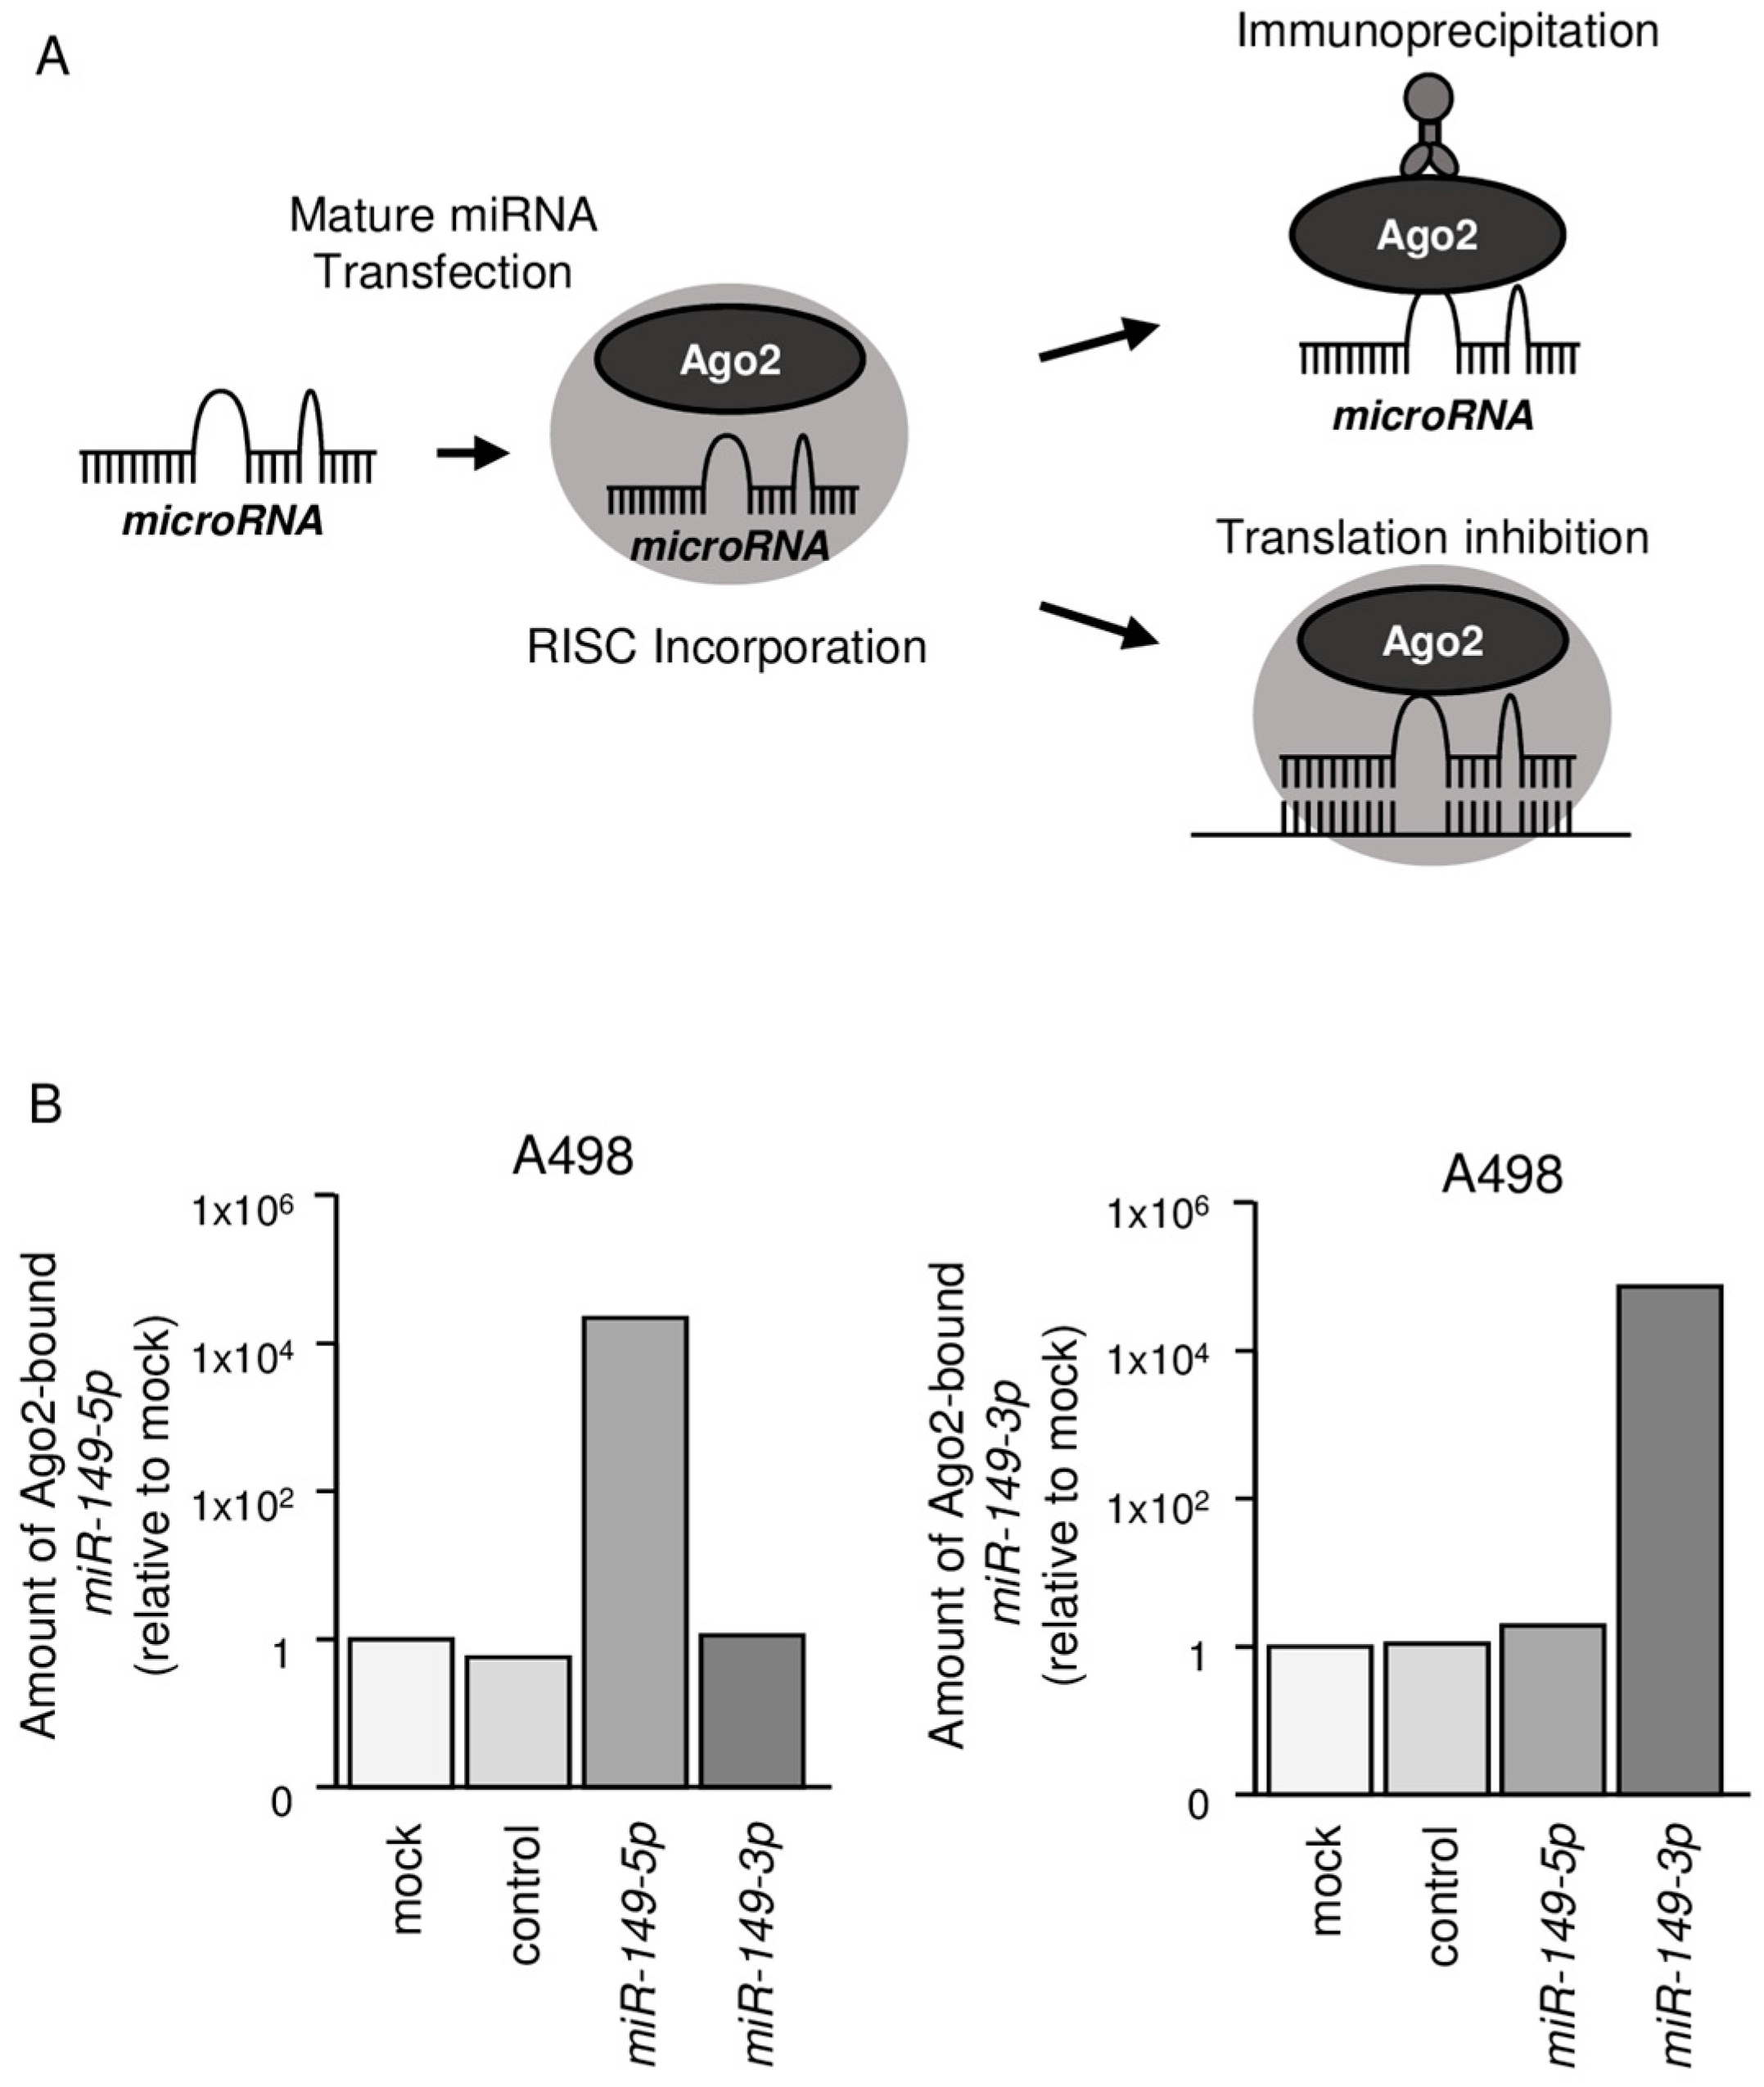
2.3. Both miR-149-5p and miR-149-3p Bind to Ago2

We hypothesized that both miR-149-5p and miR-149-3p may be incorporated into and function as part of the RISC. To test this hypothesis, we performed immunoprecipitation with antibodies targeting Ago2, which plays a central role in the RISC (Figure 2A). After transfection with miR-149-5p or miR-149-3p, Ago2-bound miRNAs were isolated, and qRT-PCR was carried out to determine whether miR-149-5p and miR-149-3p were bound to Ago2 (Figure 2B).
After transfection with miR-149-5p and immunoprecipitation with anti-Ago2 antibodies, miR-149-5p levels were significantly higher than those of mock- or miR control-transfected cells and those of miR-149-3p-transfected A498 cells (p < 0.0001; Figure 2B). Similarly, after transfection with miR-149-3p and immunoprecipitation with anti-Ago2 antibodies, miR-149-3p levels were significantly higher than those of mock- or miR control-transfected cells and those of miR-149-5p-transfected A498 cells (p < 0.0001; Figure 2B).

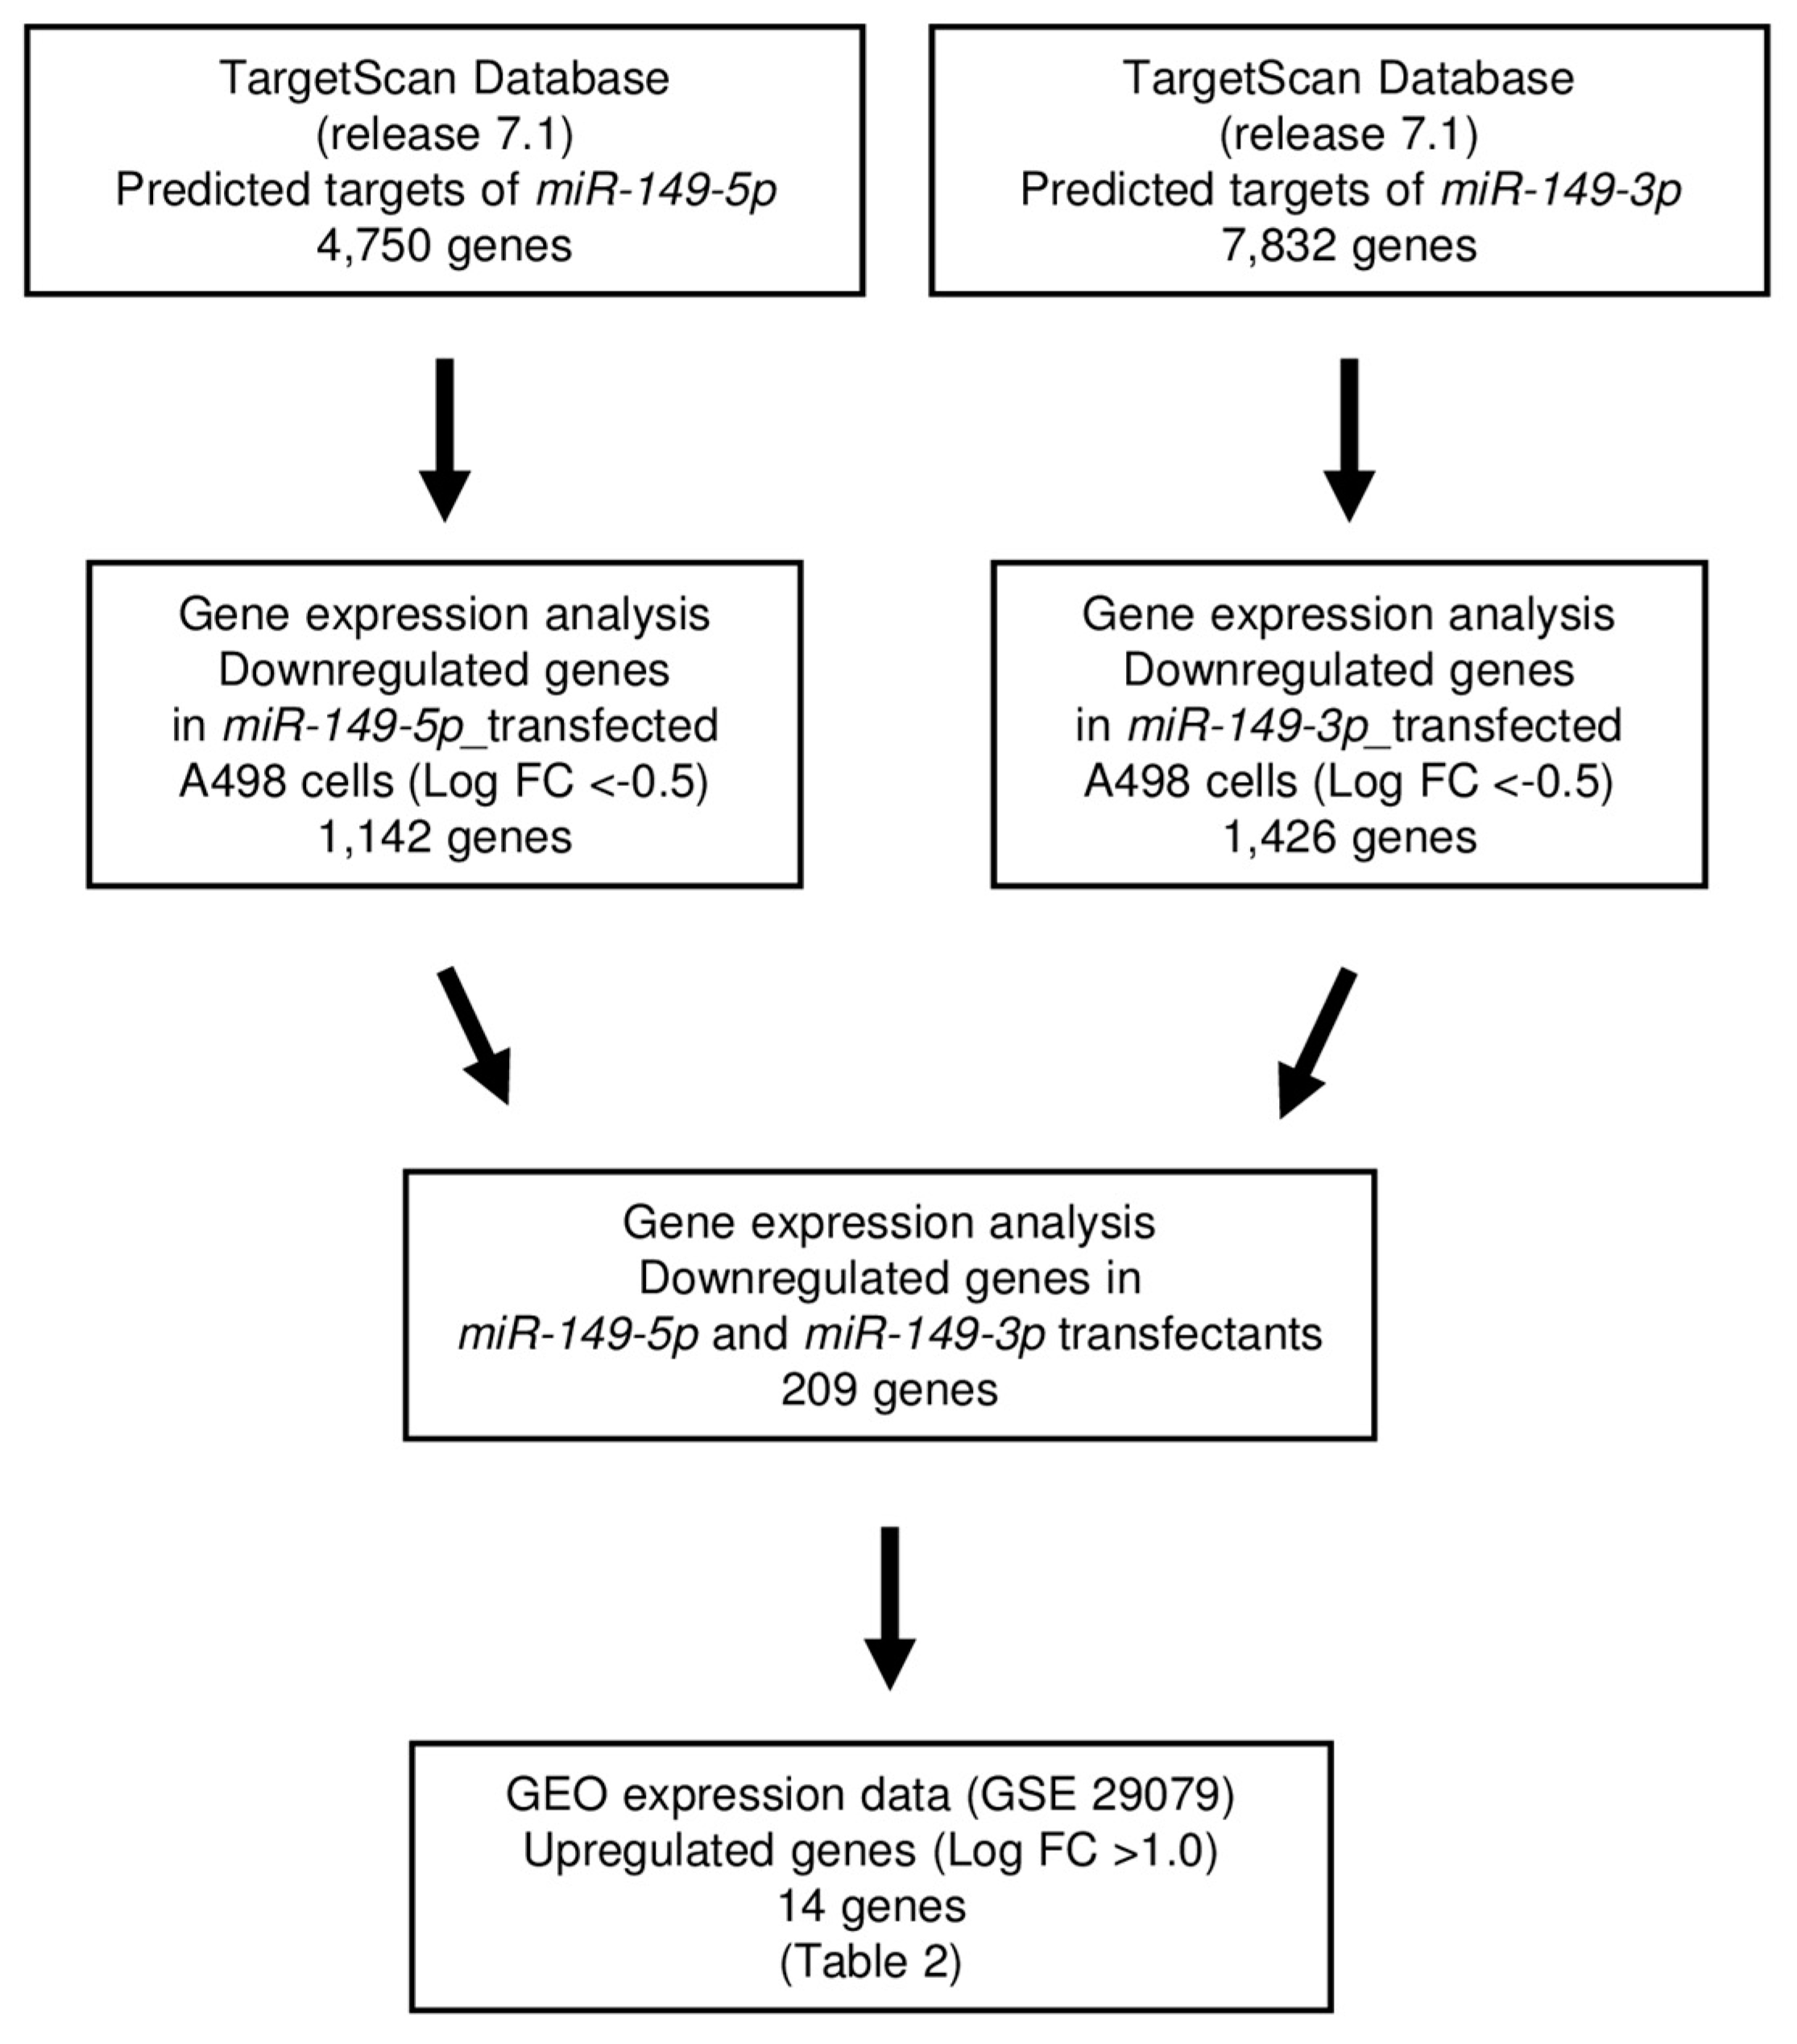
2.4. Screening of Target Genes Regulated by miR-149-5p and miR-149-3p in RCC Cells

Next, we sought to obtain further insights into the molecular mechanisms regulated by antitumor miR-149-5p and miR-149-3p in RCC cells. Thus, we screened the genes regulated by those miRNAs using in silico and genome-wide gene expression analyses. First, we performed in silico analyses. An analysis of the TargetScan database showed that 4750 genes and 7832 genes had putative target sites for miR-149-5p and miR-149-3p, respectively, in their 3′-UTRs. Next, we merged the data for the gene expression analysis data in miR-149-5p and miR-149-3p transfectants (GSE100746). Finally, we found 14 genes that were upregulated (fold-change log2 > 1.0) in cancer tissues by Gene Expression Omnibus (GEO) database analyses (GEO accession number: GSE22541 and GSE36895). We examined the Kaplan–Meier plot for these genes in RCC using the OncoLnc and cBioPortal database [20,21,22]. Our strategy for analysis is shown in Figure 3. The putative target genes regulated by dual strands of miR-149, i.e., miR-149-5p and miR-149-3p, are summarized in Table 2. Among them, we focused on FOXM1 because it showed the most significant difference in log rank tests using the OncoLnc database.

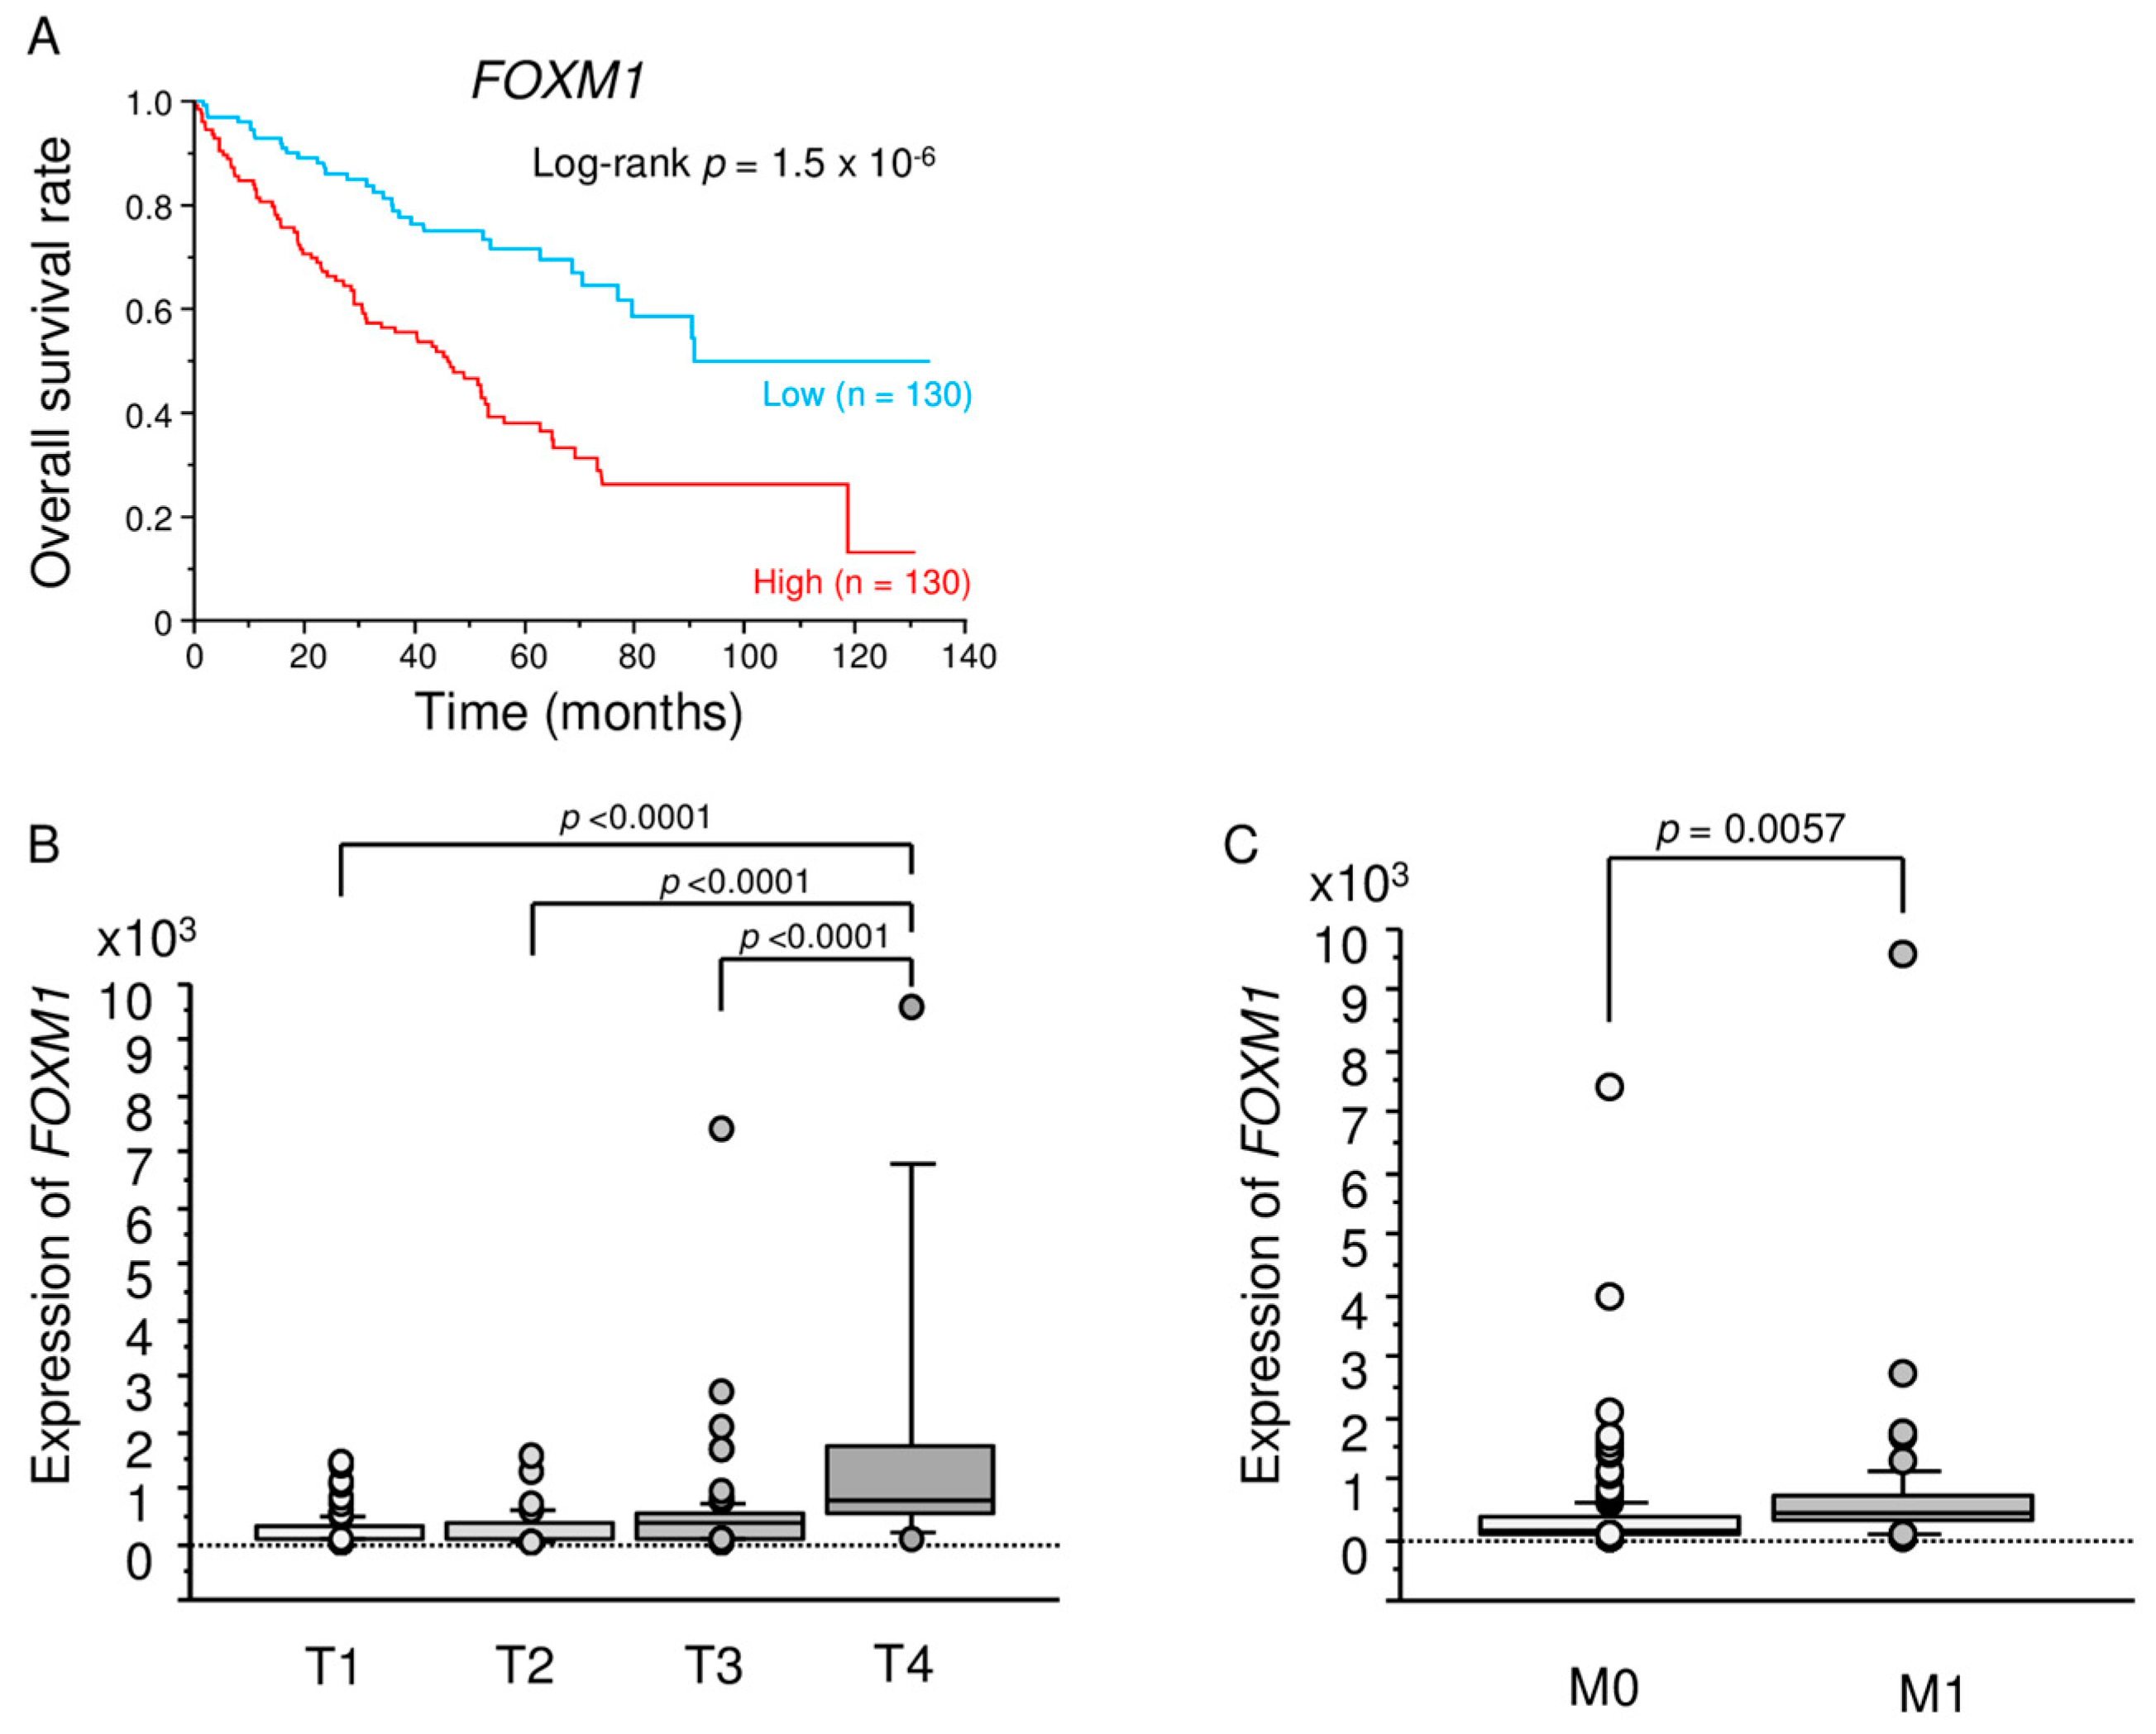
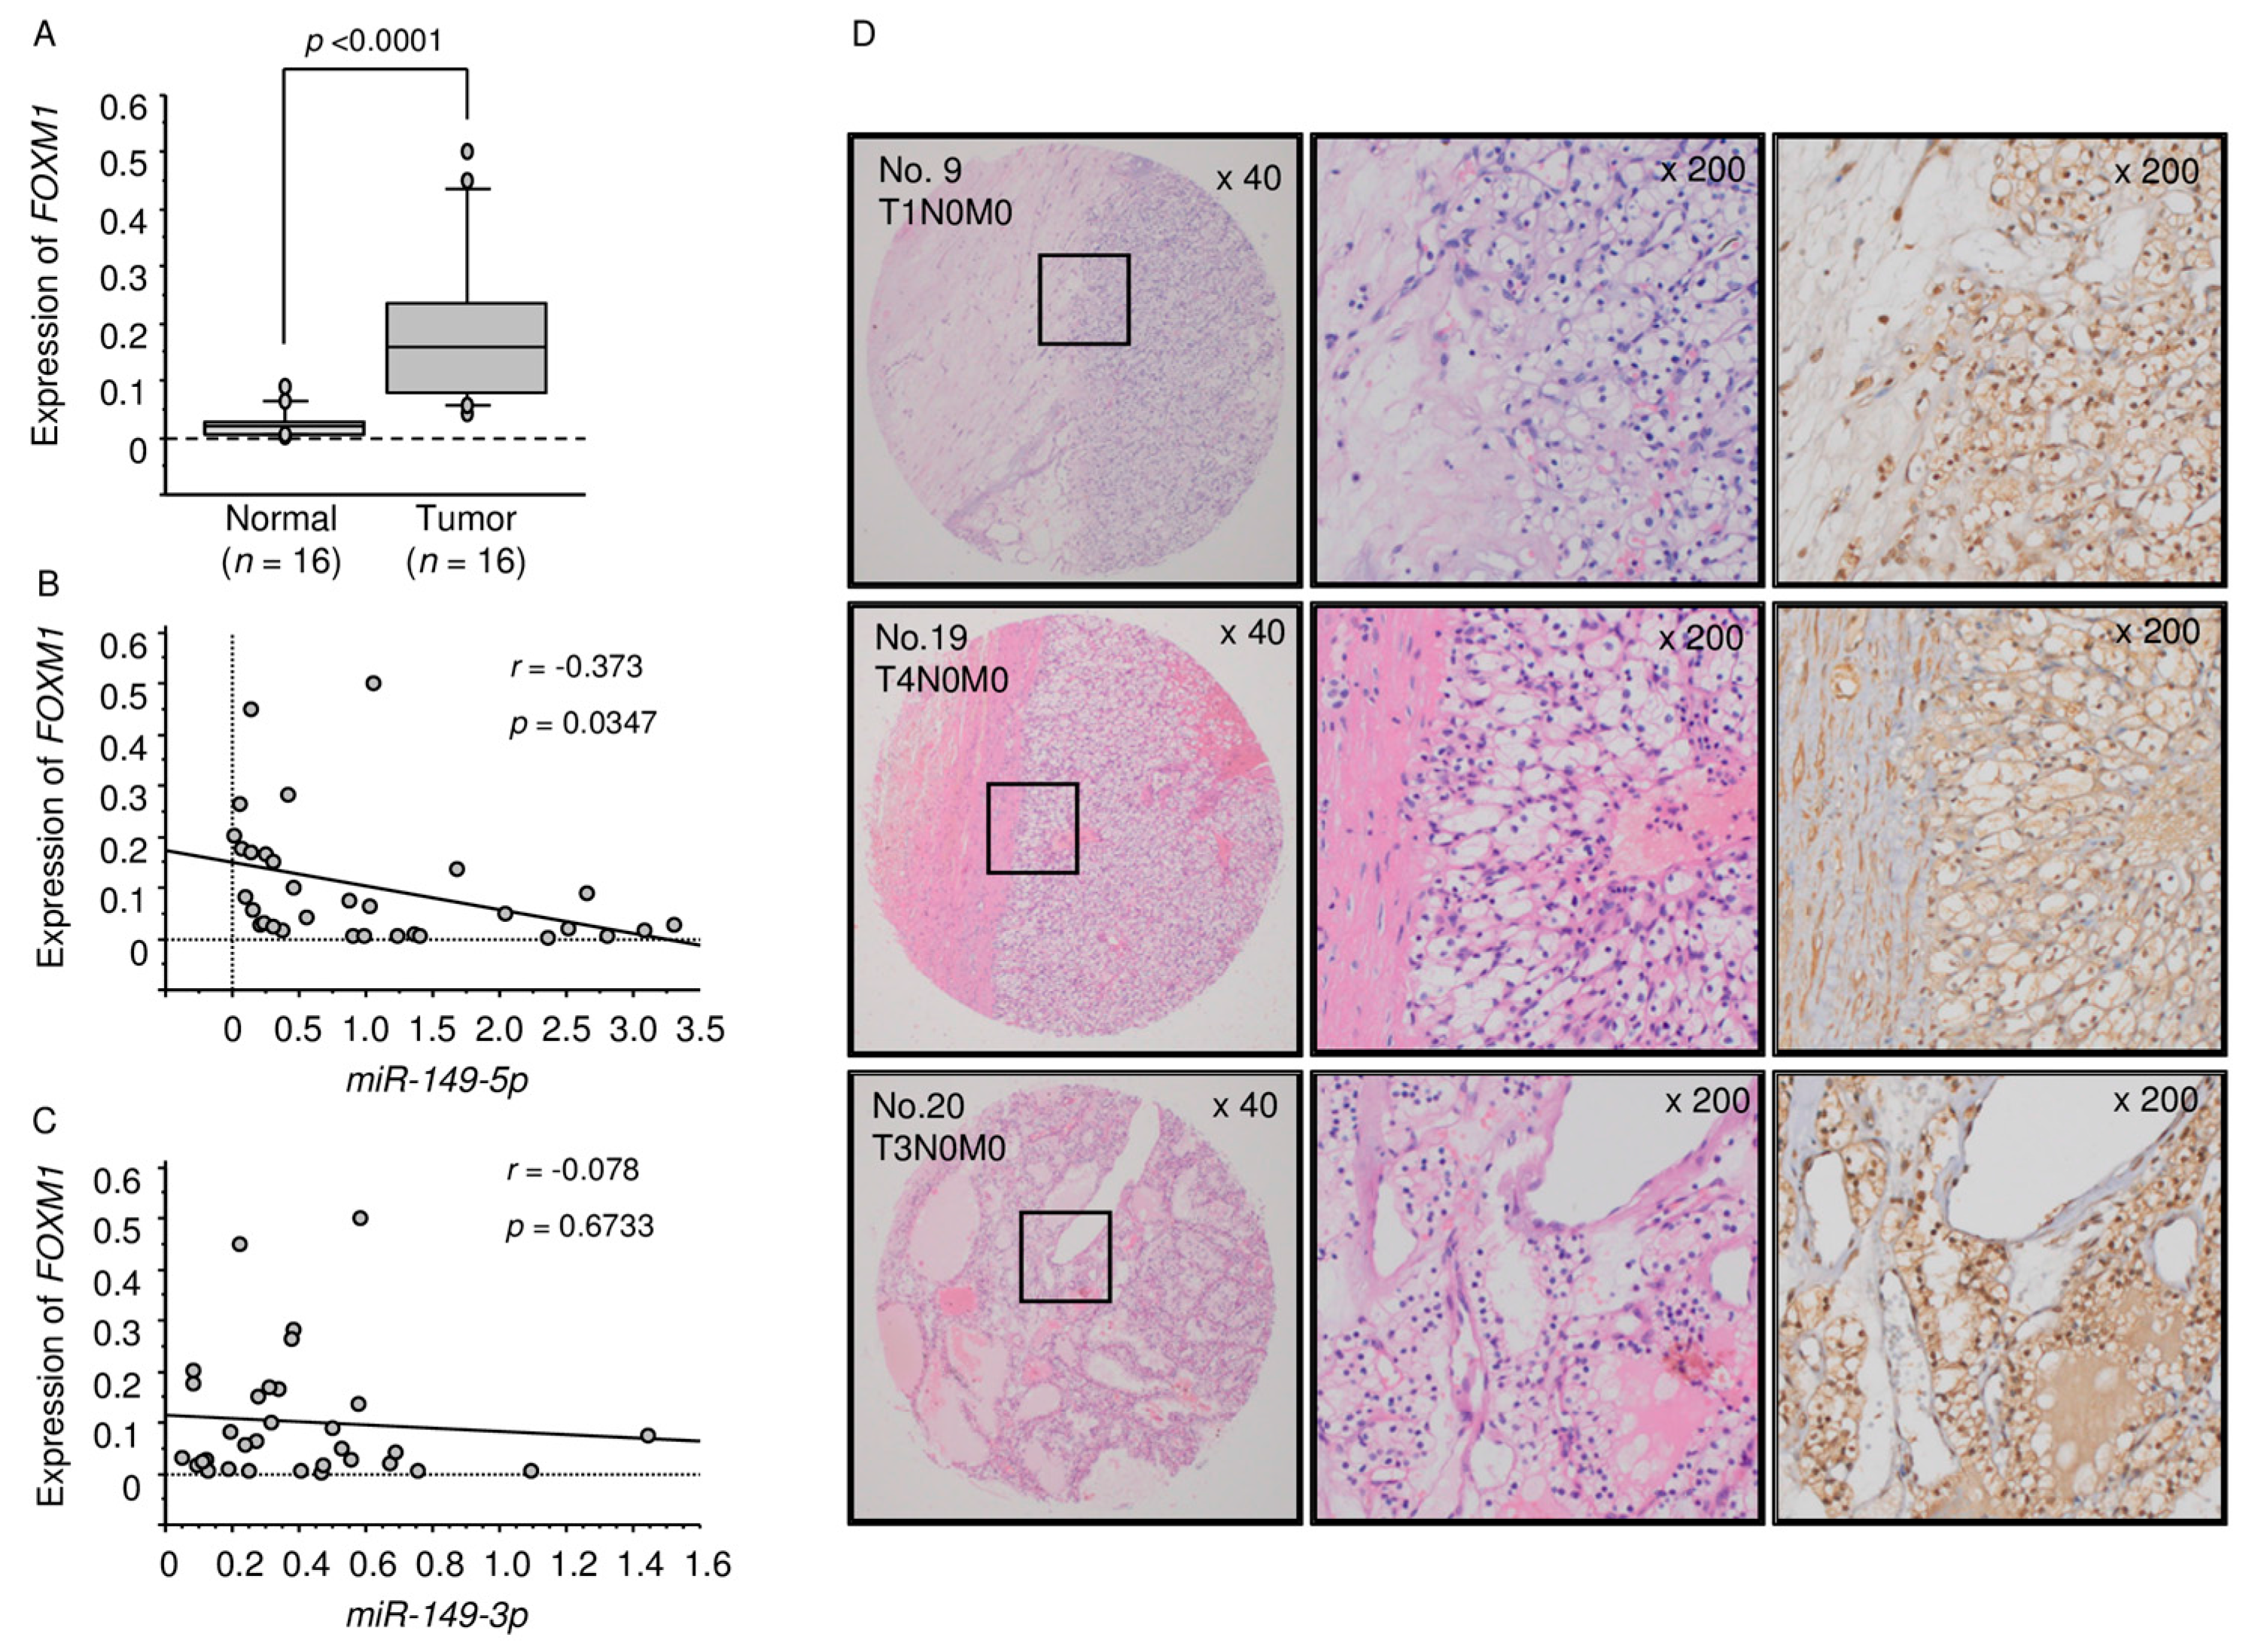
2.5. Analysis of FOXM1 Expression in ccRCC Clinical Specimens by qRT-PCR and Immunohistochemistry

We used qRT-PCR and immunohistochemical staining to examine the expression levels of FOXM1 in ccRCC specimens. The expression of FOXM1 was significantly upregulated in cancer tissues compared with normal tissues (p < 0.0001; Figure 4A). Spearman’s rank tests showed a negative correlation between the expression levels of FOXM1 and miR-149-5p (p = 0.0347 r = −0.373; Figure 4B), but there was no correlation between FOXM1 and miR-149-3p (Figure 4C). FOXM1 protein expression was strongly expressed in several cancer tissues (patient No. 9, 19, 20), whereas low expression was observed in normal tissues using a tissue microarray (Figure 4D).

2.6. TCGA Database Analysis of Dual Strands of Pre-miR-149 and FOXM1

We analysed Kaplan-Meier overall survival (OS) curves according to the expression levels of dual strands of pre-miR-149 and FOXM1 and the relationships between FOXM1 expression and tumor stage and metastasis in ccRCC using the TCGA-KIRC database. The TCGA dataset showed that high expression of miR-149-5p was associated with a poor prognosis of the patients with RCC. The miR-149-3p data was not available in this database (data not shown). The Kaplan–Meier curves for OS rates showed that the group with high expression of FOXM1 had a significantly shorter survival than the low expression group in ccRCC (p = 1.5 × 10⁻⁶, Figure 5A). The expression levels of FOXM1 were significantly increased in advanced T stage cases and metastatic cases (Figure 5B,C).

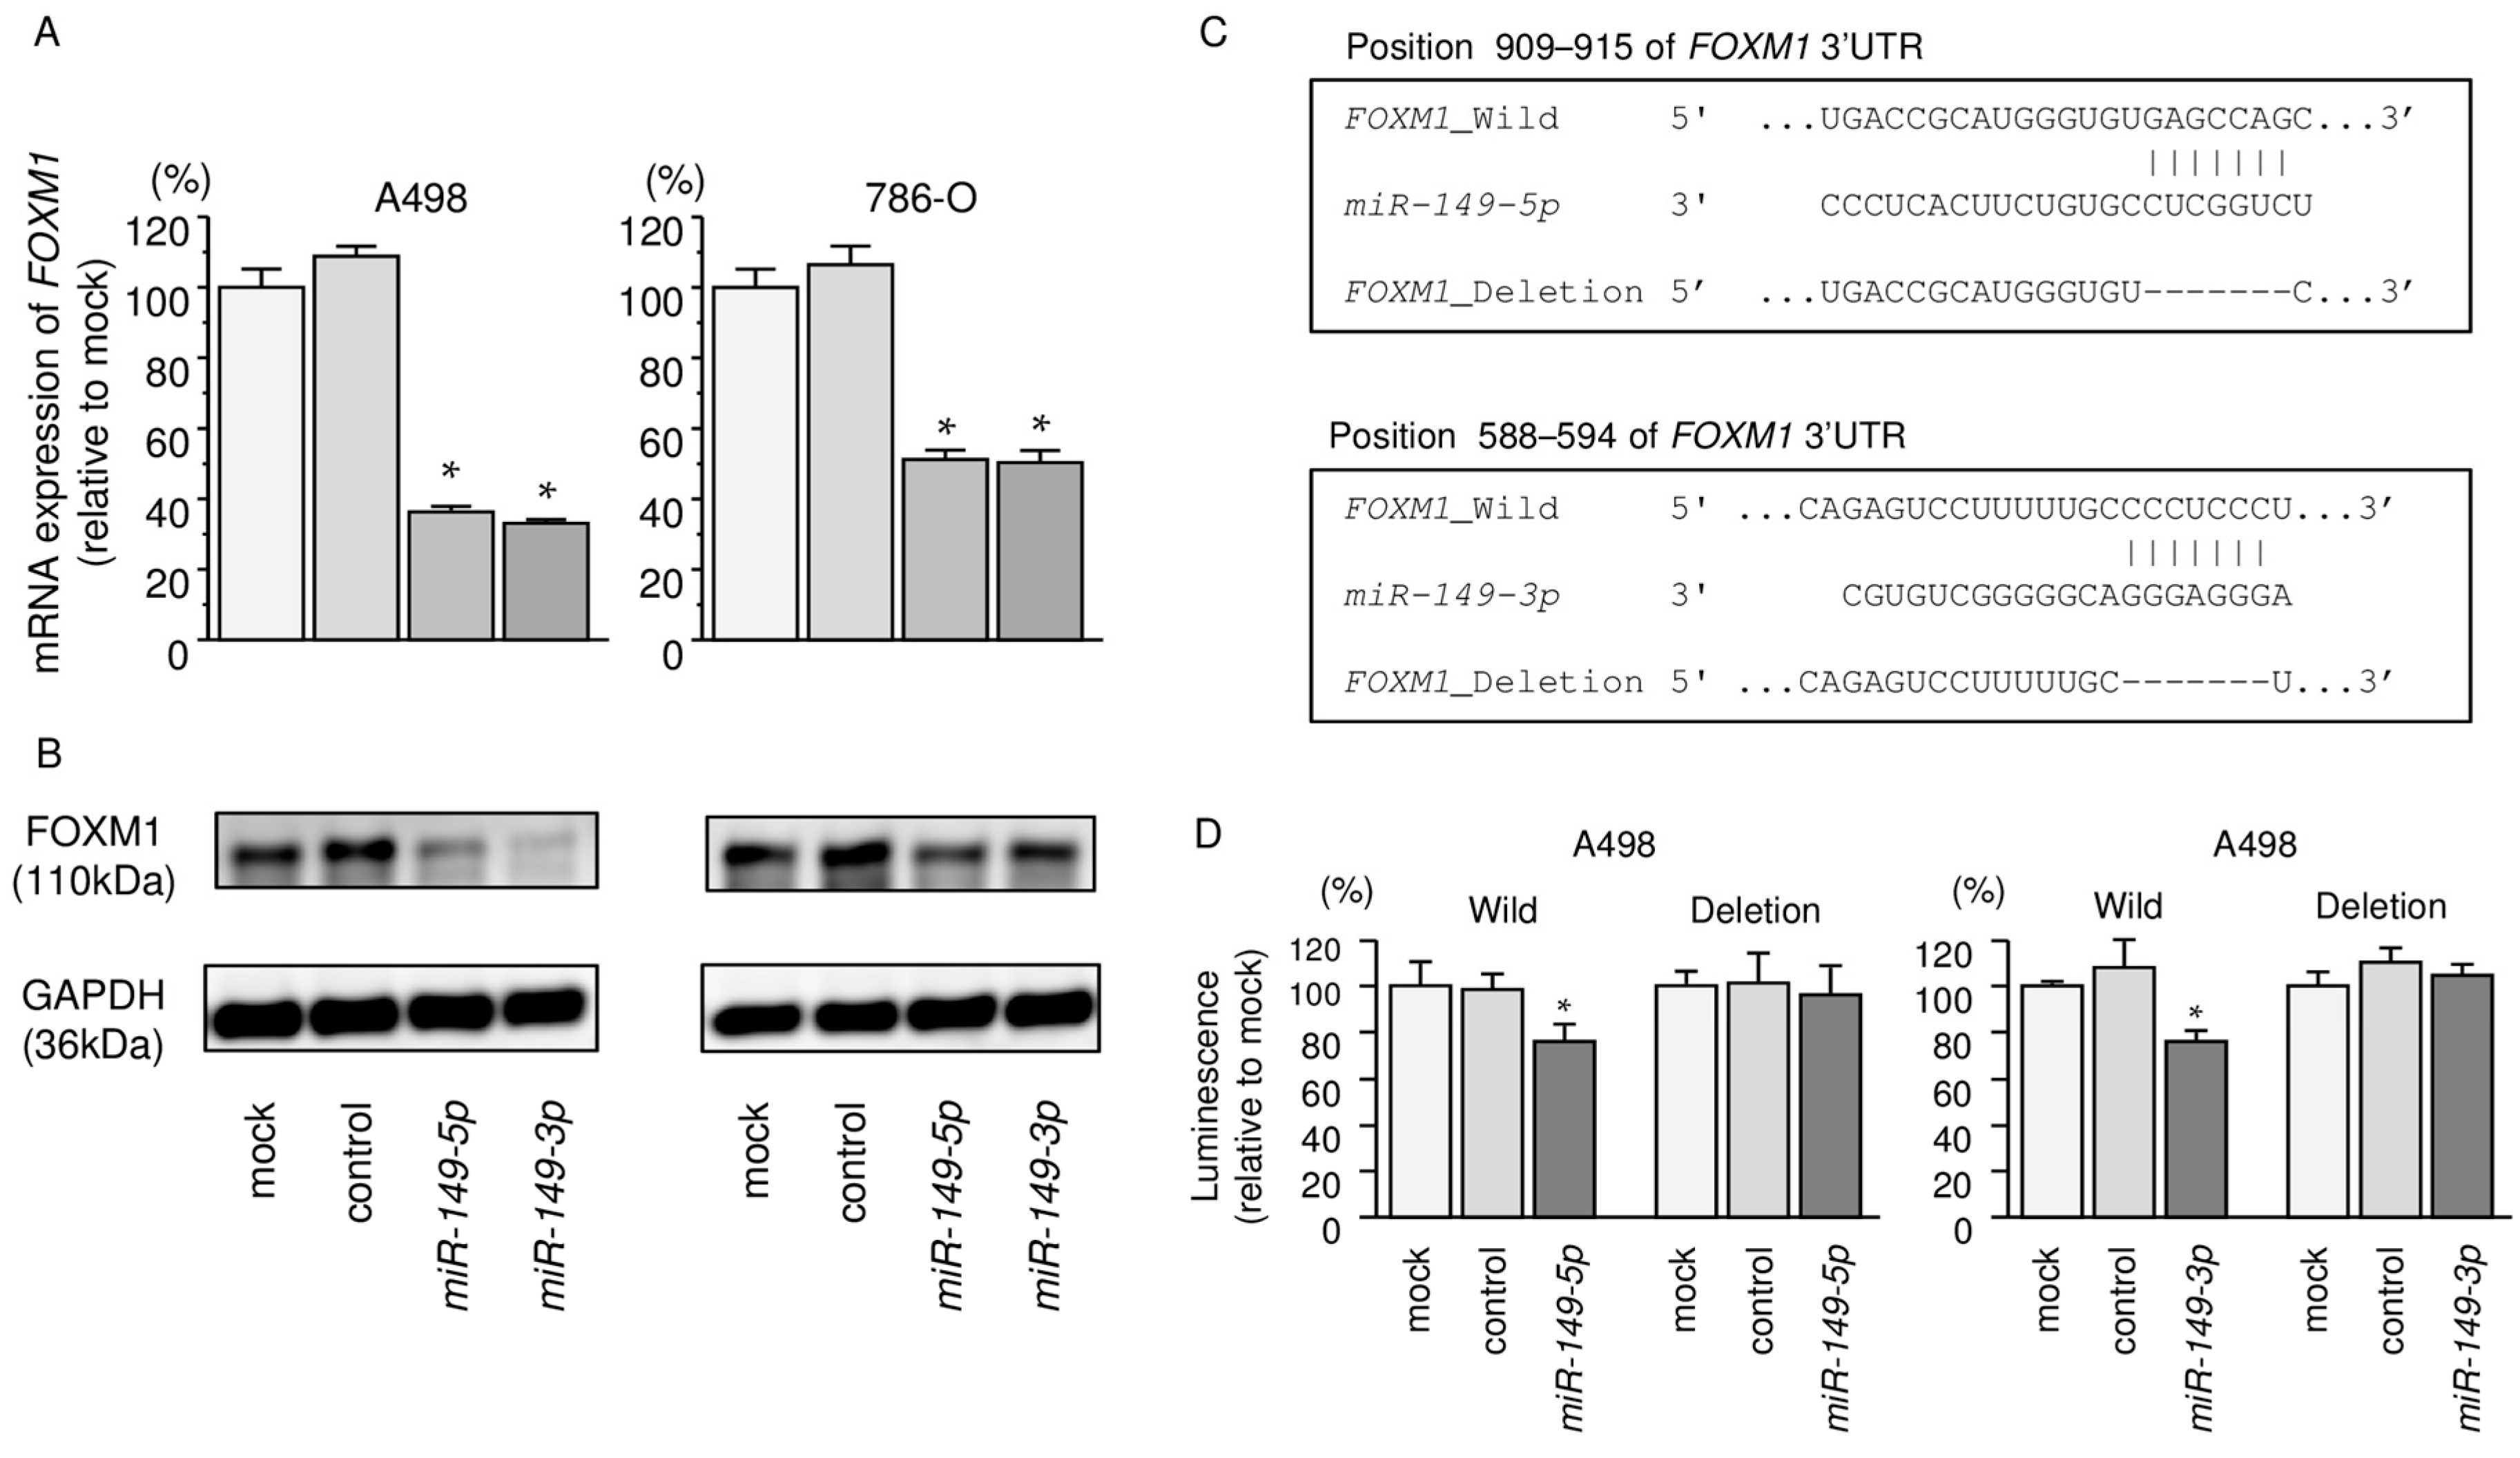
2.7. Regulation of FOXM1 Expression by miR-149-5p and miR-149-3p in RCC Cells

Our studies revealed that FOXM1 mRNA was significantly reduced in both miR-149-5p and miR-149-3p transfectants in comparison with mock or miR-control transfectants (p < 0.0001 and p < 0.0001; Figure 6A). The expression of FOXM1 protein was also repressed in these miRNA transfectants (Figure 6B). The target prediction databases indicated that both miR-149-5p and miR-149-3p had one putative target site in the 3′-UTR of FOXM1 for miR-149-5p (position 909–915) and miR-149-3p (positions 588–594) (Figure 6C). We performed a dual luciferase reporter assay. The TargetScan database identified one putative target site in the 3′-UTR of FOXM1 for miR-149-5p (position 909–915) and miR-149-3p (positions 588–594). We used vectors encoding a partial wild-type sequence of the 3′-UTR of FOXM1 mRNA, including the predicted miR-149-5p and miR-149-3p target site, or a vector lacking the miR-149-5p and miR-149-3p target sites. We found that the luminescence intensity was significantly reduced by co-transfection with miR-149-5p or miR-149-3p and the vector carrying the wild-type 3′-UTR of FOXM1 (p < 0.001; Figure 6D).

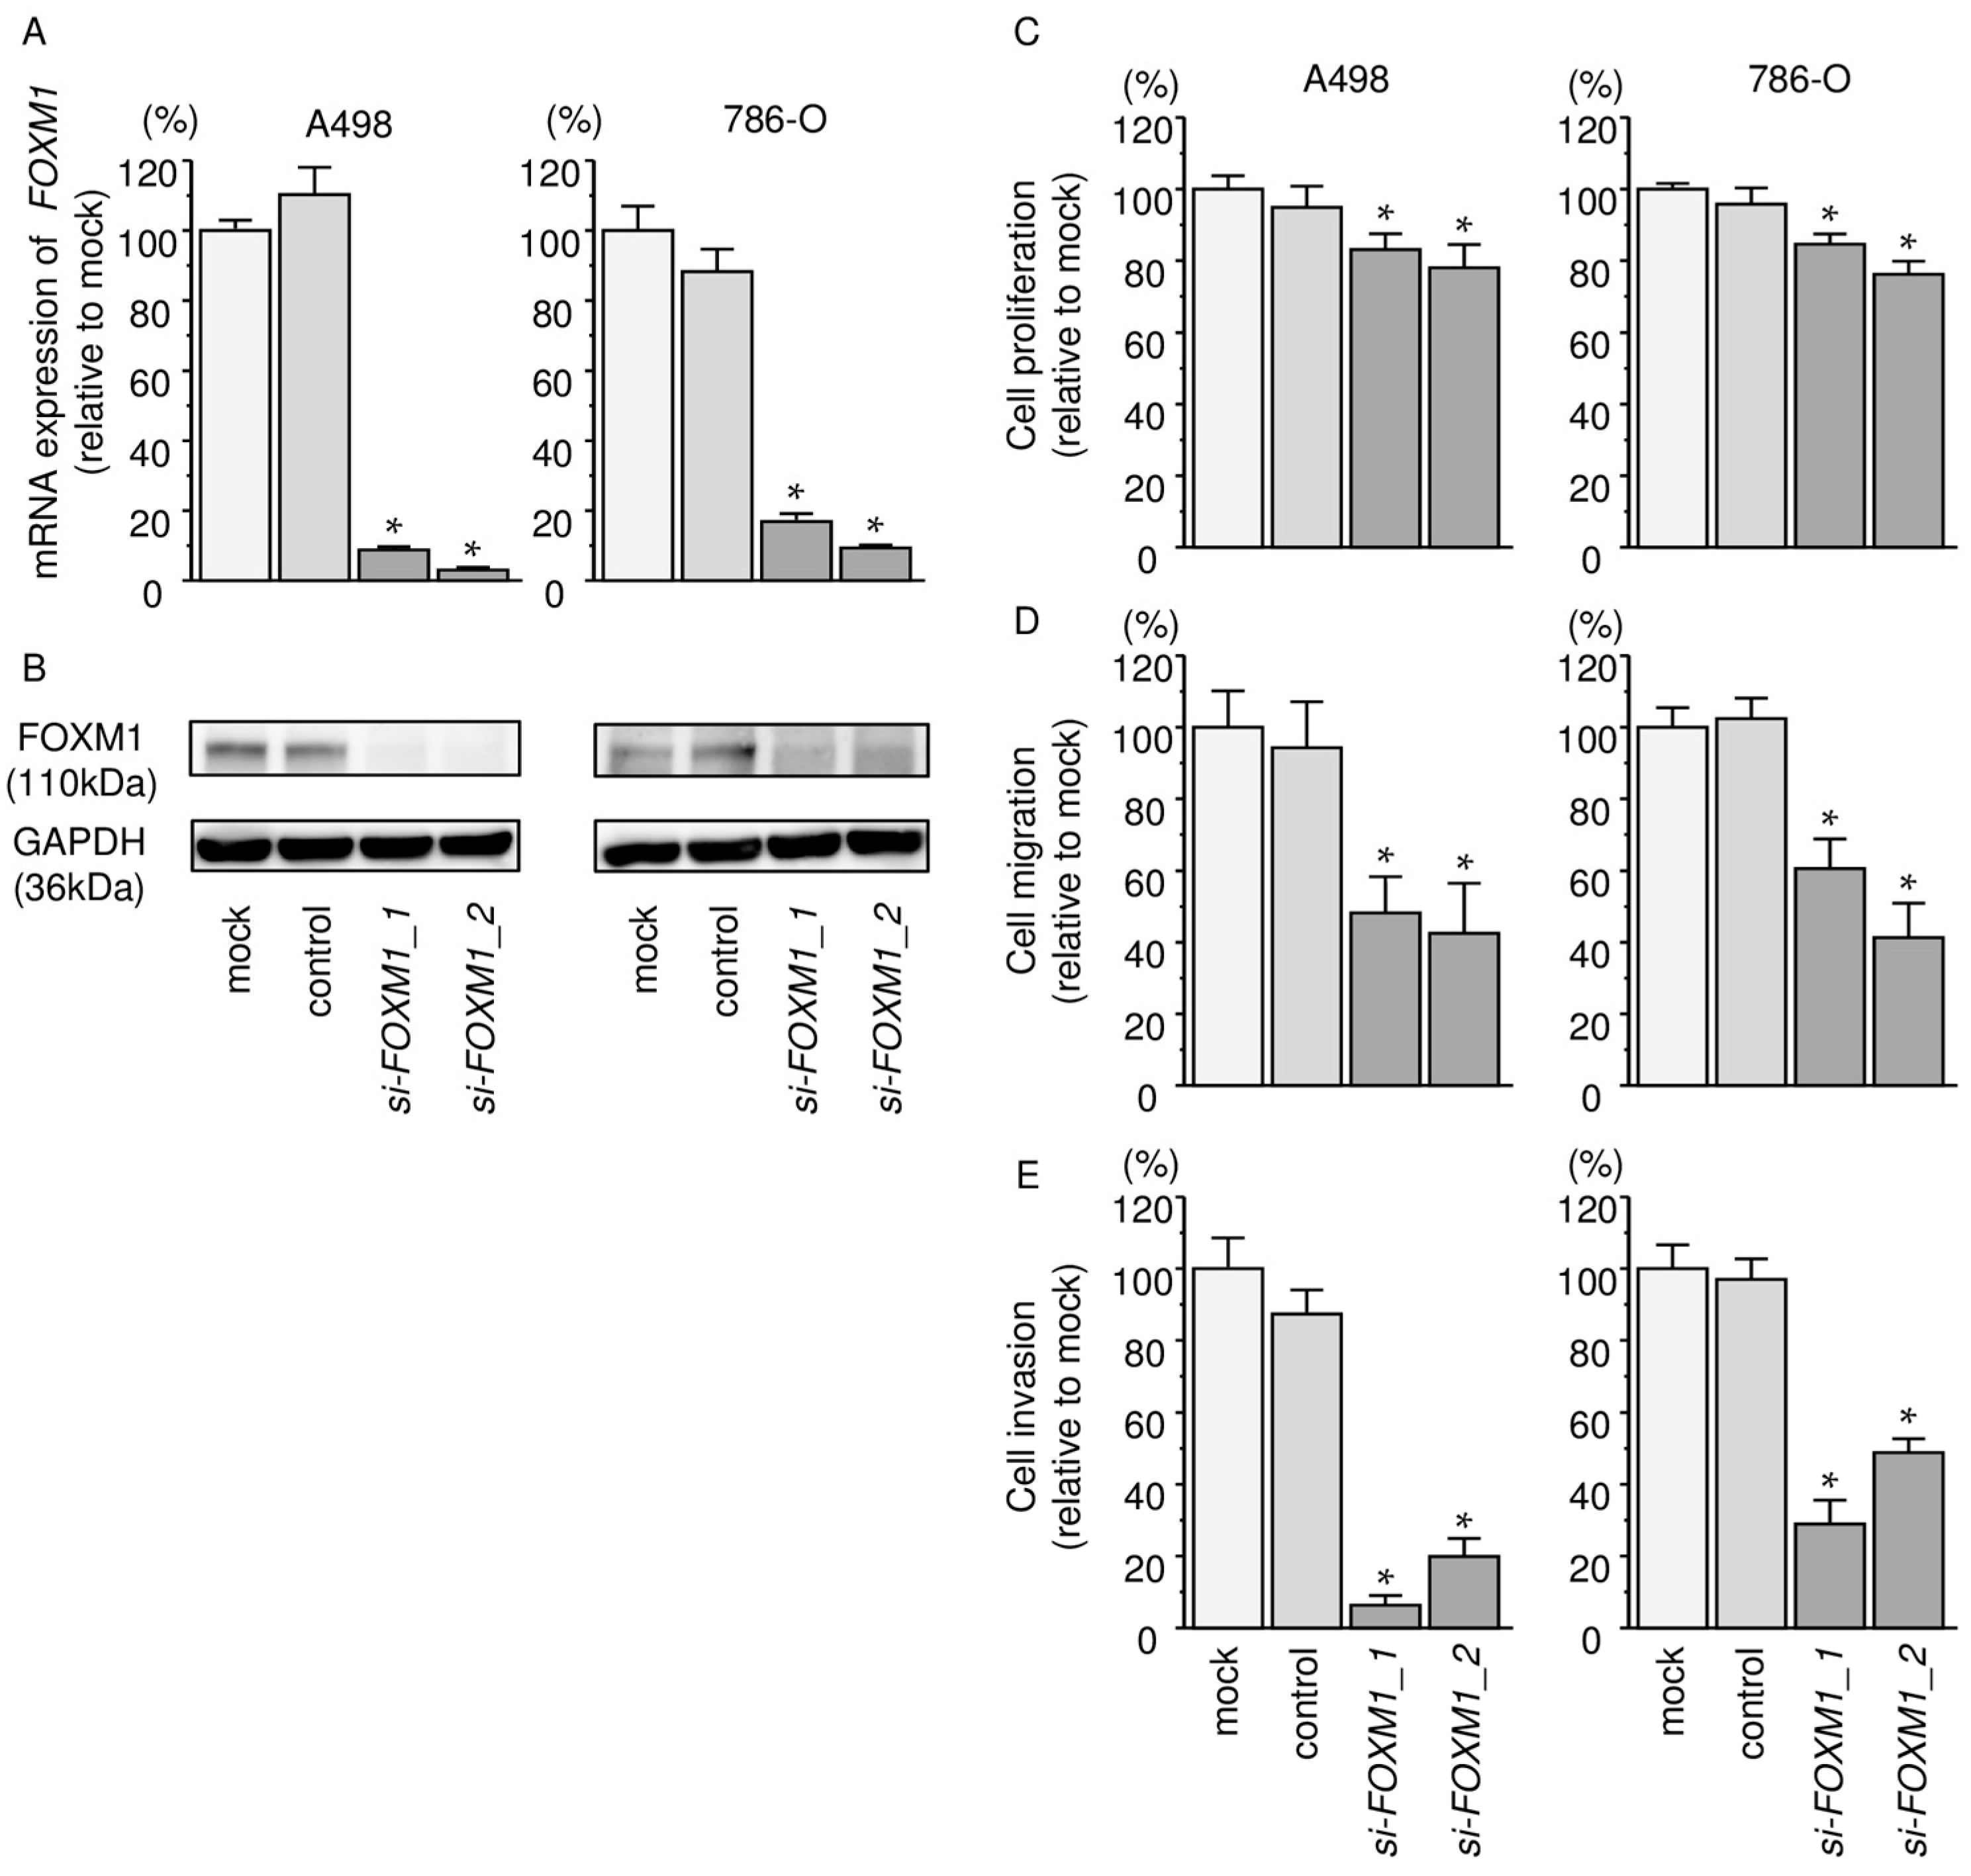
2.8. Effects of Silencing FOXM1 on Cell Proliferation, Migration, and Invasion in RCC Cells

We evaluated the knockdown efficiency of si-FOXM1 transfection in RCC cells. Our present data showed that si-FOXM1 transfection effectively downregulated FOXM1 expression in A498 and 786-O cells (Figure 7A,B). Functional assays demonstrated that cell proliferation, migration, and invasion were all inhibited in si-FOXM1 transfectants compared with mock- or miR control-transfected cells (p < 0.0001, Figure 7C–E).

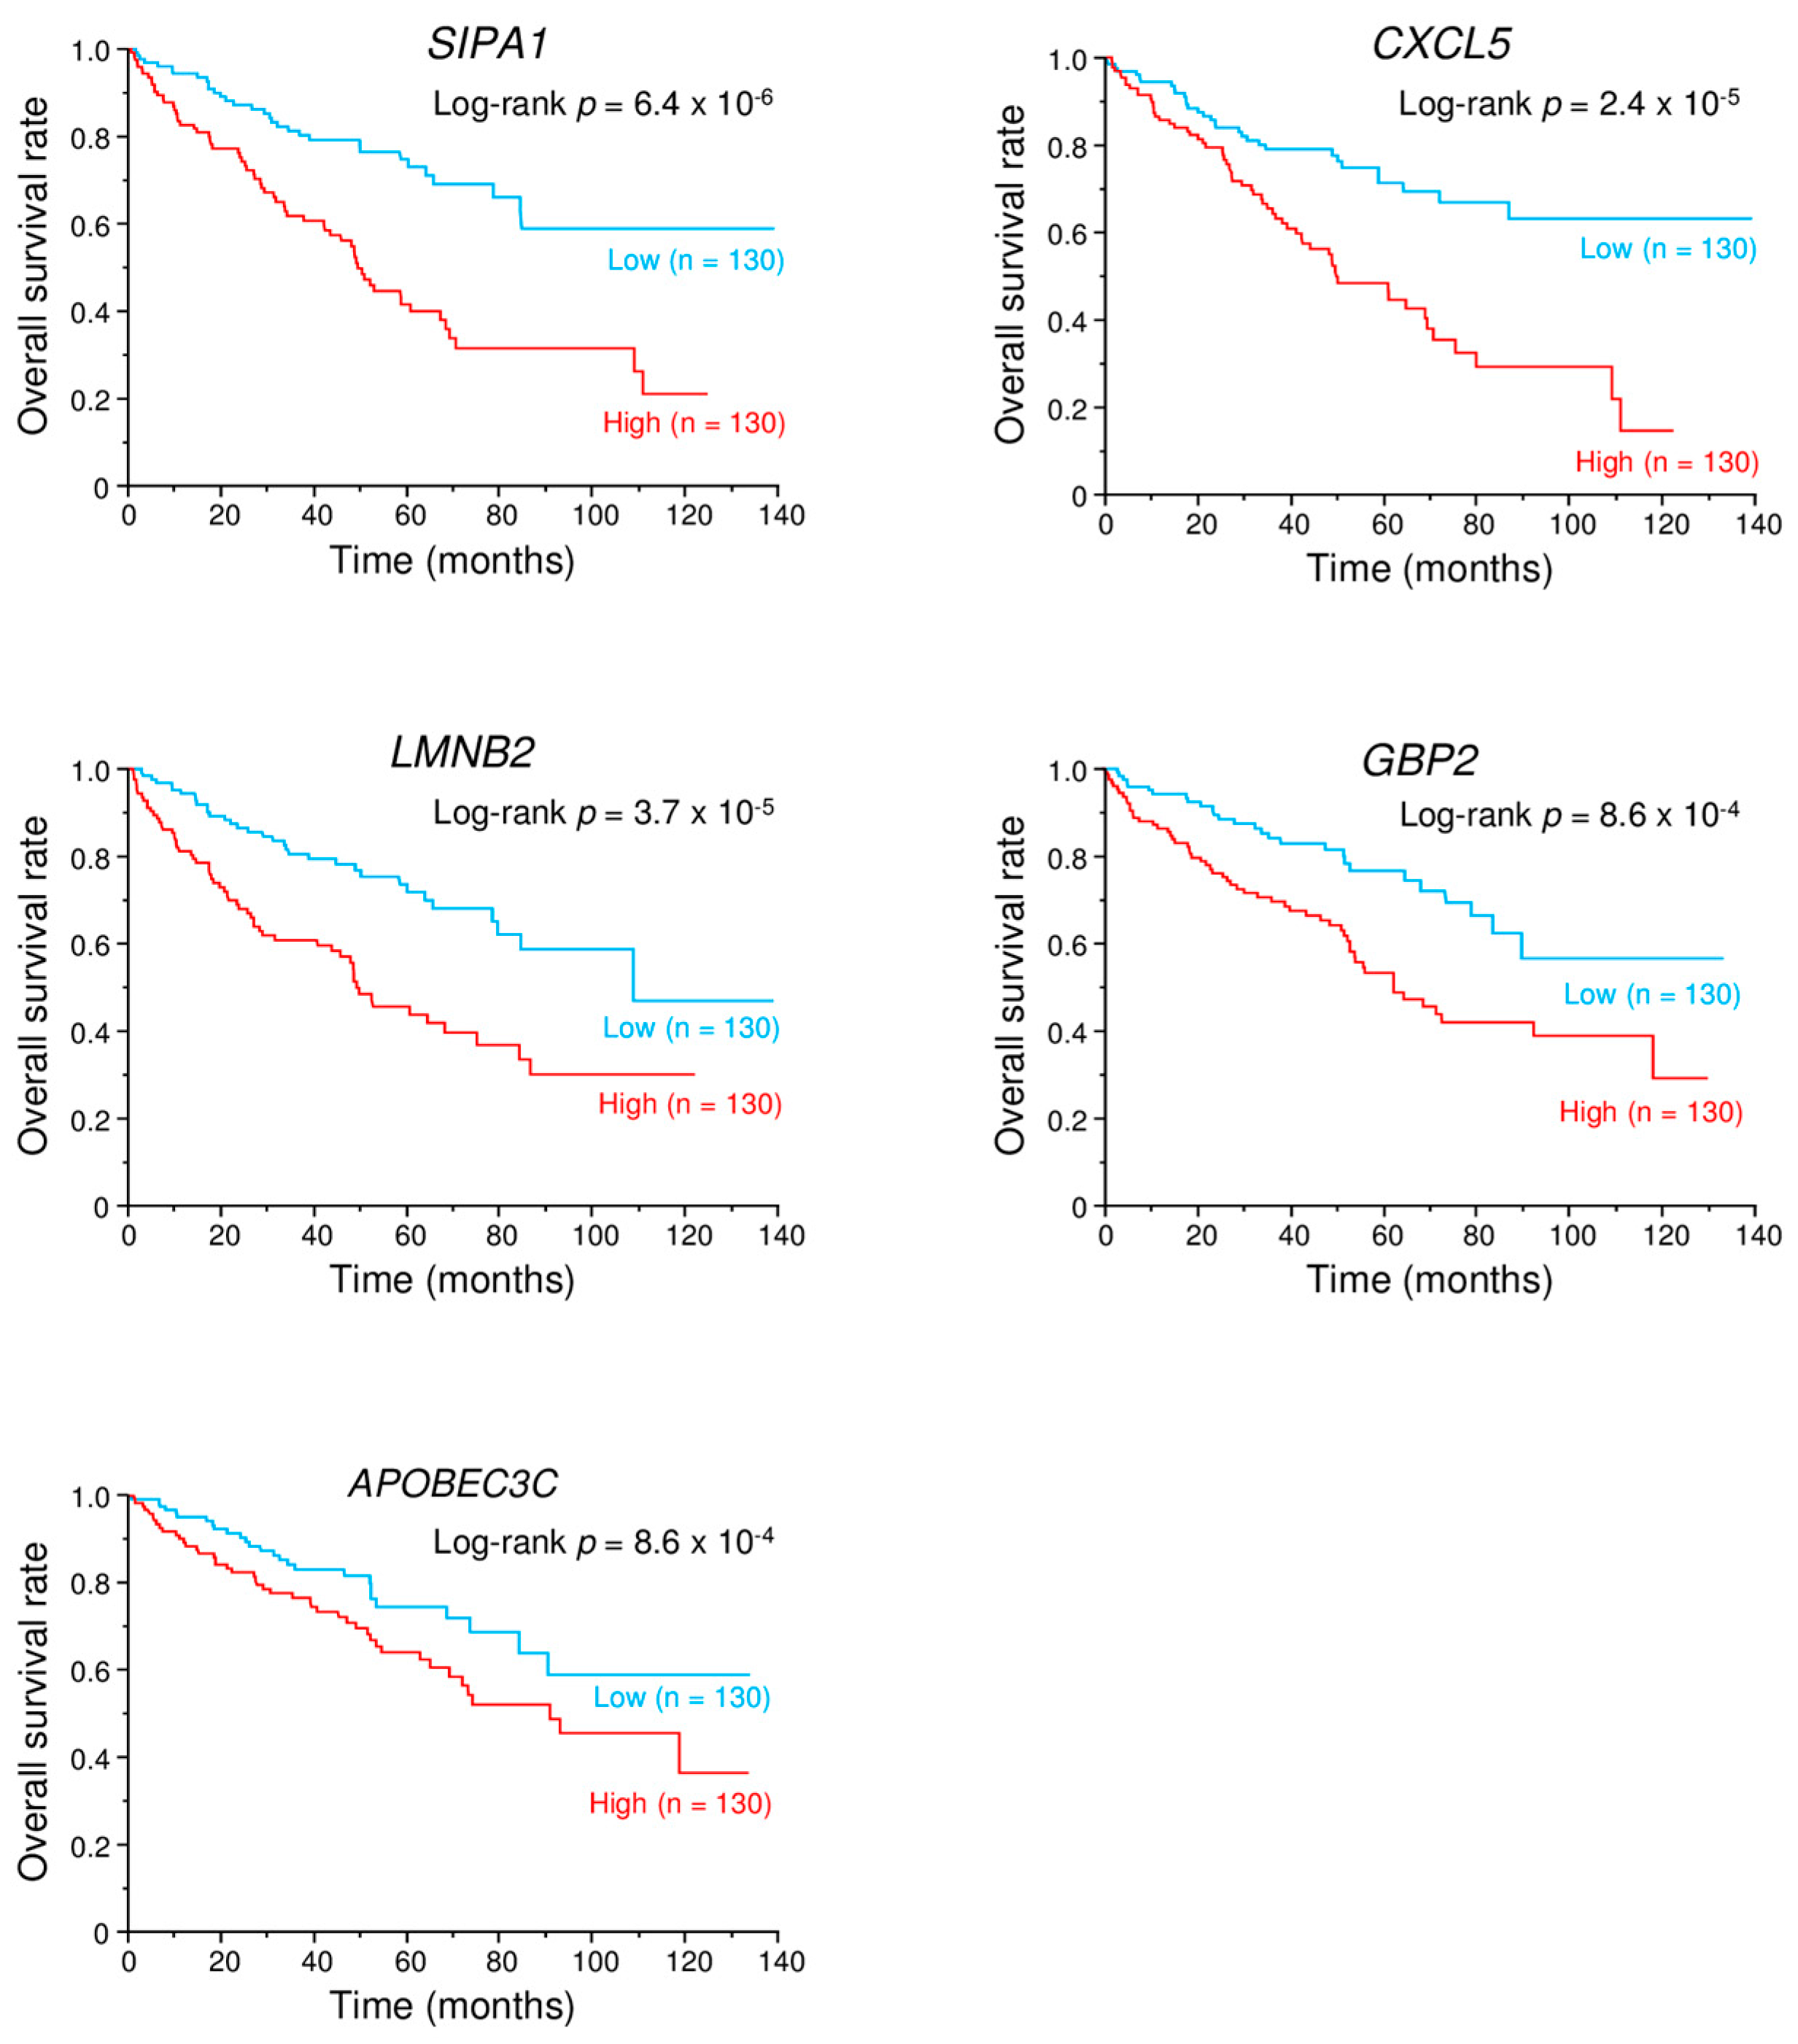
2.9. Kaplan–Meier Survival Curves and Genes Affected by miR-149-5p and miR-149-3p

To investigate the contribution of miR-149-5p and miR-149-3p to the coordinate regulation of genes (Table 2) in ccRCC pathogenesis, we searched the TCGA database. Among 14 genes, the expression of 6 genes (FOXM1, SIPA1, CXCL5, LMNB2, GBP2, and APOBEC3C) was significantly associated with a poor prognosis of patients with ccRCC (Figure 8).

3. Discussion

Currently approved targeted therapies have improved the management of patients with metastatic RCC. However, the use of these targeted therapies is restricted to advanced stages of RCC [23]. The elucidation of molecular mechanisms of relapse, metastasis and drug resistance is indispensable to improve the prognosis of RCC patients. To identify novel pathologic molecular mechanisms in RCC, our research group has identified RCC oncogenic pathways based on antitumor miRNAs that were identified by examining RCC miRNA signatures [9]. For example, lysyl oxidase homolog 2 (LOXL2) was overexpressed in RCC clinical specimens. Importantly, the antitumor miR-29 family (miR-29a/b/c) targeted LOXL2 and inhibited cancer cell migration and invasion [24]. More recently, it was found that miR-101 was significantly reduced in sunitinib-treated RCC tissues and the ectopic expression of miR-101 inhibited RCC cell aggressiveness through its targeting of ubiquitin-like with PHD and ring finger domains 1 (UHRF1) [9]. Our antitumor miRNAs-based strategy is an attractive approach for the identification of novel regulatory networks in cancer cells.
Our present data demonstrated that dual strands of pre-miR-149, miR-149-5p and miR-149-3p, acted as antitumor miRNAs in RCC cells. The antitumor function of miR-149-5p was reported in several other types of cancer [25,26]. In breast cancer, miR-149-5p was downregulated by the hyper-methylation of its promoter region and was found to be involved in Adriamycin-resistant breast cancer cells targeting GlcNAc N-deacetylase/N-sulfotransferase-1 (NDST1) [27]. In hepatocellular carcinoma, miR-149-5p was significantly downregulated and its expression was correlated with distant metastases and TNM classification [26]. An overexpression of miR-149-5p suppressed the migration and invasion activities of hepatocellular carcinoma cells [26]. In colorectal carcinoma, the expression of miR-149-5p regulated cell growth, migration, and invasion through its targeting of the EPH receptor B3 gene (EphB3), and the knockdown of EphB3 inhibited tumor growth by in vivo assays [28].
In contrast to miR-149-5p, few reports have described the function of miR-149-3p in cancer cells. Dioscin is a natural product that induces apoptosis and suppresses tumor growth in pancreatic cells [29]. The expression level of miR-149-3p was upregulated by dioscin, and miR-149-3p inhibited the Akt1 signaling pathway [29]. A major bioactive component in licorice root is 18β-glycyrrhetinic acid (GRA). It reportedly possesses antitumor effects in several cancers [30,31,32]. In gastric cancer tissues, miR-149-3p was downregulated, but its expression was upregulated by GRA treatment [33]. The overexpression of miR-149-3p inhibited gastric cancer cell proliferation and cell cycle progression [33]. In these analyses, we did not detect the downregulation of the passenger strand of miR-149-3p in RCC tissues. However, the ectopic expression of miR-149-3p inhibited cancer cell aggressiveness in RCC cells. This fact indicates that the passenger strand of miR-149-3p may possess cancer-suppressing functions in RCC cells. These findings strongly suggest that dual strands of pre-miR-149 act as antitumor miRNAs in human cancers.
Our recent studies demonstrated that dual strands of certain pre-miRNAs, e.g., pre-miR-145, pre-miR-139, and pre-miR-150, act as antitumor miRNAs. Each guide strand and passenger strand coordinately regulates oncogenic genes as observed in several cancers, e.g., pre-miR-145: MTDH and UHRF1; pre-miR-139: MMP11; pre-miR-150: SPOCK1 [18,19,34,35]. In this study, we speculate that miR-149-5p and miR-149-3p work together to regulate pathways in RCC cell progression and metastasis. Our present data showed that a total of 14 genes were putative targets of both miR-149-5p and miR-149-3p regulation in RCC cells. Interestingly, among the candidate genes, the expression of 6 genes (FOXM1, SIPA1, CXCL5, LMNB2, GBP2, and APOBEC3C) was associated with a poor prognosis of patients with RCC by TCGA analyses (Figure 8).
In this study, we focused on FOXM1 as a target of the dual strands of pre-miR-149 and validated the direct binding of these miRNAs to the 3′-UTR using luciferase reporter assays. Past studies have shown that FOXM1 was regulated by miR-149-5p in colorectal cancer and non-small cell lung cancer [36,37]. This is the first study to report that dual strands of pre-miR-149 coordinately regulate FOXM1 in RCC cells. FOXM1 is a member of the forkhead transcription family of proteins, and it plays pivotal roles in cell cycle progression in normal cells [38]. An overexpression of FOXM1 has been detected in a broad range of human cancers, including RCC [39,40,41]. Our present data demonstrated that the knockdown of FOXM1 in tumor cells by RNAi reduced cell proliferation, migration, and invasion, suggesting that FOXM1 acts as an oncogene in RCC cells. Moreover, recent meta-analyses have indicated that high expression of FOXM1 was significantly associated with poor overall survival in most solid tumors [42,43]. Taken together, the expression of FOXM1 is a useful biomarker for the prognosis of human cancers and a potential therapeutic target in RCC cells. Authors should discuss the results and how they can be interpreted in perspective of previous studies and of the working hypotheses. The findings and their implications should be discussed in the broadest context possible. Future research directions may also be highlighted.

4. Materials and Methods

4.1. Clinical ccRCC Specimens

Clinical ccRCC specimens were obtained from patients who were admitted to Chiba University Hospital and had undergone radical nephrectomy from 2012 to 2015. A total of 16 pairs of ccRCC specimens and adjacent non-cancerous specimens were collected. The clinicopathological characteristics of the patients are summarized in Table 1. These samples were staged according to the UICC TNM classification [44]. All patients in this study provided written informed consent for tissue donation for research purposes. The protocol was approved by the Institutional Review Boards of Chiba University Hospital (identification code: No. 484, 30 August 2011).

4.2. Tissue Collection and Cell Culture

Clinical specimens were immersed in RNAlater (Thermo Fisher Scientific, Waltham, MA, USA) and stored at 4 °C until RNA was extracted. Human ccRCC cells (A498 and 786-O cells) were obtained from the American Type Culture Collection (Manassas, VA, USA).

4.3. Quantitative Real-Time Reverse Transcription Polymerase Chain Reaction (qRT-PCR)

Stem-loop RT-PCR (TaqMan MicroRNA Assays; product ID: 002255 for miR-149-5p and 002164 for miR-149-3p; Applied Biosystems, Foster City, CA, USA) was used for these assays. TaqMan probes and primers for FOXM1 (product ID: Hs01073586_m1; Applied Biosystems) were assay-on-demand gene expression products. We used GUSB (product ID: Hs00939627_m1; Applied Biosystems), GAPDH (product ID: Hs02758991_g1; Applied Biosystems), and RNU48 (product ID: 001006; Applied Biosystems) as internal controls. We first verified the transfection efficiency of miRNA in cell lines based on downregulation of TWF1 (PTK9) mRNA following transfection with miR-1 (This method was recommended by the manufacturer).

4.4. Cell Proliferation, Migration, and Invasion Assays

A498 and 786-O cells were transfected with 10 nM miRNAs or siRNAs by reverse transfection. Cell proliferation was determined by XTT assay using a Cell Proliferation Kit II (Sigma-Aldrich, St. Louis, MO, USA). Cell migration was evaluated with wound healing assays. Cell invasion was analyzed using modified Boyden chambers containing Transwell-precoated Matrigel membrane filter inserts. These assays were performed as described previously [45,46,47].

4.5. miRNA Incorporated into RISC by Ago2 Immunoprecipitation

To confirm that exogenous miR-149-5p or miR-149-3p were incorporated into RISC, we performed immunoprecipitation assays using a microRNA Isolation Kit, Human Ago2 (Wako, Osaka, Japan) as described previously [19]. The expression levels of miRNAs bound to Ago2 were measured by TaqMan RT-qPCR. The miRNA expression data were normalized to the expression of miR-26a (product ID: 000404; Applied Biosystems), which was not affected by miR-149-5p or miR-149-3p expression.

4.6. Selection of Putative Target Genes Regulated by miR-149-5p and miR-149-3p in RCC Cells

To identify target genes of miR-149-5p and miR-149-3p in ccRCC, we performed in silico analyses and genome-wide gene expression analyses. We used the TargetScanHuman database (Release 7.1; http://www.targetscan.org/vert_71/), TCGA database (https://cancergenome.nih.gov/), and OncoLnc (http://www.oncolnc.org/) for in silico analyses [20,21,22]. The genome-wide gene expression analyses were performed using microarray data and gene expression profiles (GEO database; accession number: GSE22541 and GSE36895). The microarray data were deposited into the GEO database (accession number: GSE100746). We merged these datasets and selected putative miR-149-5p and miR-149-3p target genes.

4.7. TCGA Database Analysis of ccRCC

To investigate the clinical significance of target genes, we used the TCGA database from OncoLnc and cBioPortal (http://www.cbioportal.org/) [20,21,22]. We analyzed Kaplan-Meier survival curves and log-rank tests for target genes, and evaluated the lower expression group and the higher expression group of FOXM1 by T stage and metastatic cases.

4.8. Western Blot Analysis

Immunoblotting was conducted with monoclonal anti-FOXM1 antibodies (1:1000 dilution; #5436; Cell Signaling Technology, Danvers, MA, USA) and with anti-glyceraldehyde 3-phosphate dehydrogenase (GAPDH) antibodies (1:1000 dilution; ab8245; Abcam, Cambridge, UK) as a loading control. The procedures were performed as previously described [45,46,47].

4.9. Immunohistochemistry Using Tissue Microarrays

We used a tissue microarray of renal cell carcinoma samples obtained from US Biomax (Derwood, MD, USA; cat no. KD806), which contained a total of 80 renal tissues (clear cell carcinoma, n = 68; carcinoma sarcomatodes, n = 2; normal renal samples, n = 10). Detailed information on these samples is available at http://www.biomax.us/tissue-arrays/Kidney/KD806.

4.10. Statistical Analysis

The relationships between the two groups and expression values obtained by RT-PCR were analyzed using Mann–Whitney u-tests. The correlations between miR-149-5p and miR-149-3p expression were evaluated using Spearman’s rank test. The relationships among more than three variables and numerical values were analyzed using Bonferroni-adjusted Mann–Whitney u-tests. Survival analysis was carried out using the Kaplan–Meier method and log-rank tests with JMP software (version 12, SAS Institute Inc., Cary, NC, USA). Other analyses were performed using Expert StatView software (version 5.0, SAS Institute Inc., Cary, NC, USA) for these analyses.

5. Conclusions

Both strands of pre-miR-149, miR-149-5p (guide strand) and miR-149-3p (passenger strand), acted as antitumor miRNAs in RCC cells. FOXM1 was regulated by these miRNAs, and an overexpression of FOXM1 was observed in RCC clinical specimens. The aberrant expression of FOXM1 enhanced cancer cell aggressiveness, and high expression of FOXM1 was significantly associated with a poor prognosis of this disease. The identification of antitumor-mediated oncogenic networks may lead to a better understanding of RCC pathogenesis.

Acknowledgments

The present study was supported by KAKENHI(B) 17K16778, (B) 17K16777, (B) 16K20125, (C) 17K11160, (C) 16H05462, and (C) 15K10801.

Author Contributions

Atsushi Okato and Takayuki Arai conceived the idea of this study and compiled the research data; Yasutaka Yamada, Sho Sugawara, Keiichi Koshizuka, and Lisa Fujimura performed the experiments; Akira Kurozumi, Mayuko Kato, Satoko Kojima, Yukio Naya, and Tomohiko Ichikawa collected clinical specimens and organized clinical data; and Naohiko Seki oversaw this research and wrote this paper.

Conflicts of Interest

The authors declare no conflicts of interests.

References

  1. Ljungberg, B.; Campbell, S.C.; Choi, H.Y.; Jacqmin, D.; Lee, J.E.; Weikert, S.; Kiemeney, L.A. The epidemiology of renal cell carcinoma. Eur. Urol. 2011, 60, 615–621. [Google Scholar] [CrossRef] [PubMed]
  2. Patard, J.J.; Leray, E.; Rioux-Leclercq, N.; Cindolo, L.; Ficarra, V.; Zisman, A.; de la Taille, A.; Tostain, J.; Artibani, W.; Abbou, C.C.; et al. Prognostic value of histologic subtypes in renal cell carcinoma: A multicenter experience. J. Clin. Oncol. 2005, 23, 2763–2771. [Google Scholar] [CrossRef] [PubMed]
  3. Stephenson, A.J.; Chetner, M.P.; Rourke, K.; Gleave, M.E.; Signaevsky, M.; Palmer, B.; Kuan, J.; Brock, G.B.; Tanguay, S. Guidelines for the surveillance of localized renal cell carcinoma based on the patterns of relapse after nephrectomy. J. Urol. 2004, 172, 58–62. [Google Scholar] [CrossRef] [PubMed]
  4. Figlin, R.; Sternberg, C.; Wood, C.G. Novel agents and approaches for advanced renal cell carcinoma. J. Urol. 2012, 188, 707–715. [Google Scholar] [CrossRef] [PubMed]
  5. Garcia, J.A.; Rini, B.I. Recent progress in the management of advanced renal cell carcinoma. CA Cancer J. Clin. 2007, 57, 112–125. [Google Scholar] [CrossRef] [PubMed]
  6. Bartel, D.P. Micrornas: Genomics, biogenesis, mechanism, and function. Cell 2004, 116, 281–297. [Google Scholar] [CrossRef]
  7. Carthew, R.W.; Sontheimer, E.J. Origins and mechanisms of mirnas and sirnas. Cell 2009, 136, 642–655. [Google Scholar] [CrossRef] [PubMed]
  8. Bartel, D.P. Micrornas: Target recognition and regulatory functions. Cell 2009, 136, 215–233. [Google Scholar] [CrossRef] [PubMed]
  9. Goto, Y.; Kurozumi, A.; Nohata, N.; Kojima, S.; Matsushita, R.; Yoshino, H.; Yamazaki, K.; Ishida, Y.; Ichikawa, T.; Naya, Y.; et al. The microrna signature of patients with sunitinib failure: Regulation of uhrf1 pathways by microrna-101 in renal cell carcinoma. Oncotarget 2016, 7, 59070–59086. [Google Scholar] [CrossRef] [PubMed]
  10. Goto, Y.; Kurozumi, A.; Arai, T.; Nohata, N.; Kojima, S.; Okato, A.; Kato, M.; Yamazaki, K.; Ishida, Y.; Naya, Y.; et al. Impact of novel mir-145–3p regulatory networks on survival in patients with castration-resistant prostate cancer. Br. J. Cancer 2017, 117, 409–420. [Google Scholar] [CrossRef] [PubMed]
  11. Mizuno, K.; Mataki, H.; Arai, T.; Okato, A.; Kamikawaji, K.; Kumamoto, T.; Hiraki, T.; Hatanaka, K.; Inoue, H.; Seki, N. The microrna expression signature of small cell lung cancer: Tumor suppressors of mir-27a-5p and mir-34b-3p and their targeted oncogenes. J. Hum. Genet. 2017, 62, 671–678. [Google Scholar] [CrossRef] [PubMed]
  12. Koshizuka, K.; Nohata, N.; Hanazawa, T.; Kikkawa, N.; Arai, T.; Okato, A.; Fukumoto, I.; Katada, K.; Okamoto, Y.; Seki, N. Deep sequencing-based microrna expression signatures in head and neck squamous cell carcinoma: Dual strands of pre-mir-150 as antitumor mirnas. Oncotarget 2017, 8, 30288–30304. [Google Scholar] [CrossRef] [PubMed]
  13. Gregory, R.I.; Chendrimada, T.P.; Cooch, N.; Shiekhattar, R. Human risc couples microrna biogenesis and posttranscriptional gene silencing. Cell 2005, 123, 631–640. [Google Scholar] [CrossRef] [PubMed]
  14. Chendrimada, T.P.; Gregory, R.I.; Kumaraswamy, E.; Norman, J.; Cooch, N.; Nishikura, K.; Shiekhattar, R. Trbp recruits the dicer complex to ago2 for microrna processing and gene silencing. Nature 2005, 436, 740–744. [Google Scholar] [CrossRef] [PubMed]
  15. Hutvagner, G.; Zamore, P.D. A microrna in a multiple-turnover rnai enzyme complex. Science 2002, 297, 2056–2060. [Google Scholar] [CrossRef] [PubMed]
  16. Matranga, C.; Tomari, Y.; Shin, C.; Bartel, D.P.; Zamore, P.D. Passenger-strand cleavage facilitates assembly of sirna into ago2-containing rnai enzyme complexes. Cell 2005, 123, 607–620. [Google Scholar] [CrossRef] [PubMed]
  17. Matsushita, R.; Seki, N.; Chiyomaru, T.; Inoguchi, S.; Ishihara, T.; Goto, Y.; Nishikawa, R.; Mataki, H.; Tatarano, S.; Itesako, T.; et al. Tumour-suppressive microrna-144–5p directly targets ccne1/2 as potential prognostic markers in bladder cancer. Br. J. Cancer 2015, 113, 282–289. [Google Scholar] [CrossRef] [PubMed]
  18. Mataki, H.; Seki, N.; Mizuno, K.; Nohata, N.; Kamikawaji, K.; Kumamoto, T.; Koshizuka, K.; Goto, Y.; Inoue, H. Dual-strand tumor-suppressor microrna-145 (mir-145–5p and mir-145–3p) coordinately targeted mtdh in lung squamous cell carcinoma. Oncotarget 2016, 7, 72084–72098. [Google Scholar] [CrossRef] [PubMed]
  19. Okato, A.; Arai, T.; Kojima, S.; Koshizuka, K.; Osako, Y.; Idichi, T.; Kurozumi, A.; Goto, Y.; Kato, M.; Naya, Y.; et al. Dual strands of pre-mir150 (mir1505p and mir1503p) act as antitumor mirnas targeting spock1 in naive and castration-resistant prostate cancer. Int J. Oncol. 2017, 51, 245–256. [Google Scholar] [CrossRef] [PubMed]
  20. Jordan, A. Oncolnc: Linking tcga survival data to mrnas, mirnas, and lncrnas. PeerJ Comp. Sci. 2016, 2, e67. [Google Scholar]
  21. Gao, J.; Aksoy, B.A.; Dogrusoz, U.; Dresdner, G.; Gross, B.; Sumer, S.O.; Sun, Y.; Jacobsen, A.; Sinha, R.; Larsson, E.; et al. Integrative analysis of complex cancer genomics and clinical profiles using the cbioportal. Sci. Signal. 2013, 6, pl1. [Google Scholar] [CrossRef] [PubMed] [Green Version]
  22. Jordan, A. Oncorank: A pan-cancer method of combining survival correlations and its application to mrnas, mirnas, and lncrnas. PeerJ Prepr. 2016, 4, e2574v2571. [Google Scholar]
  23. Duran, I.; Lambea, J.; Maroto, P.; Gonzalez-Larriba, J.L.; Flores, L.; Granados-Principal, S.; Graupera, M.; Saez, B.; Vivancos, A.; Casanovas, O. Resistance to targeted therapies in renal cancer: The importance of changing the mechanism of action. Target Oncol. 2017, 12, 19–35. [Google Scholar] [CrossRef] [PubMed]
  24. Kurozumi, A.; Kato, M.; Goto, Y.; Matsushita, R.; Nishikawa, R.; Okato, A.; Fukumoto, I.; Ichikawa, T.; Seki, N. Regulation of the collagen cross-linking enzymes loxl2 and plod2 by tumor-suppressive microrna-26a/b in renal cell carcinoma. Int. J. Oncol. 2016, 48, 1837–1846. [Google Scholar] [CrossRef] [PubMed]
  25. Chan, S.H.; Huang, W.C.; Chang, J.W.; Chang, K.J.; Kuo, W.H.; Wang, M.Y.; Lin, K.Y.; Uen, Y.H.; Hou, M.F.; Lin, C.M.; et al. Microrna-149 targets git1 to suppress integrin signaling and breast cancer metastasis. Oncogene 2014, 33, 4496–4507. [Google Scholar] [CrossRef] [PubMed]
  26. Luo, G.; Chao, Y.L.; Tang, B.; Li, B.S.; Xiao, Y.F.; Xie, R.; Wang, S.M.; Wu, Y.Y.; Dong, H.; Liu, X.D.; et al. Mir-149 represses metastasis of hepatocellular carcinoma by targeting actin-regulatory proteins ppm1f. Oncotarget 2015, 6, 37808–37823. [Google Scholar] [CrossRef] [PubMed]
  27. He, D.X.; Gu, X.T.; Li, Y.R.; Jiang, L.; Jin, J.; Ma, X. Methylation-regulated mir-149 modulates chemoresistance by targeting glcnac n-deacetylase/n-sulfotransferase-1 in human breast cancer. FEBS J. 2014, 281, 4718–4730. [Google Scholar] [CrossRef] [PubMed]
  28. Zhang, G.; Liu, X.; Li, Y.; Wang, Y.; Liang, H.; Li, K.; Li, L.; Chen, C.; Sun, W.; Ren, S.; et al. Ephb3-targeted regulation of mir-149 in the migration and invasion of human colonic carcinoma hct116 and sw620 cells. Cancer Sci. 2017, 108, 408–418. [Google Scholar] [CrossRef] [PubMed]
  29. Si, L.; Xu, L.; Yin, L.; Qi, Y.; Han, X.; Xu, Y.; Zhao, Y.; Liu, K.; Peng, J. Potent effects of dioscin against pancreatic cancer via mir-149-3p-mediated inhibition of the akt1 signalling pathway. Br. J. Pharmacol. 2017, 174, 553–568. [Google Scholar] [CrossRef] [PubMed]
  30. Kuang, P.; Zhao, W.; Su, W.; Zhang, Z.; Zhang, L.; Liu, J.; Ren, G.; Yin, Z.; Wang, X. 18beta-glycyrrhetinic acid inhibits hepatocellular carcinoma development by reversing hepatic stellate cell-mediated immunosuppression in mice. Int. J. Cancer 2013, 132, 1831–1841. [Google Scholar] [CrossRef] [PubMed]
  31. Shetty, A.V.; Thirugnanam, S.; Dakshinamoorthy, G.; Samykutty, A.; Zheng, G.; Chen, A.; Bosland, M.C.; Kajdacsy-Balla, A.; Gnanasekar, M. 18alpha-glycyrrhetinic acid targets prostate cancer cells by down-regulating inflammation-related genes. Int. J. Oncol. 2011, 39, 635–640. [Google Scholar] [PubMed]
  32. Wang, S.; Shen, Y.; Qiu, R.; Chen, Z.; Chen, Z.; Chen, W. 18 beta-glycyrrhetinic acid exhibits potent antitumor effects against colorectal cancer via inhibition of cell proliferation and migration. Int. J. Oncol. 2017. [Google Scholar] [CrossRef] [PubMed]
  33. Cao, D.; Jia, Z.; You, L.; Wu, Y.; Hou, Z.; Suo, Y.; Zhang, H.; Wen, S.; Tsukamoto, T.; Oshima, M.; et al. 18beta-glycyrrhetinic acid suppresses gastric cancer by activation of mir-149-3p-wnt-1 signaling. Oncotarget 2016, 7, 71960–71973. [Google Scholar] [PubMed]
  34. Matsushita, R.; Yoshino, H.; Enokida, H.; Goto, Y.; Miyamoto, K.; Yonemori, M.; Inoguchi, S.; Nakagawa, M.; Seki, N. Regulation of uhrf1 by dual-strand tumor-suppressor microrna-145 (mir-145-5p and mir-145-3p): Inhibition of bladder cancer cell aggressiveness. Oncotarget 2016, 196, 1314. [Google Scholar] [CrossRef] [PubMed]
  35. Yonemori, M.; Seki, N.; Yoshino, H.; Matsushita, R.; Miyamoto, K.; Nakagawa, M.; Enokida, H. Dual tumor-suppressors mir-139-5p and mir-139-3p targeting matrix metalloprotease 11 in bladder cancer. Cancer Sci. 2016, 107, 1233–1242. [Google Scholar] [CrossRef] [PubMed]
  36. Xu, K.; Liu, X.; Mao, X.; Xue, L.; Wang, R.; Chen, L.; Chu, X. Microrna-149 suppresses colorectal cancer cell migration and invasion by directly targeting forkhead box transcription factor foxm1. Cell. Physiol. Biochem. Int. J. Exp. Cell. Physiol. Biochem. Pharmacol. 2015, 35, 499–515. [Google Scholar] [CrossRef] [PubMed]
  37. Ke, Y.; Zhao, W.; Xiong, J.; Cao, R. Mir-149 inhibits non-small-cell lung cancer cells emt by targeting foxm1. Biochem. Res. Int. 2013, 2013, 506731. [Google Scholar] [CrossRef] [PubMed]
  38. Huang, C.; Du, J.; Xie, K. Foxm1 and its oncogenic signaling in pancreatic cancer pathogenesis. Bioch. Biophys. Acta 2014, 1845, 104–116. [Google Scholar] [CrossRef] [PubMed]
  39. Kocarslan, S.; Guldur, M.E.; Ekinci, T.; Ciftci, H.; Ozardali, H.I. Comparison of clinicopathological parameters with foxm1 expression in renal cell carcinoma. J. Cancer Res. Ther. 2014, 10, 1076–1081. [Google Scholar] [CrossRef] [PubMed]
  40. Halasi, M.; Gartel, A.L. Targeting foxm1 in cancer. Biochem. Pharmacol. 2013, 85, 644–652. [Google Scholar] [CrossRef] [PubMed]
  41. Wu, X.R.; Chen, Y.H.; Liu, D.M.; Sha, J.J.; Xuan, H.Q.; Bo, J.J.; Huang, Y.R. Increased expression of forkhead box m1 protein is associated with poor prognosis in clear cell renal cell carcinoma. Med. Oncol. 2013, 30, 346. [Google Scholar] [CrossRef] [PubMed]
  42. Wen, N.; Wang, Y.; Wen, L.; Zhao, S.H.; Ai, Z.H.; Wang, Y.; Wu, B.; Lu, H.X.; Yang, H.; Liu, W.C.; et al. Overexpression of foxm1 predicts poor prognosis and promotes cancer cell proliferation, migration and invasion in epithelial ovarian cancer. J. Transl. Med. 2014, 12, 134. [Google Scholar] [CrossRef] [PubMed]
  43. Li, D.; Wei, P.; Peng, Z.; Huang, C.; Tang, H.; Jia, Z.; Cui, J.; Le, X.; Huang, S.; Xie, K. The critical role of dysregulated foxm1-plaur signaling in human colon cancer progression and metastasis. Clin. Cancer Res. Off. J. Am. Associ. Cancer Res. 2013, 19, 62–72. [Google Scholar] [CrossRef] [PubMed]
  44. Sobin, L.; Gospodarowicz, M.; Wittekind, C. Tnm Classification of Malignant Tumours, 7th ed.; Wiley-Blackwell: Chichester, UK, 2009. [Google Scholar]
  45. Okato, A.; Goto, Y.; Kurozumi, A.; Kato, M.; Kojima, S.; Matsushita, R.; Yonemori, M.; Miyamoto, K.; Ichikawa, T.; Seki, N. Direct regulation of lamp1 by tumor-suppressive microrna-320a in prostate cancer. Int. J. Oncol. 2016, 49, 111–122. [Google Scholar] [CrossRef] [PubMed]
  46. Kurozumi, A.; Goto, Y.; Matsushita, R.; Fukumoto, I.; Kato, M.; Nishikawa, R.; Sakamoto, S.; Enokida, H.; Nakagawa, M.; Ichikawa, T.; et al. Tumor-suppressive microrna-223 inhibits cancer cell migration and invasion by targeting itga3/itgb1 signaling in prostate cancer. Cancer Sci. 2016, 107, 84–94. [Google Scholar] [CrossRef] [PubMed]
  47. Goto, Y.; Kojima, S.; Kurozumi, A.; Kato, M.; Okato, A.; Matsushita, R.; Ichikawa, T.; Seki, N. Regulation of e3 ubiquitin ligase-1 (wwp1) by microrna-452 inhibits cancer cell migration and invasion in prostate cancer. Br. J. Cancer 2016, 114, 1135–1144. [Google Scholar] [CrossRef] [PubMed]
Figure 1. Analysis of miR-149-5p and miR-149-3p expression in clinical specimens and functional assays in renal cell carcinoma (RCC) cell lines (A498 and 786-O cells) following miR-149-5p and miR-149-3p transfection. (A,B) Expression levels of miR-149-5p and miR-149-3p in RCC clinical specimens were determined by qRT-PCR. Data were normalized to RNU48 expression; (C) Correlation between the relative expression levels of miR-149-5p and miR-149-3p; (D) Cell proliferation was determined by XTT assays. * p < 0.0001; (E) Cell migration activity was determined by wound-healing assays. * p < 0.0001; (F) Cell invasion activity was determined using Matrigel invasion assays. * p < 0.0001.
Ijms 18 01969 g001
Figure 2. Both miR-149-5p and miR-149-3p bound to Ago2. (A) Schematic illustration of microRNA (miRNA) detection method. Isolation of miRNA-induced silencing complex (RISC) incorporated miRNAs by Ago2 immunoprecipitation; (B) Expression levels of miR-149-5p and miR-149-3p after transfection with miR-149-5p or miR-149-3p. We used miR-26a as an internal control.
Ijms 18 01969 g002
Figure 3. The strategy underlying the analysis of miR-149-5p and miR-149-3p target genes in A498 cells. FC: fold-change.
Ijms 18 01969 g003
Figure 4. Expression levels of FOXM1 in ccRCC clinical specimens and TCGA data analysis based on FOXM1 expression in ccRCC. (A) Expression levels of FOXM1 in ccRCC specimens were significantly upregulated in cancer tissues compared with normal tissues (p < 0.0001); (B,C) The correlation between FOXM1 and miR-149-5p, and FOXM1 and miR-149-3p and (D) FOXM1 protein was strongly expressed in several cancer tissues, while low expression was observed in normal tissues using a tissue microarray.
Ijms 18 01969 g004
Figure 5. TCGA database analysis of FOXM1. (A) Kaplan-Meier survival curves for overall survival rates based on FOXM1 expression in RCC (p = 1.5 × 10⁻⁶) and (B,C) The relationships between FOXM1 expression and tumor stage and metastasis in ccRCC.
Ijms 18 01969 g005
Figure 6. Direct regulation of FOXM1 by miR-149-5p and miR-149-3p in RCC cell lines. (A) FOXM1 mRNA expression in RCC cell lines was evaluated by qRT-PCR. GAPDH was used as an internal control. * p < 0.0001; (B) FOXM1 protein expression in RCC cell lines was evaluated by Western blot analyses. GAPDH was used as a loading control; (C)The miR-149-5p or miR-149-3p binding site in the 3′-UTR of FOXM1 mRNA; (D) Dual Luciferase reporter assays using vectors encoding putative miR-149-5p and miR-149-3p target sites of the FOXM1 3′-UTR (positions 909–915 and 588–594) for both wild-type and deleted regions. Normalized data were calculated as ratios of Renilla/Firefly luciferase activities. * p < 0.001.
Ijms 18 01969 g006
Figure 7. FOXM1 mRNA and FOXM1 protein expression after si-FOXM1 transfection and the effects of FOXM1 silencing in RCC cell lines. (A) FOXM1 mRNA expression in RCC cell lines was evaluated by qRT-PCR. GAPDH was used as an internal control; (B) FOXM1 protein expression in RCC cell lines was evaluated by Western blot analysis. GAPDH was used as a loading control; (C) Cell proliferation was determined using XTT assays, * p < 0.0001; (D) Cell migration activity was determined by wound-healing assays, * p < 0.0001; (E) Cell invasion activity was determined using Matrigel invasion assays. * p < 0.0001.
Ijms 18 01969 g007
Figure 8. Kaplan-Meier survival analysis. Kaplan-Meier survival curves based on putative target genes regulated by miR-149-5p and miR-149-3p in patients with ccRCC.
Ijms 18 01969 g008
Table 1. Characteristics of patients with clear cell renal cell carcinoma (ccRCC).
No.AgeSexPathologyGradepTNMINFvlyeg/igfcimrcrps
171Fclear cellG2T1a00a00eg10000
274Mclear cellG1 > G2T1b00a00eg10000
359Mclear cellG3 > G2T1b00a00eg10000
479Mclear cellG2 > G3 > G1T1a00a00eg10000
552Mclear cellG2 > G3T1b00a00eg11000
676Fclear cellG2 > G3T3a00a10eg10000
764Mclear cellG2 > G3 > G1T3a01b10ig01100
867Mclear cellG2 > G3 > G1T3a00b10ig10000
959Mclear cellG3T3a00b10ig00000
1073Mclear cellG1 >> G3T2a00a01eg10000
1177Mclear cellG1 > G2T1b00a00eg10000
1251Fclear cellG2 > G1 > G3T3b00b10ig00000
1384Fclear cellG2T1a00a00eg00000
1478Mclear cellG2 > G1 >> G3T1b00b00eg10000
1544Mclear cellG2 > G1T1a00b00eg10000
1657Mclear cellG2T1b00a00eg00000
INF: infiltration; v: vein; ly: lymph node; eg: expansive growth; ig: infiltrative growth; im: intrarenal metastasis; rc: renal capsule invasion; rp: pelvis invasion; s; sinus invasion.
Table 2. Putative target genes regulated by miR-149-5p and miR-149-3p in RCC cells.
Gene SymbolGene NameSite CountsMicroarray (log2 Ratio)GEOTCGA
miR-149-5pmiR-149-3pmiR-149-5pmiR-149-3pFold Changep Value
FOXM1forkhead box M111−1.359−0.8341.5331.5 × 10−6
SIPA1signal-induced proliferation-associated 113−2.022−0.7321.0716.4 × 10−6
CXCL5chemokine (C-X-C motif) ligand 511−1.032−0.6501.9612.39 × 10−6
LMNB2lamin B214−0.767−0.9091.4383.67 × 10−6
GBP2guanylate binding protein 2, interferon-inducible14−2.484−1.2781.6648.57 × 10−6
FBXL16F-box and leucine-rich repeat protein 1624−2.451−0.6852.2030.00927 *
BTNL9butyrophilin-like 913−1.161−0.5191.2550.0187 *
APOBEC3Capolipoprotein B mRNA editing enzyme, catalytic polypeptide-like 3C21−1.086−0.6721.8050.0424
MARVELD1MARVEL domain containing 124−0.902−2.1761.0190.188
IKZF1IKAROS family zinc finger 1 (Ikaros)12−1.133−0.7421.3500.401
TTYH3tweety family member 317−1.933−1.4801.0960.57
SLC29A4solute carrier family 29 (equilibrative nucleoside transporter), member 4111−1.115−0.8682.9360.62
DDB2damage-specific DNA binding protein 2, 48kDa21−0.760−1.2952.2090.757
PHKA2phosphorylase kinase, alpha 2 (liver)23−0.550−1.2811.8720.943
* Poor prognosis with low expression.

