Article

Seed Transcriptomics Analysis in Camellia oleifera Uncovers Genes Associated with Oil Content and Fatty Acid Composition

1
Research Institute of Subtropical Forestry, Chinese Academy of Forestry, Hangzhou 311400, China
2
Research Institute of Horticulture, Hunan Academy of Agricultural Sciences, Changsha 410125, China
3
Forestry Seedling Management Station of Zhejiang Province, Hangzhou 310020, China
*
Authors to whom correspondence should be addressed.
These authors have contributed equally to this work.
Int. J. Mol. Sci. 2018, 19(1), 118; https://doi.org/10.3390/ijms19010118
Submission received: 2 November 2017 / Revised: 14 December 2017 / Accepted: 27 December 2017 / Published: 2 January 2018
(This article belongs to the Section Molecular Plant Sciences)

Abstract

:
Camellia oleifera is a major tree species for producing edible oil. Its seed oil is well known for the high level of oleic acids; however, little is known regarding the molecular mechanism of lipid biosynthesis in C. oleifera. Here, we measured the oil contents and fatty acid (FA) compositions at four developmental stages and investigated the global gene expression profiles through transcriptomics sequencing. We identified differentially-expressed genes (DEGs) among the developmental stages and found that the distribution of numbers of DEGs was associated with the accumulation pattern of seed oil. Gene Ontology (GO) enrichment analysis revealed some critical biological processes related to oil accumulation, including lipid metabolism and phosphatidylcholine metabolism. Furthermore, we investigated the expression patterns of lipid biosynthesis genes. We showed that most of the genes were identified with single or multiple copies, and some had correlated profiles along oil accumulation. We proposed that the higher levels of stearoyl-ACP desaturases (SADs) coupled with lower activities of fatty acid desaturase 2 (FAD2) might be responsive to the boost of oleic acid at the late stage of C. oleifera seeds’ development. This work presents a comprehensive transcriptomics study of C. oleifera seeds and uncovers valuable DEGs that are associated with the seed oil accumulation.

Graphical Abstract

1. Introduction

Camellia oleifera originates from China and is planted widely in south China with a long cultivation history of over 2000 years. As one of the four major oil trees, together with oil palm, olive and coconut, it is known as an important edible oil-bearing tree species in China. It was reported in 2015 that the dry seed production of oil was around ~2.2 million tons over a cultivated area of 4 million ha. Camellia oil, the major product of C. oleifera seeds (nearly 50% of dry kernel weight), is considered to be among the highest quality oils [1,2]. The unsaturated FAs account for approximately 90% of all FAs, including monounsaturated fatty acid (MUFA), oleic acid (18:1), and polyunsaturated fatty acid (PUFA), linoleic acid (18:2) mainly [3]. C. oleifera has received much more attention owing to its high unsaturated FA contents, which are good for human health. It is also widely used in cosmetics, ink, lubricants, etc. [4,5].
The biochemistry of lipid biosynthesis has been extensively studied in many plants [6,7]. It normally includes three parts in plant cells: de novo FA synthesis in plastids, FA modification, acyl editing and triacylglycerol (TAG) assembly in endoplasmic reticulum [6,8]. The de novo synthesis of FA is initiated in the plastid by acetyl-CoA carboxylase (ACCase) converting acetyl-CoA to malonyl-CoA; diverse FA, including PUFA and part of the long chain FA (carbon chain length over 18), are produced by FA modification and acyl editing in endoplasmic reticulum, and oil body is formed and accumulated at the TAG assembly ending stage [8]. Some studies indicate that the TAG accumulation is limited by FA production in plastid [9,10]. The plastid ACCase is the key rate-determining enzyme to control FA synthesis and is regulated by transcription factors [11,12,13]. Stearoyl-ACP desaturases (SADs) in plastid are considered as key enzymes for FA desaturation, which introduce the first double bound between carbon 9 and 10 [14,15], and the Δ126)-desaturase is one of the key rate-determining enzymes for the PUFA synthesis in some oil crops [16,17]. Another study’s results show that the TAG assembly is also important to control the lipid accumulation in developing oilseed, such as that in oilseed rape [18], soybean [19], tung tree [20], etc. The last step of TAG assembly is catalyzed by acyl-CoA: diacylglycerol (DAG) acyltransferase (DGAT), and ectopic expression of DGATs in Glycine max and Brassica napus significantly increased the seed oil contents [19,21].
In many oil crops, the high oil production is synthesized in seed kernels, such as soybean [22], hickory [23] and rapeseed [24]; while in oil palm, the oil production was accumulated in fruit tissue mesocarp [25]. The seed oil of C. oleifera was dominant with 18:1, which was similar to hickory and olive [23,26]. Huang and coauthors showed that the expression of a high level of SAD with a low level of FAD2 was associated with the 18:1 synthesis in hickory [23]. In olive, the genomic characterization revealed that a newly-evolved small RNA, which repressed the expression of FAD2, contributed to high levels of 18:1 content [26]. In recent years, multiple Camellia sp. transcriptomes were characterized separately to identify major biology processes and genes involved in tea-specific compounds synthesis [27], cold acclimation [28], response to natural drying of seed [29], drought stress [30], etc. Some genes involved in oil accumulation and FA composition during the C. oleifera seeds’ development have been studied including fructose-1,6-bisphosphate aldolase genes [31], SAD [32] and Δ-12 desaturase [33]. However, the understanding of the molecular regulation of oil accumulation and FA composition in C. oleifera developing seeds remains limited.
With the increasing demands for healthy edible oil, the production of Camellia oil cannot meet the requirements of the market. Increasing the yield and improving the quality are the major challenges for the Camellia oil industry. To identify genes related to lipid biosynthesis in C. oleifera seeds, we generated a comprehensive transcriptome of kernel at four developmental stages displaying substantial changes of oil contents and compositions. We identified six sets of differentially-expressed genes (DEGs) during the oil accumulation in kernel and found that the distribution of the numbers of DEGs was associated with the oil accumulation pattern. Furthermore, expression analysis of key enzymes of lipid biosynthesis revealed that the regulation of SADs and fatty acid desaturase 2 (FAD2) levels at the late stages of seed development might be a critical transition for 18:1 accumulation. This work provides insights into the regulation of seed oil biosynthesis in C. oleifera and is valuable to the genetic breeding program towards the production of high quality and yield of Camellia oil.

2. Results

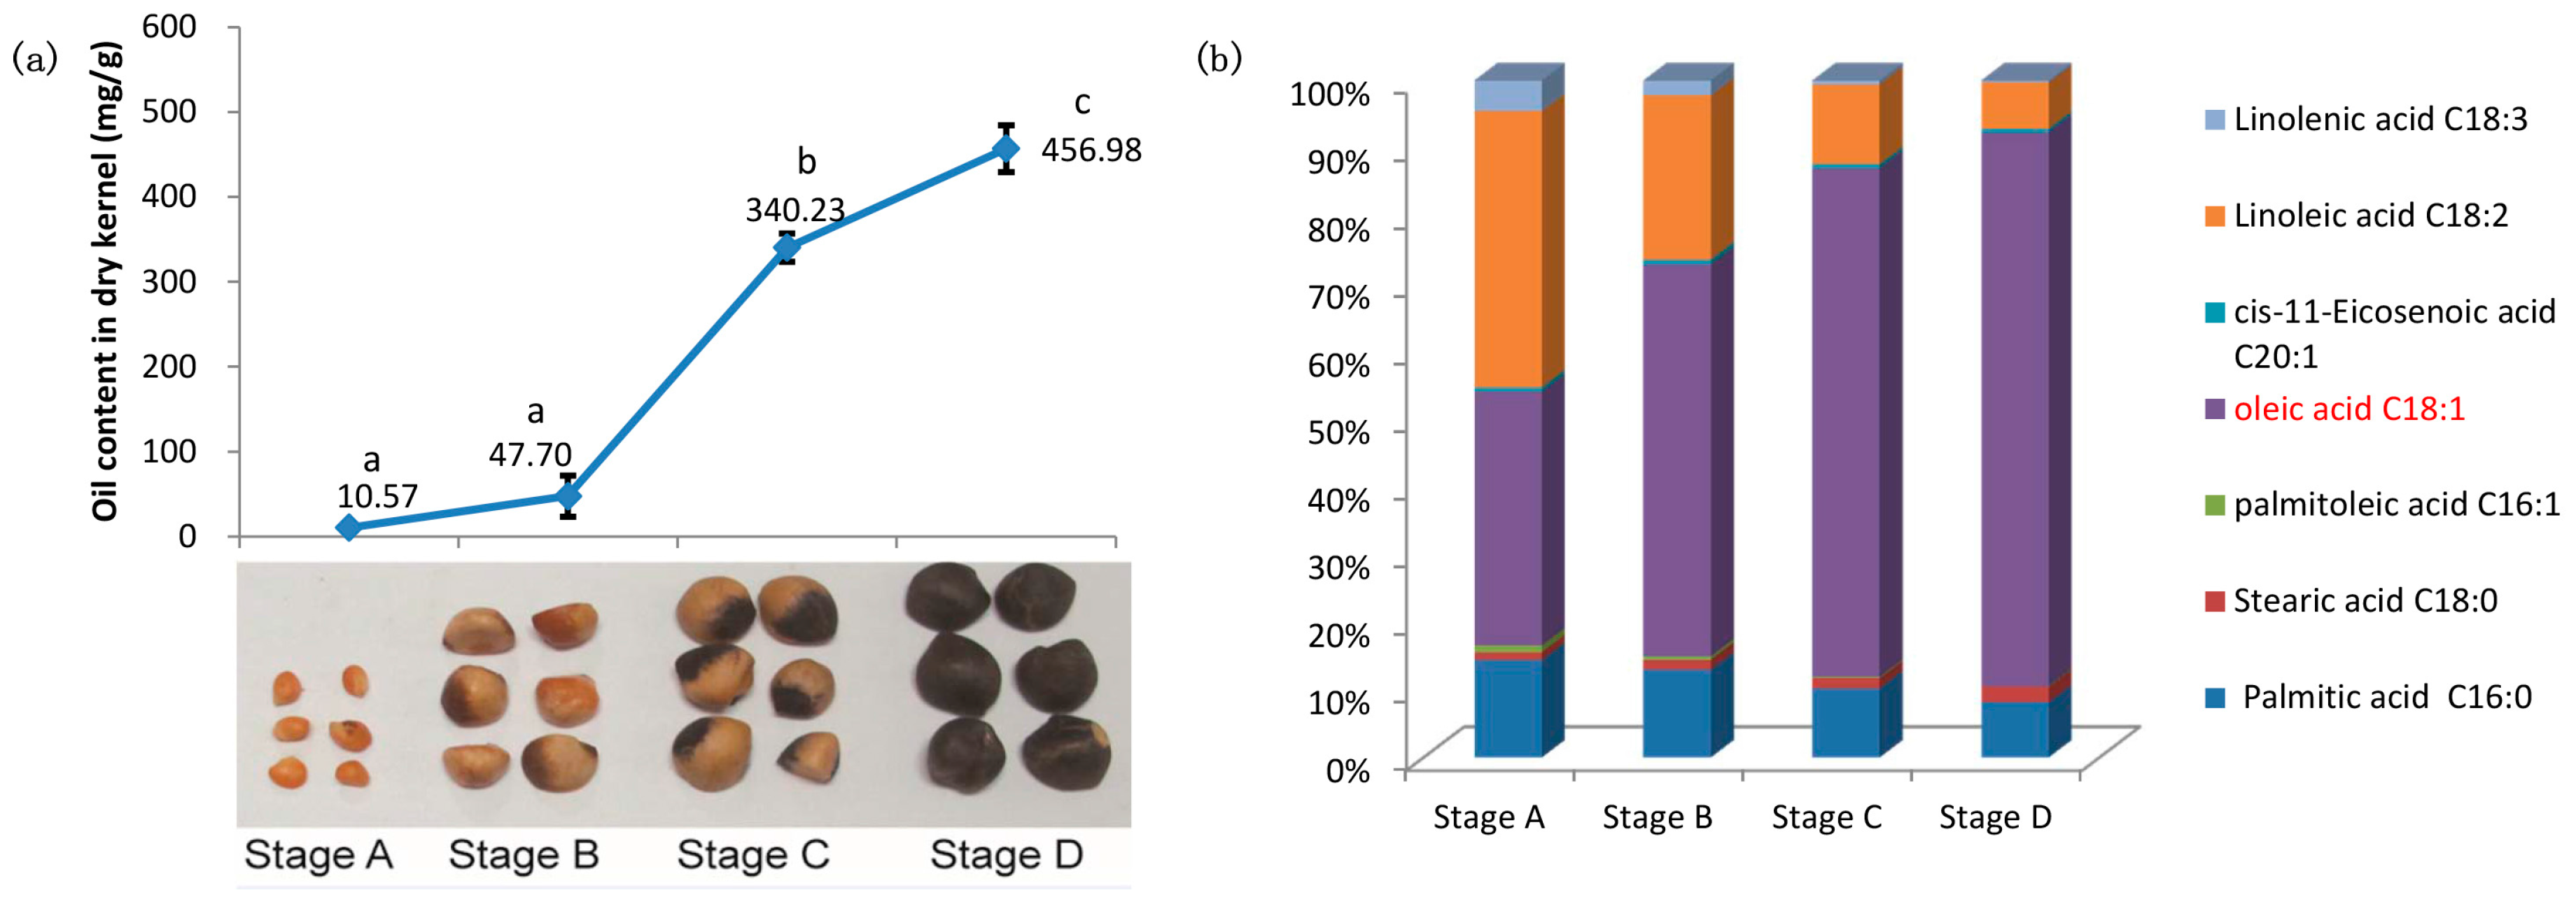
2.1. Characterizations of Oil Content and Fatty Acid (FA) Composition during Seed Development of C. oleifera

To reveal the accumulation pattern of seed oil, we extracted and measured the total oil contents of C. oleifera seeds at four development stages. We showed that the oil content increased slowly in the early period (Stage A–Stage B) and displayed substantially higher content at Stage C and Stage D (Figure 1a). To further reveal the compositional properties of FAs in C. oleifera seed, we performed gas chromatography analyses to measure seed oil FA composition in different development stages. We identified seven main kinds of FAs in total, which accounted for over 99.63% of all FAs at every stage (Figure 1b, Table S1). The 7 FAs included 2 saturated FAs (palmitic and stearic acids, 16:0 and 18:0), 3 MUFAs (palmitoleic, oleic and cis-11-eicosenoic acid, 16:1, 18:1 and 20:1) and 2 PUFAs (linoleic and linolenic acid, 18:2 and 18:3). In all stages, the unsaturated FAs content, accounting for 84.23–89.27% of all FAs, were much higher than the saturated FAs (Figure 1b, Table S1). For the four seed development stages, in the saturated FA, 16:0 was more abundant; among MUFAs, 18:1 was most abundant, accounting for 95.79–99.23% of all MUFAs (Figure 1b, Table S1); for the PUFAs, 18:2 was much more abundant than 18:3 (Figure 1b, Table S1).
We showed that contents of five FAs including 16:0, 16:1, 18:1, 18:2 and 18:3 revealed significant difference among the four stages (see Table S1). During the seeds’ development, because the TAG was accumulated quickly, almost all FAs increased in absolute content, and 18:1 increased more than all others. With the seeds’ development, the relative contents of 16:0, 16:1, 18:2 and 18:3 dropped, and the 18:1 relative content was increased greatly (Figure 1b). The ratio of 18:1 in all FAs at Stage D was 2.18-times that at Stage A (Figure 1b, Table S1). Overall, the mature seeds had a higher ratio of unsaturated FA content to saturated FA content and a higher ratio of MUFA content to PUFA content compared with the immature seeds (Figure 1b, Table S1).

2.2. RNA-Seq, De Novo Transcriptome Assembly and Functional Annotation

To identify genes associated with oil accumulation, we performed transcriptome sequencing of seeds at different development stages (Stage A, Stage B, Stage C and Stage D) from the ‘Changlin No. 4’ clone. The four libraries generated 8,139,855–8,397,376 total reads. After filtering low-quality reads, a total of 30,940,581 clean reads were obtained, having 91.20–97.11% Q ≥ 20 bases and 46.91–49.03% GC content (see Table S2). Then, these reads of each library were assembled into contigs and unigenes using Short Oligonucleotide Analysis Package (SOAP) de novo separately (see Table S2 and Figure S1). Finally, the unigenes of four libraries were assembled into 77,052 All-Unigenes with a mean length of 640 bp (see Table S2 and Figure S1). We performed a similarity search of All-Unigenes to annotate the transcriptome of C. oleifera seeds by BLASTx with an E-value less than 10−5. We found that there were 51,574 unigenes (64.22%) annotated in the NCBI non-redundant protein (Nr) database, 33,503 unigenes (41.72%) annotated in the Swiss-Prot database, 15,442 unigenes (19.23%) annotated in Clusters of Orthologous Groups (COG) database, 10,493 unigenes (13.07%) annotated in Kyoto Encyclopedia of Genes and Genomes (KEGG) and 7261 unigenes (9.04%) annotated in the GO annotation database (Table 1). A total of 51,725 (64.41%) unigenes were annotated in one or more public databases (Table 1 and Table S3).
Among the unigenes annotated in the GO database, three major categories and 54 subcategories were classified (see Table S4). In the biological process category, the unigenes were distributed into 20 subcategories, and the major subcategories were ‘cellular process’ (GO:0009987, 2634 unigenes) and ‘metabolic process’ (GO:0008152, 2693 unigenes). In the cellular component category, the unigenes were distributed into 11 subcategories, and ‘cell’ (GO:0005623, 4593 unigenes), ‘cell part’ (GO:0044464, 4592 unigenes) and ‘organelle’ (GO:0043226, 3448 unigenes) were the dominant subcategories. In the molecular function category, unigenes were distributed into 11 subcategories. ‘Binding’ (GO:0005488, 3247 unigenes) and ‘catalytic’ (GO:0003824, 2856 unigenes) were the largest subcategories (see Table S4).

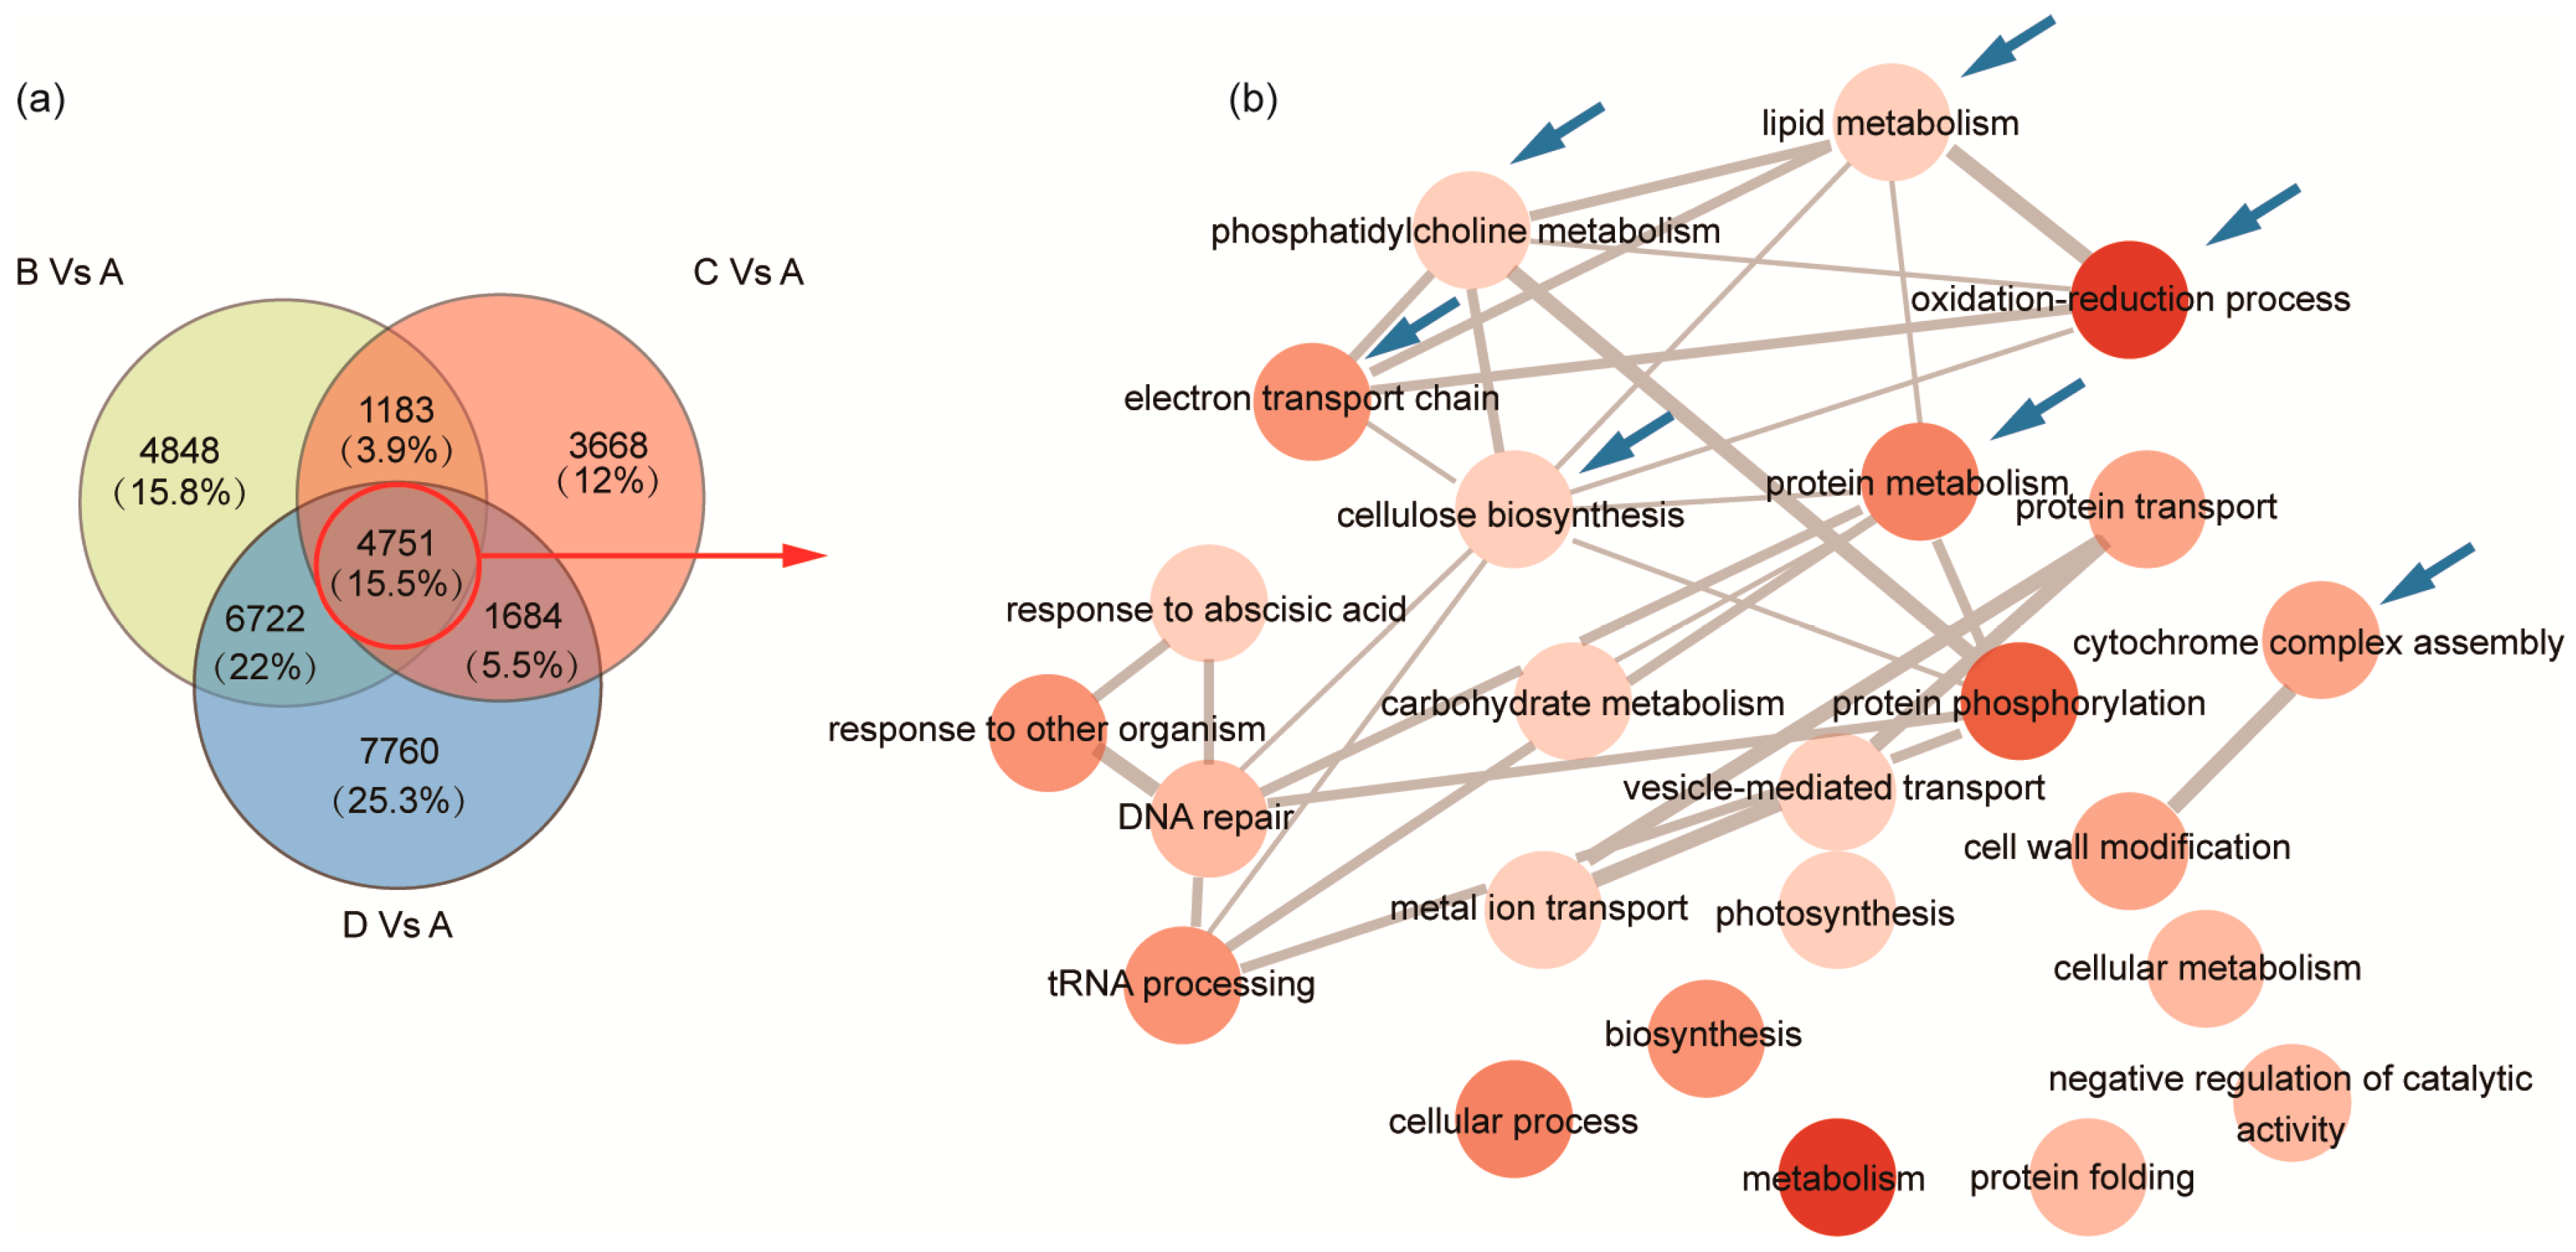
2.3. Identification of DEGs and GO Enrichment Analysis during Seed Development

To investigate the genes associated with lipid accumulation and FA components, we compared the gene expression levels of the unigene dataset and identified significant DEGs (FDR < 0.05) among different samples. We found there were 12,466 DEGs in the Stage B-A comparison, which included 5329 upregulated genes and 7137 downregulated genes (Figure 2a, Table S5). There were 11,192 DEGs between Stage D-C, including 2747 upregulated genes and 8445 downregulated genes (Figure 2a, Table S5). Stage B-A and Stage D-C had comparable numbers of DEGs, but only a small proportion of DEGs were shared (2677 genes 12.8%, Figure 2b). We showed that Stage C-A and Stage C-B had more common DEGs (Figure 2a,c, Table S5), which resembled the scenario of Stage D-A and Stage D-B (Figure 2c, Table S5). The distribution of DEGs between stages of high and low oil contents revealed that 5326 DEGs (15.4% of total DEGs) were shared in Stage C-A, Stage C-B, Stage D-A and Stage D-B (Figure 2c). These results indicated that there were substantial alterations of gene expression among different development stages in C. oleifera seeds. It is possible that the changes of common DEGs among stages were associated with the oil accumulation pattern.
We performed the clustering analysis of the expressed genes with a total reads per kilobases per million reads (RPKM) value over 10 using K-means; the results showed that there were 16 expression level changing patterns in all unigenes, and clusters 9 and 10 might be related to TAG synthesis (Figure 2d, Table S6).
The oil of C. oleifera seed mostly accumulated at the period from Stage B–Stage C (Figure 1a). To evaluate the functional properties of DEGs, We performed the GO enrichment analysis of DEGs during the Stage B-C transition. The results showed that 152 and 308 significantly-enriched GO terms were identified (FDR < 0.001) in down- and up-regulated genes of Stage B-C, respectively (Table S7 and Figure S2). Additionally, there were a few GO terms related to FA synthesis or TAG accumulation overrepresented in the downregulated genes (Figure S2a). In the upregulated genes, many GO terms related to multiple biological process were overrepresented, such as ‘lipid metabolism’, ‘mannose biosynthesis’, ‘terpenoid biosynthesis’, ‘cellular metabolism’, ‘carbohydrate metabolism’, ‘nitrogen compound metabolism’, etc. (Figure S2b). We further performed GO enrichment analysis of the common DEGs of Stage B-A, Stage C-A and Stage D-A (Figure 3a, Table S5), and 138 significantly-enriched GO terms were identified (FDR < 0.001) (see Table S8). In the biological process, multiple GO terms were significantly overrepresented, which included some GO terms relative to FA synthesis, oil accumulation and seed development, such as ‘lipid metabolism’, ‘phosphatidylcholine metabolism’, ‘oxidation-reduction process’, ‘protein metabolism’, ‘cytochrome complex assembly’, ‘electron transport chain’, ‘cellulose biosynthesis’, etc. The GO terms were grouped to reveal the biological processes related to oil accumulation and seed development (Figure 3b). The results indicated that multiple biological pathways, including ‘lipid metabolism’, ‘phosphatidylcholine metabolism’, ‘oxidation-reduction process’, ‘cytochrome complex assembly’ etc., might be involved in FA synthesis and oil accumulation in C. oleifera.

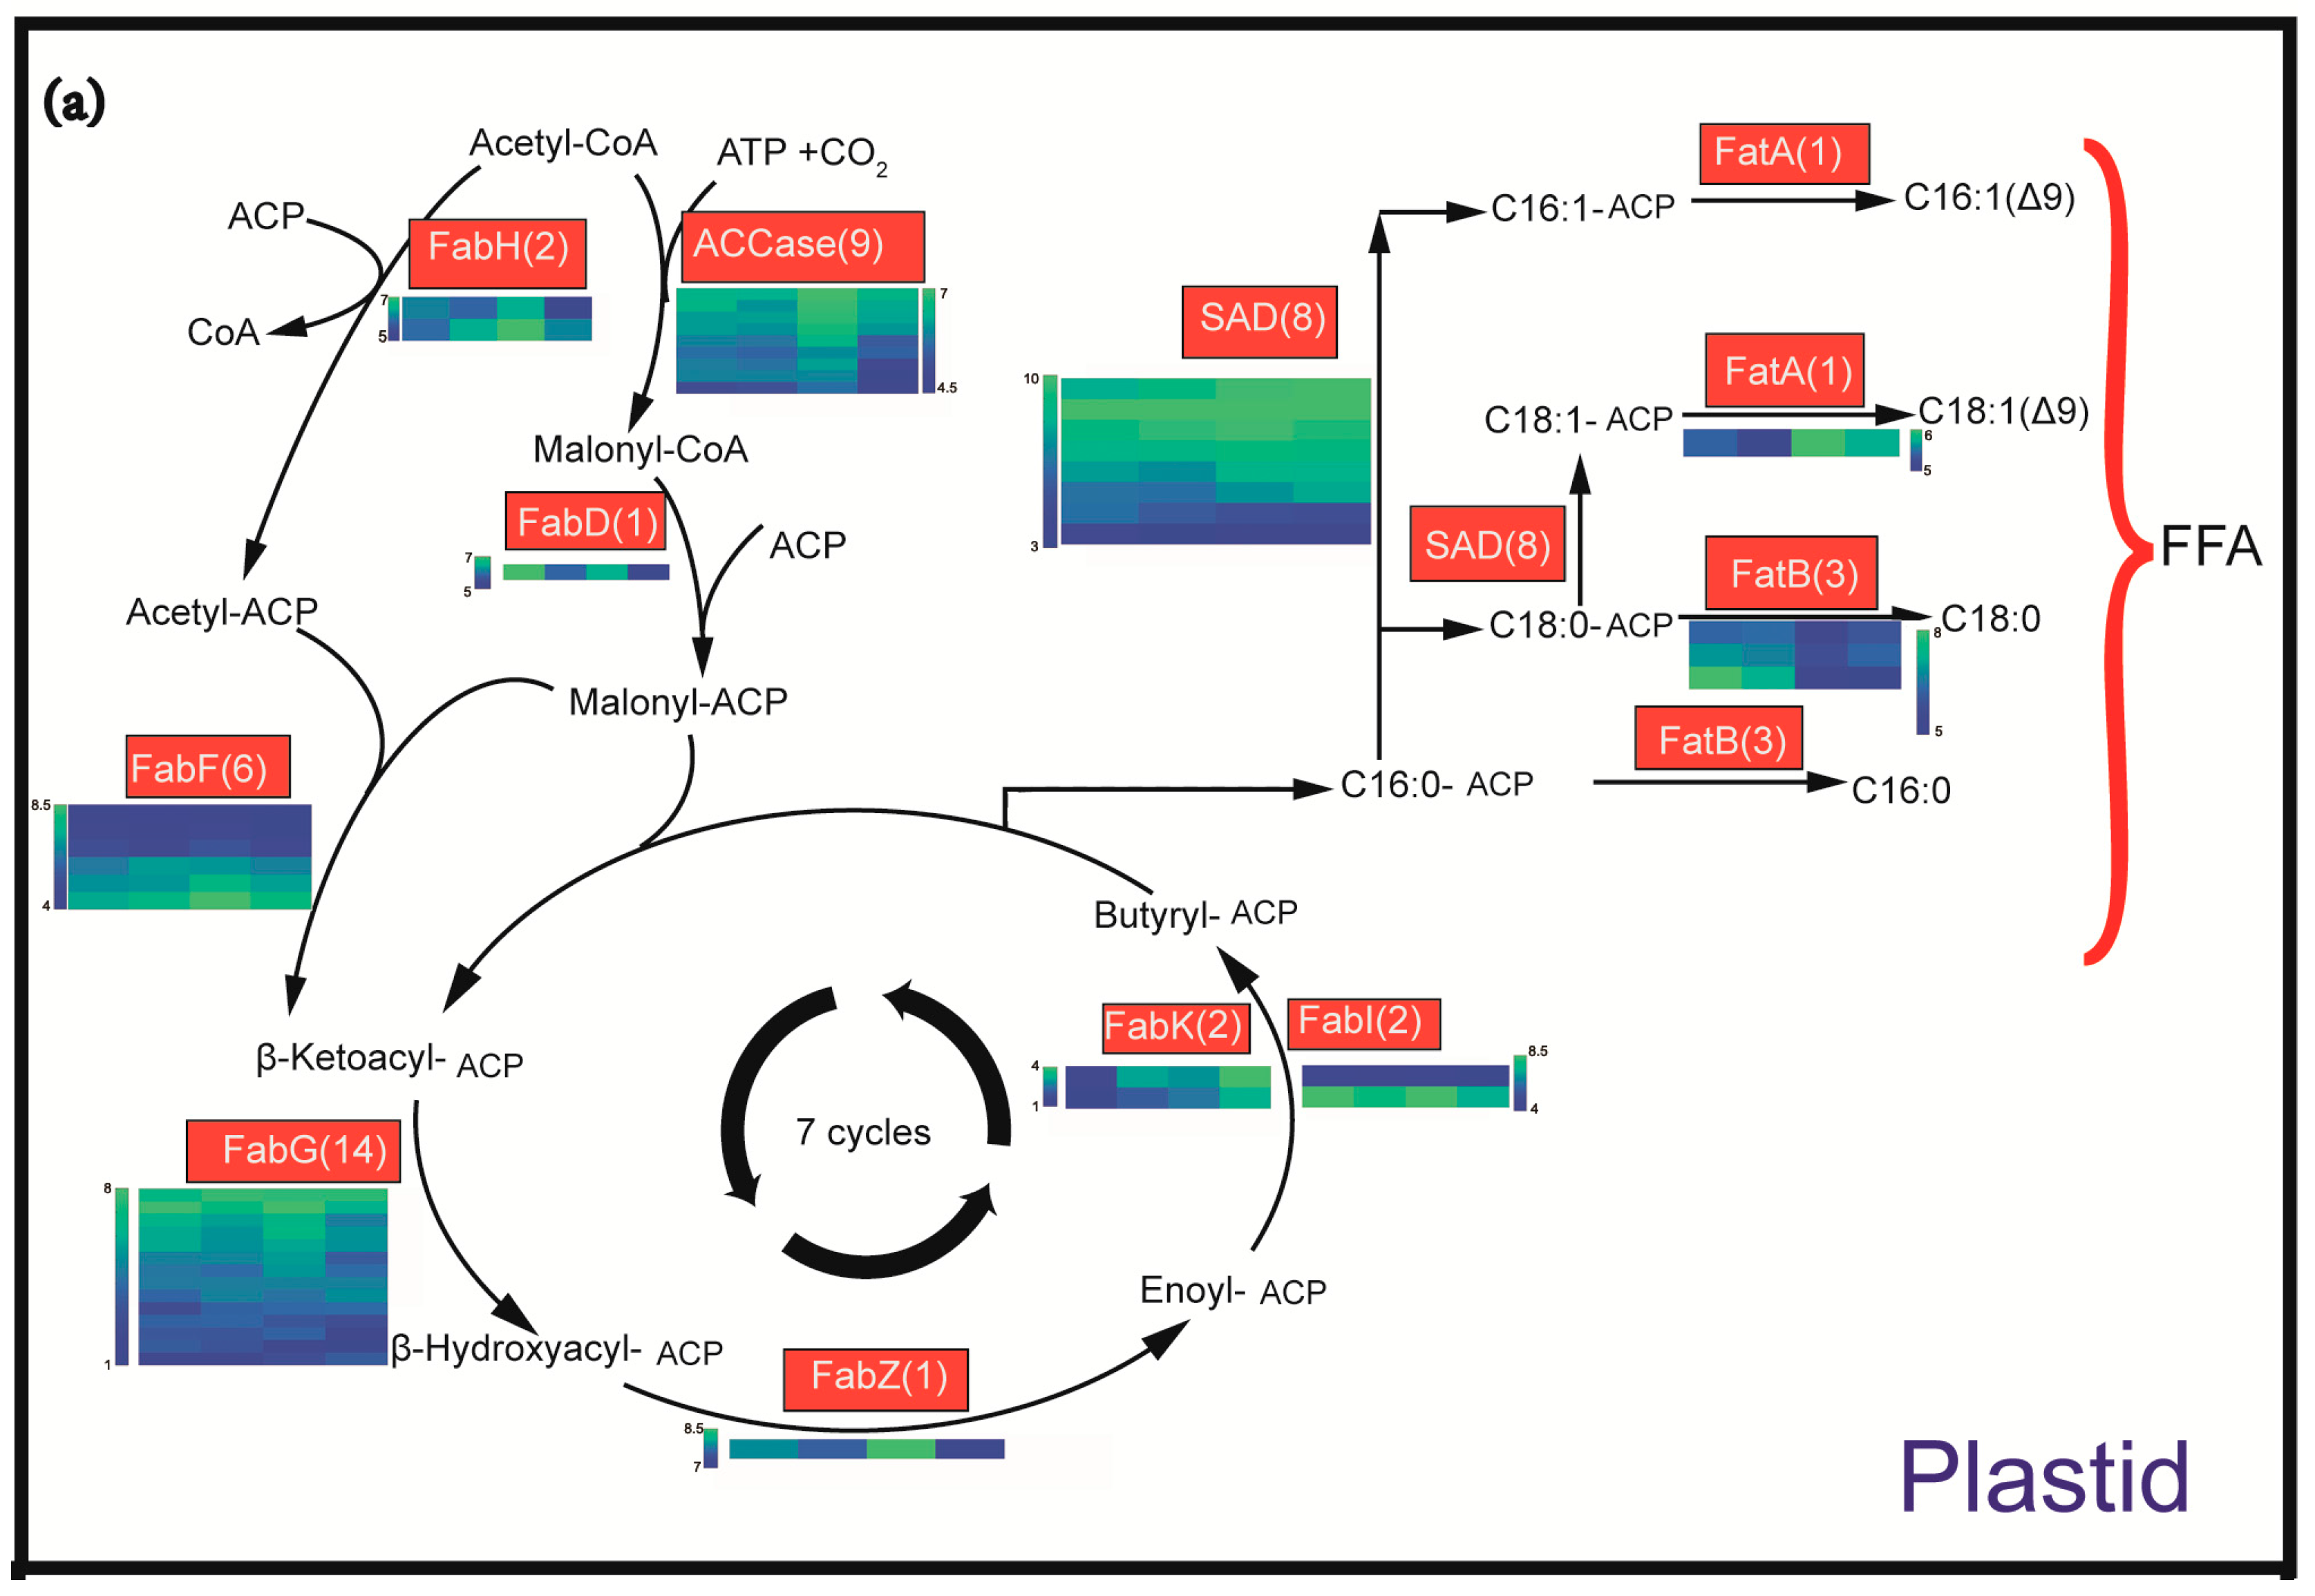
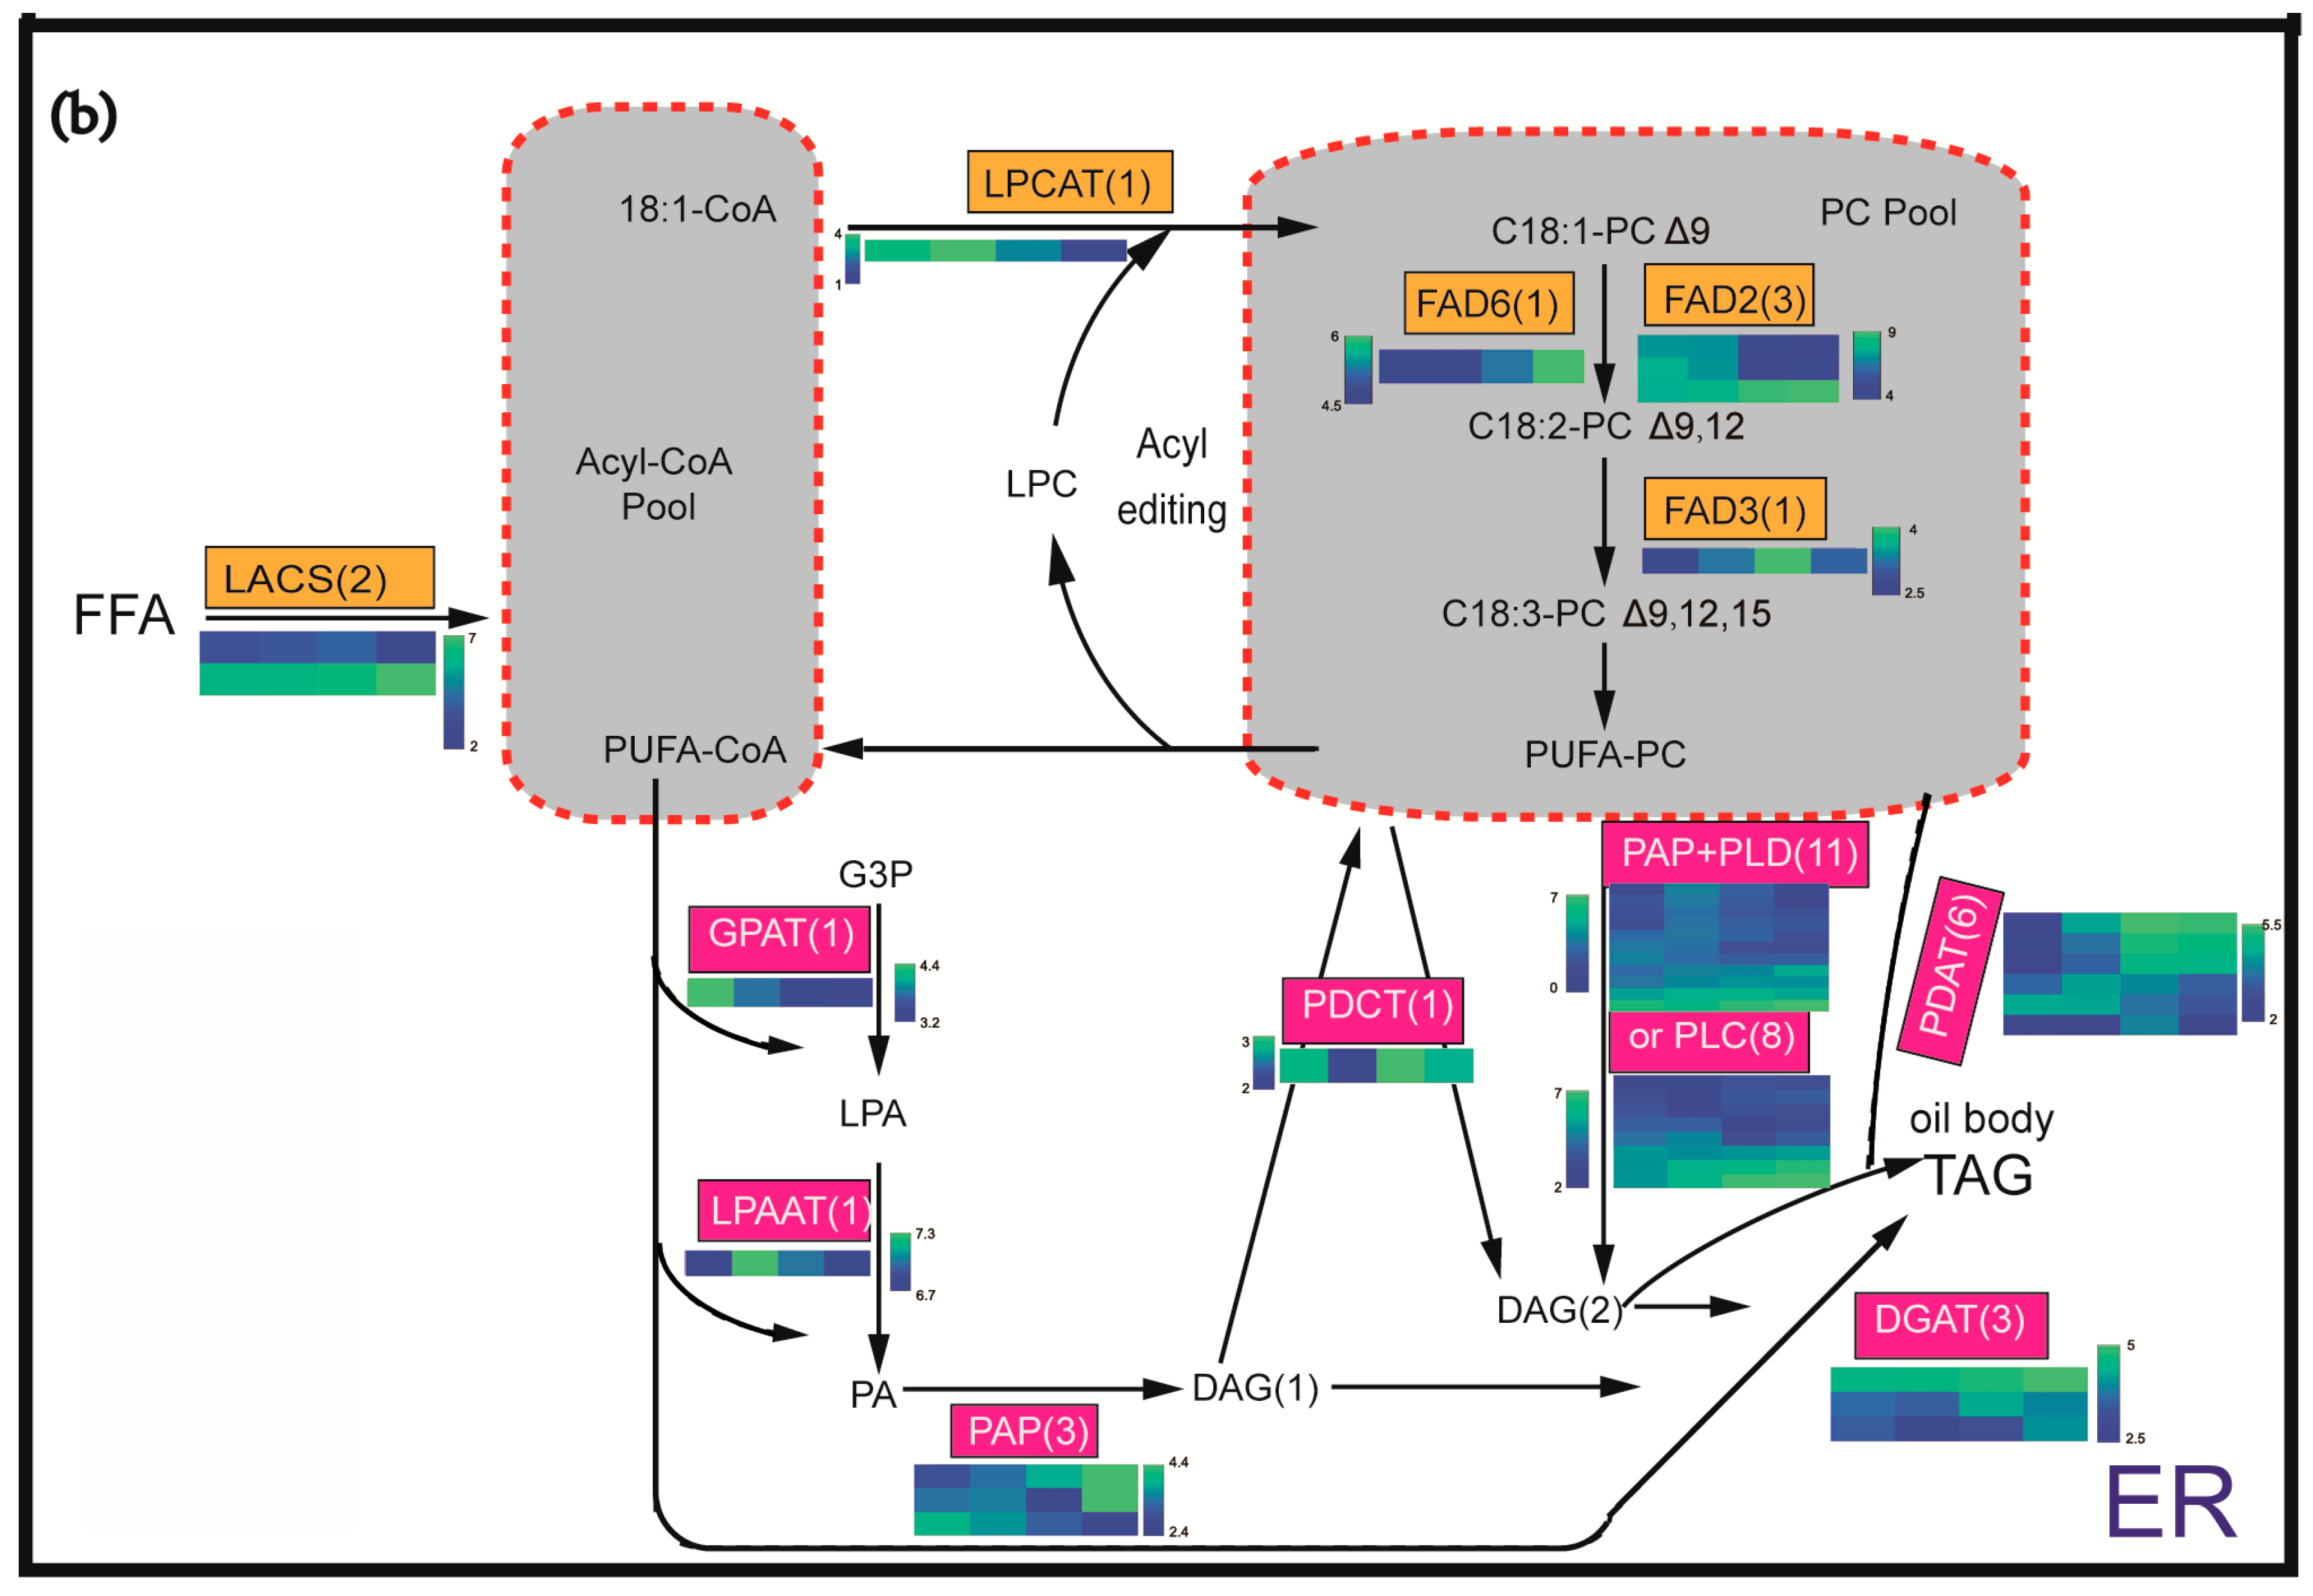
2.4. Identification and Expression Profiling of Enzymes Involved in Lipid Biosynthesis

To investigate the regulatory mechanism of oil accumulation, the plant lipid biosynthesis pathway [6] was evaluated with genes identified in the C. oleifera transcriptome. We found 385 unigenes associated with the biosynthesis of oil based on the annotation (see Table S9) and enzymes at each step had one or more corresponding unigenes (Figure 4). We performed the clustering analysis of these genes using Short Time-series Expression Miner (STEM) clustering, and the results showed that the expression of these genes was divided into six changing patterns (Figure S3). Most genes belong to three changing patterns, persistently downregulated, expression peak at Stage B and C, and persistently upregulated during the seed development (Figure S3 and Table S10).
Among 385 unigenes, 66 unigenes (FAs synthase genes) were involved in the FAs biosynthesis pathway in plastid (Figure 4a and Table S11); 48 unigenes were involved in the FA modification and acyl editing pathway (Figure 4b and Table S12); 108 unigenes were associated with the TAG assembly (Figure 4b and Table S13). To understand the potential roles of lipid biosynthesis enzymes, the expression of unigenes with the sum RPKM value over 20 were analyzed further (Figure 4). We showed that some homologous transcripts displayed similar expression patterns, for example the acetyl CoA:ACP transacylase and ACCase transcripts had similar expression profiles to one another during seed development (Figure 4a). On the other hand, some transcripts of several gene families had differential or reversed expression patterns over seed development. For instance, the levels of β-ketoacyl-ACP reductase, SADs, FAD2 and phospholipid:diacylglycerol acyltransferase (PDATs) were peaked at different stages (Figure 4), which suggested the function study of every member in a gene family might be important in lipid biosynthesis.
To investigate the high-level 18:1 accumulation in C. oleifera seeds, we focused on several key enzymes related to 18:1 biosynthesis. The SADs catalyze the 18:0-ACP to 18:1-ACP, which had eight homologous transcripts with the sum RPKM over 20 (Figure 4a). Six transcripts of SADs had peak expressions at Stage C or D, and two transcripts peaked at Stage A (Figure 4a). FAD2 and fatty acid desaturase 6 desaturate 18:1-phosphatidylcholine (PC) to 18:2-PC, which will reduce the 18:1 contents of TAG (Figure 4b). Notably, we found that two transcripts of FAD2 had inverted expression patterns with most SADs, which were dramatically downregulated at Stage C and Stage D (Figure 4). These expression profiles of enzymes correlated well with the oil content and FA compositions during the seed development, suggesting a synergistic regulatory mechanism involved in fine-tuning the seed oil quality.
TAG assembly is an important step for oil body synthesis and accumulation in seed. We found 33 transcripts including 11 phospholipase D (PLD), 8 phospholipase C (PLC), 6 PDAT, 3 phosphatidic acid phosphatase (PAP), 3 DGAT, 1 acyl-CoA:glycerol-3-phosphate acyltransferase (GPAT) and 1 acyl-CoA:lyso-phosphatidic acid acyltransferase (LPAAT) that were expressed at high levels in seeds (Figure 4b). GPAT (All-Unigene63667) and LPAAT (All-Unigene29697) had the highest expression levels at Stage A and Stage B, respectively. Acyl-CoA:lysophosphatidylcholine acyltransferase (LPCAT) (All-Unigene17565), the main enzyme of “acyl editing”, had the highest expression levels at Stage B (Figure 4b).
DGAT is identified as a rate-limiting enzyme to catalyze the final step of oil body formation in several oil crops [19,20,21]. We found that the three transcripts corresponding to DGATs consistently peaked at the late stages in C. oleifera seeds (Figure 4b). These results indicated that the regulation of DGAT expression is an important regulator of TAG assembly and oil accumulation in C. oleifera, which is the same as other oil crops.

2.5. Validation of RNA-Seq Results by qRT-PCR

To confirm the accuracy and reproducibility of the RNA-Seq results, we selected 16 candidate genes for qRT-PCR analysis (Figure 5). Among 16 candidate genes, 6 candidate genes were involved in the FA synthesis pathway including acetyl CoA:ACP transacylase (All-Unigene29235), FA synthase (All-Unigene11731), β-ketoacyl-ACP synthase (All-Unigene25953), β-ketoacyl-ACP reductase (All-Unigene2917), β-Hydroxyacyl ACP dehydrase (All-Unigene5873), acyl-ACP thioesterase A (FatA, All-Unigene26324) and 3 candidate genes involved in the FA desaturation pathway, including FAD2 (All-Unigene25975), Δ-15 desaturase 3 (All-Unigene1225) and Δ-15 desaturase 8 (All-Unigene7225). Three candidate genes of squalene synthetase (All-Unigene19917), squalene cyclase (All-Unigene20104) and β-amyrin synthase (All-Unigene28534) were involved in steroid biosynthesis. The remaining four candidate genes encoding 3-hydroxyacyl-CoA dehydrogenase (All-Unigene27244), acetyl-CoA carboxylase carboxyl transferase α subunit (All-Unigene12649), enoyl-CoA hydratase (All-Unigene29899) and palmitoyl-protein thioesterase (All-Unigene6679) were involved in FA catabolism. The expression levels of each gene in Stages A, B, C and D were measured through qRT-PCR and compared with the RNA-Seq results (Figure 5). We showed that the expression profiles of the 16 unigenes were mostly consistent between RT-PCR and RNA-Seq experiments (Figure 5), which indicated that the expression profiles of our transcriptomics results were highly confident.

3. Discussion

3.1. Oil Content and FA Composition Correlated with Expression Profiles of Lipid Biosynthesis Genes during the Seed Development of C. oleifera

Camellia oil is called ‘oriental olive oil’ due to the high contents of unsaturated FAs [1,28,34]. We measured the dry kernel oil content and FA composition and found that the oil contents had a significant difference during seed development (Figure 1). The lipid accumulation rate was slower at the early period and quicker at the late stages (Figure 1a), which was consistent with the previous results [31]. The significant change of oil content and FA composition suggested that some key genes had expression level regulation during the seed development of C. oleifera. The transcriptomics analysis identified six subsets of up- and down-regulated genes among stages (Figure 2). We showed that there were many more DEGs across the stages with significant changes of oil contents than DEGs between the early (Stage B-A) and late stages (Stage D-C). More importantly, the DEGs between the stages with significant differences of oil contents were shared in a large proportion (Figure 2). These results indicate that the substantial changes of oil contents and FA compositions are regulated by some key pathways, and DEGs discovered in this work will be useful for identifying regulators of lipid biosynthesis.
We evaluated the lipid biosynthesis pathway to investigate gene expression patterns of key enzymes in C. oleifera (Figure 4). Previous studies revealed that the levels of saturated FAs and carbon chain length are determined in the plastid FA synthesis pathway [6]. ACCase is thought to be a key enzyme controlling the flux of carbon into FAs [35,36]. In this study, nine ACCases were identified, and all of them had a similar expression trend peaked at Stage C (Figure 4a, Table S9), which was consistent with the oil accumulation trend (Figure 1a). It suggested that ACCase and the majority of enzymes related to FA synthesis may be the important enzymes related to oil accumulation in C. oleifera. It is demonstrated that the FA carbon chain length and saturation are regulated by the activities of FatA, Acyl-ACP thioesterase B (FatB), SAD and KASII [37,38]. In this study, we showed that 1 FatA, 3 FatB and 8 SADs were differentially expressed (Figure 4a). During the seed development, FatA had the highest expression level at Stage C, which was consistent with the oleic acid content quickly raised at Stage C (Figure 1b, Table S1). The expression level of FatB was downregulated with the seed ripening, which was consistent with the downtrend of total saturated FA content (Figure 1b). These results suggest that the expression of FA biosynthesis genes, such as FatA, FatB and SADs, is regulated in a synergistic manner to direct the carbon source for oil production in C. oleifera seeds.

3.2. A Synergistic Regulation of SADs and FAD2 Contributing to the High 18:1 FA Content

The 18:1 FA is dominant in Camellia oil, which resembles the study in hickory [23]. FatA and FatB are the enzymes that hydrolyze the 18:1-ACP and 16:0-ACP to produce free 18:1 and 16:0, respectively; and SADs catalyze 18:0-ACP to produce 18:1-ACP, which is the rate-limiting step in the formation of unsaturated FAs [6]. To achieve the high level of 18:1, we showed that the upregulation of SADs coupled with the downregulation of FAD2 might be critical in Camellia oil biosynthesis (Figure 4). The transcriptomic and lipid profiling in hickory seeds (Carya cathayensis) proposed that synergistic regulation of a high level of SAD with a low level of FAD2 facilitated the 18:1 accumulation [23]. Our results are in good agreement with the discovery in hickory, which suggests that perhaps a similar regulatory mechanism is involved. In the model plant Arabidopsis, the transcription factors, such as WRINKLED1, LEAFY COTYLEDON2 and FUSCA3, are revealed as master regulators to control a subset of enzyme genes to modify lipid biosynthesis [39]. We identified the WRINKLED1 and FUSCA3 homologs from C. oleifera transcriptome with an E-value less than 10−5 and found that the expression level of the WRINKLED1 homolog (All-Unigene10602) had no significant difference between the four stages. Multiple differentially-expressed FUSCA3 unigenes were detected, including All-Unigene27710, All-Unigene1623, All-Unigene38005, All-Unigene3928, All-Unigene19081, All-Unigene14850 and All-Unigene1408, with a consistent downregulation trend during the seed development. It was shown that the FUSCA3 might be an important regulator to modify lipid biosynthesis in C. oleifera. We could not found any homolog transcript of LEAFY COTYLEDON2. A recent study in olive tree has demonstrated that the evolution of a siRNA from a transposable element negatively regulated the expression of FAD2 during seed oil biosynthesis, which was correlated with the high content of 18:1 FAs [26]. These results suggested a potential convergent evolution process regarding the accumulation of 18:1 FA in different oil crops. However, future studies are needed to understand how SADs and FAD2 expression levels are regulated in C. oleifera.

3.3. Utilization of DAG Production by PLD or PLC Plus PAP as the Substrate for TAG Synthesis May Be the Important Pathway of the Incorporation of FA PC-Derived in TAG in C. oleifera

The incorporation of FA PC-derived in TAG may involve three mechanisms: (1) “acyl editing” [6,40]; (2) transfer of an FA from PC to DAG, producing TAG by PDAT [6,41]; (3) TAG synthesis using PC-derived DAG as the substrate [6,41]. LPCAT isoforms can play a role in the exchange of FA between the pool of PC and that of acyl-CoA through the “acyl editing” mechanism [40]. This process constitutes the first potential mechanisms for FA PC-derived incorporation into TAG. Because LPCAT (All-Unigene17565) was downregulated during the seed development (Figure 4b), “acyl editing” was not likely to play an important role during Camellia oil accumulation. A second possible mechanism consists of the transfer of FA from PC to DAG by the PDAT to form lyso-PC and TAG. LPCAT is then necessary to regenerate PC from lyso-PC produced by PDAT. Therefore, even though the three main PDAT unigenes (All-Unigene6121, All-Unigene63539, All-Unigene73309) were upregulated at Stage C (Table S13), downregulation of LPCAT might be sufficient to lower FA incorporation in TAG by this mechanism during Camellia oil biosynthesis. The third mechanism has two alternative enzymatic routes to generate PC-derived DAG. The first possible route involves DAG-PC inter-conversion. DAG species formed through the Kennedy pathway are converted to PC through CPT or PDCT activity [6,42]. Oleate esterified to the resulting PC at the sn-2 position can then be desaturated to 18:2 by FAD2, and the resulting 18:2 can be further desaturated to 18:3 by FAD3. The reversibility of the reactions catalyzed by CPT and PDCT enables enrichment of DAG in PUFA. Another possible route is a lipase-based mechanism utilizing PLC or PLD plus PAP. Different plants have different combinations of PC-derived DGA generation routes [43,44]. In this study, we found one transcript of PDCT with a low expression level and could not find any transcript of CPT, which was likely to contribute to the very high Camellia oil content in MUFA. We obtained 11 PLD and eight PLC homologous transcripts with the sum RPKM over 20, respectively. Additionally, the main PLD and PLC unigenes were upregulated at the late stage (Table S13). It was possible that the PLC or PLD plus PAP enzymatic route was the more important PC-derived DAG generation pathway in C. oleifera, which resembled the study in soybean [44].

3.4. DGATs May Be Rate-Limiting Genes in the Control of the TAG Flux and Oil Production

In TAG synthesis, DAG is synthesized by two main pathways in plants: (1) de novo DAG synthesis (Kennedy pathway) and (2) conversion of the membrane lipid PC to DAG [41]. The choice of de novo synthesis and PC-derived DAG appears to be diverse and influenced by species, tissues, developmental stages or environmental conditions [40,41,45]. It is shown that most 18:1 entered PC-derived DAG synthesis, but not de novo DAG synthesis in many plants [37].
In this study, transcripts involved in both de novo and PC-derived DAG synthesis were found (Figure 4b, Table S9). We examined the expression profiles of these transcripts and found that the GPAT and LPAAT involved in the Kennedy pathway showed downregulation (Figure 4b). Most of the phospholipase C and PDAT in PC-derived DAG synthesis were upregulated during seed ripening (Figure 4b). Although the 18:1 (which was not modified upon PC) content in the accumulated TAG raised from 37.43%–81.53%, and 18:2 (modified upon PC) content decreased from 40.62%–6.80% (Figure 1b, Table S1) during the seed development; the relative flux of TAG synthesis from PC-derived DAG may be more important than that from de novo DAG in C. oleifera seed. These results were consistent with the results of GO enrichment analysis in which PC metabolism was significantly enriched when using the common DEGs from Stage B-A, Stage C-A and Stage D-A (Figure 3). DGAT is the last enzyme participating in TAG synthesis pathway and has been shown to play a key role in catalyzing TAG production in many oil crops [20,46,47,48]. We found that three DGAT unigenes showed consistent expression profiles peaked at Stage C or Stage D in this study, which were consistent with the oil accumulation trend (Figure 1a). It suggests that DGAT may be also playing important roles in the oil accumulation of C. oleifera seeds.

4. Materials and Methods

4.1. Plant Materials

C. oleifera var. ‘Changlin No. 4’ is an elite cultivar of oil production in China. In this study, C. oleifera ‘Changlin No. 4’ individuals were obtained from a 4-year-old clonal plantation located in Jinhua city, Zhejiang province, China. C. oleifera flowers in late October, and the fruits take 12 months to mature. According to the multiyear data of phenotype, C. oleifera flowers and fertilizes in late October, and the fruit development is in dormancy until the next May. The fruit begins to expand in May; the seeds expand and the kernels can be isolated until late June. Therefore, all sampling was done in the last third period of seed development in this study. We marked 100 flowers opening on the same day on one tree, and the seeds were harvested at four development stages from the marked fruits, 264 days after fertilization, which was the kernel expanding early period (Stage A), 294 days after fertilization the kernel quickly expanding period (Stage B), 324 days after fertilization the kernel expanding late period (Stage C) and 354 days after fertilization the kernel maturation period (Stage D). One part of the kernels was immediately immersed in liquid nitrogen for about 5 min and then stored at −80 °C in freezers for RNA extraction. The other part of kernels was dried at 105 °C for chemical analysis of oil content and FAs’ compositions.

4.2. Oil Content and FA Component Analysis

Total lipid was extracted from kernel by petroleum ether. Kernel oil content was measured by the Soxtec extraction method according to the previous study [49]. FA components were quantified using gas chromatography as described [50]. Data Processing System (DPS 14.50) software [51] was used to perform the statistical analysis. The significant difference among different stages was obtained by one-way ANOVA.

4.3. Total RNA Extraction

The total RNAs were extracted from 4 stages of kernels, respectively, using the TRIzol RNA Extraction Kit (Invitrogen, Carlsbad, CA, USA) according to the user manual. RNA quality and quantity were evaluated by 1% agarose gel electrophoresis and an Agilent Bioanalyzer 2100 (Agilent Technologies, Santa Clara, CA, USA) device. The RNAs with a concentration no less than 400 ng/μL, 28S rRNA/18S rRNA over 1.8 and RNA Integrity Number (RIN) over 8.0, were defined as qualified RNA samples for further experiments.

4.4. Transcriptome Sequencing, Assembly and Functional Annotation

The 4 μg total RNA from each stage were used for library preparation. mRNA was purified from total RNA using oligo(dT)-attached magnetic beads. The library construction and sequencing was performed by Beijing Genomics Institute (BGI, Shenzhen, China) on an Illumina GAIIx platform according to Trick et al., method [52]. The Illumina GAIIx platform generated short sequencing reads with 75 bp in length by paired-end sequencing. All un-filtered raw data have been submitted to the NCBI BioProject, and the accession number is SRP111395.
Prior to assembly, We implemented a quality filter to remove the adaptor sequences, empty reads and low-quality sequences by controlling the percentage of the nucleotides that had Phred quality scores less than 20 [53]. The reads of the 4 stages were separately assembled into contigs, then unigenes using SOAP de novo software [54]. The unigenes of the 4 stages were further assembled using sequence clustering software TGICL [55] and the redundant sequences removed. The longest and non-redundant unigenes were defined as All-Unigenes in this study.
Functional annotation of All-Unigenes was carried out by BLASTx search with several public databases: the NCBI Nr database, the Swiss-Prot database, the Clusters of Orthologous Groups (COG) database, the Kyoto Encyclopedia of Genes and Genomes (KEGG) and the Gene Ontology (GO) annotation database. The threshold of the E-value was less than 10−5. After functional annotation, the unigenes with the GO annotation were GO classified using WEGO software [56].

4.5. Clustering, Identification of DEGs and GO Enrichment

We performed gene expression clustering by K-means and Short Time-series Expression Miner (STEM) methods. The read counts were normalized to the RPKM value to represent the gene expression level. The unigenes with a total RPKM value less than 10 were filtered, and the remaining expression levels were normalized by the log2 method. The MATLAB Bioinformatics toolbox was used to perform K-means clustering with Euclidean distance, and STEM clustering was performed as described [57]. DEGs were analyzed using Audic and Claverie’s method [58], and p-value correction was performed using Benjamini and Yekutieli’s approach to control FDR. Genes with FDR ≤ 0.001 and RPKM value differences over two-times were regarded as DEG. The DEG distribution among different stages was performed using Venny [59]. GO term enrichment analysis was carried out by the hypergeometric test and visualized using ReviGO [60]. GO terms with an adjusted FDR < 0.0001 by Benjamini and Hochberg’s approach were selected for visualization.

4.6. Quantitative RT-PCR Analysis

The RNA samples used for qRT-PCR analysis were the same as those for the next-generation sequencing experiments. Single-strand cDNA for each sample was synthesized using the First-Strand Synthesis System (Invitrogen, Carlsbad, CA, USA). The primer pairs (see Table S14) were designed according to the selected unigene sequences using Primer 5.0 software. The primers were 19–21 bp in length, and had amplicon lengths of 200–260 bp. Cellulose synthase A (CESA) was used as the reference gene, and the M-value was calculated according Zhou et al., method [61] was 0.6265 in this study. The amplification procedures were performed as described [61]. The qRT-PCR was carried out in three replications for each sample, and the relative expression level of genes was calculated by the 2−ΔΔCt method [62].

5. Conclusions

In this study, the oil contents and FA compositions of C. oleifera seed at different development stages were measured. We showed that total oil production of kernel increased dramatically at the late stages, and 18:1 was predominantly accumulated during seed maturation. Through transcriptomics profiling, we obtained several sets of DEGs between the different seed development stages. We showed that the number of DEGs correlated with the oil accumulation, and more common DEGs were identified across early and late stages of seed development. Further functional enrichment of subsets of DEGs revealed that the lipid biosynthesis pathway and related biological processes were related to seed oil accumulation. Moreover, gene expression analysis of key enzymes suggested that the coordination of high SADs and low FAD2 activities was required for 18:1 domination. Overall, our study provides some first hypotheses about and initial clues into the gene expression patterns for oil accumulation and FA composition in C. oleifera seed and may pave the way to expedite the breeding of C. oleifera with higher oil content and better oil quality.

Supplementary Materials

Supplementary materials can be found at www.mdpi.com/1422-0067/19/1/108/s1.

Acknowledgments

This work was supported by funds from the National Natural Science Foundation of China (No. 31400580) and the Fundamental Research Funds for the Central Non-profit Research Institution of Chinese Academy of Forestry (No. CAFYBB2014QB037, CAFYBB2016SZ001).

Author Contributions

Xiaohua Yao, Hengfu Yin and Ping Lin designed and conceived of the study. Kailiang Wang and Yunhai Xie analyzed and interpreted the characteristics of oil accumulation and fatty acid components. Changfu Zhou and Ping Lin performed the qRT-PCR analysis. Hengfu Yin, Kailiang Wang and Ping Lin interpreted the data and supervised the project. Hengfu Yin, Ping Lin and Kailiang Wang wrote the paper. All authors read and approved the final manuscript.

Conflicts of Interest

The authors declare that the research was conducted in the absence of any commercial or financial relationships that could be construed as a potential conflict of interest.

Abbreviations

COGClusters of Orthologous Groups
KEGGKyoto Encyclopedia of Genes and Genomes
GOGene Ontology
PDATPhospholipid:diacylglycerol acyltransferase
FatA and FatBAcyl-ACP thioesterase
PCPhosphatidylcholine
GPATAcyl-CoA:glycerol-3-phosphate acyltransferase
LPAATAcyl-CoA:lyso-phosphatidic acid acyltransferase
PUFAPolyunsaturated fatty acid
EREndoplasmic reticulum
FabHAcetyl CoA:ACP transacylase
FabDMalonyl CoA:ACP transacylase
FabFβ-Ketoacyl-ACP synthase
FabGβ-Ketoacyl-ACP reductase
FabZβ-Hydroxyacyl ACP dehydrase
FabI and FabKEnoyl-ACP reductase
FFAFree fatty acid
LACSLong chain acyl-CoA synthetase
LPCATAcyl-CoA:LPC acyltransferase
LPCLysophosphatidylcholine
FADFatty acid desaturase
G3PGlycerol-3-phosphate
GPATAcyl-CoA:G3P acyltransferase
LPALyso-phosphatidic acid
PAPhosphatidic acid
PAPPA phosphatase
PLCPhospholipase C
PLDPhospholipase D

References

  1. Li, H.; Zhou, G.Y.; Zhang, H.Y.; Liu, J.A. Research progress on the health function of tea oil. J. Med. Plants Res. 2011, 5, 485–489. [Google Scholar]
  2. Yao, X.; Wang, Y.; Wang, K.; Ren, H. Effects of geographic latitude and longitude on fat and its fatty acid composition of oil-tea Camellia seeds. China Oils Fats 2011, 36, 31–34. [Google Scholar]
  3. Yang, C.; Liu, X.; Chen, Z.; Lin, Y.; Wang, S. Comparison of Oil Content and Fatty Acid Profile of Ten New Camellia oleifera Cultivars. J. Lipids 2016, 2016. [Google Scholar] [CrossRef] [PubMed]
  4. Ohlrogge, J.B. Design of New Plant Products: Engineering of Fatty Acid Metabolism. Plant Physiol. 1994, 104, 821–826. [Google Scholar] [CrossRef] [PubMed]
  5. Yu, Y.; Ren, S.; Tan, K. Study on climatic regionalization and layer and belt distribution of oiltea Camellia quality in China. J. Nat. Res. 1999, 14, 123–127. [Google Scholar]
  6. Bates, P.D.; Stymne, S.; Ohlrogge, J. Biochemical pathways in seed oil synthesis. Curr. Opin. Plant Biol. 2013, 16, 358–364. [Google Scholar] [CrossRef] [PubMed]
  7. Ohlrogge, J.B.; Jaworski, J.G. Regulation of Fatty Acid Synthesis. Annu. Rev. Plant Physiol. Plant Mol. Biol. 1997, 48, 109–136. [Google Scholar] [CrossRef] [PubMed]
  8. Chapman, K.D.; Ohlrogge, J.B. Compartmentation of triacylglycerol accumulation in plants. J. Biol. Chem. 2012, 287, 2288–2294. [Google Scholar] [CrossRef] [PubMed]
  9. Bafor, M.; Jonsson, L.; Stobart, A.K.; Stymne, S. Regulation of triacylglycerol biosynthesis in embryos and microsomal preparations from the developing seeds of Cuphea lanceolata. Biochem. J. 1990, 272, 31–38. [Google Scholar] [CrossRef] [PubMed]
  10. Bao, X.; Ohlrogge, J. Supply of fatty acid is one limiting factor in the accumulation of triacylglycerol in developing embryos. Plant Physiol. 1999, 120, 1057–1062. [Google Scholar] [CrossRef] [PubMed]
  11. Baud, S.; Lepiniec, L. Physiological and developmental regulation of seed oil production. Prog. Lipid Res. 2010, 49, 235–249. [Google Scholar] [CrossRef] [PubMed]
  12. Baud, S.; Wuilleme, S.; To, A.; Rochat, C.; Lepiniec, L. Role of WRINKLED1 in the transcriptional regulation of glycolytic and fatty acid biosynthetic genes in Arabidopsis. Plant J. Cell Mol. Biol. 2009, 60, 933–947. [Google Scholar] [CrossRef] [PubMed]
  13. Ruuska, S.A.; Girke, T.; Benning, C.; Ohlrogge, J.B. Contrapuntal networks of gene expression during Arabidopsis seed filling. Plant Cell 2002, 14, 1191–1206. [Google Scholar] [CrossRef] [PubMed]
  14. Shah, F.H.; Cha, T.S. A mesocarp-and species-specific cDNA clone from oil palm encodes for sesquiterpene synthase. Plant Sci. Int. J. Exp. Plant Biol. 2000, 154, 153–160. [Google Scholar] [CrossRef]
  15. Thompson, G.A.; Scherer, D.E.; Foxall-Van Aken, S.; Kenny, J.W.; Young, H.L.; Shintani, D.K.; Kridl, J.C.; Knauf, V.C. Primary structures of the precursor and mature forms of stearoyl-acyl carrier protein desaturase from safflower embryos and requirement of ferredoxin for enzyme activity. Proc. Natl. Acad. Sci. USA 1991, 88, 2578–2582. [Google Scholar] [CrossRef] [PubMed]
  16. Fofana, B.; Cloutier, S.; Duguid, S.; Ching, J.; Rampitsch, C. Gene expression of stearoyl-ACP desaturase and Δ12 fatty acid desaturase 2 is modulated during seed development of flax (Linum usitatissimum). Lipids 2006, 41, 705–712. [Google Scholar] [CrossRef] [PubMed]
  17. Wang, Y.; Zhang, X.; Zhao, Y.; Prakash, C.S.; He, G.; Yin, D. Insights into the novel members of the FAD2 gene family involved in high-oleate fluxes in peanut. Genome 2015, 58, 375–383. [Google Scholar] [CrossRef] [PubMed]
  18. Tang, M.; Guschina, I.A.; O’Hara, P.; Slabas, A.R.; Quant, P.A.; Fawcett, T.; Harwood, J.L. Metabolic control analysis of developing oilseed rape (Brassica napus cv Westar) embryos shows that lipid assembly exerts significant control over oil accumulation. New Phytol. 2012, 196, 414–426. [Google Scholar] [CrossRef] [PubMed]
  19. Lardizabal, K.; Effertz, R.; Levering, C.; Mai, J.; Pedroso, M.C.; Jury, T.; Aasen, E.; Gruys, K.; Bennett, K. Expression of Umbelopsis ramanniana DGAT2A in seed increases oil in soybean. Plant Physiol. 2008, 148, 89–96. [Google Scholar] [CrossRef] [PubMed]
  20. Shockey, J.M.; Gidda, S.K.; Chapital, D.C.; Kuan, J.C.; Dhanoa, P.K.; Bland, J.M.; Rothstein, S.J.; Mullen, R.T.; Dyer, J.M. Tung tree DGAT1 and DGAT2 have nonredundant functions in triacylglycerol biosynthesis and are localized to different subdomains of the endoplasmic reticulum. Plant Cell 2006, 18, 2294–2313. [Google Scholar] [CrossRef] [PubMed]
  21. Taylor, D.C.; Zhang, Y.; Kumar, A.; Francis, T.; Giblin, E.M.; Barton, D.L.; Ferrie, J.R.; Laroche, A.; Shah, S.; Zhu, W.; et al. Molecular modification of triacylglycerol accumulation by over-expression of DGAT1 to produce canola with increased seed oil content under field conditions. Botany 2009, 87, 533–543. [Google Scholar] [CrossRef]
  22. Clemente, T.E.; Cahoon, E.B. Soybean Oil: Genetic Approaches for Modification of Functionality and Total Content. Plant Physiol. 2009, 151, 1030–1040. [Google Scholar] [CrossRef] [PubMed]
  23. Huang, J.Q.; Zhang, T.; Zhang, Q.X.; Chen, M.; Wang, Z.J.; Zheng, B.S.; Xia, G.H.; Yang, X.Y.; Huang, C.Y.; Huang, Y.J. The mechanism of high contents of oil and oleic acid revealed by transcriptomic and lipidomic analysis during embryogenesis in Carya cathayensis Sarg. BMC Genom. 2016, 17, 113. [Google Scholar] [CrossRef] [PubMed]
  24. Wiberg, E.; Banas, A.; Stymne, S. Fatty acid distribution and lipid metabolism in developing seeds of laurate-producing rape (Brassica napus L.). Planta 1997, 203, 341–348. [Google Scholar] [CrossRef] [PubMed]
  25. Bourgis, F.; Kilaru, A.; Cao, X.; Ngando-Ebongue, G.F.; Drira, N.; Ohlrogge, J.B.; Arondel, V. Comparative transcriptome and metabolite analysis of oil palm and date palm mesocarp that differ dramatically in carbon partitioning. Proc. Natl. Acad. Sci. USA 2011, 108, 12527–12532. [Google Scholar] [CrossRef] [PubMed]
  26. Unver, T.; Wu, Z.; Sterck, L.; Turktas, M.; Lohaus, R.; Li, Z.; Yang, M.; He, L.; Deng, T.; Escalante, F.J.; et al. Genome of wild olive and the evolution of oil biosynthesis. Proc. Natl. Acad. Sci. USA 2017, 114, E9413–E9422. [Google Scholar] [CrossRef] [PubMed]
  27. Shi, C.; Yang, H.; Wei, C.; Yu, O.; Zhang, Z.; Jiang, C.; Sun, J.; Li, Y.; Chen, Q.; Xia, T.; et al. Deep sequencing of the Camellia sinensis transcriptome revealed candidate genes for major metabolic pathways of tea-specific compounds. BMC Genom. 2011, 12, 131. [Google Scholar] [CrossRef] [PubMed]
  28. Chen, J.; Yang, X.; Huang, X.; Duan, S.; Long, C.; Chen, J.; Rong, J. Leaf transcriptome analysis of a subtropical evergreen broadleaf plant, wild oil-tea Camellia (Camellia oleifera), revealing candidate genes for cold acclimation. BMC Genom. 2017, 18, 211. [Google Scholar] [CrossRef] [PubMed]
  29. Feng, J.; Yang, Z.; Bai, W.; Chen, S.; Xu, W.; El-Kassaby, Y.A.; Chen, H. Transcriptome comparative analysis of two Camellia species reveals lipid metabolism during mature seed natural drying. Trees 2017, 31, 1827–1848. [Google Scholar] [CrossRef]
  30. Dong, B.; Wu, B.; Hong, W.; Li, X.; Li, Z.; Xue, L.; Huang, Y. Transcriptome analysis of the tea oil Camellia (Camellia oleifera) reveals candidate drought stress genes. PLoS ONE 2017, 12, e0181835. [Google Scholar] [CrossRef] [PubMed]
  31. Zeng, Y.L.; Tan, X.F.; Zhang, L.; Jiang, N.; Cao, H.P. Identification and expression of fructose-1,6-bisphosphate aldolase genes and their relations to oil content in developing seeds of tea oil tree (Camellia oleifera). PLoS ONE 2014, 9, e107422. [Google Scholar] [CrossRef] [PubMed]
  32. Zhang, D.Q.; Tan, X.F.; Xie, L.S.; Chen, H.P.; Qiu, J.; Hu, F.M. The cDNA cloning and characteristic of stearoyl-ACP desaturase gene of Camellia oleifera. Sci. Silvae Sin. 2008, 44, 155–159. [Google Scholar]
  33. Lin, P.; Zhou, C.F.; Yao, X.H.; Cao, Y.Q. Sequence and expression characterization of two genes encoding Δ-12 fatty acid desaturases from Camellia oleifera. For. Res. 2016, 29, 743–751. [Google Scholar]
  34. Xia, E.H.; Jiang, J.J.; Huang, H.; Zhang, L.P.; Zhang, H.B.; Gao, L.Z. Transcriptome analysis of the oil-rich tea plant, Camellia oleifera, reveals candidate genes related to lipid metabolism. PLoS ONE 2014, 9, e104150. [Google Scholar] [CrossRef] [PubMed]
  35. Andre, C.; Haslam, R.P.; Shanklin, J. Feedback regulation of plastidic acetyl-CoA carboxylase by 18:1-acyl carrier protein in Brassica napus. Proc. Natl. Acad. Sci. USA 2012, 109, 10107–10112. [Google Scholar] [CrossRef] [PubMed]
  36. Nikolau, B.J.; Ohlrogge, J.B.; Wurtele, E.S. Plant biotin-containing carboxylases. Arch. Biochem. Biophys. 2003, 414, 211–222. [Google Scholar] [CrossRef]
  37. Cahoon, E.B.; Ohlrogge, J.B. Apparent Role of Phosphatidylcholine in the Metabolism of Petroselinic Acid in Developing Umbelliferae Endosperm. Plant Physiol. 1994, 104, 845–855. [Google Scholar] [CrossRef] [PubMed]
  38. Voelker, T.A.; Hayes, T.R.; Cranmer, A.M.; Turner, J.C.; Davies, H.M. Genetic engineering of a quantitative trait: Metabolic and genetic parameters influencing the accumulation of laurate in rapeseed. Plant. J. 1996, 9, 229–241. [Google Scholar] [CrossRef]
  39. Manan, S.; Chen, B.; She, G.; Wan, X.; Zhao, J. Transport and transcriptional regulation of oil production in plants. Crit. Rev. Biotechnol. 2017, 37, 641–655. [Google Scholar] [CrossRef] [PubMed]
  40. Bates, P.D.; Durrett, T.P.; Ohlrogge, J.B.; Pollard, M. Analysis of Acyl Fluxes through Multiple Pathways of Triacylglycerol Synthesis in Developing Soybean Embryos. Plant Physiol. 2009, 150, 55–72. [Google Scholar] [CrossRef] [PubMed]
  41. Bates, P.D.; Browse, J. The significance of different diacylgycerol synthesis pathways on plant oil composition and bioengineering. Front. Plant Sci. 2012, 3, 147. [Google Scholar] [CrossRef] [PubMed]
  42. Lu, C.; Xin, Z.; Ren, Z.; Miquel, M.; Browse, J. An enzyme regulating triacylglycerol composition is encoded by the ROD1 gene of Arabidopsis. Proc. Natl. Acad. Sci. USA 2009, 106, 18837–18842. [Google Scholar] [CrossRef] [PubMed]
  43. Bates, P.D.; Fatihi, A.; Snapp, A.R.; Carlsson, A.S.; Browse, J.; Lu, C. Acyl editing and headgroup exchange are the major mechanisms that direct polyunsaturated fatty acid flux into triacylglycerols. Plant Physiol. 2012, 160, 1530–1539. [Google Scholar] [CrossRef] [PubMed]
  44. Lee, J.; Welti, R.; Schapaugh, W.T.; Trick, H.N. Phospholipid and triacylglycerol profiles modified by PLD suppression in soybean seed. Plant Biotechnol. J. 2011, 9, 359–372. [Google Scholar] [CrossRef] [PubMed]
  45. Bates, P.D.; Browse, J. The pathway of triacylglycerol synthesis through phosphatidylcholine in Arabidopsis produces a bottleneck for the accumulation of unusual fatty acids in transgenic seeds. Plant J. 2011, 68, 387–399. [Google Scholar] [CrossRef] [PubMed]
  46. Katavic, V.; Reed, D.W.; Taylor, D.C.; Giblin, E.M.; Barton, D.L.; Zou, J.; Mackenzie, S.L.; Covello, P.S.; Kunst, L. Alteration of seed fatty acid composition by an ethyl methanesulfonate-induced mutation in Arabidopsis thaliana affecting diacylglycerol acyltransferase activity. Plant Physiol. 1995, 108, 399–409. [Google Scholar] [CrossRef] [PubMed]
  47. Liu, Q.; Siloto, R.M.; Lehner, R.; Stone, S.J.; Weselake, R.J. Acyl-CoA:diacylglycerol acyltransferase: Molecular biology, biochemistry and biotechnology. Prog. Lipid Res. 2012, 51, 350–377. [Google Scholar] [CrossRef] [PubMed]
  48. Zou, J.; Wei, Y.; Jako, C.; Kumar, A.; Selvaraj, G.; Taylor, D.C. The Arabidopsis thaliana TAG1 mutant has a mutation in a diacylglycerol acyltransferase gene. Plant. J. Cell Mol. Biol. 1999, 19, 645–653. [Google Scholar] [CrossRef]
  49. Brkić, K.; Radulović, M.; Sladonja, B.; Lukić, I.; Šetić, E. Application of Soxtec apparatus for oil content determination in olive fruit. Rivista Italiana Delle Sostanze Grasse 2006, 83, 115–119. [Google Scholar]
  50. Lall, R.K.; Proctor, A.; Jain, V.P. A Rapid, Micro FAME Preparation Method for Vegetable Oil Fatty Acid Analysis by Gas Chromatography. J. Am. Oil Chem. Soc. 2009, 86, 309–314. [Google Scholar] [CrossRef]
  51. Tang, Q.Y.; Zhang, C.X. Data Processing System (DPS) software with experimental design, statistical analysis and data mining developed for use in entomological research. Insect Sci. 2013, 20, 254–260. [Google Scholar] [CrossRef] [PubMed]
  52. Trick, M.; Long, Y.; Meng, J.; Bancroft, I. Single nucleotide polymorphism (SNP) discovery in the polyploid Brassica napus using Solexa transcriptome sequencing. Plant Biotechnol. J. 2009, 7, 334–346. [Google Scholar] [CrossRef] [PubMed]
  53. Patton, S.J.; Wallace, A.J.; Elles, R. Benchmark for evaluating the quality of DNA sequencing: Proposal from an international external quality assessment scheme. Clin. Chem. 2006, 52, 728–736. [Google Scholar] [CrossRef] [PubMed]
  54. Li, R.; Zhu, H.; Ruan, J.; Qian, W.; Fang, X.; Shi, Z.; Li, Y.; Li, S.; Shan, G.; Kristiansen, K.; et al. De novo assembly of human genomes with massively parallel short read sequencing. Genome Res. 2010, 20, 265–272. [Google Scholar] [CrossRef] [PubMed] [Green Version]
  55. Pertea, G.; Huang, X.; Liang, F.; Antonescu, V.; Sultana, R.; Karamycheva, S.; Lee, Y.; White, J.; Cheung, F.; Parvizi, B.; et al. TIGR Gene Indices clustering tools (TGICL): A software system for fast clustering of large EST datasets. Bioinformatics 2003, 19, 651–652. [Google Scholar] [CrossRef] [PubMed]
  56. Ye, J.; Fang, L.; Zheng, H.; Zhang, Y.; Chen, J.; Zhang, Z.; Wang, J.; Li, S.; Li, R.; Bolund, L. WEGO: A web tool for plotting GO annotations. Nucleic Acids Res. 2006, 34, W293–W297. [Google Scholar] [CrossRef] [PubMed]
  57. Ernst, J.; Bar-Joseph, Z. STEM: A tool for the analysis of short time series gene expression data. BMC Bioinform. 2006, 7, 191. [Google Scholar] [CrossRef] [PubMed]
  58. Audic, S.; Claverie, J.M. The significance of digital gene expression profiles. Genome Res. 1997, 7, 986–995. [Google Scholar] [CrossRef] [PubMed]
  59. Bardou, P.; Mariette, J.; Escudie, F.; Djemiel, C.; Klopp, C. jvenn: An interactive Venn diagram viewer. BMC Bioinform. 2014, 15, 293. [Google Scholar] [CrossRef] [PubMed]
  60. Supek, F.; Bosnjak, M.; Skunca, N.; Smuc, T. REVIGO Summarizes and Visualizes Long Lists of Gene Ontology Terms. PLoS ONE 2011, 6, e21800. [Google Scholar] [CrossRef] [PubMed]
  61. Zhou, C.F.; Lin, P.; Yao, X.H.; Wang, K.L.; Chang, J.; Han, X.J. Selection of reference genes for quantitative real-time PCR in six oil-tea Camellia based on RNA. Mol. Biol. 2013, 47, 959–975. [Google Scholar] [CrossRef]
  62. Livak, K.J.; Schmittgen, T.D. Analysis of relative gene expression data using real-time quantitative PCR and the 2−ΔΔCt Method. Methods 2001, 25, 402–408. [Google Scholar] [CrossRef] [PubMed]
Figure 1. Seed oil contents and compositions. Quantification of total oil contents (a) and FA components (b) in C. oleifera seeds at four development stages. The mean and standard deviation values were calculated based on three independent measurements. Different lowercase letters of the stages indicate a significant difference at the p < 0.05 level according to one-way ANOVA. Stages A, B, C and D were 264, 294, 324 and 354 days after fertilization, respectively. mg/g means oil content (mg)/dry kernel (g). % means the FA accounts for the percent of all FAs.
Ijms 19 00118 g001
Figure 2. Distribution of DEGs among different development stages in C. oleifera seed and clustering of global gene expression. (a) The number of up- and down-regulated DEGs between Stages; (b) a Venn diagram of DEGs of Stage B-A and Stage C-D; (c) a Venn diagram of DEGs of Stage C-A, Stage C-B, Stage D-A and Stage D-B; the red circle indicates the common DEGs; (d) clusters of the expressed genes obtained by K-means clustering.
Ijms 19 00118 g002
Figure 3. GO enrichment analysis of common DEGs. (a) A Venn diagram of DEGs in Stage B-A, Stage C-A and Stage D-A; the red circle indicates the common DEGs in Stage B-A, Stage C-A and Stage D-A; (b) common unigenes (4751) were used for GO enrichment analysis and grouped by ReviGO. The darker the red color indicates a smaller FDR-corrected p-value. Blue arrows indicate relevant biological process of lipid metabolism and their direct connections.
Ijms 19 00118 g003
Figure 4. Heatmap plots of genes of fatty acid biosynthesis pathway C. oleifera. The number in parentheses means the number of unigenes encoding these enzymes, which had a total RPKM value over 20. Plastid FA synthesis in the upper part (a); ER FA modification, acyl editing and TAG assembly in the lower part (b). The red boxes are the enzymes related to FA synthesis; the yellow boxes are the enzymes related to FA modification and acyl editing; the purple boxes are the enzymes related to TAG assembly. acyl-CoA: diacylglycerol (DAG) (1) was de novo synthesized DAG, and DAG (2) was PC-derived DAG. Data for the relative expression levels of genes were obtained by using the log2 of RPKM values. Abbreviations: ACCase, acetyl-CoA carboxylase; ACP, acyl carrier protein; DAG, diacylglycerol; DGAT, acyl-CoA:DAG acyltransferase; FabD, malonyl CoA:ACP transacylase; FabF, β-ketoacyl-ACP synthase; FabG, β-ketoacyl-ACP reductase; FabH, acetyl CoA:ACP transacylase; FabI and FabK, enoyl-ACP reductase; FabZ, β-hydroxyacyl ACP dehydrase; FAD2, fatty acid desaturase 2 (Δ-12 desaturase); FAD3, FAD7 and FAD8, Δ-15 desaturase; FAD6, fatty acid desaturase 6 (Δ-12 desaturase); FatA and FatB, acyl-ACP thioesterase; FFA, free fatty acid; G3P, glycerol-3-phosphate; GPAT, acyl-CoA:G3P acyltransferase; LACS, long chain acyl-CoA synthetase; LPA, lyso-phosphatidic acid; LPAAT, acyl-CoA:LPA acyltransferase; LPCAT, acyl-CoA:lysophosphatidylcholine acyltransferase; PA, phosphatidic acid; PAP, PA phosphatase; PC, phosphatidylcholine; PDAT, phospholipid:diacylglycerol acyltransferase; PDCT, PC:DAG cholinephosphotransferase; PLC, phospholipase C; PLD, phospholipase D. PUFA, polyunsaturated fatty acid; SAD, stearoyl-ACP desaturase (Δ-9 desaturase); TAG, triacylglycerol; ER, endoplasmic reticulum.
Ijms 19 00118 g004aIjms 19 00118 g004b
Figure 5. Temporal changes in transcriptional levels for 16 candidate genes in C. oleifera seeds. Relative expression levels of qRT-PCR calculated using CESA as the reference gene are shown in the right y-axis. RNA-Seq expression of the transcript (RPKM) is shown in the left y-axis.
Ijms 19 00118 g005
Table 1. Functional annotation of the C. oleifera transcriptome.
Annotated DatabasesNumber of UnigenesPercentage (%)≥300 bp≥1000 bp
Nr Annotation51,57464.2240,90813,684
Swiss-Prot Annotation33,50341.7228,21511,410
COG Annotation15,44219.2313,8836721
KEGG Annotation10,49313.0785513564
GO Annotation72619.0455452393
Total51,72564.4140,98213,689

