Article

The Potential Roles of the Apoptosis-Related Protein PDRG1 in Diapause Embryo Restarting of Artemia sinica

1
College of Life Sciences, Liaoning Normal University, Dalian 116081, China
2
Department of Biochemistry and Molecular Biology, Dalian Medical University, Dalian 116044, China
*
Authors to whom correspondence should be addressed.
These authors contributed equally to this work.
Int. J. Mol. Sci. 2018, 19(1), 126; https://doi.org/10.3390/ijms19010126
Submission received: 3 December 2017 / Revised: 27 December 2017 / Accepted: 30 December 2017 / Published: 2 January 2018
(This article belongs to the Section Biochemistry)

Abstract

:
High salinity and low temperatures can induce Artemia sinica to enter the diapause stage during embryonic development. Diapause embryos stop at the gastrula stage, allowing them to resist apoptosis and regulate cell cycle activity to guarantee normal development after diapause termination. P53 and DNA damage-regulated gene 1 (pdrg1) is involved in cellular physiological activities, such as apoptosis, DNA damage repair, cell cycle regulation, and promotion of programmed cell death. However, the role of pdrg1 in diapause and diapause termination in A. sinica remains unknown. Here, the full-length A. sinica pdrg1 cDNA (As-pdrg1) was obtained and found to contain 1119 nucleotides, including a 228 bp open reading frame (ORF), a 233 bp 5′-untranslated region (UTR), and a 658-bp 3′-UTR, which encodes a 75 amino acid protein. In situ hybridization showed no tissue specific expression of As-pdrg1. Quantitative real-time PCR and western blotting analyses of As-pdrg1 gene and protein expression showed high levels at 15–20 h of embryo development and a subsequent downward trend. Low temperatures upregulated As-pdrg1 expression. RNA interference for the pdrg1 gene in Artemia embryos caused significant developmental hysteresis. Thus, PDRG1 plays an important role in diapause termination and cell cycle regulation in early embryonic development of A. sinica.

1. Introduction

Artemia sinica is a small aquatic crustacean living in an environment with a wide variation in temperature and high salt concentration [1,2]. Artemia is widely used as the initial feed for the larvae of marine fishes, prawns, and crabs in the aquaculture industry because its nauplii contain abundant proteins and unsaturated fatty acids [3,4]. During embryonic development of A. sinica, high salinity, low temperature, light cycle changes, and lack of food can induce A. sinica to enter the embryo diapause stage. When the environmental conditions are favorable, it can terminate diapause and restart development from the dormant eggs [5,6]. In process of embryo diapause, dormant cysts of A. sinica show strong resistance to long-term drought, cold, hypoxia, and other severe environmental factors. In recent years, there has been wide interest in understanding the causes and molecular mechanisms of diapause and diapause termination of A. sinica embryo development. Thus, A. sinica has been studied as a good model organism in genetics, development, evolution, and other fields of life science [7,8,9]. Our previous studies suggested that Myeloid differentiation factor 88 (As-MYD88) and Late embryogenesis abundant proteins(As-LEA) proteins might play vital roles in post-diapause embryonic development and stress tolerance in A. sinica [10,11].
P53 and DNA damage control gene 1 (PDRG1) protein were identified as a subunit of the R2TP/prefoldin-like complex, which is involved in the assembly of the RNA polymerase II complex (Pol II) in the cytoplasm of eukaryotic cells [12,13,14]. Previous studies showed that it is involved a variety of cellular physiological activities, such as apoptosis, DNA damage repair, cell cycle regulation and promoting programmed cell death after growth factor starvation [15,16]. Research has shown that the pdrg1 gene is associated with gastrointestinal degeneration and plays a role in the process of animal organ degradation [15]. That pdrg1 gene is highly expressed in multiple human malignancies suggests that PDRG1, as a high-value novel tumor marker, plays a role in cancer development [17]. The nuclear factor kappa B (NF-κB) pathway is important in immunity, inflammation, development, cell growth, and apoptosis. Some studies have shown that PDRG1 is involved in regulation of the NF-κB pathway [18]. In addition, the stress regulation of PDRG1 was further studied and found to be induced by genotoxic stress (DNA damage), and its knock down in human colon cancer cells resulted in a significant reduction in tumor cell growth [19].
However, the details of the molecular characteristics and functions of PDRG1 proteins remain unknown in A. sinica, especially in diapause embryo termination and early embryo development. In the present study, we cloned the full-length copy DNA (cDNA) of As-pdrg1 and analyzed its expression level in different development periods, temperatures, and salinity stress of A. sinica using quantitative real-time PCR (qPCR). In addition, we examined the regulatory relationship among PDRG1, MDM2, P53, and P21 using Western blotting. A small interfering RNA (siRNA) targeting As-pdrg1 was used to study the function of As-pdrg1 in embryo diapause termination and early embryonic development. Our aim was to further understand the function and molecular regulation mechanism of PDRG1 with other proteins in the regulation of the cell cycle and apoptosis during postdiapause restarting stages and early embryonic development in A. sinica.

2. Results

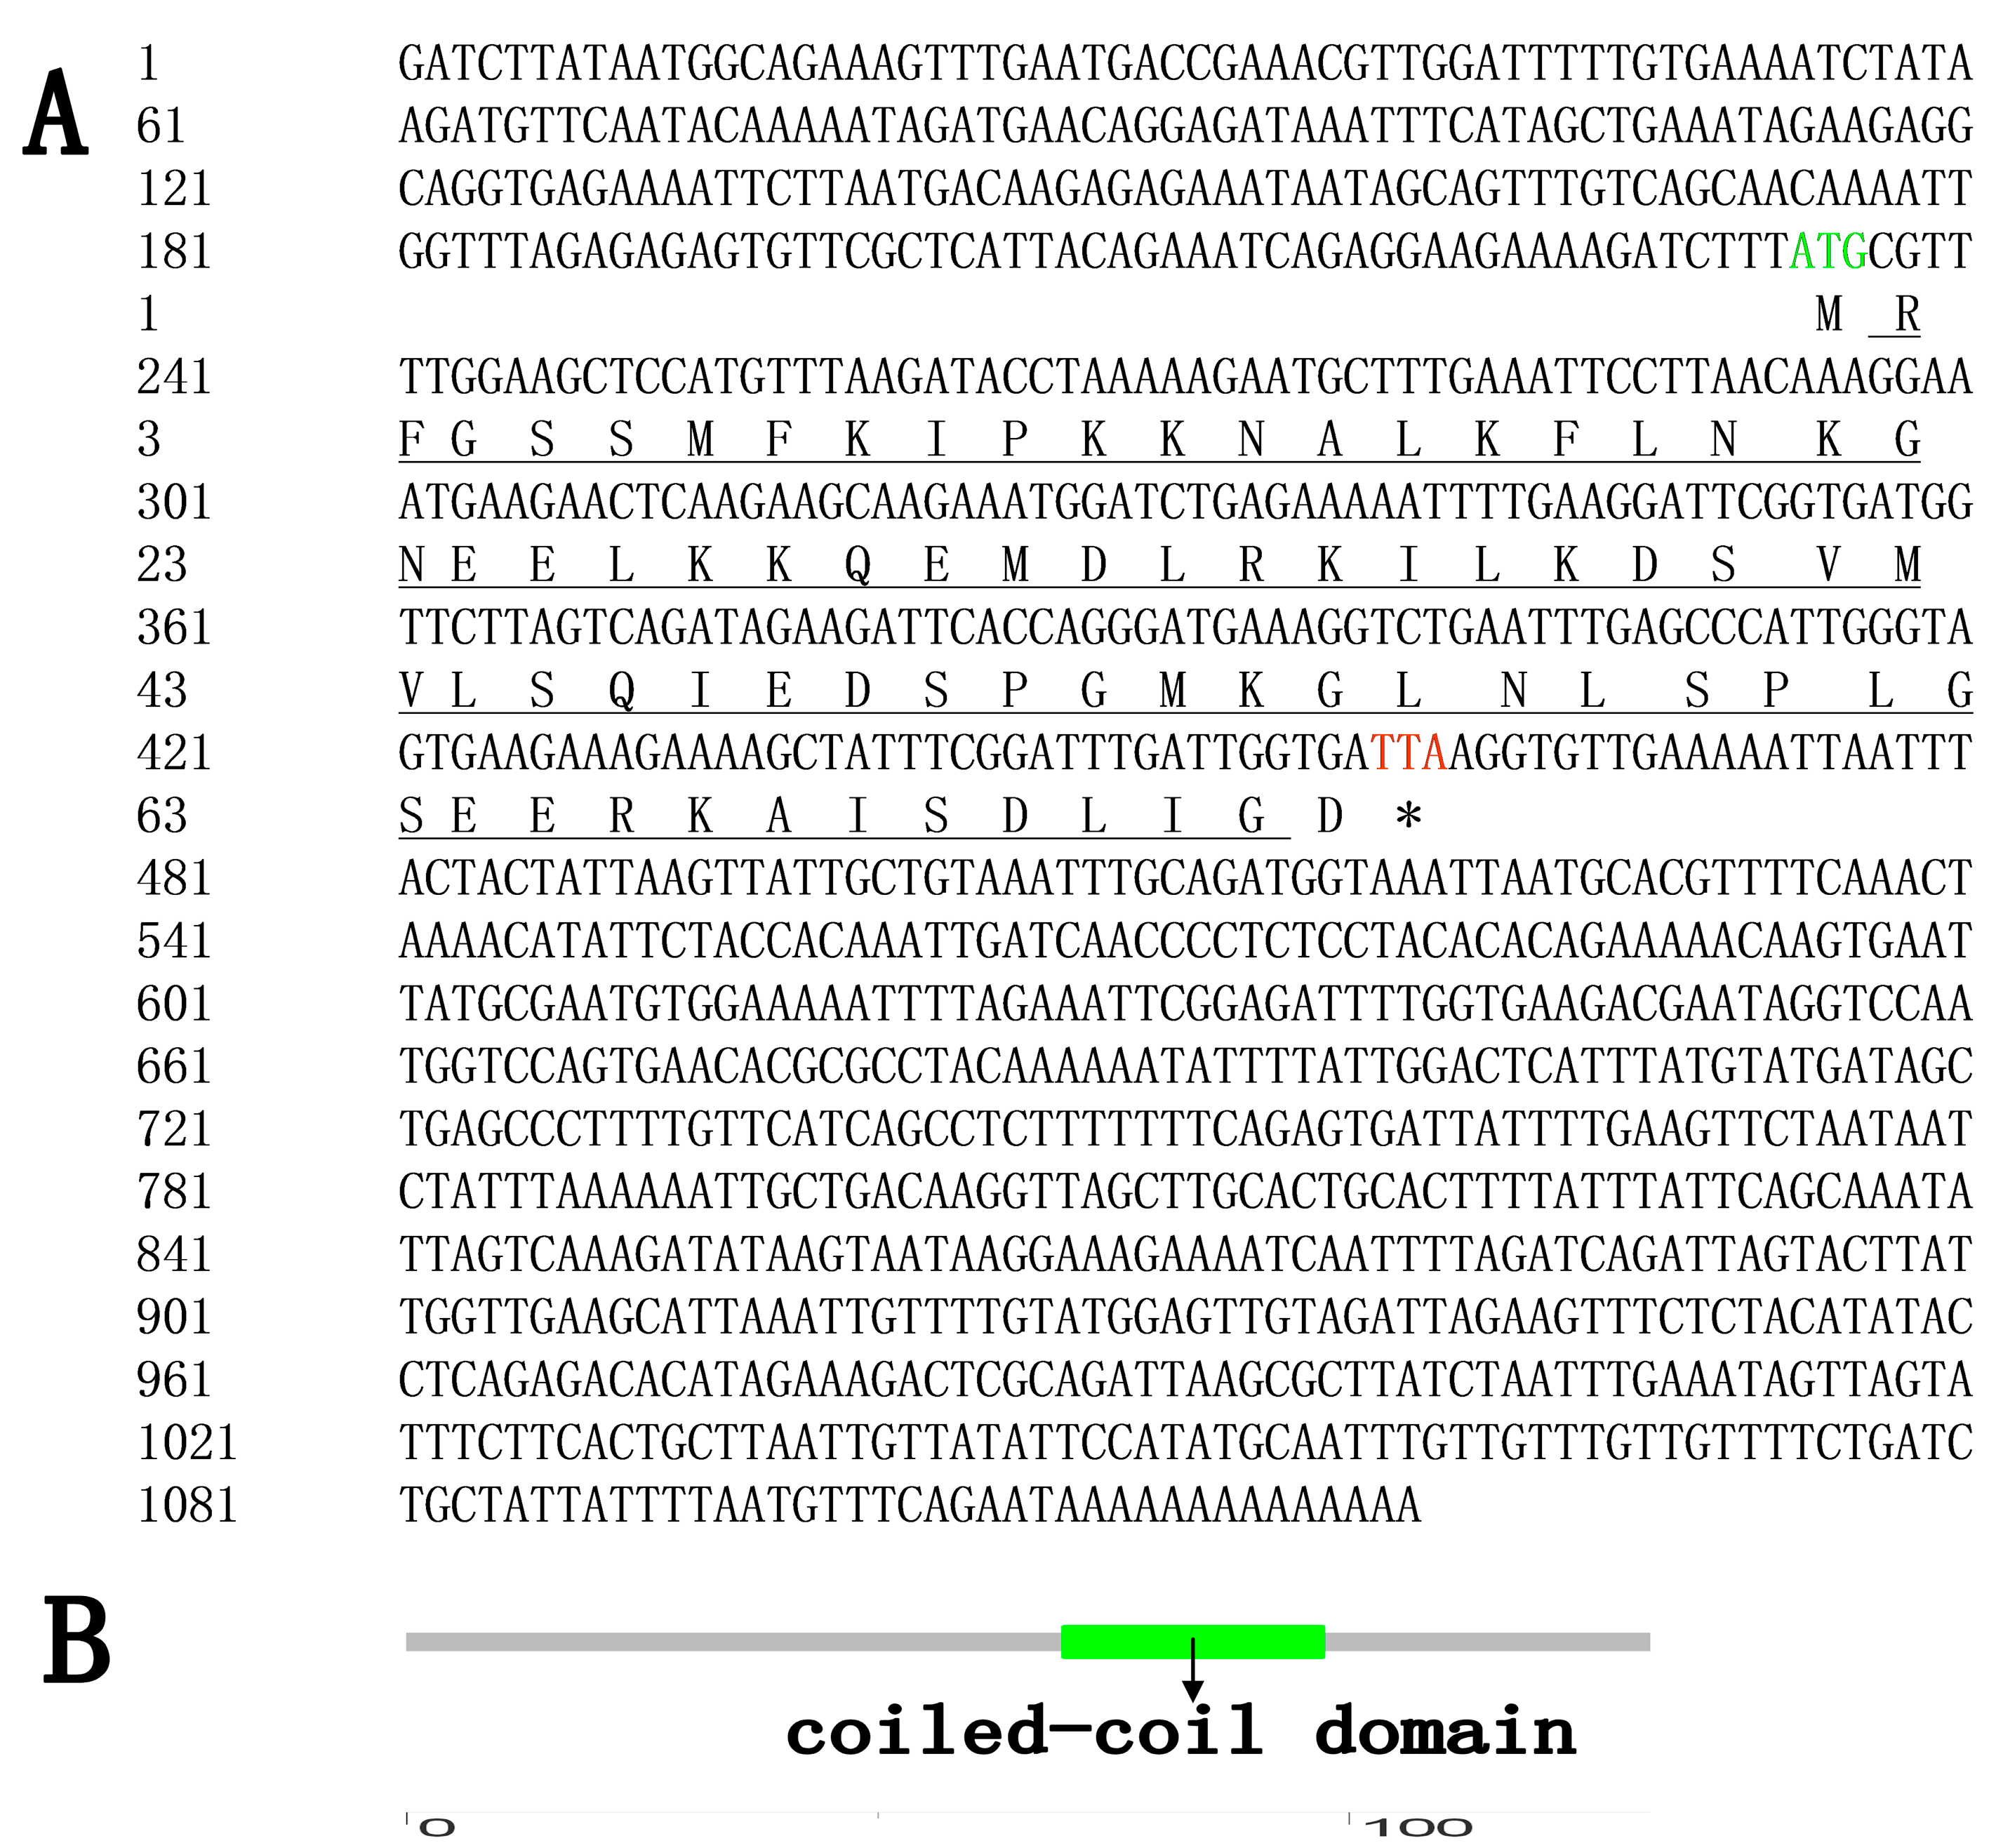
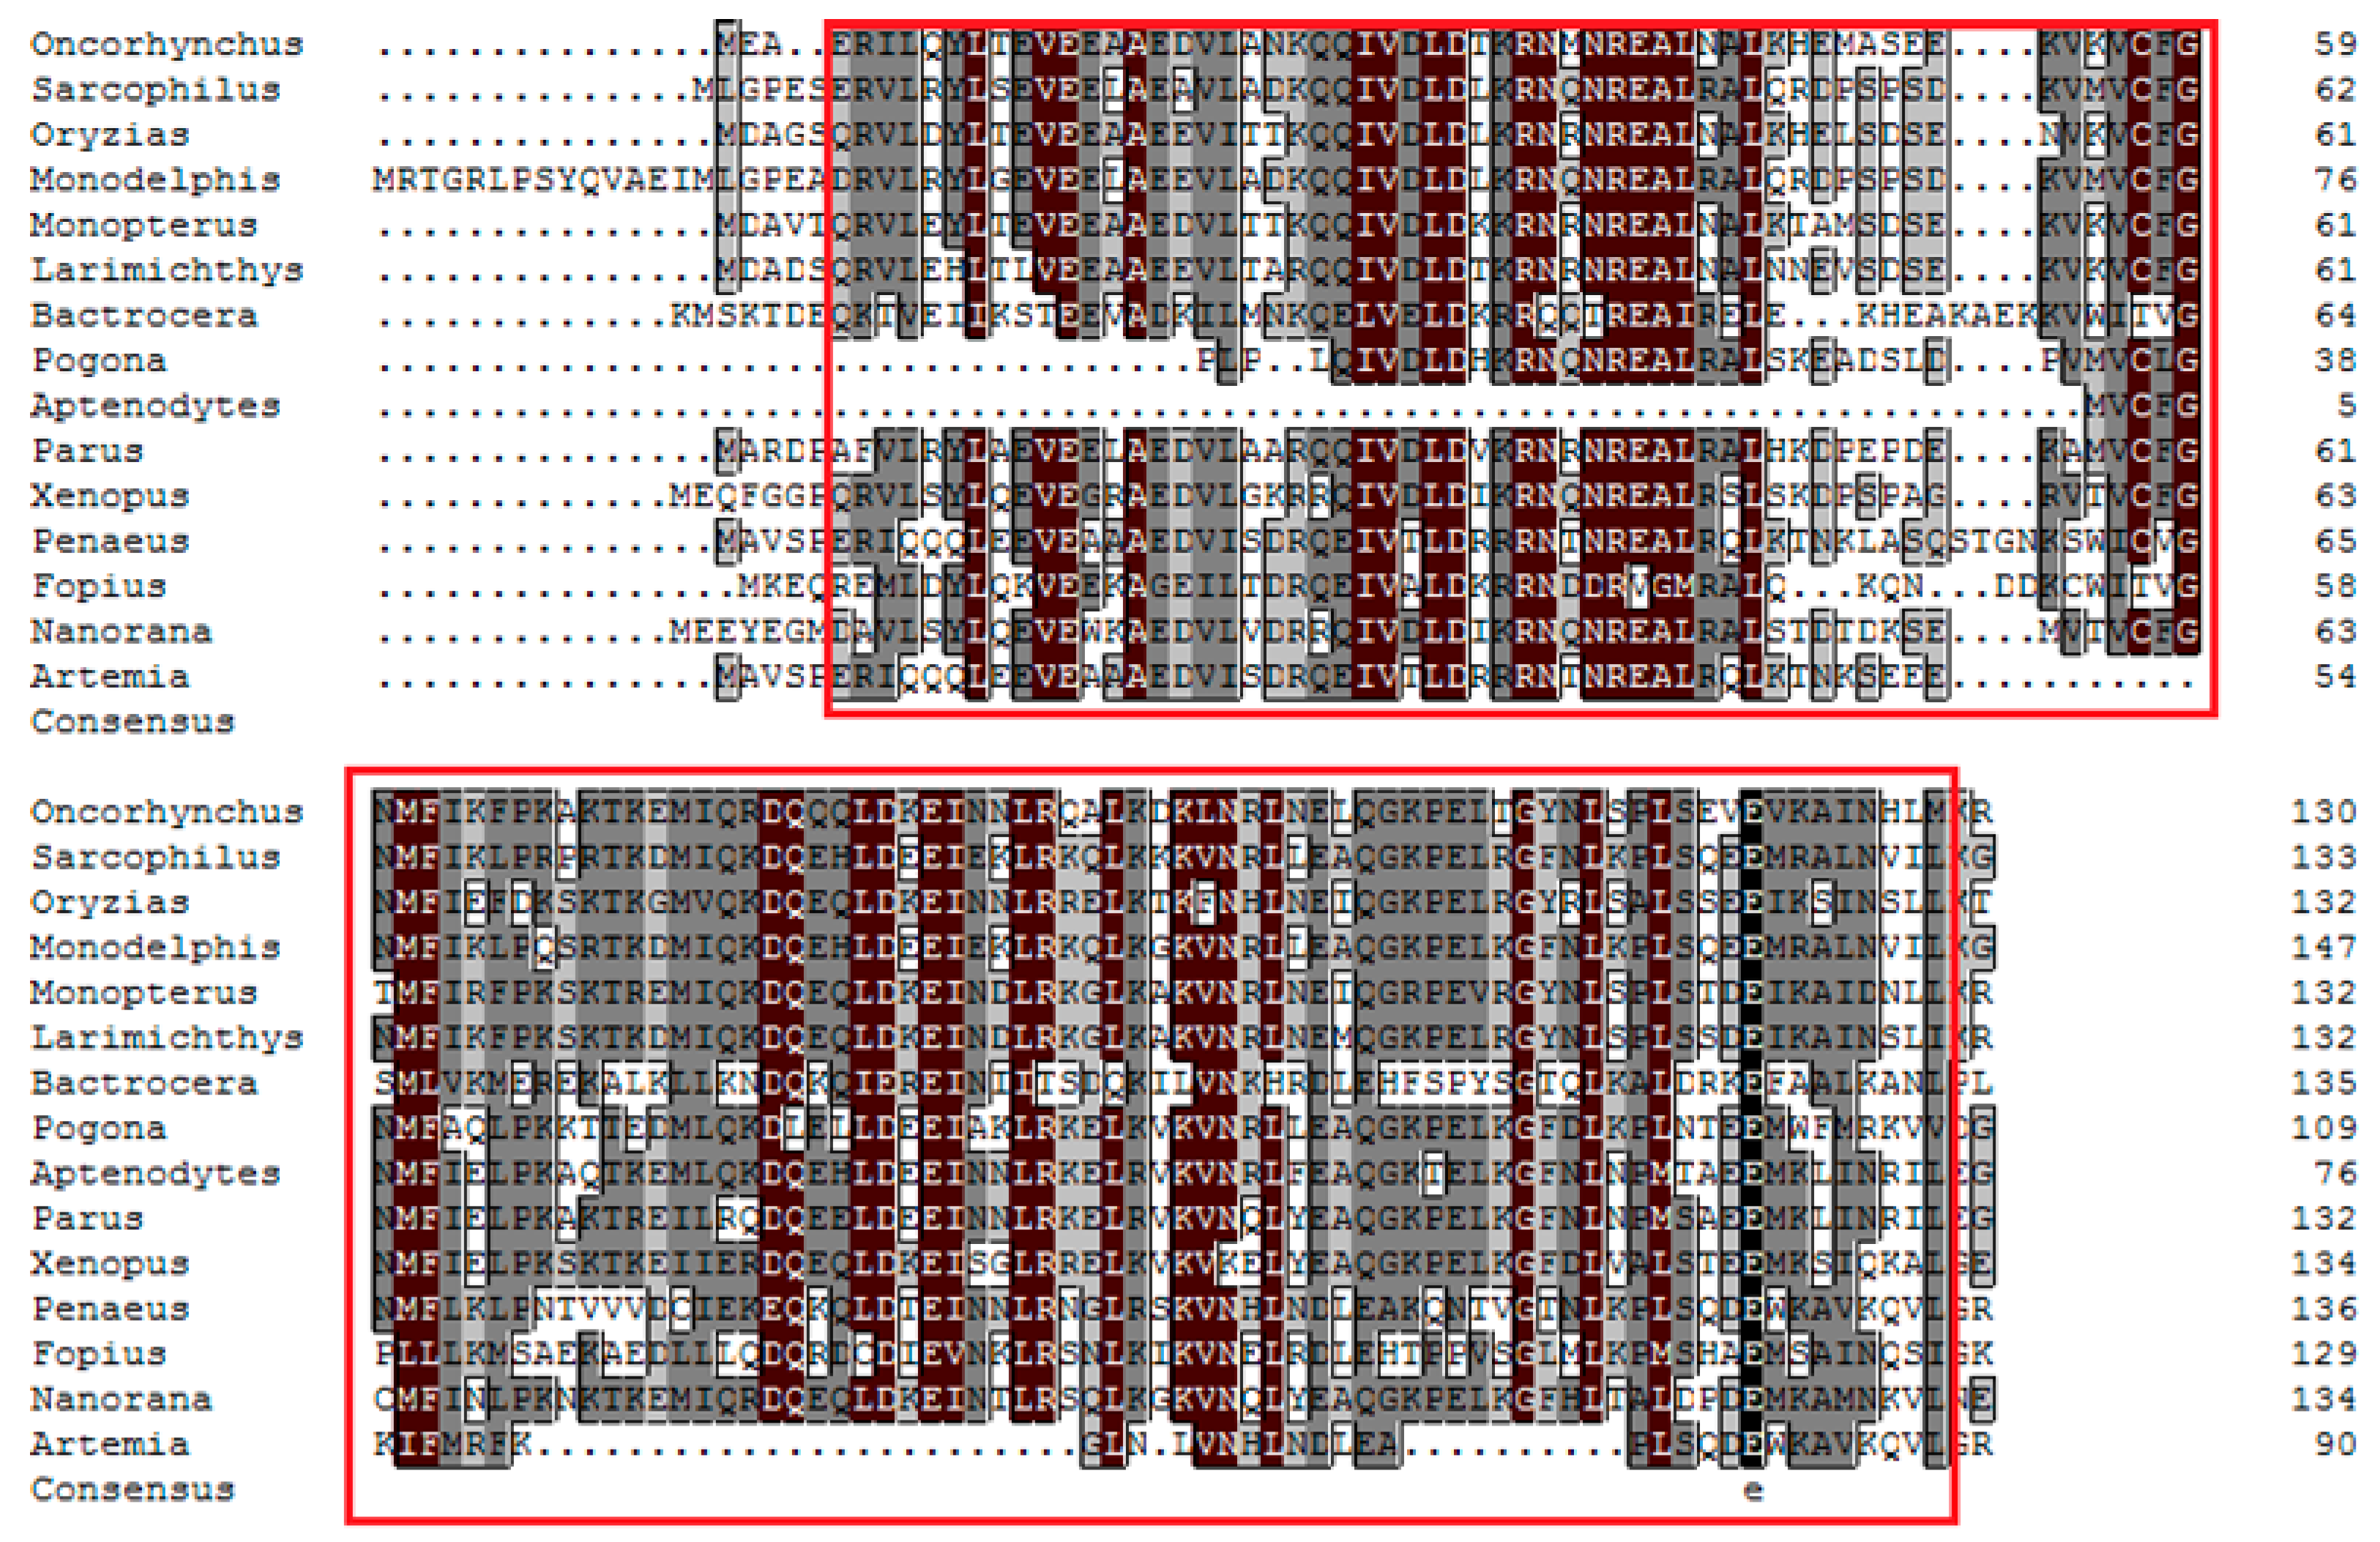
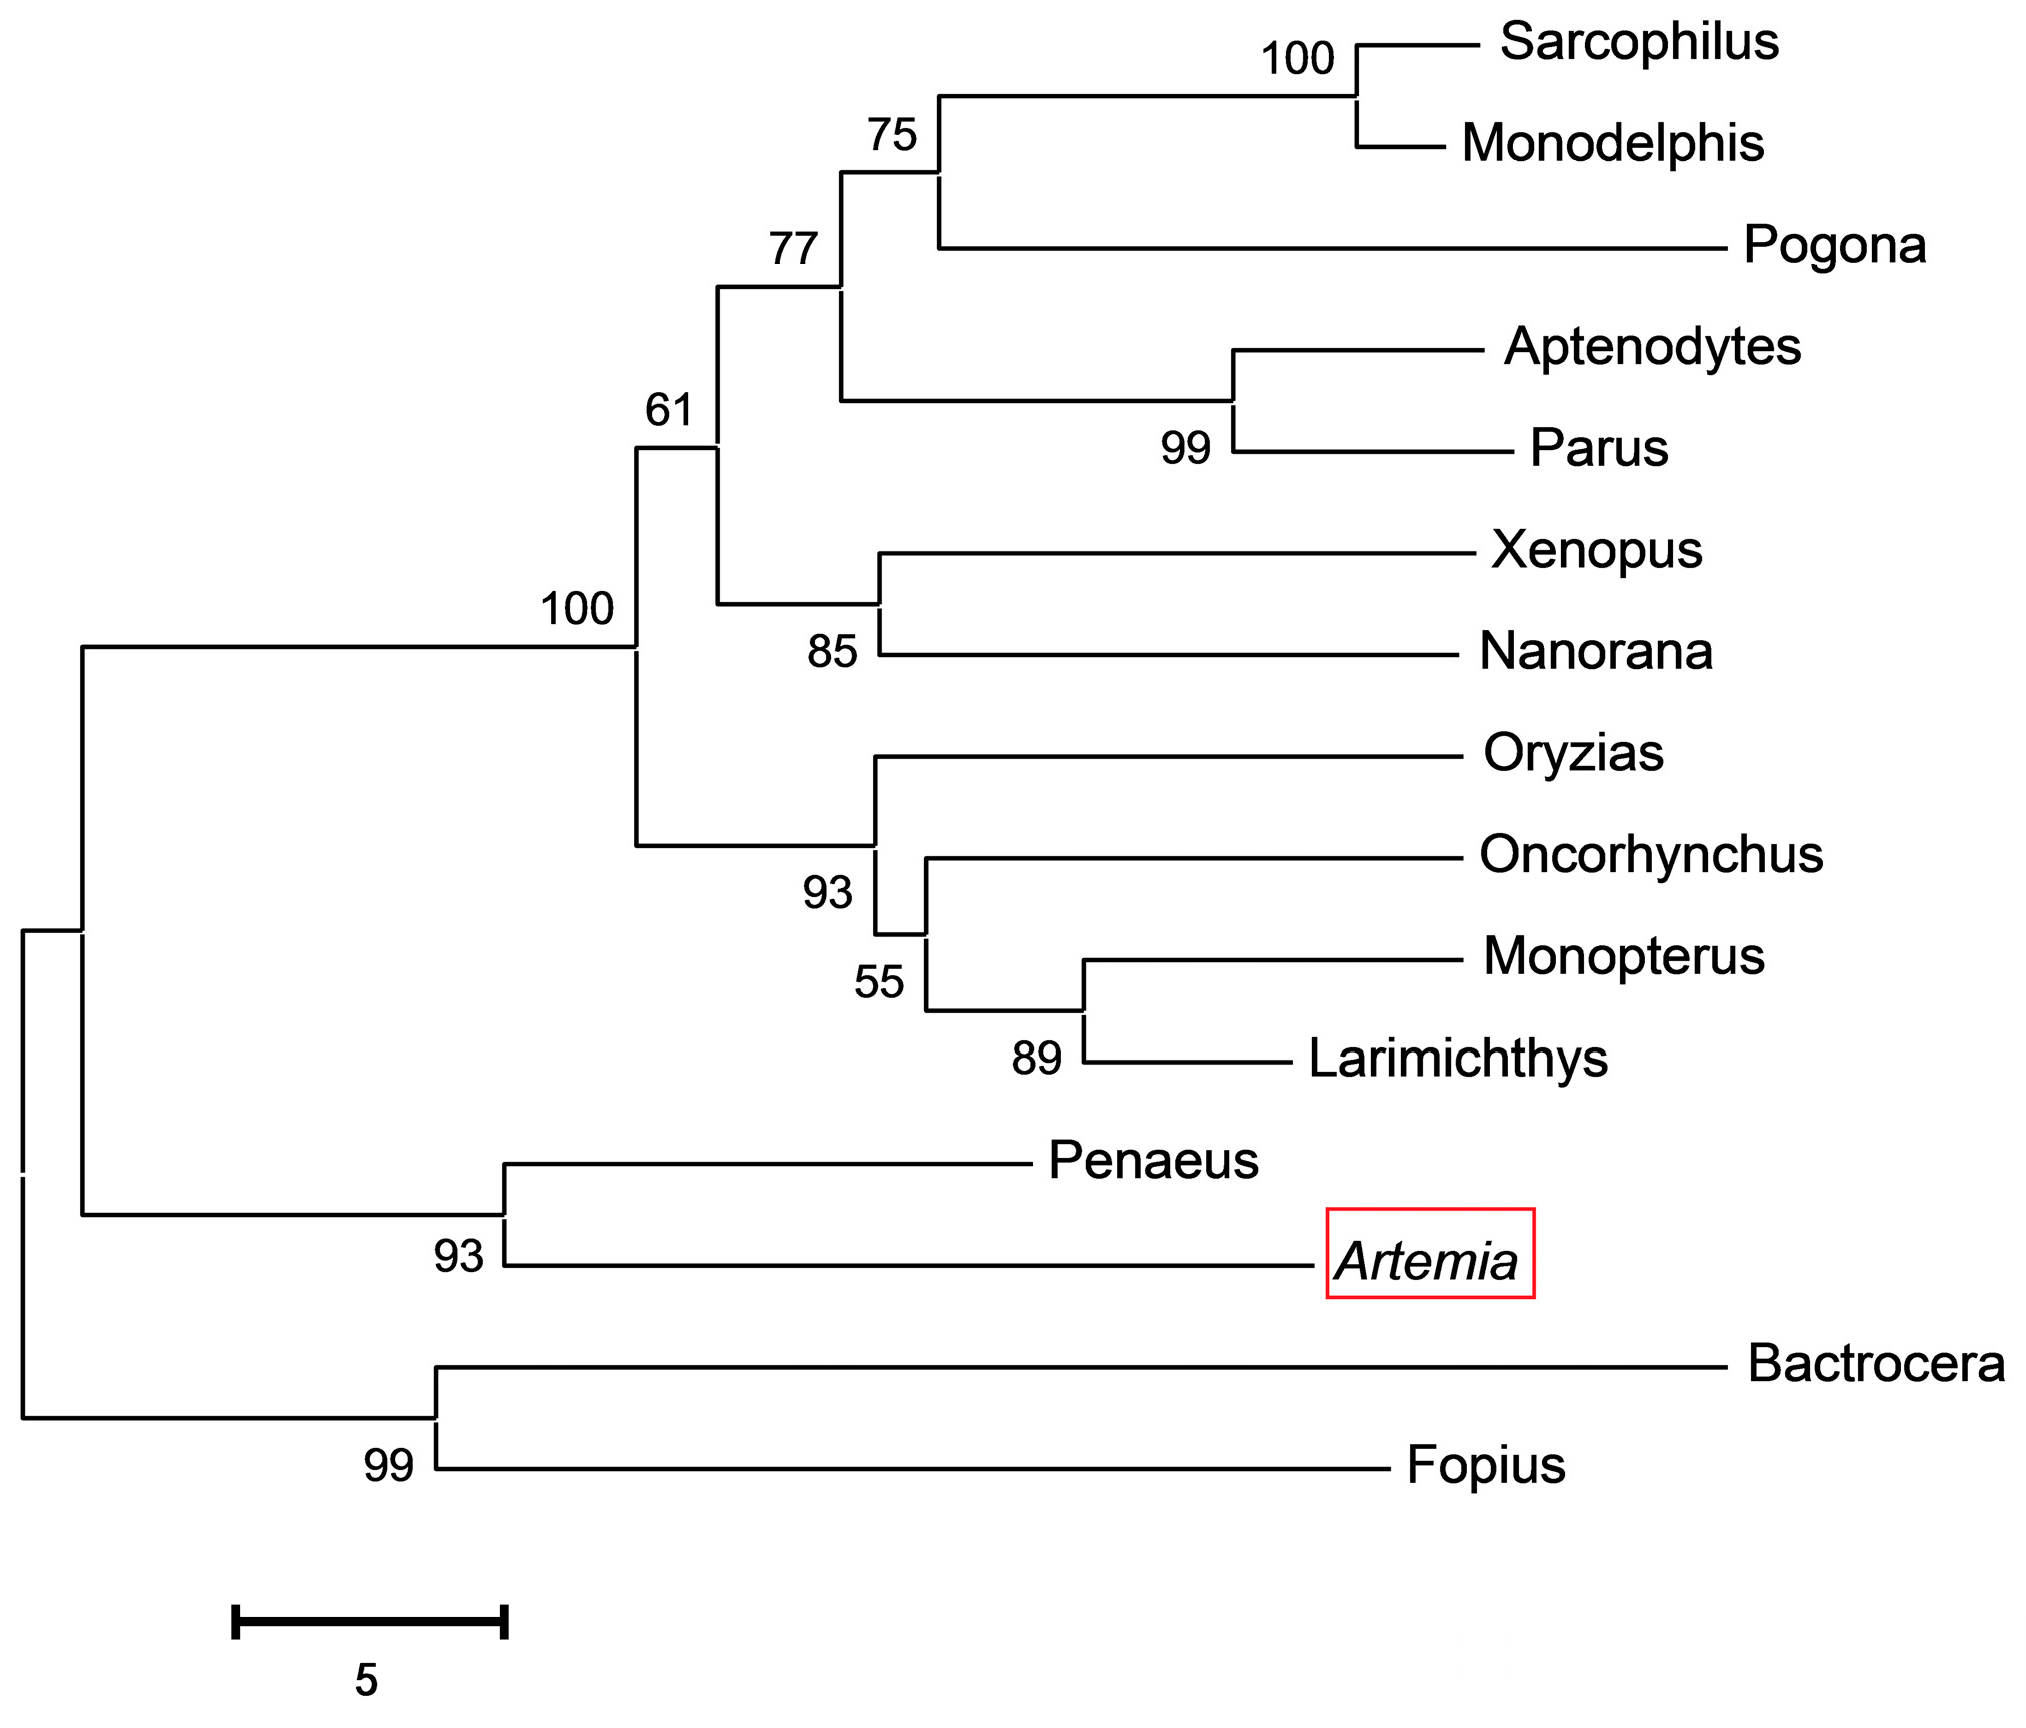
2.1. Cloning and Bioinformatic Analysis of As-pdrg1

A 1119 bp full-length cDNA of As-pdrg1 was obtained (GenBank accession number: MF614121) with an open reading frame (ORF) of 228 bp, and 233 bp 5′-untranslated regions and 658 bp 3′-untranslated regions (Figure 1A). SMART analysis of putative of protein domains showed that the predicted protein contained a coiled-coil domain (Figure 1B). As determined by the Ex-PASy software, the putative PDRG1 protein comprised 75 amino acids, and had a calculated molecular mass of 8.4 kDa, with a pI of 9.35. TMHMM Server 2.0 showed that As-PDRG1 has no transmembrane region. According to Protscale analysis As-PDRG1 is mostly hydrophilic. No signal peptide was identified, which indicated that As-PDRG1 is a non-secreted protein. The online software PSORTII predicted that As-PDRG1 might be located in the nucleus, mitochondria, and cytoplasm. NetPhos 2.0 Server analysis indicated that there are eight possible serine phosphorylation sites (score > 0.5) (Table 1).
Alignment of As-PDRG1 and known PDRG1 sequences from 15 other species revealed the homology of As-PDRG1 with other PDRG1 protein sequences. As-pdrg1 shares 75% similarity with PDRG1 of Penaeus monodon (Figure 2). To evaluate the evolutionary relationships among PDRG1 homologs, a phylogenetic tree composed of 15 species and A. sinica with 1000 bootstrap replications was constructed using Clustal X2.0 and MEGA 6.0. Analysis of the phylogenetic tree (Figure 3) showed that there are three main clusters. The first cluster contains higher vertebrates (Monodelphis domestica), amphibians (Xenopus tropicalis), birds (Aptenodytes forsteri), and fish (Oryzias latipes). The second cluster comprises arthropods (Penaeus monodon and Artemia) and the third cluster comprises insects (Fopius arisanus). The relationships displayed in the phylogenetic tree are consistent with A. sinica’s taxonomic classification.

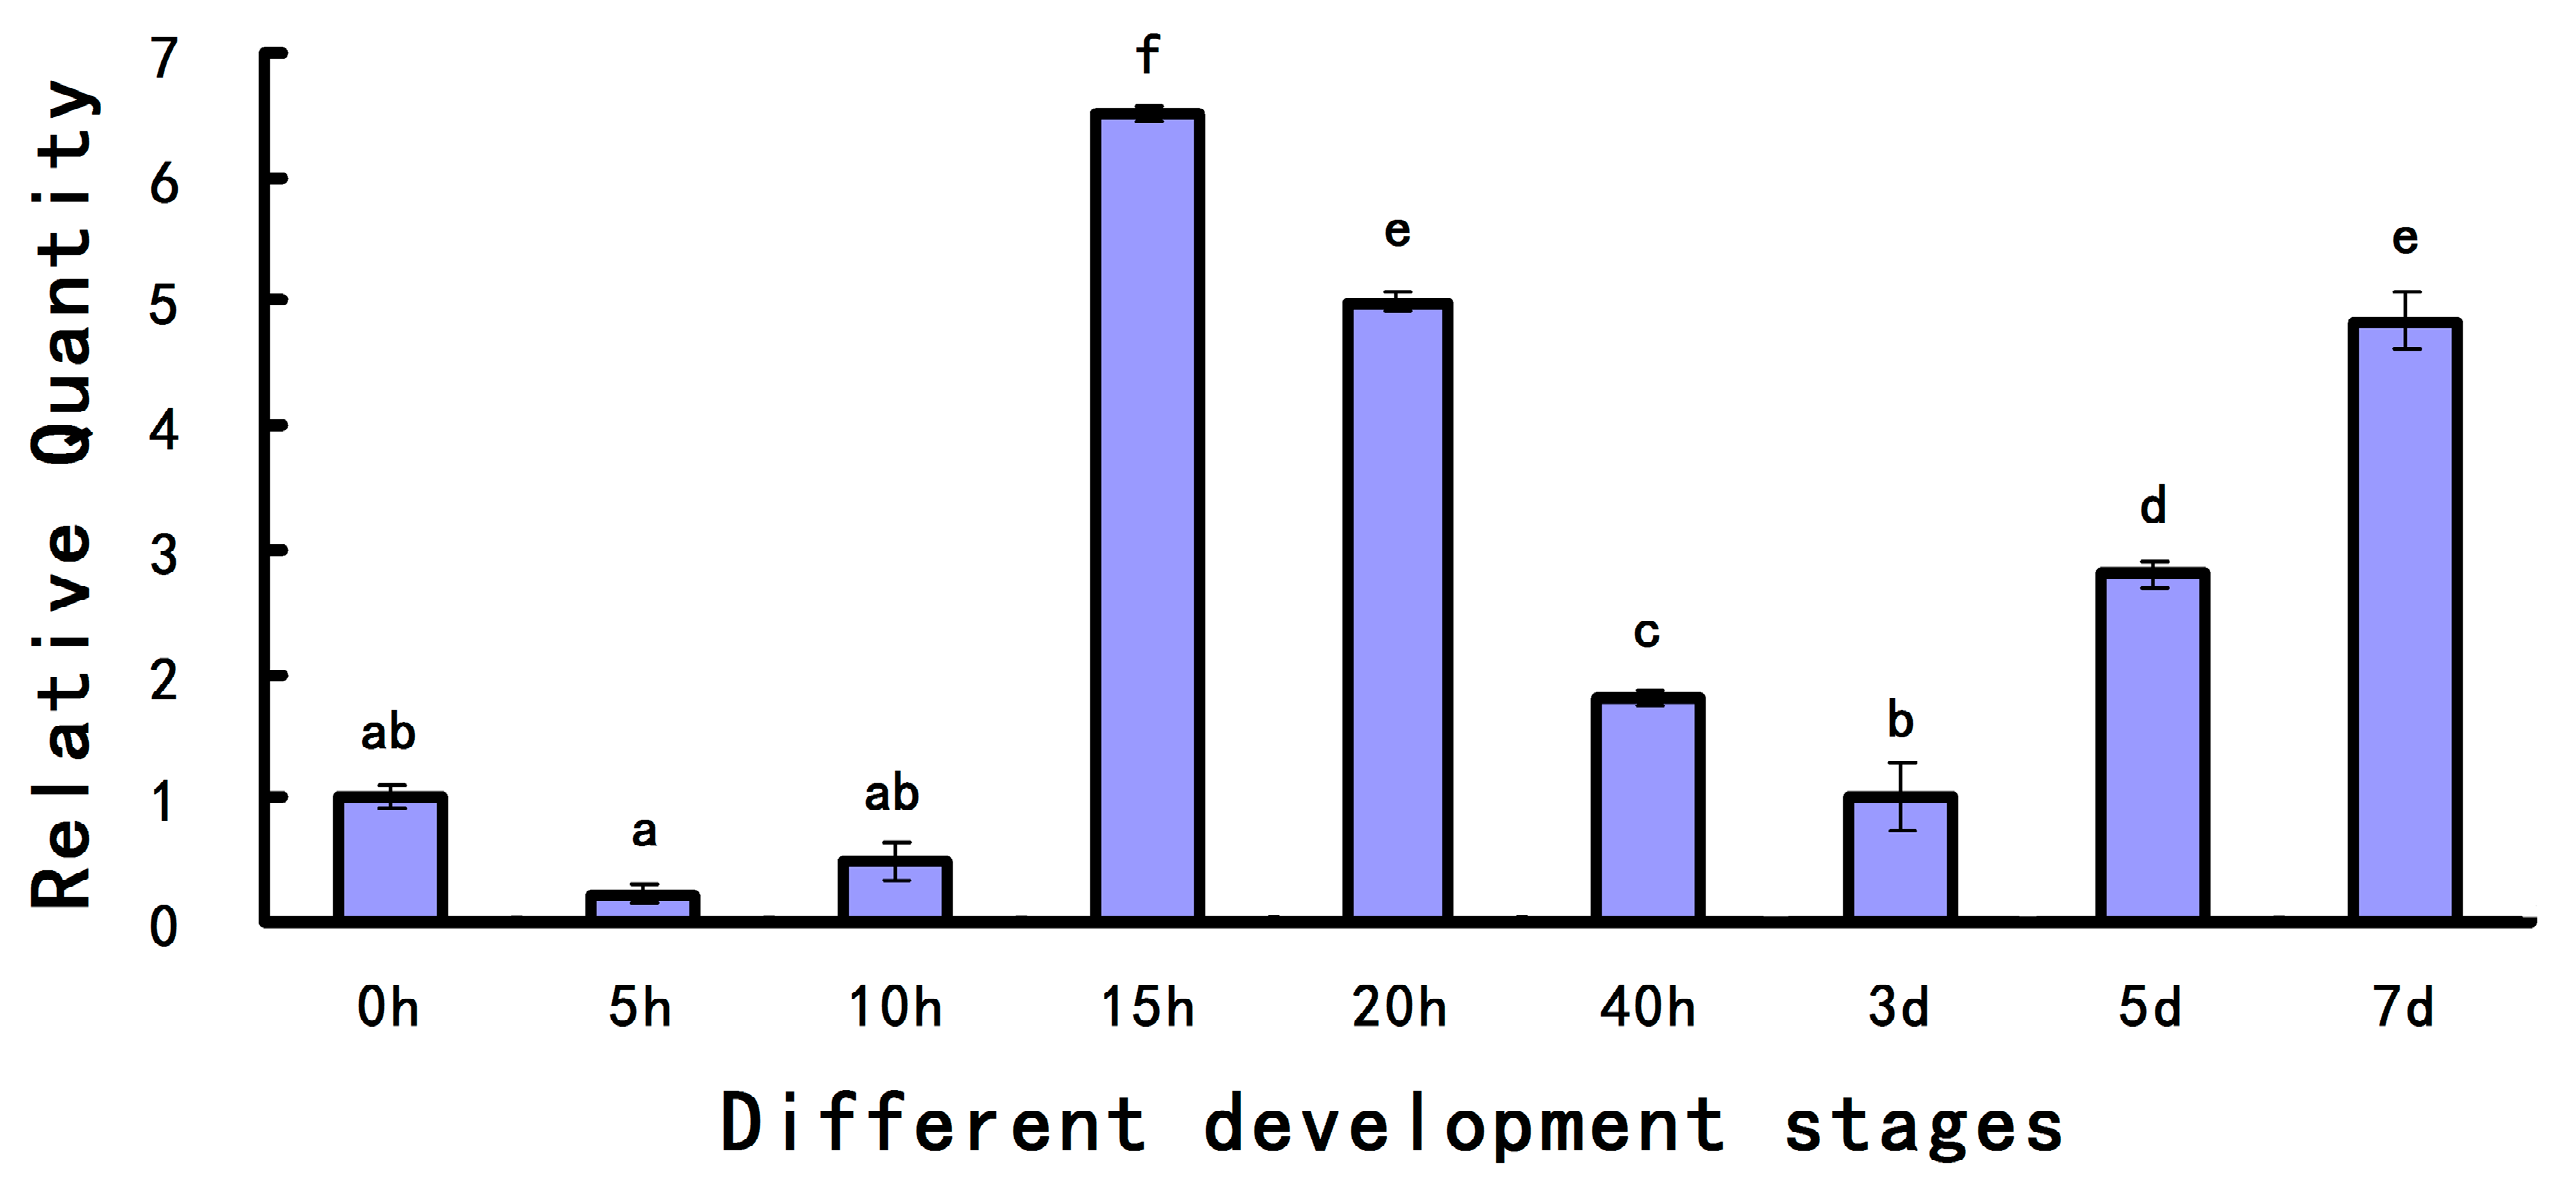
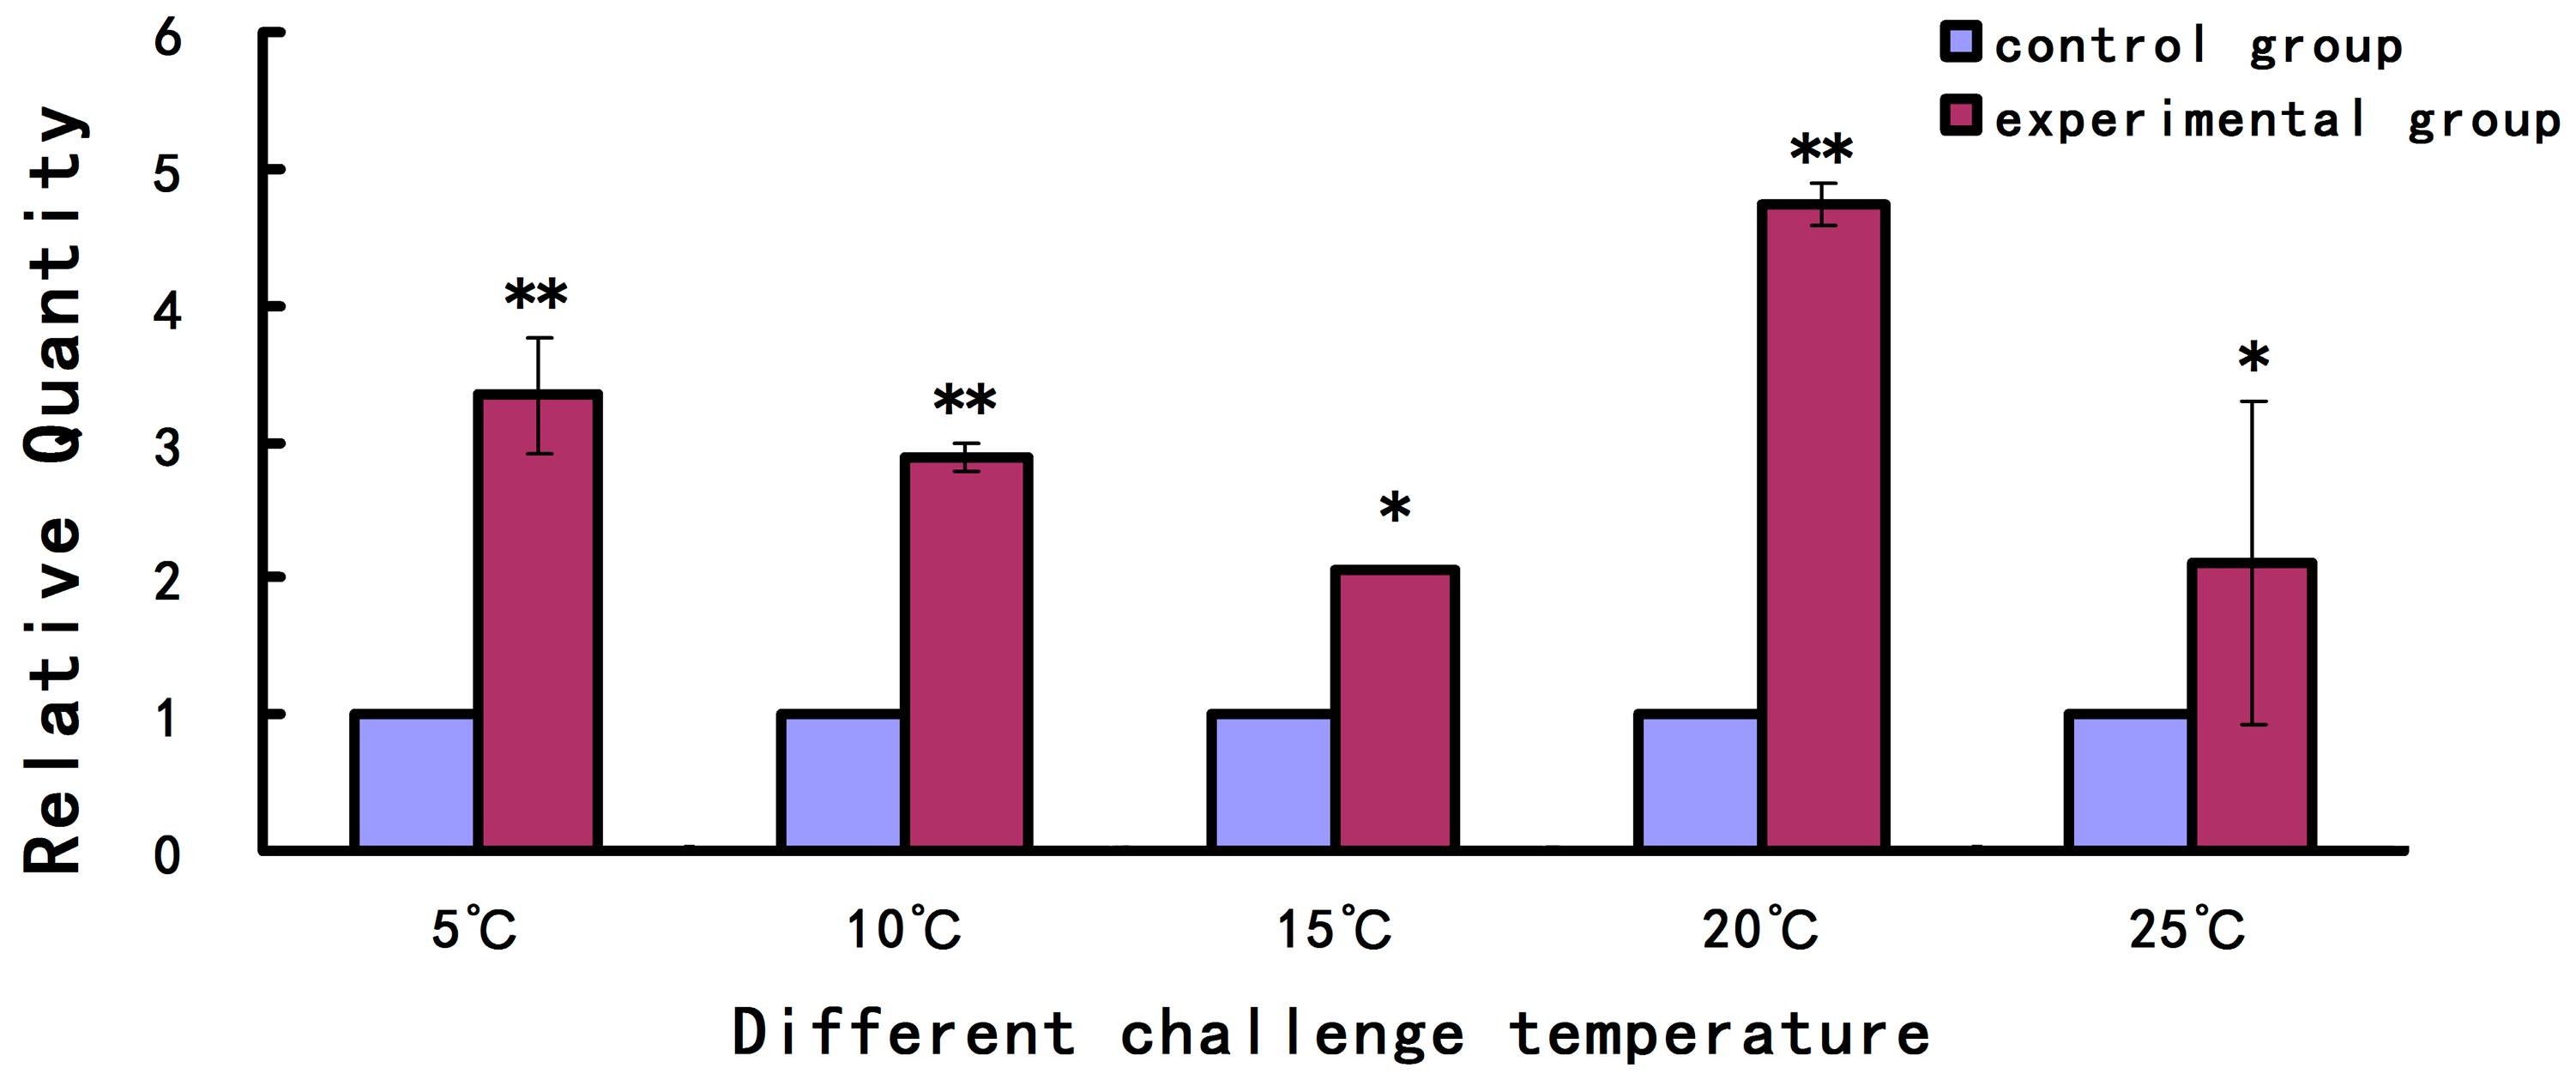
2.2. Expression Level of As-pdrg1 at Different Developmental Stages and under Different Stresses

Analysis with qPCR was performed to detect the expression levels of As-pdrg1 during different stages of embryo development. The data showed that a low level of As-pdrg1 messenger RNA (mRNA) from 0 to 10 h, which then increased to reach a peak at 15 h. The expression levels decreased from 15 h to 3 days, at which point the expression level of As-pdrg1 was about one third of the level at 15 h. After 3 days, the expression level started to increase; the expression levels at 7 days and 20 h were almost the same (Figure 4).
The expression level of As-pdrg1 under different salinity and temperature stress conditions were analyzed by qPCR. The results showed that the expression level of As-pdrg1 was higher at lower temperatures than that under the control temperature (30 °C), the expression level of As-pdrg1 reached a peak at 20 °C, being about four times that of the control group (Figure 5).

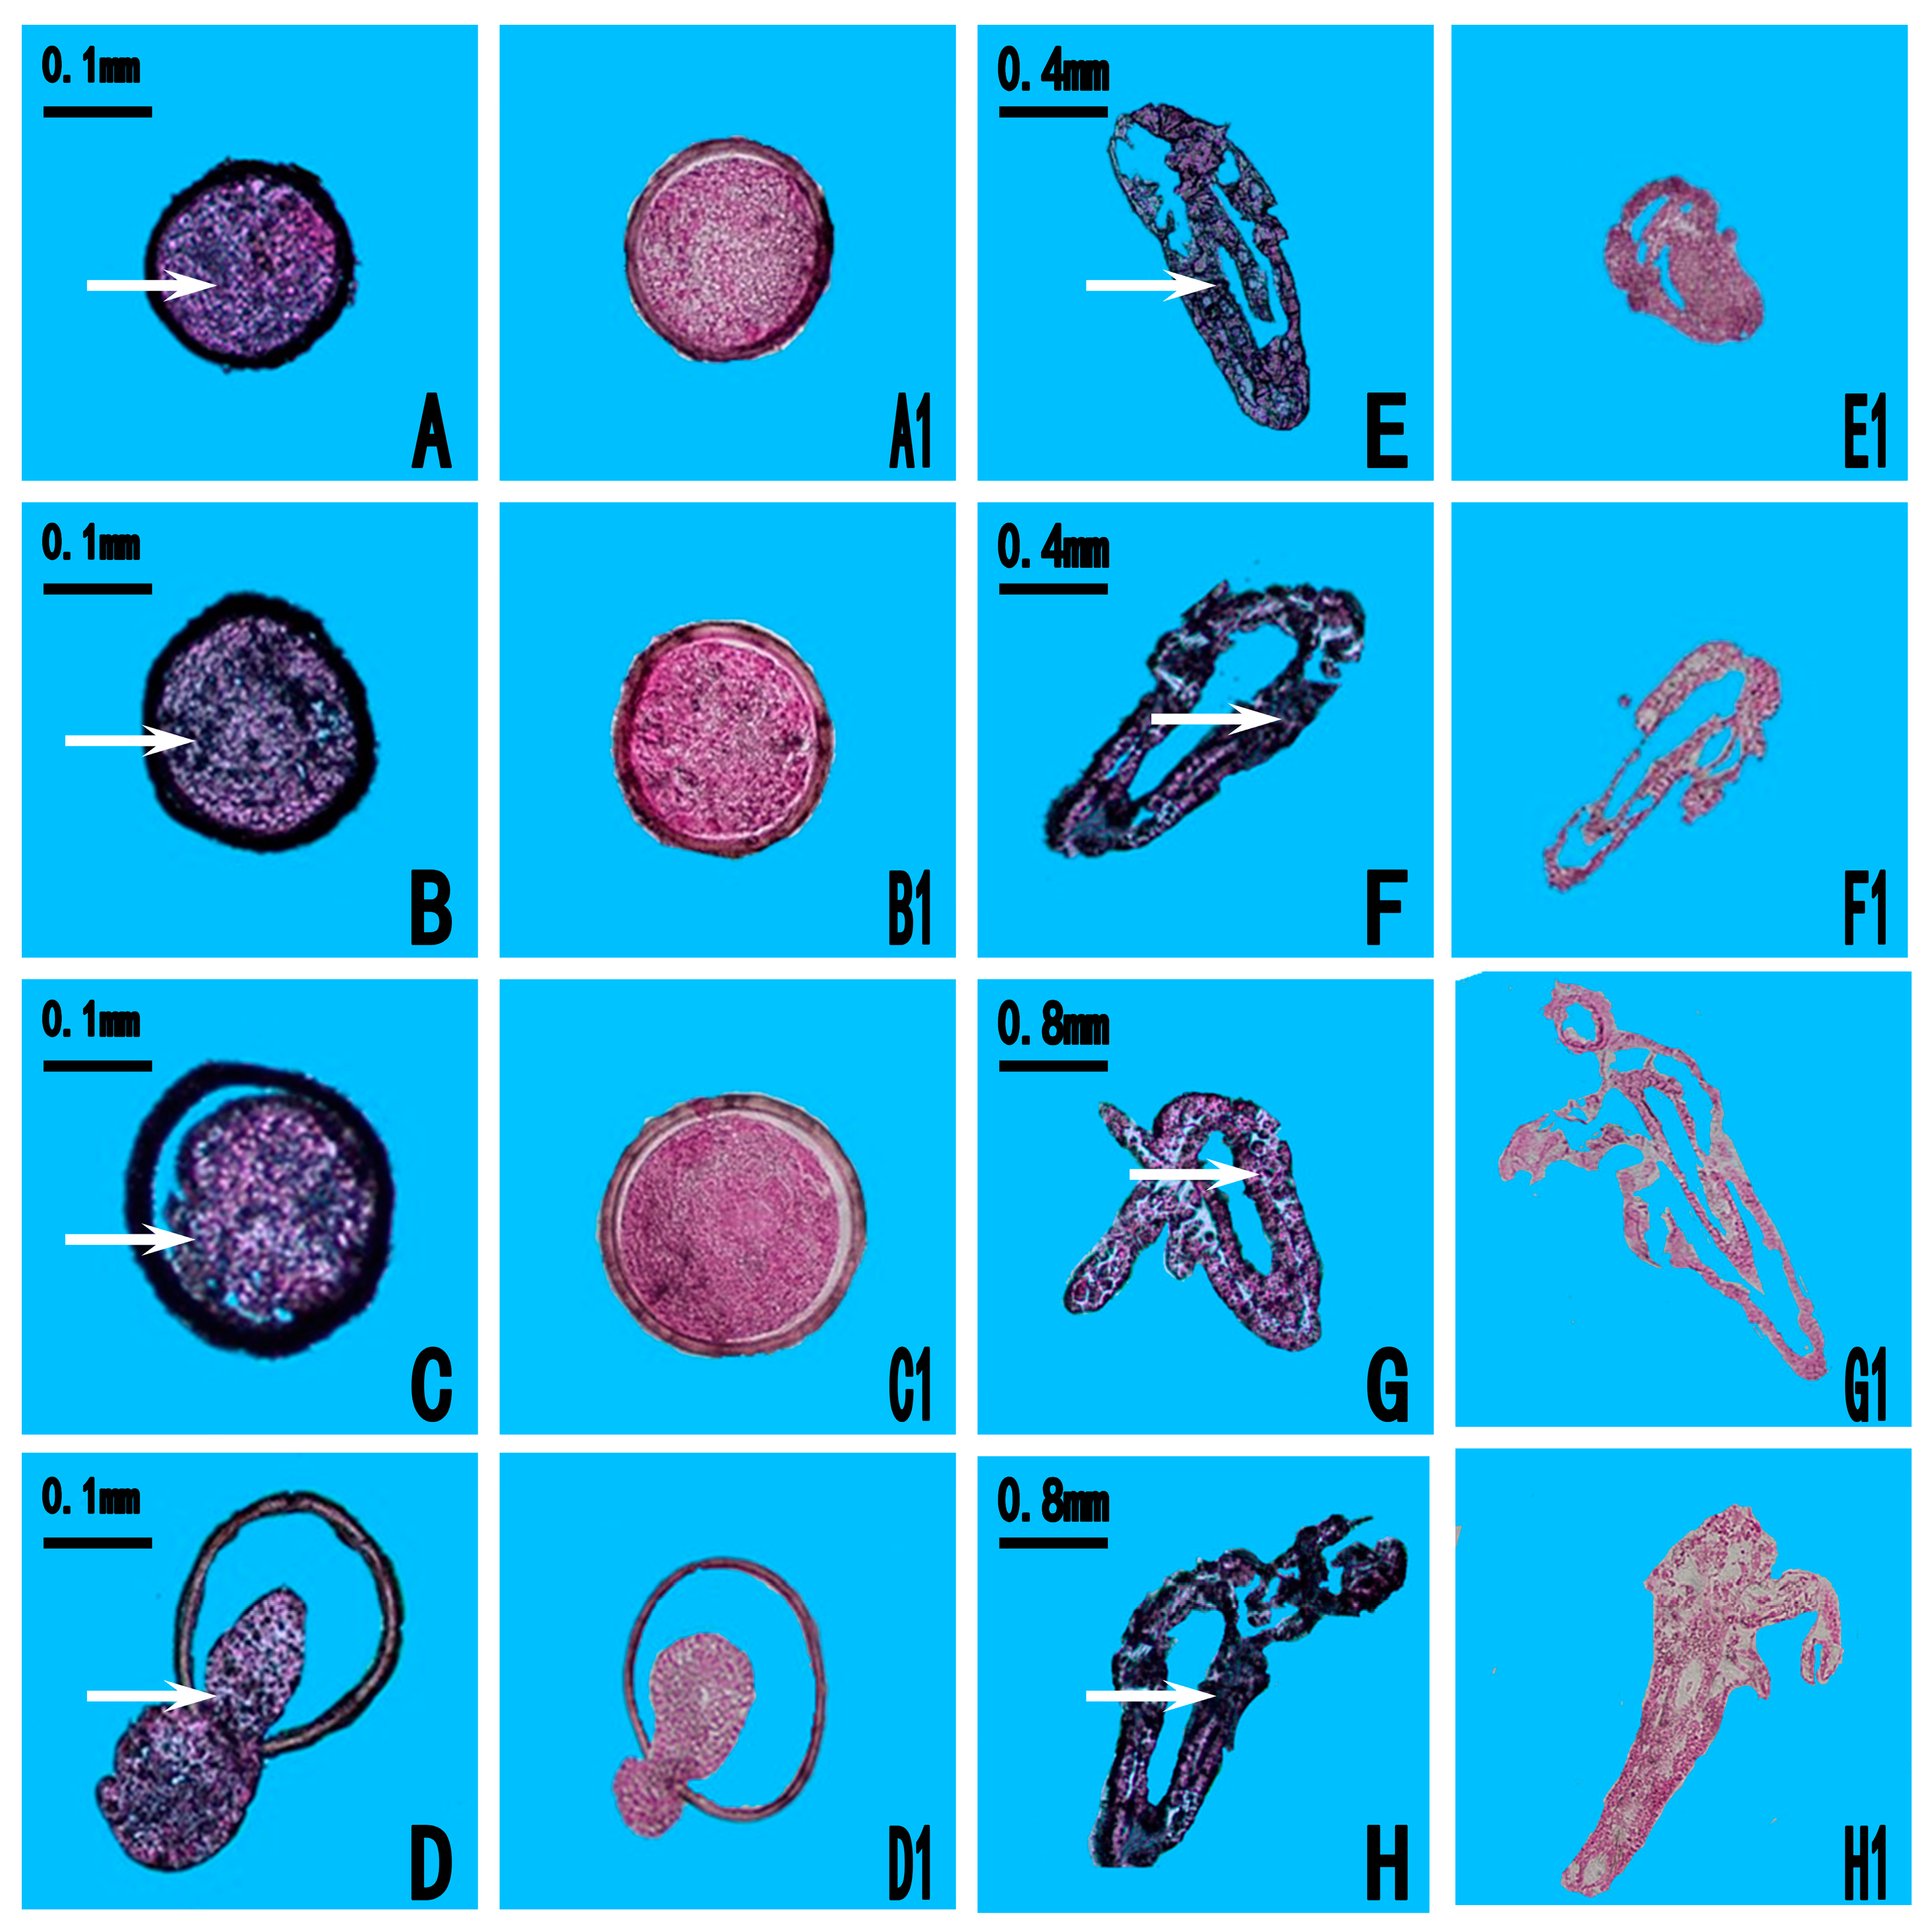
2.3. Expression Location of As-pdrg1

In situ hybridization was performed to determine the spatial expression pattern of As-pdrg1 at different embryo developmental stages of A. sinica (Figure 6). Compared with the control group, As-pdrg1 signals were observed throughout almost the whole embryo during the prenauplius stage (0 h, 5 h, and 10 h; Figure 6A–C). Expression gradually extended from head to the tail in the umbrella stage at 15 h (Figure 6D). At 20 h, As-pdrg1 mRNA was detected significantly in the whole larval body after the nauplius had hatched (Figure 6E). At 40 h As-pdrg1 mRNA was observed throughout almost the entire body (Figure 6F). At 3 days and 5 days, the body shape and external appendages begin to develop, and As-pdrg1 was detected in the region of the enteron and the external appendages of the polypide (Figure 6G,H). No signal was detected in the control group under the same conditions (Figure 6A1–H1).

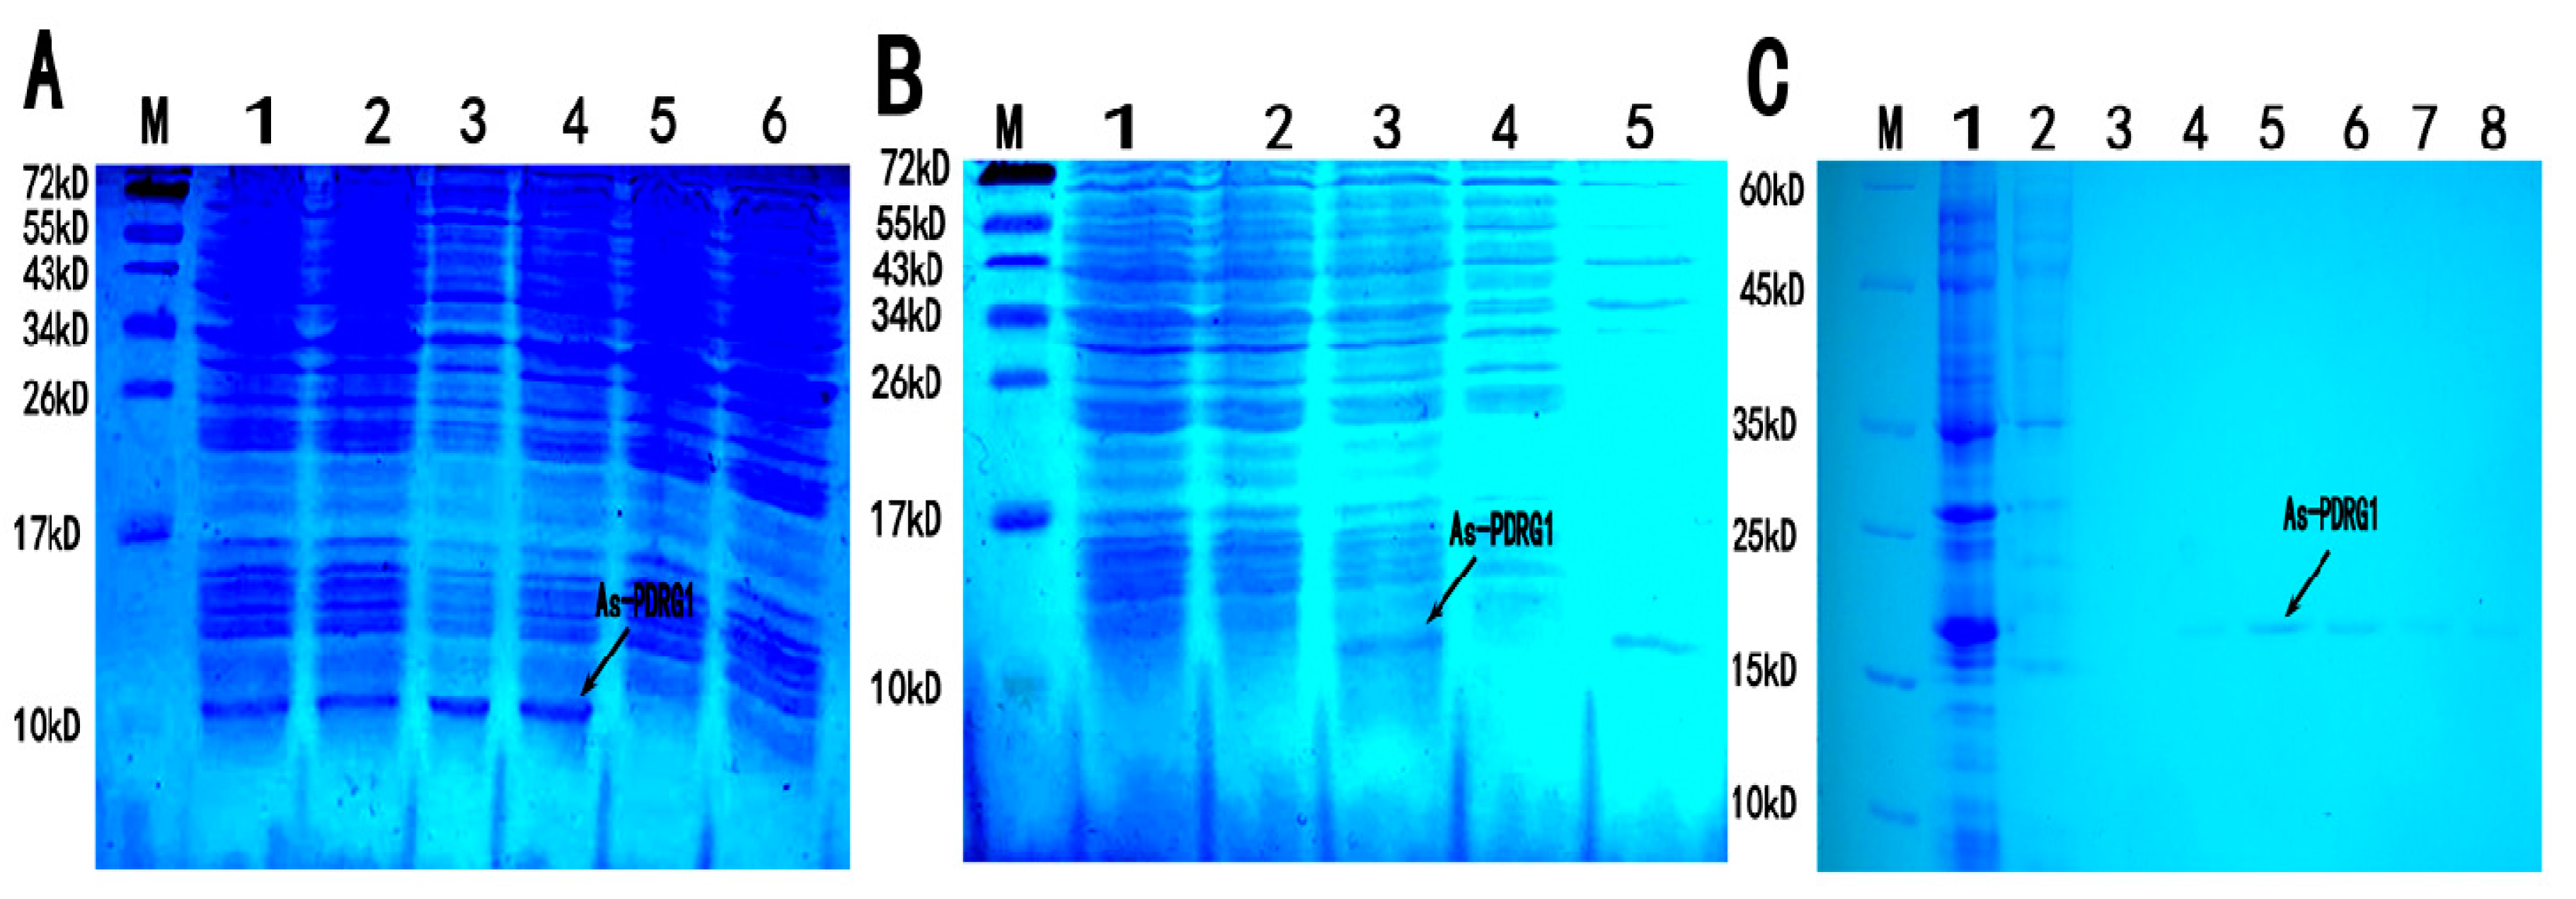
2.4. Purification and Expression of As-PDRG1 Protein

A 228 bp fragment of the ORF was obtained by digestion with restriction enzymes EcoRI and XhoI, which encoded the putative PDRG1 protein of 75 amino acids. The predicted molecular mass was about 8.4 kDa. The PDRG1 protein isoelectric point was 9.35. It showed no significant difference in expression quantity under the four different induction conditions (Figure 7A), therefore, we adopted a condition of 1 mM IPTG at 37 °C for further research. Sodium dodecyl sulfate polyacrylamide gel electrophoresis (SDS-PAGE) detected the molecular mass of the recombinant protein as 11 kDa, which was consistent with the predicted size. We identified that the PDRG1 protein was expressed in an inclusion body form (Figure 7B). After denaturation in 20 M urea, purification, and dialysis, a relatively pure protein was obtained (Figure 7C).

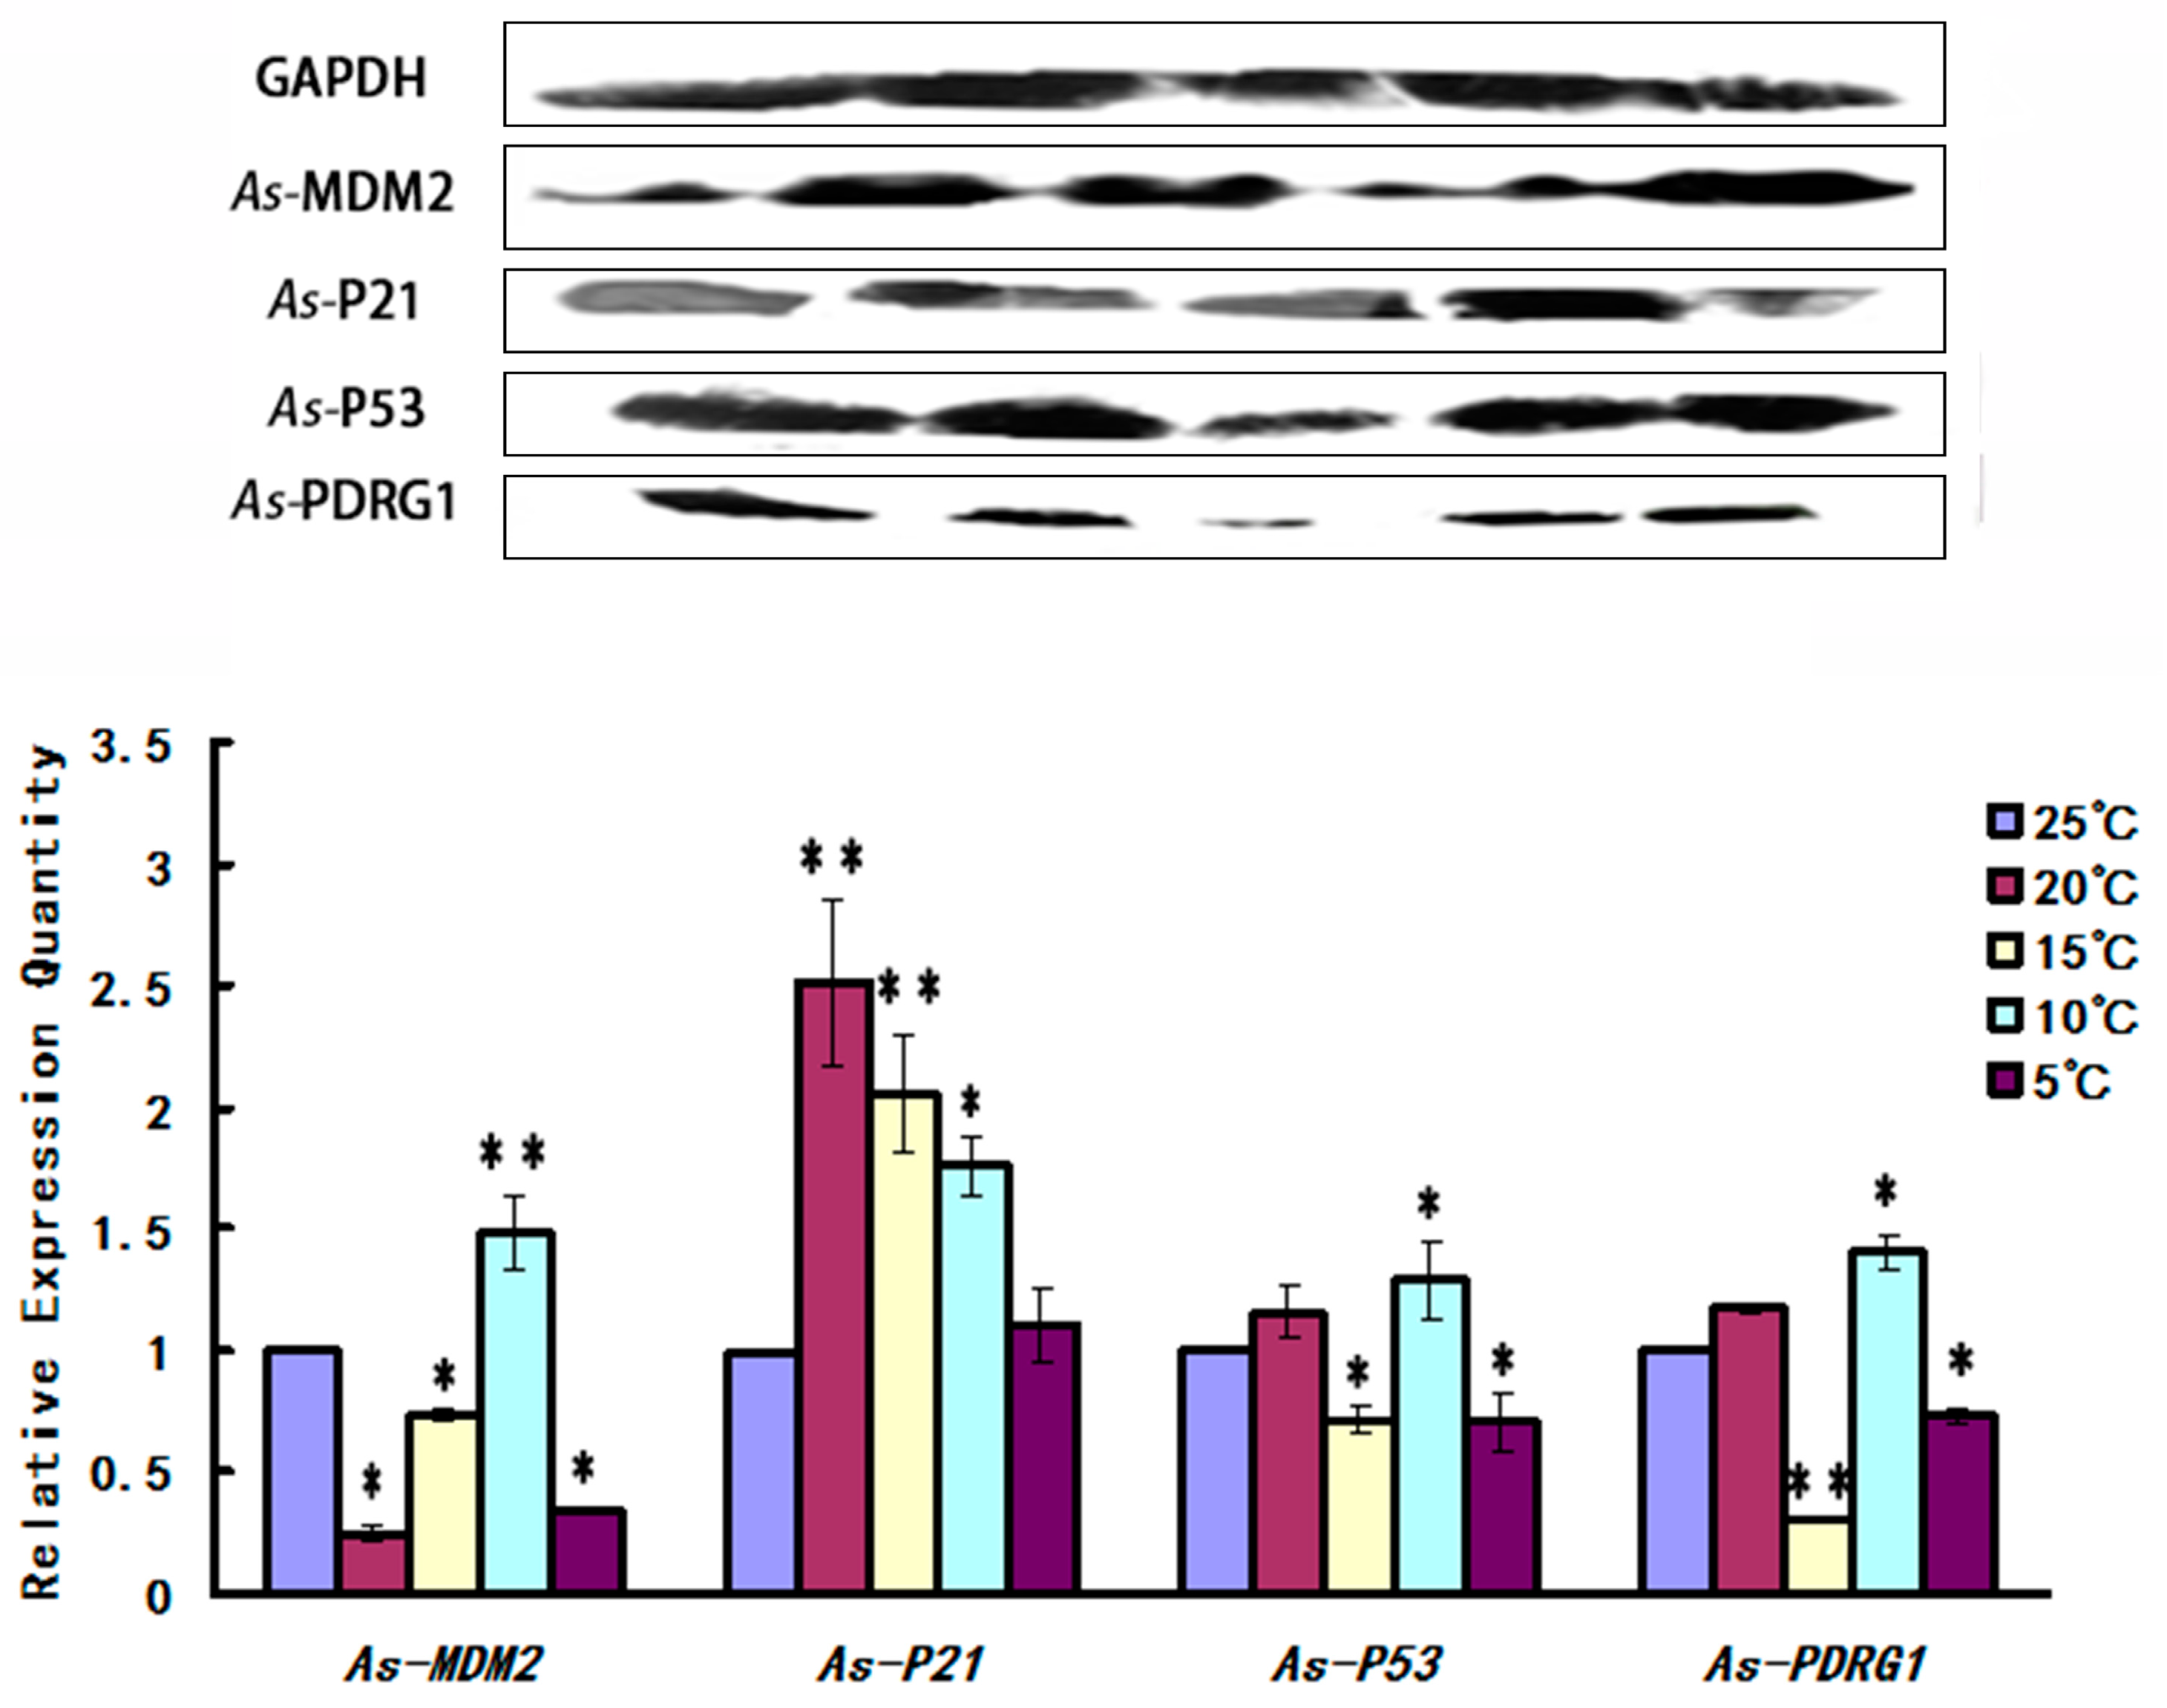
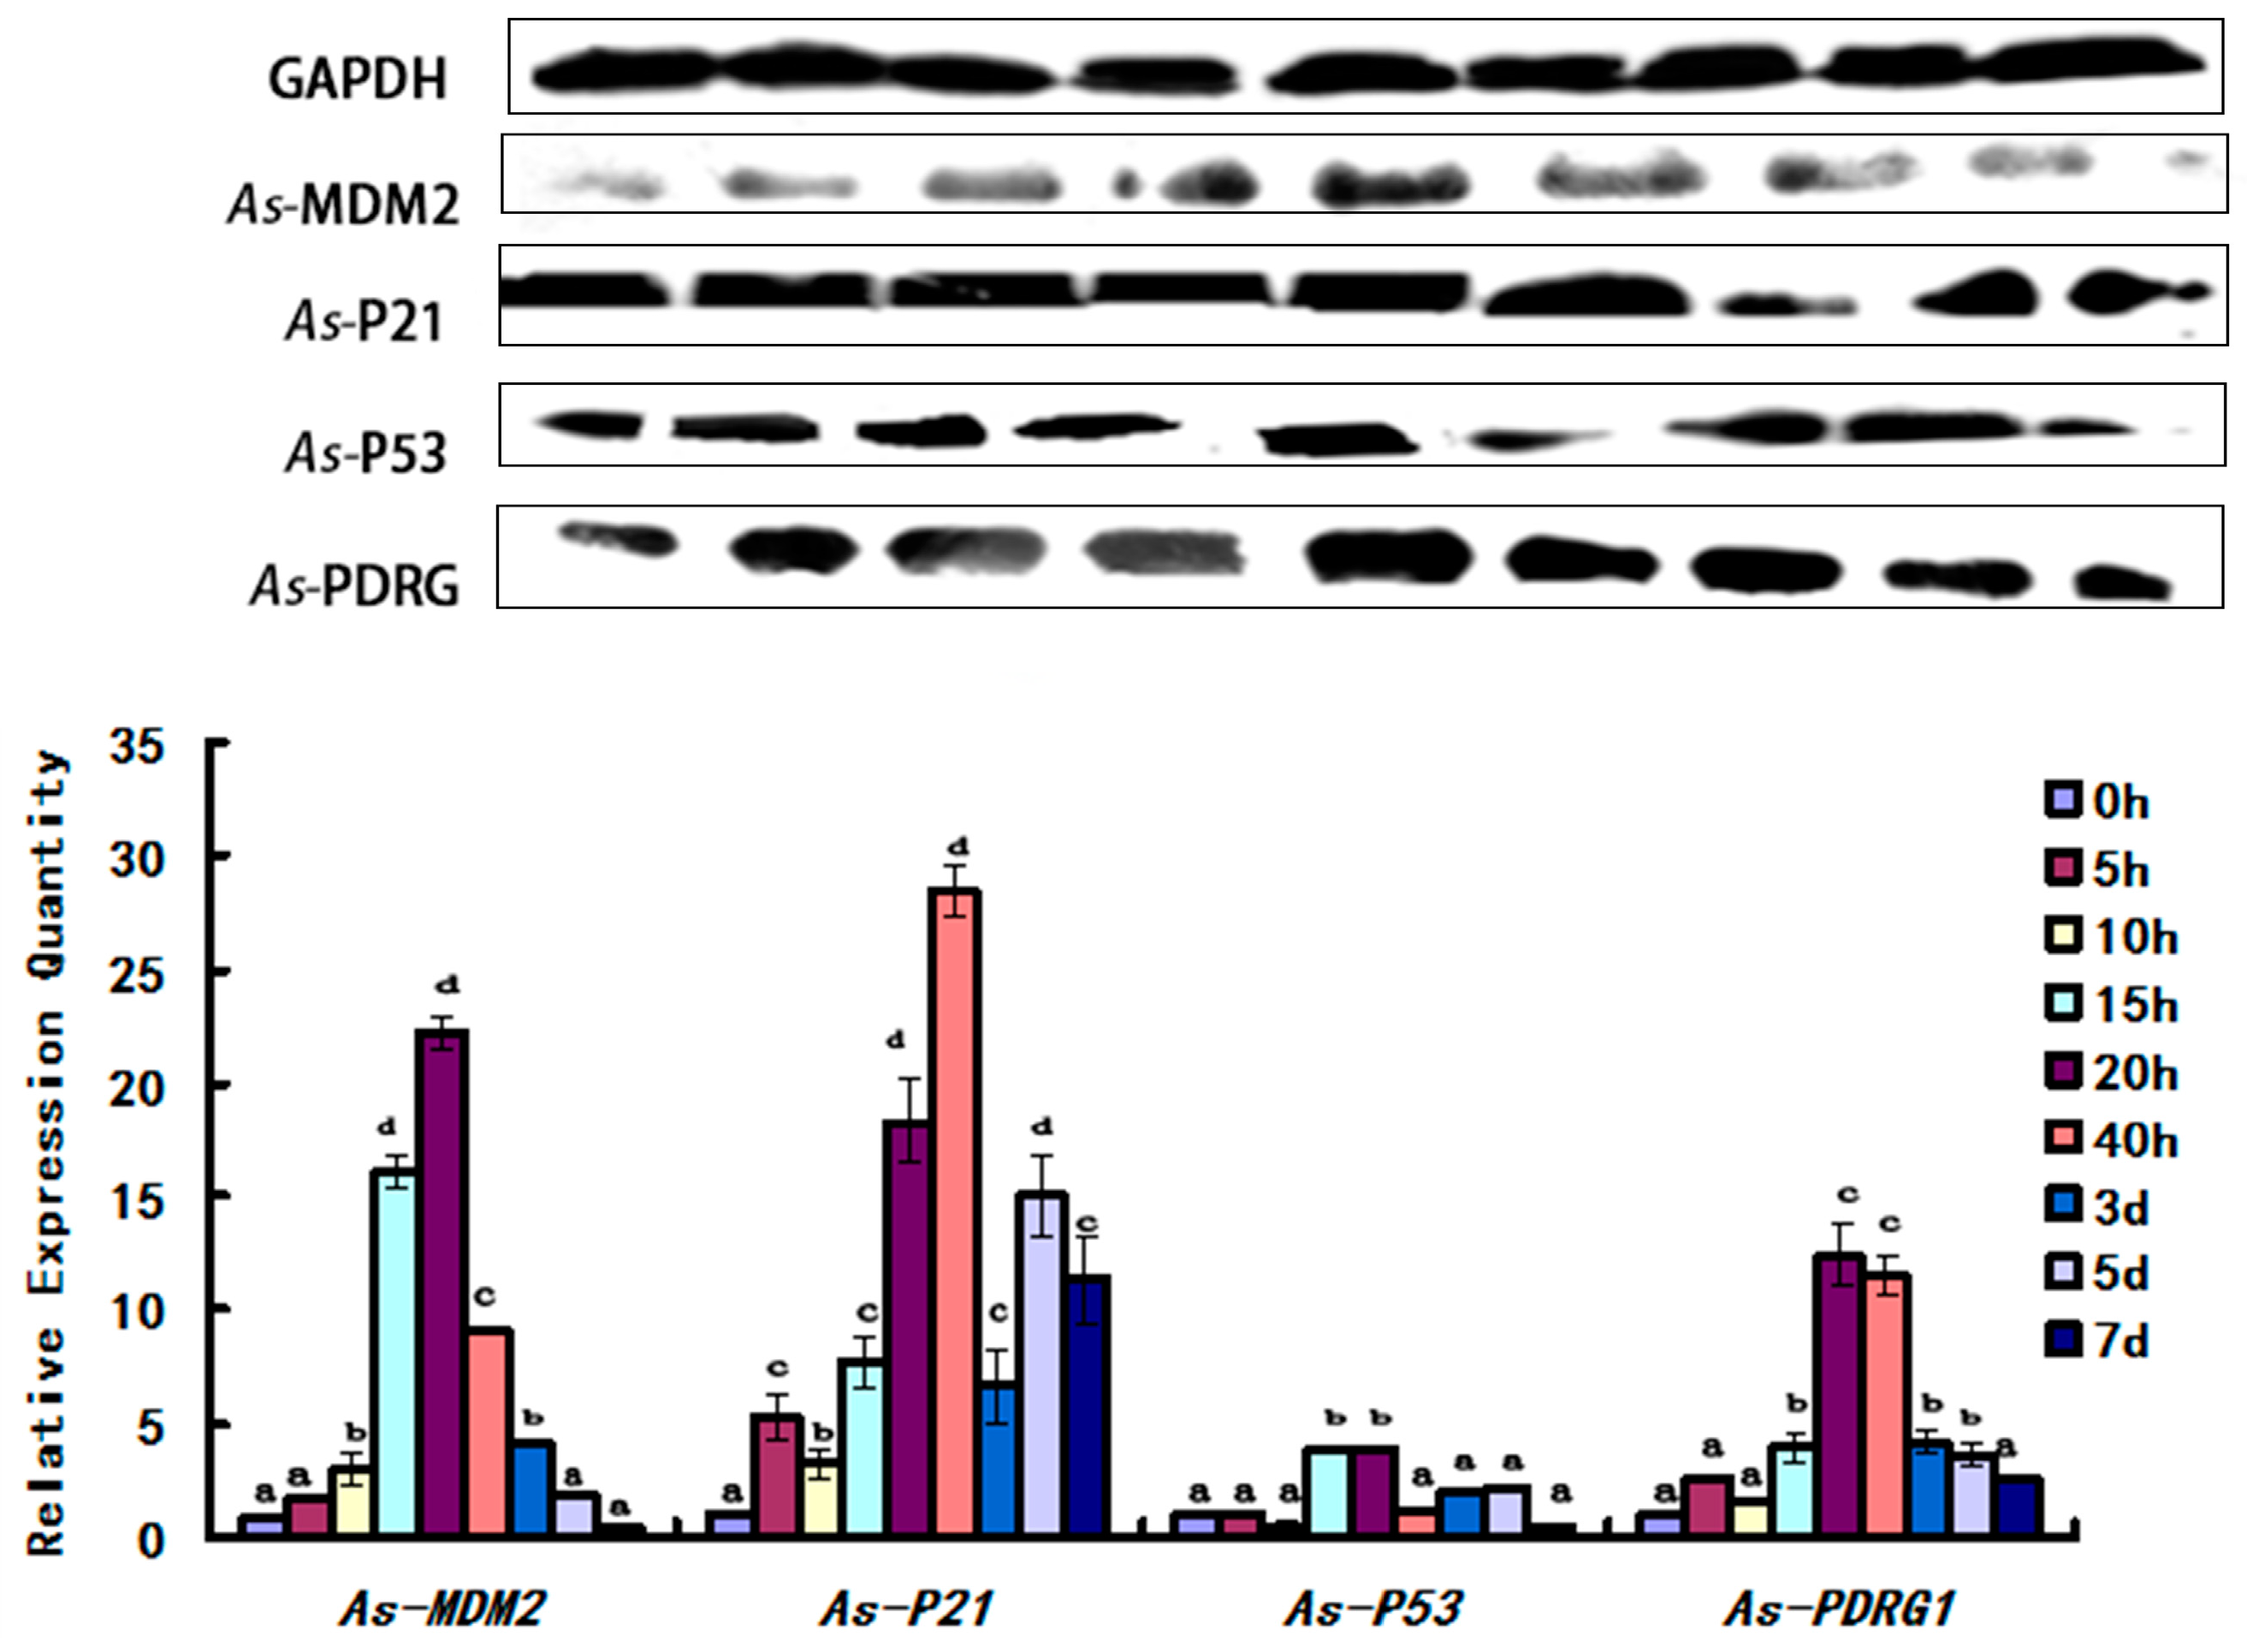
2.5. Expression Pattern of As-PDRG1 Tested by Western Blotting in Early Embryo Development and to Stress

The experimental data from different embryo development stages showed that the amount of As-PDRG1 in A. sinica increased from 0 to 20 h, and reached its peak at 20 h. Subsequently, it began to decline. Its lowest level was at 7 days. The cell cycle regulatory proteins (As-MDM2, As-P21, As-P53) showed similar trends to As-PDRG1. Meanwhile, the level of P53 was less than that of PDRG1 (Figure 8).
In the temperature stress experiment, the experimental data showed that as the temperature decreased from 25 to 15 °C, the As-PDRG1 protein level showed a downward trend and the lowest value occurred at 15 °C. As the temperature continued to decrease, the level of As-PDRG1 protein increased. The cell cycle regulatory proteins (As-MDM2, As-P53) showed similar trends to As-PDRG1. Meanwhile, the cell cycle regulatory protein As-P21 showed a sharp rise from 25 to 20 °C; the maximum level was observed at 20 °C. Thereafter, with decreasing temperature the level of As-P21 also decreased (Figure 9).

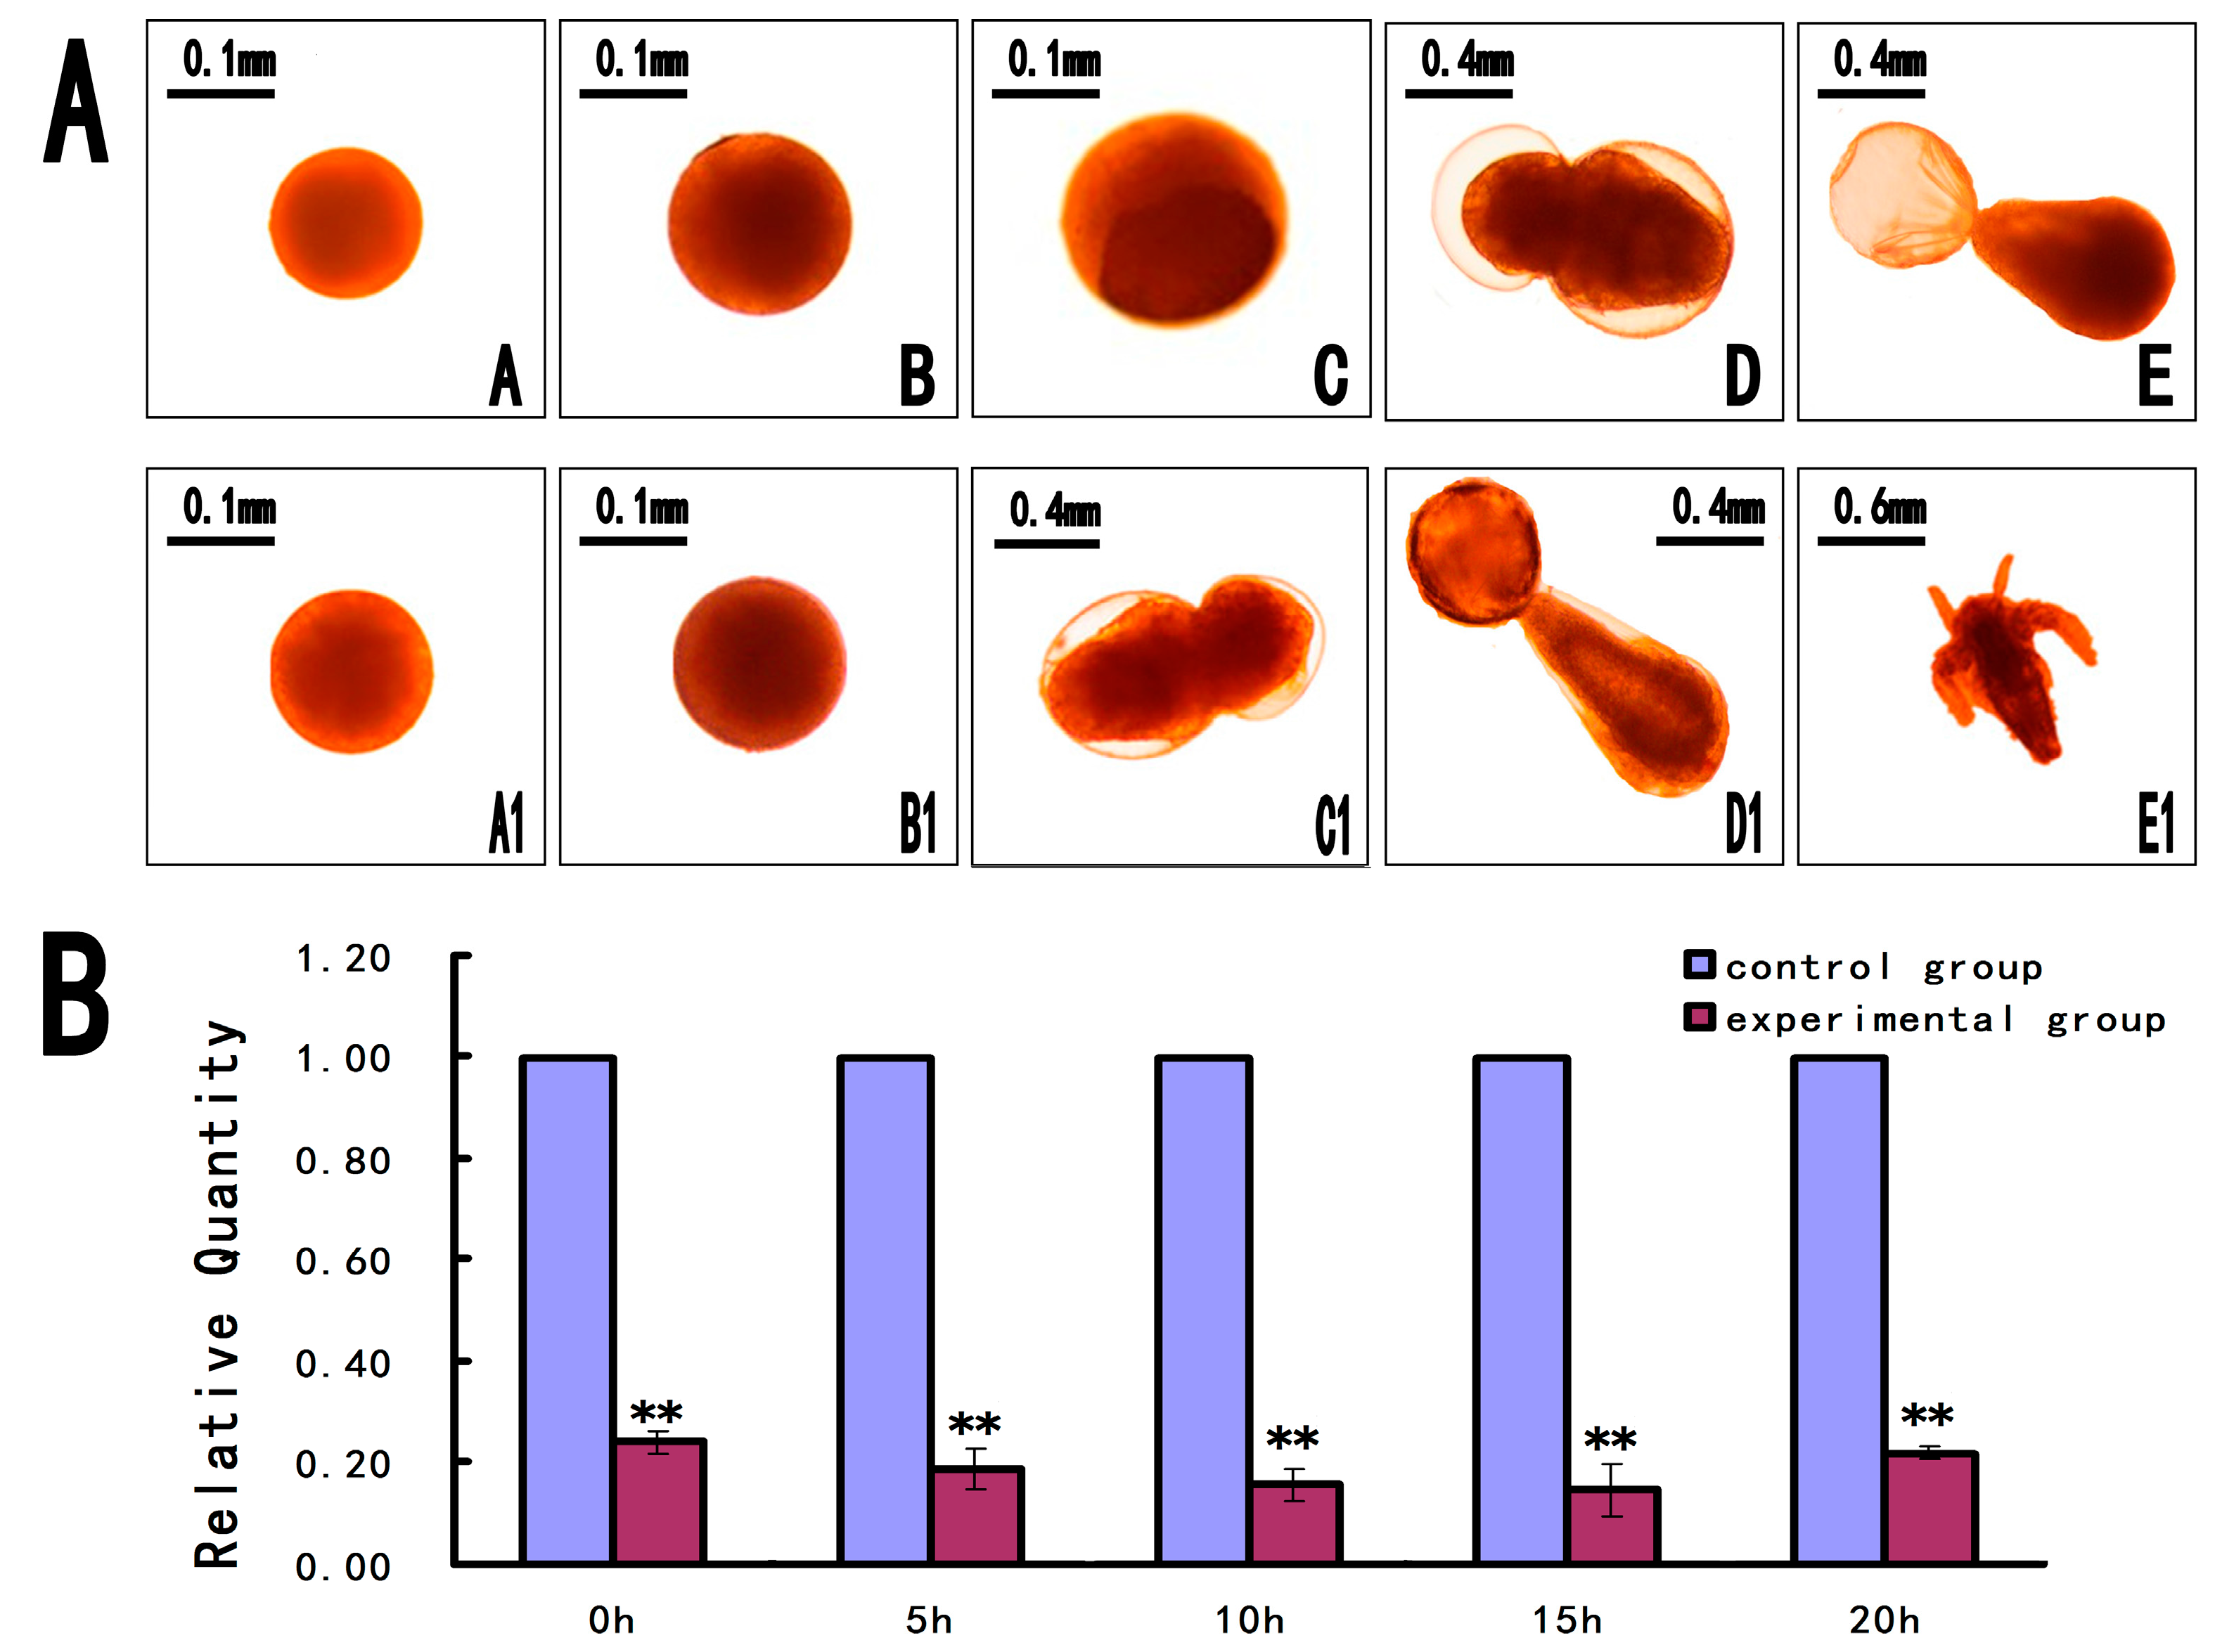
2.6. Short Interfering RNA (siRNA) for Knockdown of As-PDRG1

To explore the function of As-pdrg1 during the early embryo development of A. sinica, we knocked down As-pdrg1 expression using an siRNA. After knockdown of As-pdrg1 by the siRNA, phenotypic observation showed almost no difference between the experimental and control groups from 0 to 5 h. Abnormal individuals appeared at the nauplius stage (10–20 h): growth and movement of the individuals in the experimental group were slow compared with the control (Figure 10A). The death and deformation rates both increased. The mortality of the experimental group was 40.25% compared with 25.68% for the control group. Reverse transcription PCR (RT-PCR) analysis showed that the expression level of the As-pdrg1 mRNA in the experimental group was lower than that in the control during the five different periods (0 h, 5 h, 10 h, 15 h, and 20 h; Figure 10B).

3. Discussion

In this study, we cloned the full-length cDNA of As-pdrg1 and noted that it encodes a putative protein of 75 amino acids (8.4 kDa), which is smaller than the 133 amino acids of both human and mouse PDRG1 proteins. However, other species also have shorter PDRG1 proteins, such as Aptenodytes forsteri (76 aa) and Pogona vitticeps (109 aa). Although the short type PDRG1 is rare, the alignment results showed that the deduced amino acid sequence QEIVDLDTKRNQNREALRL (30–48 aa) of As-PDRG1 shares high homology with PDRG1 proteins from other species. However, the function difference between the short and long types of PDRG1 is unclear, and further research is needed to determine the significance of this difference [20]. As an important protein for the cell cycle, As-PDRG1 is ubiquitously expressed in the nucleus, mitochondria, and cytoplasm. As-PDRG1 has no transmembrane region and it was mostly hydrophilic, according to the Protscale analysis. No signal peptide was identified, which indicated that As-PDRG1 is a non-secreted protein. These are similar to previous studies of the pdrg1 gene from the sea cucumber [15,16]. Thus, pdrg1 in A. sinica is similar to that in other invertebrates. According to the results of ISH, the As-pdrg1 gene is transcribed in different tissues and organs of A. sinica. Positive signals were detected in the early embryo and prenauplius stage (0–10 h). In the subsequent embryonic development process, As-pdrg1 was detected in almost in all parts, which suggested that it plays diverse roles in embryonic development and diapause termination of A. sinica.
Previous studies have shown that PDRG1 is a multifunctional protein that is involved a variety of cellular physiological activities, such as apoptosis, DNA damage repair, cell cycle regulation, and preventing programmed cell death after growth factor starvation [15,16,17]. The results of both qPCR and Western blot demonstrated that the mRNA and protein expression of As-PDRG1 showed the same increasing trend at the early developmental stage from 0 to 20 h. During the initial developmental stage of A. sinica, the cysts in diapause were activated and gradually increased. From 0 to 20 h, the embryos progressed from cysts to nauplii. The embryonic cells may experience the rapid cell division and proliferation that are necessary for embryonic activities. Along with cell division, apoptosis occurs. The increase in the mRNA and protein expression levels of As-PDRG1 could promote apoptosis to remove the unwanted, damaged, and dangerous cells during development, and to maintain homeostasis, which suggested that As-PDRG1 plays an important role in diapause termination and early embryonic development of A. sinica. Thereafter, western blotting showed that As-PDRG1 began to decrease until 7 days. However, the As-pdrg1 mRNA expression reduced until 3 days, and then gradually increased. The decrease in As-pdrg1 expression could be caused by p53 expression. Western blotting showed that p53 increased from 15 to 20 h. Previous studies indicated that p53 negatively regulates PDRG1 at the transcriptional level. Meanwhile, we also detected the expression of As-PDRG1 under low temperatures. The qPCR results showed that the expression level of As-pdrg1 increased gradually as the temperature decreased. Western blotting showed that as the temperature fell from 25 to 15 °C, the As-PDRG1 protein expression showed a downward trend; the lowest value occurs at 15 °C. These results are consistent with the hypothesized function for As-PDRG1. The qPCR result agreed with the results of two other studies concerning genes relevant to the cell cycle in A. sinica [21,22].
To study the function of As-PDRG1, the P53 and related proteins (MDM2, P21) levels were analyzed by Western blotting. The results showed that As-MDM2, As-P21, and As-P53 showed similar increasing trends to As-PDRG1 from 15 to 40 h. Although As-PDRG1 expression decreased under P53 negative regulation, As-PDRG1 showed high expression at 20 and 40 h. The increased protein level occurred in a P53 independent manner [23,24,25]. It is possible that strong positive regulation by certain other genes could override the negative effect of P53 on PDRG1. This phenomenon was similar to the results of Luo [16]. In their study, the PDRG1 promoter was shown to harbor Oct1-binding sites and Oct1 strongly upregulated PDRG1 expression following genotoxic stress. Further research on the genetic regulation of As-pdrg1 is required.
PDRG1 has functions such as DNA damage repair; therefore, we observed the expression of As-pdrg1 under low temperatures. As-pdrg1 showed high expression under low temperatures; however, at the protein level, this phenomenon was not so obvious. The results suggested that As-PDRG1 is likely involved in DNA damage repair caused by low temperature. However, As-PDRG1 is likely to be involved in more complex regulatory mechanisms, resulting changes in its protein expression and inconsistent in RNA levels. The mechanisms of this regulation are unknown. This experiment also verified that the cell cycle regulators As-MDM2 and As-P21 belong to the P53 signaling pathway. In addition, we confirmed that MDM2 and P53 are in negative feedback regulation [26]. P21 protein is downstream protein of P53; however, expression levels of P53 and P21 showed obviously different trend during 3–7 days development stages from Artemia sinica. It is reason may be exist a complicated regulatory mechanism to affect the expression of P21 and P53, in process of regulation, ATM protein can directly affect the expression level of P21 without P53 regulation, leading to changes of expression level [27,28,29].
To determine the function of the protein, we carried out siRNA knockdown experiments. RNA interference reduces transcription, thereby reducing the levels of the target protein, which may have phenotypic effects. In our pdrg1 knockdown experiments, increased mortality was observed in larvae expressing the siRNA targeting As-pdrg1. Surviving individuals not only moved slower than the wild-type, but also developed more slowly. This was similar to a previous study, in which knockout of pdrg1 slowed cell growth [15]. Therefore, the siRNA results suggested that pdrg1 plays an important role in early embryonic development.

4. Materials and Methods

4.1. Sample Reparation

The cysts of A. sinica were harvested from the salt lake of Yuncheng, Shanxi Province (China) and stored at −20 °C in the dark until use. The cysts were hatched in filtered seawater (salinity 28‰) under laboratory conditions: 30 °C, at an illumination intensity of 1000 lx, according to the procedure described by Cheng et al. [30].
The development of A. sinica consists of five main stages: the embryo, nauplius, metanauplius, pseudoadult, and the adult stages. In this experiment, 0–10 h corresponded to the cyst stage; 15–20 h corresponded to the nauplius stage; 40 h corresponded to the metanauplius stage; 3 days and 5 days corresponded to the pseudoadult stage; and after 5 days corresponded to the adult stage. Animal samples of roughly 0.5 g were collected at each time point (0 h, 5 h, 10 h, 15 h, 20 h and 40 h; 3 days, 5 days and 7 days, adult) at different periods of development for subsequent experiments. For the salinity stress condition, A. sinica nauplii (20 h) were maintained at 30 °C in 28‰ salinity natural seawater for 44 h and used as the control group. A. sinica at the same stage (20 h) were then treated with high salinity (50‰, 100‰, 150‰, and 200‰). The low temperature tolerance and salinity stress conditions used the same control group. While A. sinica at the same stage (20 h) were held at 25, 20, 15, 10, or 5 °C for the low temperature stress test [31,32,33,34].

4.2. Cloning the Full-Length pdrg1 cDNA

Total RNA from the different developmental periods was extracted using the TRIZOL-A+ reagent (Takara, Dalian, China), according to the manufacturer’s instructions. The RNA was then reverse transcribed into cDNA using an oligo(dT) primer and MMLV reverse transcriptase (Takara), following the manufacturer’s instructions. Specific primers (As-pdrg1F, As-pdrg1R, Table 2) were designed using primer Premier 5.0 based on the partial sequence of Artemia franciscana pdrg1 and synthesized by GENEray (Shanghai, China). The PCR reaction conditions were as follows: initial incubation at 94 °C for 5 min; followed by 35 cycles of denaturation at 94 °C for 30 s, annealing at 56 °C for 30 s, and elongation at 72 °C for 1 min; and a final incubation at 72 °C for 10 min. PCR products were separated on 1.0% agarose/Tris-Acetate-EDTA (TAE) gels and sequenced by TsingKe (Beijing, China). This produced a 350 bp expressed sequence tag (EST) sequence of As-pdrg1. To obtain the full-length cDNA sequence of As-pdrg1, rapid amplification of cDNA ends (RACE) was performed. The 3′ and 5′ rapid-amplification of cDNA ends (RACE) reactions were carried out using a SMART™ RACE cDNA Amplification Kit amplification kit (Clontech, Dalian, China). All the reaction processes of the 3′ and 5′ RACE were carried out according to the manufacturer’s instructions. The primers for 3′ RACE (3′ As-pdrg1, Table 2) and 5′ RACE (5′ As-pdrg1, Table 2) were designed based on the amplified 350 bp gene fragment of As-pdrg1 mentioned above. The RACE PCR products were purified using a Gel Extraction Kit (Trans, Beijing, China) and cloned into the pEasy transformed into Escherichia coli strain T1, and then sequenced by TsingKe. The 3′ and 5′ termination fragments were spliced together using DNA Man 8.0 (Lynnon Biosoft, San Ramon, CA, USA) to obtain the full-length As-pdrg1 cDNA. The full-length pdrg1 nucleotide sequence was submitted to GenBank with the accession number MF614121.

4.3. Quantitative Real-Time PCR (qPCR)

4.3.1. Expression of As-pdrg1 at Different Developmental Stages

Samples of A. sinica were collected at different growth periods (0 h, 5 h, 10 h, 15 h, 20 h, and 40 h; 3 days, 5 days, and 7 days) and the total RNA was extracted as templates for cDNA synthesis using a Two-step Reverse Transcription Kit (Takara), following the manufacturer’s instructions. The primers for real-time PCR (RT-pdrg1F, RT-pdrg1F; Table 2) were synthesized by TsingKe. The A. sinica β-actin gene (β-actin-F, β-actin-F; Table 2) was used as a normalization control for each RNA sample [19,20]. Real-time PCR was performed in triplicate for each sample using SYBR® Premix Ex Taq™ (Takara). Each reaction (25 μL) contained 0.5 μL of each primer, 12.5 μL of Master SYBR Green I (Takara) mix, 2 μL of cDNA template, and water to a final volume of 25 μL. The qPCR reaction conditions were as follows: 95 °C for 30 s; followed by 40 cycles each of 95 °C for 5 s, 56 °C for 30 s, 95 °C for 15 s, 60 °C for 30 s, and 95 °C for 15 s. At the end of each reaction, the experimental data were gathered from the three parallel reactions [5]. Subsequently, the gene expression data were analyzed by Thermal Cycler Dice Real Time system software (Takara), and quantified by the comparative cycle threshold (Ct) method (Ct2−ΔΔ method), based on the Ct values for both As-pdrg1 and β-actin, to calculate the relative fold increase [35,36,37]. The statistical significance of any change was analyzed using the least square difference (LSD) t-test in SPSS 16.0. The significance threshold was p < 0.05.

4.3.2. Expression of As-pdrg1 in Response to Stress

For the temperature challenge assay, we used the method shown in Section 4.1. A. sinica nauplii (20 h) were maintained at 30 °C in 28‰ salinity natural seawater for 44 h and used as the control group. A. sinica at the same stage (20 h) were held at 25, 20, 15, 10, or 5 °C for the low temperature stress test in 28‰ salinity natural seawater for 24 h. Total RNA was extracted from the six groups, and the RNA samples were reverse transcribed into cDNA templates.
For the salinity challenge assay, we used the method shown in Section 4.1. The sample reared for 44 h in natural seawater (salinity 28‰) served as the control. The experimental groups were incubated in salinities of 50, 100, 150, and 200‰ for the high salinity stress test in 28‰ salinity natural seawater for 24 h. RNA was extracted from each salinity sample and reverse transcribed into cDNA for qPCR, which was carried out as described in Section 4.3.1.

4.4. Construction, Expression, and Purification of pET-30a PDRG1 Protein

The full-length ORF of As-pdrg1 was amplified using primers that added EcoRI and XhoI sites to the 5′ and 3′ ends. The primers (ORF-pdrg1F, ORF-pdrg1F, Table 2) were designed using Primer Premier 5.0 software. The PCR products were cloned into the pMD19T vector. PMD19T-pdrg1 and pET30a were both digested with EcoRI and XhoI and then ligated together using T4 DNA ligase (Takara) at 16 °C overnight. TsingKe then sequenced the recombinant plasmid, pET-30a-pdrg1.

4.5. Expression and Purification of the Recombinant Protein from Escherichia Coli

To facilitate the overexpression of PDRG1, the recombinant expression plasmid pET-30a-pdrg1 was transformed into E. coli BL21 (DE3). Four different conditions were used to induce the expression of the fusion protein: 1 mM isopropyl β-d-1-thiogalactopyranoside (IPTG) for 3 h at 37 °C, 1 mM IPTG for 3 h at 30 °C, 0.25 mM IPTG for 3 h at 37 °C, and 0.25 mM IPTG for 3 h at 30 °C. Cells were collected and washed with phosphate buffered saline (PBS) three times. The cells were collected by centrifugation at 2800× g for 5 min, the supernatants were discarded, and the pellets were washed twice with PBS, and then resuspended in PBS. The samples were mixed with 5 × SDS-PAGE loading buffer, at a ratio of 4:1, and boiled for 10 min.
The recombinant protein was expressed in a 500 mL culture of E. coli BL21 (DE3) and induced with 1 mM IPTG at 37 °C for 3 h. The cells were collected by centrifugation at 4 °C, and washed twice with 1× PBS. The pellets were resuspended in equilibration buffer, and then lysed by ultrasonication. Subsequently, the inclusion bodies were washed twice with 6.057 g/L Tris containing 5.85 g/L NaCl and 120.12 g/L Urea and Ethylene Diamine Tetraacetic Acid (EDTA) 0.2922 g/L, followed by dissolution in a solution comprising Tris 12.114 g/L, 29.25 g/L NaCl, 480.48 g/L Urea, and 0.68077 g/L imidazole. The lysate was loaded onto an Ni-NTA HisTrap™ HP crude column (GE Healthcare, Little Chalfont, UK) and then eluted using elution buffer at different imidazole concentrations (5, 10, 20, 40, 60, 80, and 100 mM). The terminal products were dialyzed into 20 mM Tris-HCl and then the samples were mixed with 5× SDS-PAGE loading buffer, at a ratio of 4:1, and boiled for 10 min. A small amount of the samples were examined by SDS-PAGE on a 15% gel.

4.6. In Situ Hybridization (ISH) Assay

Templates for the RNA probes were prepared by PCR with a pair of specific primers (ISH-pdrg1F, ISH-pdrg1F, Table 2) designed based on the full-length sequence of As-pdrg1. The PCR product (about 396 bp) was purified on an agarose gel and cloned into the pGM-T vector (Tiangen, China), which added the T7 and SP6 polymerase binding sites. RNA probes were labeled with digoxigenin (DIG) using a DIG RNA labeling kit (SP6/T7, Roche, Indianapolis, IN, USA), according to the manufacturer’s instructions. Samples were then collected at different developmental stages (0 h, 5 h, 10 h, 15 h, 20 h and 40 h; 3 days and 5 days). The 0 h, 5 h, and 10 h samples were first completely decapsulated with 50% NaClO. The samples were washed with diethylpyrocarbonate (DEPC) quickly, and fixed in freshly prepared 4% paraformaldehyde solution in 100 m/mol PBS (pH 7.4) at 4 °C for 4–8 h. Subsequently, the samples were taken through an ascending ethanol concentration series (30%, 50%, and 70%), and then stored in 70% EtOH. The samples were then dehydrated with concentrated gradient of ethanol (80–90%) for 1 h each, and then dehydrated with ethanol for 1 h, twice. To make them transparent, the samples were treated with xylene:ethanol (1:1) ratio for 15 min, and then with xylene for 10 min, followed by xylene:paraffin wax (1:1) for 30 min at 60 °C embedded organization.
The embedded tissue was cut into 8 μm-thick slices using a microtome and placed on 0.1% DEPC water-sterilized glass slides treated with polylysine on a 42 °C stage for 1 h, incubated at 50 °C overnight and then dried and sealed at 4 °C. After dewaxing the samples, they were incubated sequentially in 1× PBS, 0.3% TritonX-100, RNase-free ProK, 4% paraformaldehyde (pH 7.4), washing buffer, blocking solution, antibody solution, and detection buffer (pH 9.5). Prehybridization of each sample was then performed at 52 °C for 2 h in prehybridization buffer containing 50% deionized formamide (v/v), 1× Denhardt’s solution, 5× saline-sodium citrate (SSC), and 5 mg/mL salmon sperm DNA at 50 °C overnight. Subsequently, a DIG nucleic acid detection kit (Roche) was used to detect the signal. Finally, nuclear fast red was used for counterstaining and signals were detected under a microscope.

4.7. Western Blotting

4.7.1. Protein Production of As-PDRG1 in Different Stages of Early Embryo Development

Total proteins were extracted from each sample (0 h, 5 h, 10 h, 15 h, 20 h, and 40 h; 3 days, 5 days, 7 days) using Radioimmunoprecipitation (RIPA) Lysis Buffer (Solarbio, Beijing, China) and quantified using the Bradford method [38,39,40] with a BCA Kit (Solarbio), according to the manufacturer’s instructions. Samples (70 μg) were subjected to fractionation by 15% or 12% SDS-polyacrylamide gels and transferred to polyvinylidene fluoride (PVDF) membranes. The membranes were blocked with 5% non-fat powdered milk (Sangon, Shanghai, China) over 1 h at room temperature. The membranes were then placed in sealed plastic bags containing diluted (in PBS with Tween 20 (PBST)) rabbit anti-As-PDRG1 polyclonal antibodies (1:200) and anti-GAPDH antibodies (1:1000), and incubated overnight at 4 °C. The membranes were washed with PBST (3 × 10 min), incubated with horseradish peroxidase (HRP)-conjugated goat anti-rabbit IgG and goat anti-Mouse IgG anti-bodies at 37 °C for 1 h, followed by washing with PBST (3 × 10 min). Immunoreactive proteins were visualized using the ECL reagent (Advansta, Menlo Park, CA, USA) and the blots were exposed to an X-ray film in the darkroom. Gray scale analysis using the Image J software (available online: https://imagej.nih.gov) was used to compare the density (equivalent to the intensity) of the bands on the blots and the data were then converted into column charts. The expression intensities of As-PDRG1 specific bands were normalized against those of the GAPDH bands.

4.7.2. Expression of As-PDRG1 under Low Temperature

For the temperature-challenge assay, cysts were reared for 20 h at 25 °C. The temperature was then reduced to 20 °C, 15 °C, 10 °C, and 5 °C and incubation continued for 24 h. The method was shown in Section 4.7.1. It was used to obtain total proteins. Western blotting was performed to analyze the levels of As-PDRG1 in response to low temperature, with GAPDH as the control. All antibodies were bought from Proteintech (Wuhan, China).

4.8. Short Interfering RNA (siRNA) Assay

The RNA oligonucleotides were designed using online software from the full-length cDNA of As-pdrg1 and synthesized by Takara (Sense siRNA, Anti siRNA; Table 2). The 0 h samples were exuviated using 50% NaClO. Subsequently, the samples were suspended in electroporation buffer, 2 mM dsRNAs (siRNAs) were added, and the samples (1.3 mL in electroporation buffer and dsRNA) were added to an electroporation cuvette, and placed into the electroporator. The samples were electroporated at 400 V for 1 s [21,41]. No oligonucleotide controls were processed identically. Thereafter, the samples were incubated in the optimum environment for 0 h, 5 h, 10 h, 15 h, and 20 h. RNA was extracted from samples at different time points and qPCR was performed as detailed in Section 4.3.1. The appearance of the sample was observed using a microscope.

4.9. Bioinformatics

Using the 3′ RACE and 5′ RACE techniques, the sequence of full-length pdrg1 cDNA of Artemia was obtained using DNAman 8.0 software. The nucleic acid sequence of the Artemia pdrg1 gene was submitted to NCBI to compare the amino acid of BLASTX (available online: http://blast.ncbi.nlm.nih.gov/Blast/) to determine its homology and domains. The ORF in the pdrg1 cDNA was determined using ORF FINDER (https://www.ncbi.nlm.nih.gov/orffinder/) and InterProscan software (http://www.ebi.ac.uk/Tools/pfa/iprscan/) was used to analyze the domain and conserved sites in the predicted protein. The theoretical molecular weight and isoelectric point of PDRG1 were deduced by ProtParam (http://web.expasy.org/protparam/). The hydrophobicity and transmembrane regions of the protein were analyzed using Protscale (http://web.expasy.org/protscale/) and TMHMM software, respectively. The subcellular localization, phosphorylation sites, and signal peptide analysis of the PDRG1 protein were predicted using Psort II (http://psort.hgc.jp/form2.html), NetPhos 3.1 (http://www.cbs.dtu.dk /services/NetPhos/), and SignalP 4.1 (http: //www.cbs.dtu.Dk/services/SignalP/), respectively. The secondary structure of the protein was analyzed using the SOPM method (https://npsa-prabi.ibcp.fr/cgi-bin/npsa_automat.pl?page=/NPSA/npsa_server.html). The phylogenetic analysis of the pdrg1 gene was carried out using Clustal X and MEGA 6.0. The neighbor-joining (NJ) method was used to construct the phylogenetic tree. The Bootstrap method was used to evaluate the accuracy of the tree (Bootstrap = 1000). The statistical significance of any change was analyzed using the least square difference (LSD) t-test in SPSS 16.0. The significance threshold was p < 0.05.

5. Conclusions

The full-length cDNA of the pdrg1 gene (As-pdrg1) was obtained from A. sinica and found to contain 1119 nucleotides, including a 228 bp open reading frame (ORF), which encodes a 75 amino acid protein. We determined that the increased mRNA and protein expression levels of As-PDRG1 could promote apoptosis to remove unwanted, damaged, and dangerous cells during development and to maintain homeostasis [19]. These results suggested that As-PDRG1 plays an important role in diapause termination and early embryonic development of A. sinica. To study the function As-PDRG1, p53 and related proteins (MDM2, p21) expression was analyzed by Western blotting. Although As-pdrg1 expression was decreased by p53 negative regulation, the As-PDRG1 showed high expression at 20 h and 40 h. The increased expression occurred in a p53 non-dependent manner. It is possible that strong positive regulation by other genes could override the negative effect of p53 on PDRG1. This phenomenon is similar to the result of Luo [16]. In their study, the pdrg1 gene promoter harbors Oct1-binding sites, and Oct1 strongly upregulates PDRG1 expression following genotoxic stress. Since the pdrg1 has functions such as DNA damage repair, we examined the expression of As-pdrg1 under low temperature. The result showed that As-pdrg1 is highly expressed under low temperature, which confirmed that As-pdrg1 is likely to be involved in DNA damage repair. However, at the protein level, this phenomenon was not obvious. This might be caused by more complex regulatory mechanisms involving As-pdrg1, resulting changes in its expression and inconsistent RNA levels. This mechanism remains unclear requiring further research. The results of siRNA knockdown of As-pdrg1 suggested that it is indispensable for the growth and development of A. sinica. This study provided indirect evidence for the potential functions of PDRG1 proteins in animals and a molecular mechanism of the stress tolerance exerted by PDRG1 proteins in A. sinica. In conclusion, As-PDRG1 is strictly required for the processes of diapause embryo resumption and early embryo development in A. sinica.

Acknowledgments

This work was supported by a grant from the National Natural Science Foundation of China (31572607).

Author Contributions

Conceived and designed the experiments: Lin Hou, Linlin Sui, Performed the experiments: Wan Zhang, Feng Yao, Lin Hou, Hong Zhang, Na Li and Xiangyang Zou. Analyzed the data: Wan Zhang, Feng Yao Wrote the paper: Wan Zhang, Feng Yao, Lin Hou, Linlin Sui. Read, commented and approved the final manuscript: Wan Zhang, Feng Yao, Hong Zhang, Na Li, Xiangyang Zou, Linlin Sui and Lin Hou.

Conflicts of Interest

The authors have no conflict of interest to declare.

Abbreviations

PDRG1p53 and DNA damage-regulated gene 1
As-pdrg1mRNA from Artemia sinica
As-PDRG1protein from Artemia sinica
ORFopen reading frame
PCRpolymerase chain reaction
UTRuntranslated region
ISHin situ hybridization
siRNAshort interfering RNA
DIGdigoxigenin

References

  1. Zhang, S.; Yao, F.; Jing, T.; Zhang, M.; Zhao, W.; Zou, X.; Sui, L.; Hou, L. Cloning, expression pattern, and potential role of apoptosis inhibitor 5 in the MARK termination of embryonic diapause and early embryo development of Artemia sinica. Gene 2017, 628, 170–179. [Google Scholar] [CrossRef] [PubMed]
  2. Zhang, M.C.; Yao, F.; Luan, H.; Zhao, W.; Jing, T.; Zhang, S.; Hou, L.; Zou, X.Y. APC/CCDC20 and APC/C play pivotal roles in the process of embryonic development in Artemina sinica. Sci. Rep. 2016, 6, 39047. [Google Scholar] [CrossRef] [PubMed]
  3. Abatzopoulos, T.J.; Beardmore, J.A.; Clegg, J.S.; Sorgeloos, P. Artemia: Basic and Applied Biology; Kluwer Academic: Dordrecht, The Netherlands, 2002. [Google Scholar]
  4. Li, X.; Hou, L.; Ma, J.; Liu, Y.D.; Zheng, L.P.; Zou, X.Y. Cloning and character-ization of β-catenin gene in early embryonic developmental stage of Artemia sinica. Mol. Biol. Rep. 2012, 39, 701–707. [Google Scholar] [CrossRef] [PubMed]
  5. Hou, L.; Jiang, L.J.; Sun, W.J.; Zhang, R.F.; Wang, J.Q.; Zhao, X.T.; An, J.L. Establishment and improvement of real-time fluorescence quantitative PCR for actin gene of Artemia sinica. J. Liaoning Normal Univ. 2006, 29, 15–19. [Google Scholar]
  6. Wang, X.L.; Yao, F.; Liang, X.Y.; Zhu, X.L.; Zheng, R.; Jia, B.L.; Hou, L.; Zou, X.Y. Cloning and expression of retinoblastoma-binding protein 4 gene in embryo diapause termination and in response to salinity stress from brine shrimp Artemia sinica. Gene 2016, 591, 351–361. [Google Scholar] [CrossRef] [PubMed]
  7. Jiang, L.J.; Hou, L.; Zou, X.Y.; Zhang, R.F.; Wang, J.Q.; Sun, W.J.; Zhao, X.T.; An, J.L. Cloning and expression analysis of p26 gene in Artemia sinica. Acta Biochim. Biophys. Sin. 2007, 39, 351–358. [Google Scholar] [CrossRef] [PubMed]
  8. .Zheng, L.P.; Hou, L.; Chang, A.K.; Yu, M.; Ma, J.; Li, X.; Zou, X.Y. Expression pattern of a gram-negative bacteria-binding protein in early embryonic development of Artemia sinica and after bacterial challenge. Dev. Comp. Immunol. 2011, 35, 35–43. [Google Scholar] [CrossRef] [PubMed]
  9. Li, Z.; Yao, F.; Chen, Y.; Zhang, R.; Lv, Y.; Zhao, N.; Wang, T.; Xin, W.; Hou, L.; Zou, X. Molecular cloning, characterization and expression analysis of ubiquitin pro-tein ligase gene (As-ubpl) from Artemia sinica. Mol. Cell Biol. 2013, 165, 90–98. [Google Scholar]
  10. Qing, T.; Zhao, X.; Luan, H.; Ba, H.; Yang, L.; Li, Z.; Hou, L.; Zou, X. Identification, expression pattern and functional characterization of As-MyD88 in bacteria challenge and during different developmental stages of Artemia sinica. Dev. Comp. Immunol. 2015, 50, 9–18. [Google Scholar]
  11. Zhao, W.; Yao, F.; Zhang, M.C.; Jing, T.; Zhang, S.; Hou, L.; Zou, X.Y. The Potential Roles of the G1LEA and G3LEA Proteins in Early Embryo Development and in Response to Low Temperature and High Salinity in Artemia sinica. PLoS ONE 2016, 11, E0162272. [Google Scholar] [CrossRef] [PubMed]
  12. Sardiu, M.E.; Cai, Y.; Jin, J.; Swanson, S.K.; Conaway, R.C.; Conaway, J.W.; Florens, L.; Washburn, M.P. Probabilistic assembly of human protein interaction networks from label-free quantitative proteomics. Proc. Natl. Acad. Sci. USA 2008, 105, 1454–1459. [Google Scholar] [CrossRef] [PubMed]
  13. Boulon, S.; Bertrand, E.; Pradet-Balade, B. HSP90 and the R2TP co-chaperone complex: Building multi-protein machineries essential for cell growth and gene expression. RNA Biol. 2012, 9, 148–154. [Google Scholar] [CrossRef] [PubMed]
  14. Mita, P.; Savas, J.N.; Ha, S.; Djouder, N.; Yates, J.R., III; Logan, S.K. Analysis of URI nuclear interaction with RPB5 and components of the R2TP/prefoldin-like complex. PLoS ONE 2013, 8, e63879. [Google Scholar] [CrossRef] [PubMed]
  15. Wang, T.; Yang, H. Cloning and characterization of PDRG gene from sea cucumber Apostichopus japonicus and the expression in intestineduring aestivation. Mar. Sci. 2013, 37, 12. [Google Scholar]
  16. Luo, X.Q.; Huang, Y.; Sheikh, M.S. Cloning and characterization of a novel gene PDRG that is differential lyregulated by p53 and ultraviolet radiation. Oncogene 2003, 22, 7247–7257. [Google Scholar] [CrossRef] [PubMed]
  17. Jiang, L.; Luo, X.; Shi, J.; Sun, H.; Sun, Q.; Sheikh, M.S.; Huang, Y. PDRG1, a novel tumor marker for multiple malignancies that is selectively regulated by genotoxic stress. Cancer Biol. Ther. 2011, 11, 567–573. [Google Scholar] [CrossRef] [PubMed]
  18. Gong, W.L.; Xu, G.; Han, Q.Y.; Chen, Y. Construction of HeLa-PDRG1-knock Down Stable Cell Line by Lentivirus Infection. Sci. Technol. Eng. 2013, 13, 6385–6388. [Google Scholar]
  19. Pérez, C.; Pérez-Zúñiga, F.J.; Garrido, F.; Reytor, E.; Portillo, F.; Pajares, M.A. The Oncogene PDRG1 Is an Interaction Target of Methionine Adenosyltransferases. PLoS ONE 2016, 11, e0163761. [Google Scholar]
  20. Zhao, C.; Dai, W.; Qiu, L. Molecular cloning, characterization and expression analysis of a novel PDRG1 gene from black tiger shrimp (Penaeus monodon). Genet. Mol. Biol. 2017, 40, 93–103. [Google Scholar] [CrossRef] [PubMed]
  21. Chu, B.; Yao, F.; Cheng, C.; Wu, Y.; Mei, Y.L.; Li, X.J.; Liu, Y.; Wang, P.S.; Hou, L.; Zou, X.Y. The potential role of As-sumo-1 in the embryonic diapause process and early embryo development of Artemia sinica. PLoS ONE 2014, 9, e85343. [Google Scholar] [CrossRef] [PubMed]
  22. Zhang, Q.Z.; Hou, M.; Li, Q.Y.; Han, L.L.; Yuan, Z.; Tan, J.; Du, B.; Zou, X.Y.; Hou, L. Expression patterns of As-ClC gene of Artemia sinica in early development and under salinity stress. Mol. Biol. Rep. 2013, 40, 3655–3664. [Google Scholar] [CrossRef] [PubMed]
  23. Goh, A.M.; Xue, Y.; Leushacke, M.; Li, L.; Wong, J.S.; Chiam, P.C.; Rahmat, S.A.; Mann, M.B.; Mann, K.M.; Barker, N.; et al. Mutant p53 accumulates in cycling and proliferating cells in the normal tissues of p53 R172H mutant mice. Oncotarget 2015, 6, 17968–17980. [Google Scholar] [CrossRef] [PubMed]
  24. Faried, A.; Faried, L.S.; Kato, H.; Asao, T.; Kuwano, H.; Yazawa, S. Targeting P53 tumor suppressor to induce apoptosis and cell cycle arrest in esophageal cancer cells by novel sugar-cholestanols compounds. Poster Sess. 2008, 7, 83–84. [Google Scholar] [CrossRef]
  25. Melino, G.; Lu, X.; Gasco, M.; Crook, T.; Knight, R.A. Functional regulation of p73 and p63 development and cancer. Trends Biochem. Sci. 2003, 28, 663–670. [Google Scholar] [CrossRef] [PubMed]
  26. Liu, D.; Zhang, J.; Wu, Y.; Shi, G.; Yuan, H.; Lu, Z.; Zhu, Q.; Wu, P.; Lu, C.; Guo, F.; et al. YY1 suppresses proliferation and migration of pancreatic ductal adenocarcinoma by regulating the CDKN3/MdM2/P53/P21 signaling pathway. Int. J. Cancer 2017. [Google Scholar] [CrossRef] [PubMed]
  27. Ma, J.; Li, Y.; Wu, M.; Li, X. Oxidative stress-mediated p53/p21WAF1/CIP1 pathway may be involved in microcystin-LR-induced cytotoxicity in HepG2 cells. Chemosphere 2017, 194, 773–783. [Google Scholar] [CrossRef] [PubMed]
  28. Li, X.R.; Lin, X.Y.; Xiao, Z.X.; Jiang, H.X.; Tang, Q.L.; Liu, X. Structure and Function of P21 and New Research Progress. Med. Recapitul. 2008, 14, 125–134. [Google Scholar]
  29. Luo, J.L.; Cao, J.P.; Zhu, W.; Feng, S.; Sheng, F.J.; Zhu, C.Y.; Zheng, S.Y. Interaction between ATM and Radiation-activated Phosphorylation of P53 and P21. Chin. J. Cancer 2005, 24, 1059–1063. [Google Scholar]
  30. Cheng, C.; Yao, F.; Chu, B.; Li, X.J.; Liu, Y.; Wu, Y.; Mei, Y.L.; Wang, P.S.; Hou, L.; Zou, X.Y. Identification of the glycerol kinase gene and its role in diapause embryo restart and early embryo development of Artemia sinica. Gene 2014, 537, 51–62. [Google Scholar] [CrossRef] [PubMed]
  31. Koci, L.; Chlebova, K.; Hyzdalova, M.; Hofmanova, J.; Jira, M.; Kysela, P.; Kozubik, A.; Kala, Z.; Krejci, P. Apoptosis inhibitor 5 (API-5; AAC-11; FIF) is upregulated in human carcinomas in vivo. Oncol. Lett. 2012, 3, 913–916. [Google Scholar] [PubMed]
  32. Saigusa, S.; Tanaka, K.; Toiyama, Y.; Matsushita, K.; Kawamura, M.; Okugawa, Y.; Hiro, J.; Inoue, Y.; Uchida, K.; Mohri, Y.; et al. Gene expression profiles of tumor regression grade in locally advanced rectal cancer after neoadjuvant chemoradiotherapy. Oncol. Rep. 2012, 28, 855–861. [Google Scholar] [CrossRef] [PubMed]
  33. Sorgeloos, P.; Lavens, P.; Leger, P.; Tackaert, W.; Versuchele, D. Manual for the Culture and Use of Brine Shrimp Artemia in Aquaculture; State University of Ghent, Faculty of Agriculture: Ghent, Belgium, 1986; Volume 126, pp. 312–319. [Google Scholar]
  34. Hallstrom, T.C.; Mori, S.; Nevins, J.R. An E2F1-dependent gene expression pro-gram that determines the balance between proliferation and cell death. Cancer Cell 2008, 13, 11–22. [Google Scholar] [CrossRef] [PubMed]
  35. Schmittgen, T.D.; Livak, K.J. Analyzing real-time PCR data by the comparative CT method. Nat. Protoc. 2008, 3, 1101–1108. [Google Scholar] [CrossRef] [PubMed]
  36. Bradford, M.M. A rapid and sensitive method for the quantitation of microgram quantities of protein utilizing the principle of protein–dye binding. Anal. Biochem. 1976, 72, 248–254. [Google Scholar] [CrossRef]
  37. Livak, K.J.; Schmittgen, T.D. Analysis of relative geneexpression data using real-time quantitative PCR andthe 2(-Delta Delta C(T)) method. Methods 2001, 25, 402–408. [Google Scholar] [CrossRef] [PubMed]
  38. Verger, A.; Perdomo, J.; Crossley, M. Modification with SUMO A role in transcriptional regulation. EMBO Rep. 2003, 4, 137–142. [Google Scholar] [CrossRef] [PubMed]
  39. Azmi, T.I.; Oshea, J.D. Mechanism of deletion of Endo-thelial-Cells during regression of the Corpus-Luteum. Lab. Investig. 1984, 51, 206–217. [Google Scholar] [PubMed]
  40. Erica, S.J.; Gunter, B. Ubc9p Is the Conjugating Enzyme for the Ubiquitin-like Protein Smt3p. J. Biol. Chem. 1997, 272, 26799–26802. [Google Scholar]
  41. Freichel, M.; Vennekens, R.; Olausson, J.; Stolz, S.; Philipp, S.E.; Weissgerber, P.; Flockerzi, V. Functional role of TRPC proteins in native systems: Implications from knockout and knock-down studies. J. Physiol. 2005, 567, 59–66. [Google Scholar] [CrossRef] [PubMed]
Figure 1. (A) Nucleotide sequences and deduced amino acid sequences of the pdrg1 gene in A. sinica (As-pdrg1). The numbering of the nucleotide and amino acid sequences is shown on the left. The start codon is indicated in green; the stopcodon is indicated in red. The coiled-coil domain is defined by a straight black line, the asterisk (*) represents the stop codon. (B) Results of domain analysis of the putative As-PDRG1 protein. The mature putative protein includes a coiled-coil domain (Green).
Ijms 19 00126 g001
Figure 2. Phylogenetic tree of aligned amino-acid sequences of As-pdrg1 and 14 other species. A neighbor joining phylogenetic tree was constructed based on the amino acid sequences of As-pdrg1 from this study and 14 other species from GenBank using the sequence analysis tool MEGA 6.0. The sequences and corresponding GenBank accession numbers are as follows: Monodelphis domestica, XP_001362684.2; Sarcophilus harrisii, XP_003757064.1; Oryzias latipes, XP_004068945.1; Monopterus albus, XP_020473939.1; Oncorhynchus kisutch, XP_020330168.1; Larimichthys crocea, XP_010742575.1; Aptenodytes forsteri, XP_019328545.1; Parus major, XP_015503186.1; Xenopus tropicalis, NP_001015688.1; Nanorana parkeri, XP_018411923.1; Fopius arisanus, JAG81456.1; Penaeus monodon, APL97140.1; Bactrocera cucurbitae, XM_021527437.1; Crocodylus porosus, XM_019539779.1; Artemia sinica, MF614121. The red box indicates As-PDRG1. Identical amino-acid residues are indicated by black and reddish brown boxes. Less conserved residues are indicated by gray boxes, whereas somewhat similar residues are indicated by pale gray boxes. The pdrg1 N-terminal and C-terminal domains are indicated by red boxes. For interpretation of the references to color in this figure legend, the reader is referred to the web version of this article.
Ijms 19 00126 g002
Figure 3. Alignment of As-PDRG1 and known PDRG1 sequences from 15 other species. The sequences and their accession numbers are the same as those detailed in the legend of Figure 2. A red box indicates As-PDRG1.
Ijms 19 00126 g003
Figure 4. Quantitative real-time PCR (qPCR) analysis of As-pdrg1 expression during different developmental stages of A. sinica. The messenger RNA (mRNA) expression levels of As-pdrg1 and β-actin were measured at various time points during development, and data are presented as means ± SD of triplicate experiments. The development stage at 0 h was set as the control group. The x-axis indicates the developmental stage (0 h–7 days); and the y-axis indicates the expression level relative to expression at 0 h. Significant differences between developmental stages (p < 0.05) were analyzed by one-way analysis of variance (ANOVA) and are indicated with letters (a–f).
Ijms 19 00126 g004
Figure 5. Quantitative real-time PCR (qPCR) analysis of As-pdrg1 expression in response to temperature stress. The mRNA expression levels of As-pdrg1 were measured after challenge with five different temperature concentrations. The 30 °C treatment condition served as the control. Data are presented as the means ± SD of triplicate experiments. Highly significant differences between the experimental and control groups are indicated with ** p < 0.01, while significant difference are indicated with * 0.01 < p < 0.05.
Ijms 19 00126 g005
Figure 6. In situ hybridization analysis of As-pdrg1 expression during different developmental stages of Artemia sinica. (AH) experimental groups, (A1H1) control groups. (A) 0 h, gastrula stage of Artemia cysts; (BD) 5 h, 10 h and 15 h, embryonic stage; (E,F) 20 h and 40 h, nauplius stage; (G) 3 days, metanauplius larva stage; (H) 5 days metanauplius stage. Arrows indicate positive signal regions.
Ijms 19 00126 g006
Figure 7. (A) Expression of As-PDRG1 recombinant protein. M: Protein markers from 10 to 72 kDa. Lanes 1–4 show the expression of the As-PDRG1 recombinant protein from four induction treatments. (1 mM isopropyl β-d-1-thiogalactopyranoside (IPTG) at 37 °C, 1 mM IPTG at 30 °C, 0.25 mM IPTG at 37 °C, and 0.25 mM IPTG at 30 °C, respectively). The arrow shows the position of the expressed recombinant protein. Lane 5: Total proteins from non-induced cells. Lane 6: Total proteins from induced cells harboring vector pET-30a (control). (B) Detection of soluble As-PDRG1 recombinant protein (control). Lane 1: Total proteins from uninduced cells. Lane 2: Total proteins from induced cells harboring vector pET-30a (control). Lane 3: Total As-PDRG1 recombinant protein. Lane 4: Soluble fraction of the lysate from induced cells harboring pET-30a-PDRG1. Lane 5: insoluble fraction of the lysate from induced cells harboring pET-30a-PDRG1. (C) Purification of recombinant As-PDRG1 protein. M: Protein markers from 10 to 60 kDa. Lane 1: Unpurified, induced As-PDRG1 recombinant protein. Lane 2: Flow-through eluate of total proteins. Lanes 3–8: Column elution with elutant containing 5 mM, 10 mM, 20 mM, 40 mM, 60 mM and 80 mM imidazole, respectively.
Ijms 19 00126 g007
Figure 8. Western blot showing the abundances of As-MDM2, As-P21, As-P53, As-PDRG1 proteins at different developmental stages of A. sinica. The band intensities of these proteins were normalized against that of GAPDH. The expression of these proteins at 0 h was used as the reference; letters (a–d) indicate statistically significant differences (p < 0.05).
Ijms 19 00126 g008
Figure 9. Western blot showing the abundances of As-MDM2, As-P21, As-P53, and As-PDRG1 proteins in response to temperature stress in A. sinica. The band intensities of these proteins were normalized against that of GAPDH. Expressions of the proteins at 25 °C served as the control. Statistically significant differences are indicated with ** p < 0.01, while * represents 0.01 < p < 0.05.
Ijms 19 00126 g009
Figure 10. (A) The relative level of As-pdrg1 mRNA expression in larvae soaked with double-stranded RNAs (dsRNAs) for different times. Pdrg1-RNAi depleted the expression of As-pdrg1 at different developmental stages from 0 to 20 h in A. sinica. A–E represents experimental groups treated with pdrg1-RNAi and A1–E1 represent the control group. (B) Shows the reverse transcription PCR (RT-PCR) results for the corresponding period. Statistically significant differences are indicated with ** p < 0.01.
Ijms 19 00126 g010
Table 1. Predicted phosphorylation sites in As-PFRG1.
NamePositionContext aScore b
Ser5MRFGSSMFK0.500
6RFGSSMFKI0.841
40ILKDSVMVL0.675
45VMVLSQIED0.941
50QIEDSPGMK0.950
59GLNLSPLGS0.802
63SPLGSEERK0.812
70RKAISDLIG0.578
a Sequences surrounding the phosphorylation sites. b Probability of the phosphorylation sites.
Table 2. Oligonucleotide primers used in this study.
PrimerSequence (5′-3′)Direction
As-pdrg1FCTGAAATAGAAGAGGCAGGTForward
As-pdrg1RCTATTTCGGATTTGATTGGTReverse
3′As-pdrg1TGAGCCCATTGGGTAGTGAAGAForward
5′As-pdrg1TGAACAGGAGATAAATTTCATAGReverse
ISH-pdrg1FTGAACAGGAGATAAATTTCATAGCTGForward
ISH-pdrg1RTTGATTGGTGATTAAGGTGTTGAAAReverse
RT-pdrg1FTGGTGAAGACGAATAGGTCCAForward
RT-pdrg1RAAGTGCAGTGCAAGCTAACCReverse
β-actin-FGTGTGACGATGATGTTGCGGForward
β-actin-RGCTGTCCTTTTGACCCATTCCReverse
ORF-pdrg1FTGAACAGGAGATAAATTTCATAGForward
ORF-pdrg1RTTTCAACACCTTAATCACCAATCReverse
Sense siRNAGGAUUUGAUUGGUGAUUAAUUForward
Anti siRNAUUCCUAAACUAACCACUAAUUReverse

