DNA Methylation Levels of the ELMO Gene Promoter CpG Islands in Human Glioblastomas

 ,
,
Abstract
:
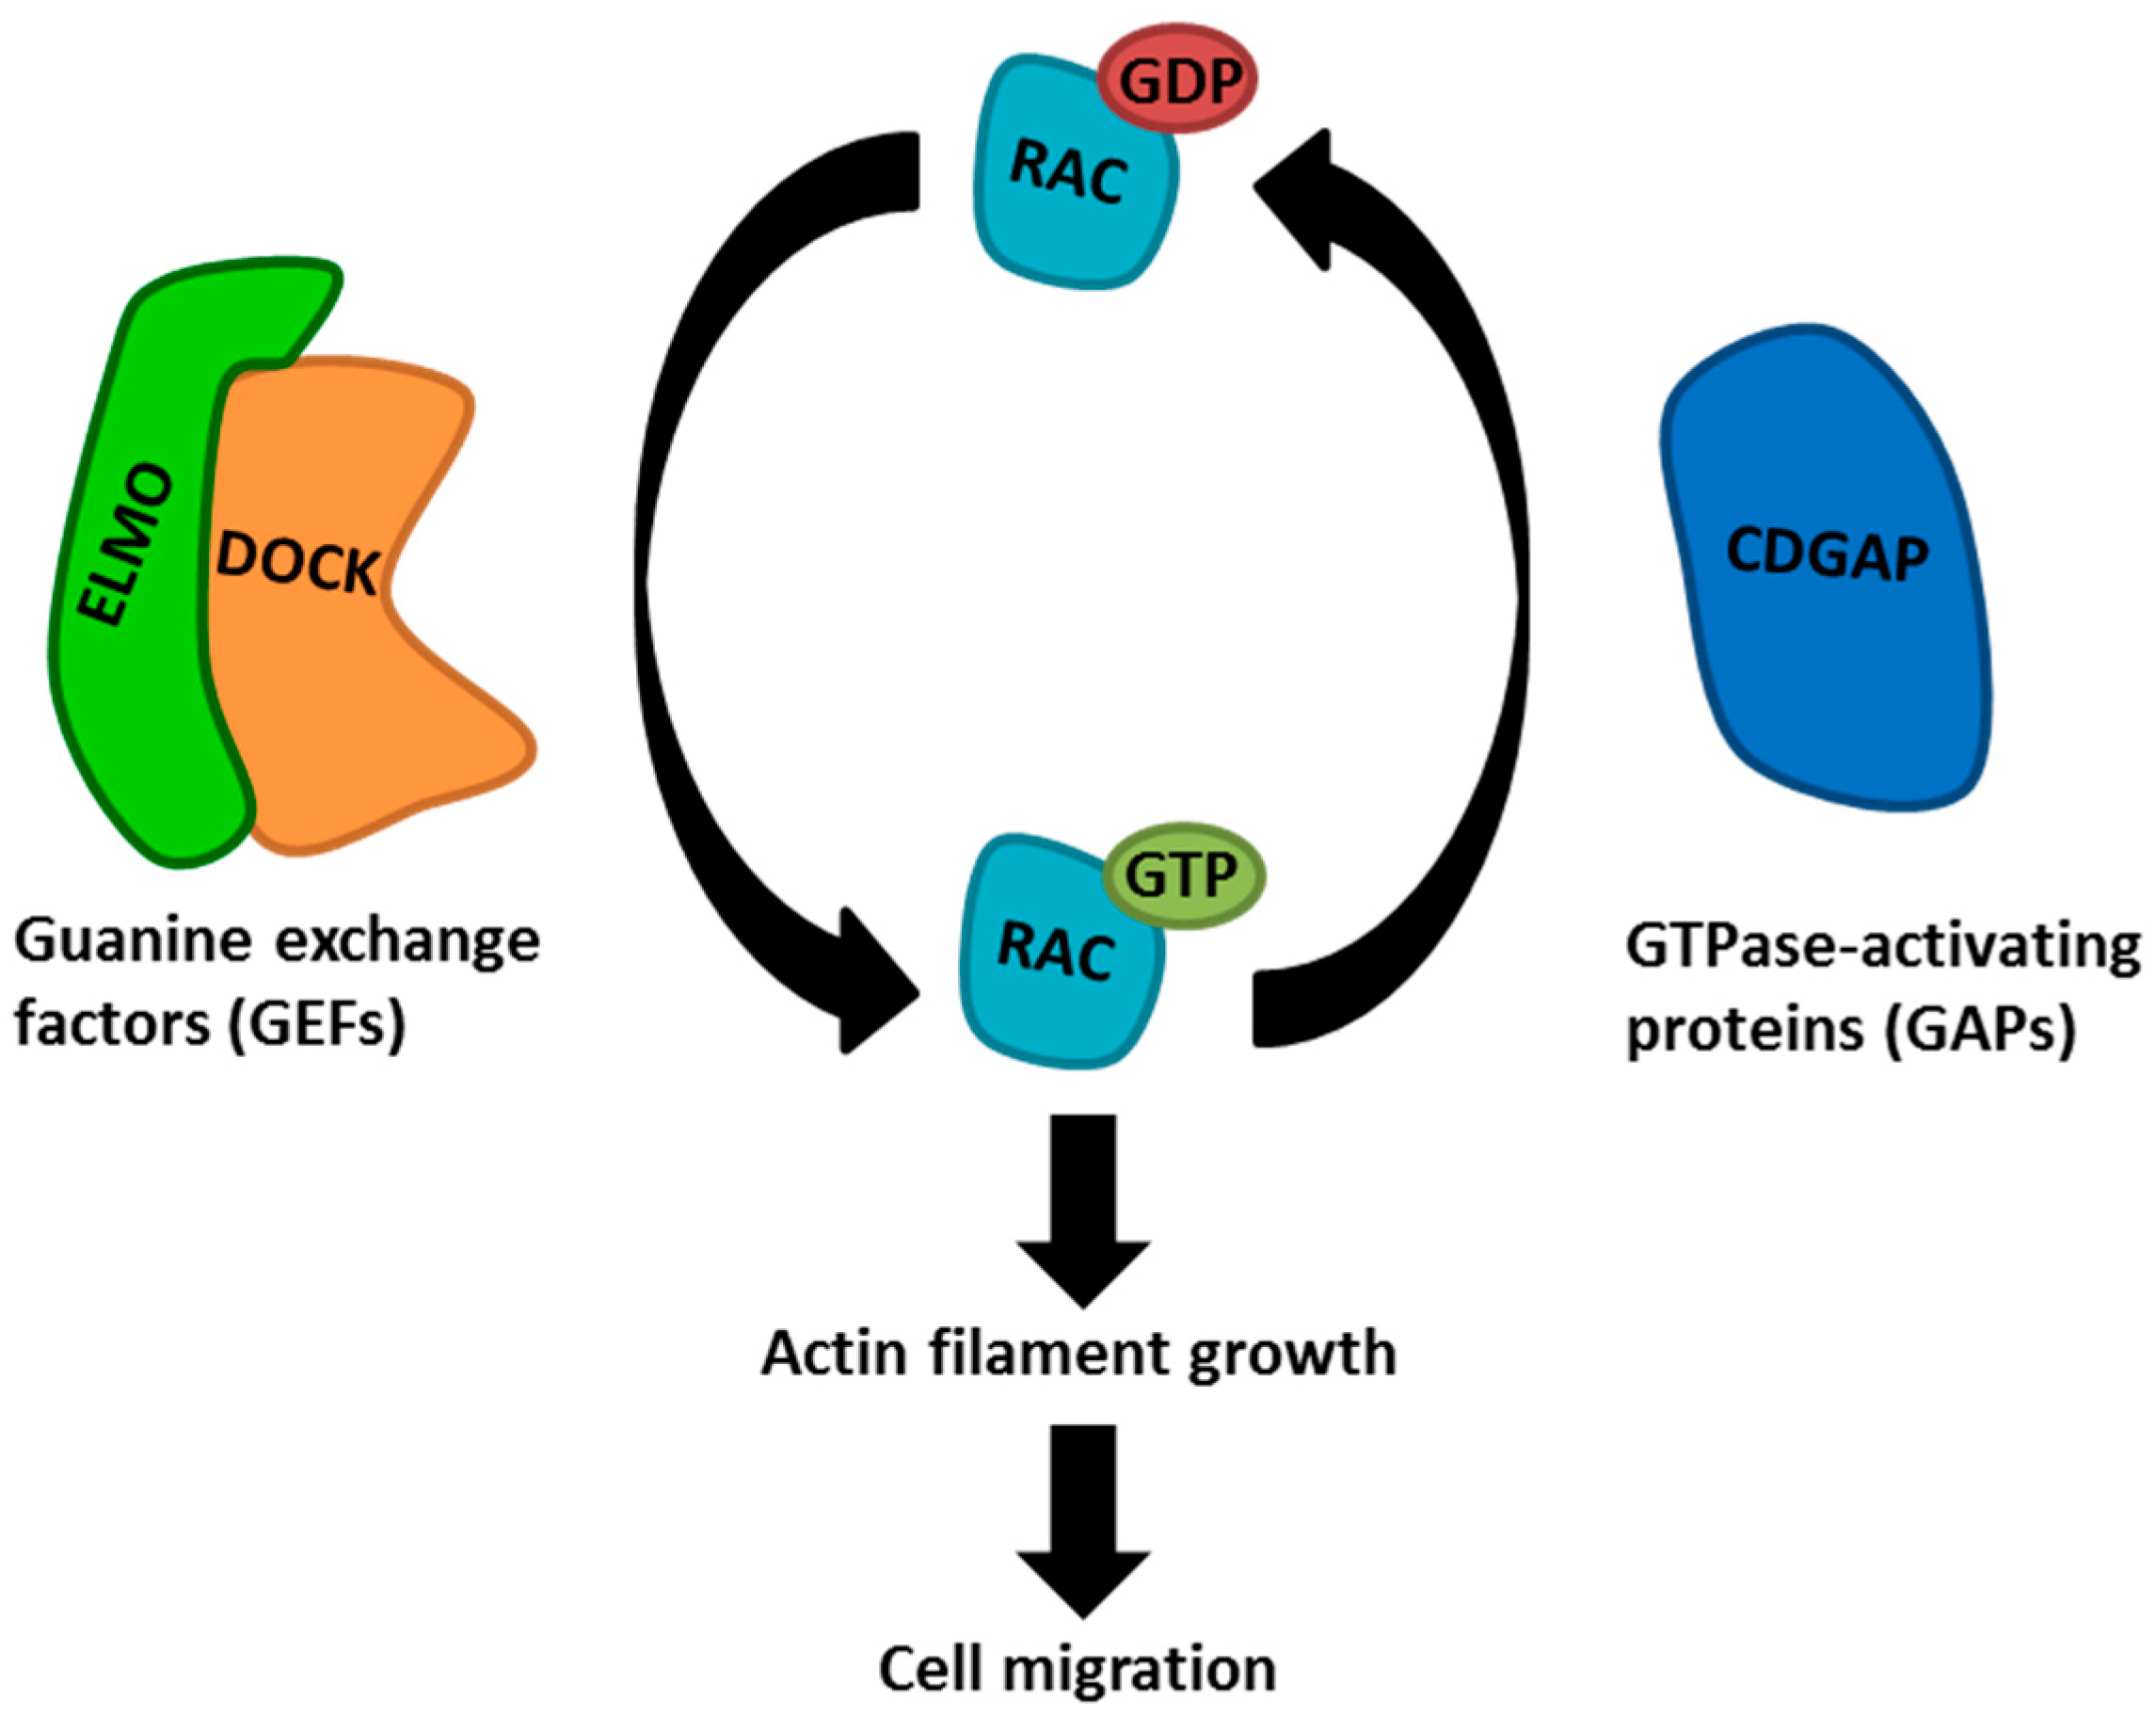
1. Introduction
2. Results
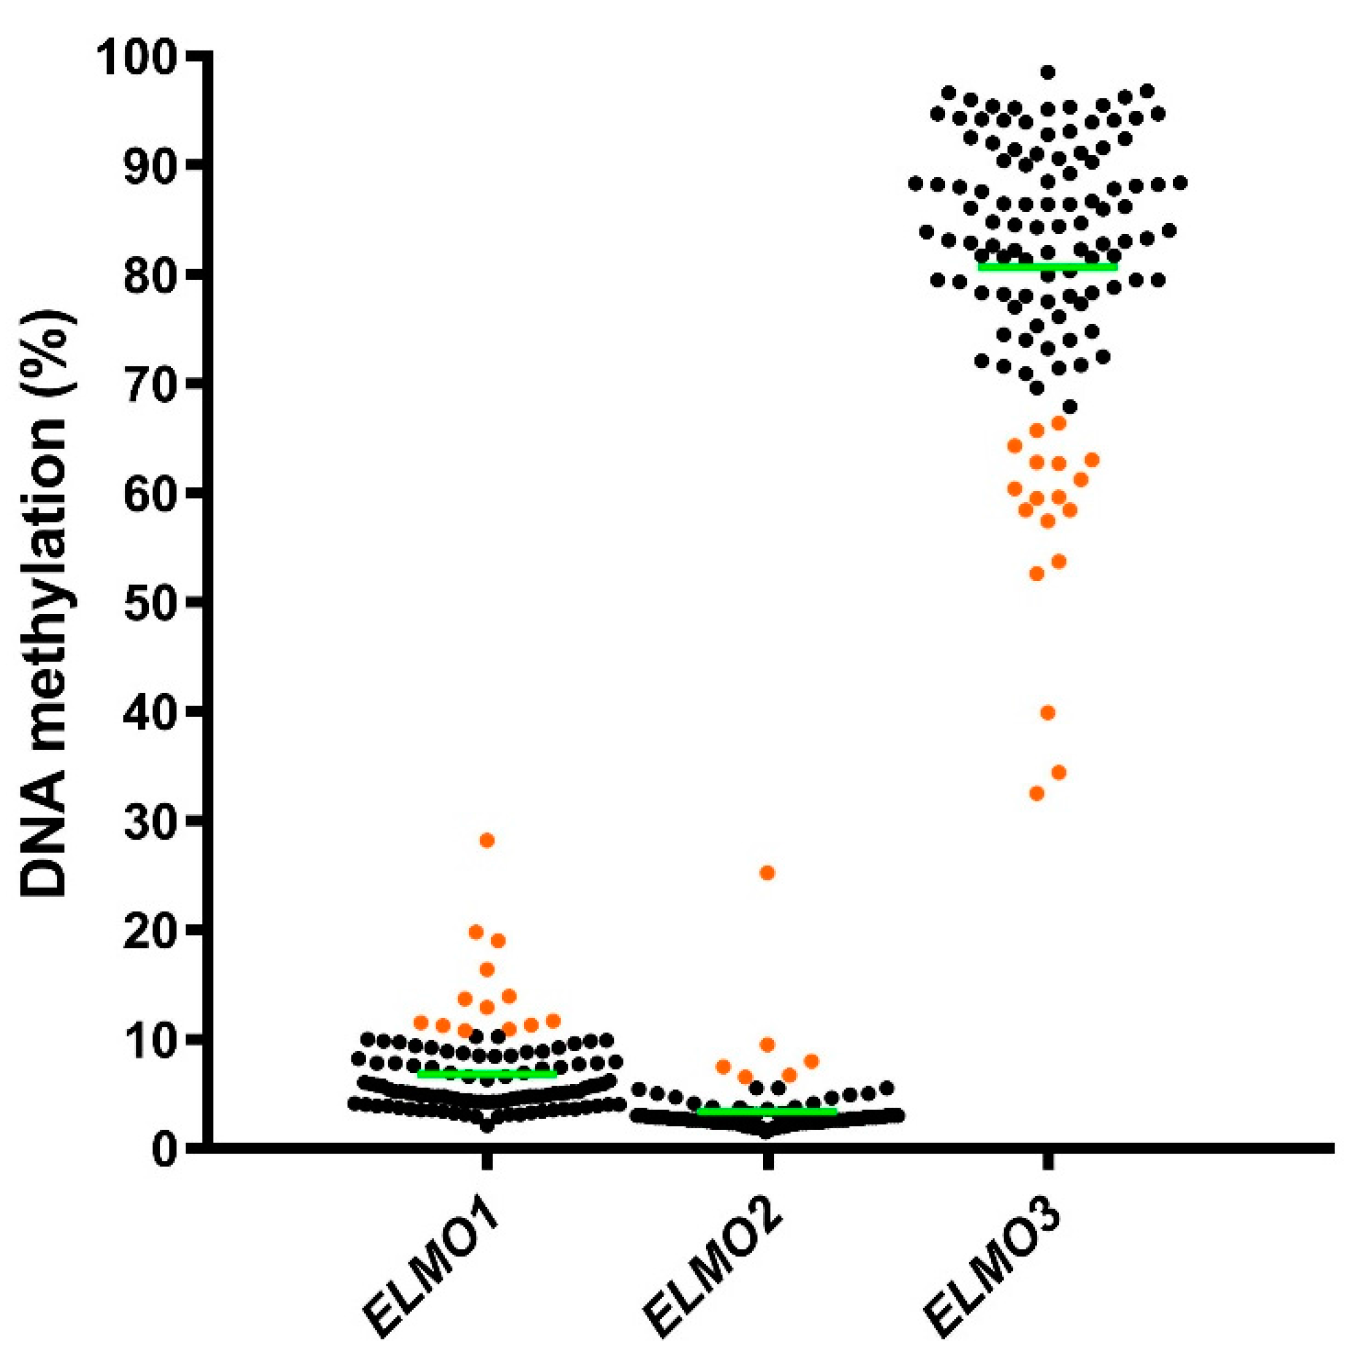
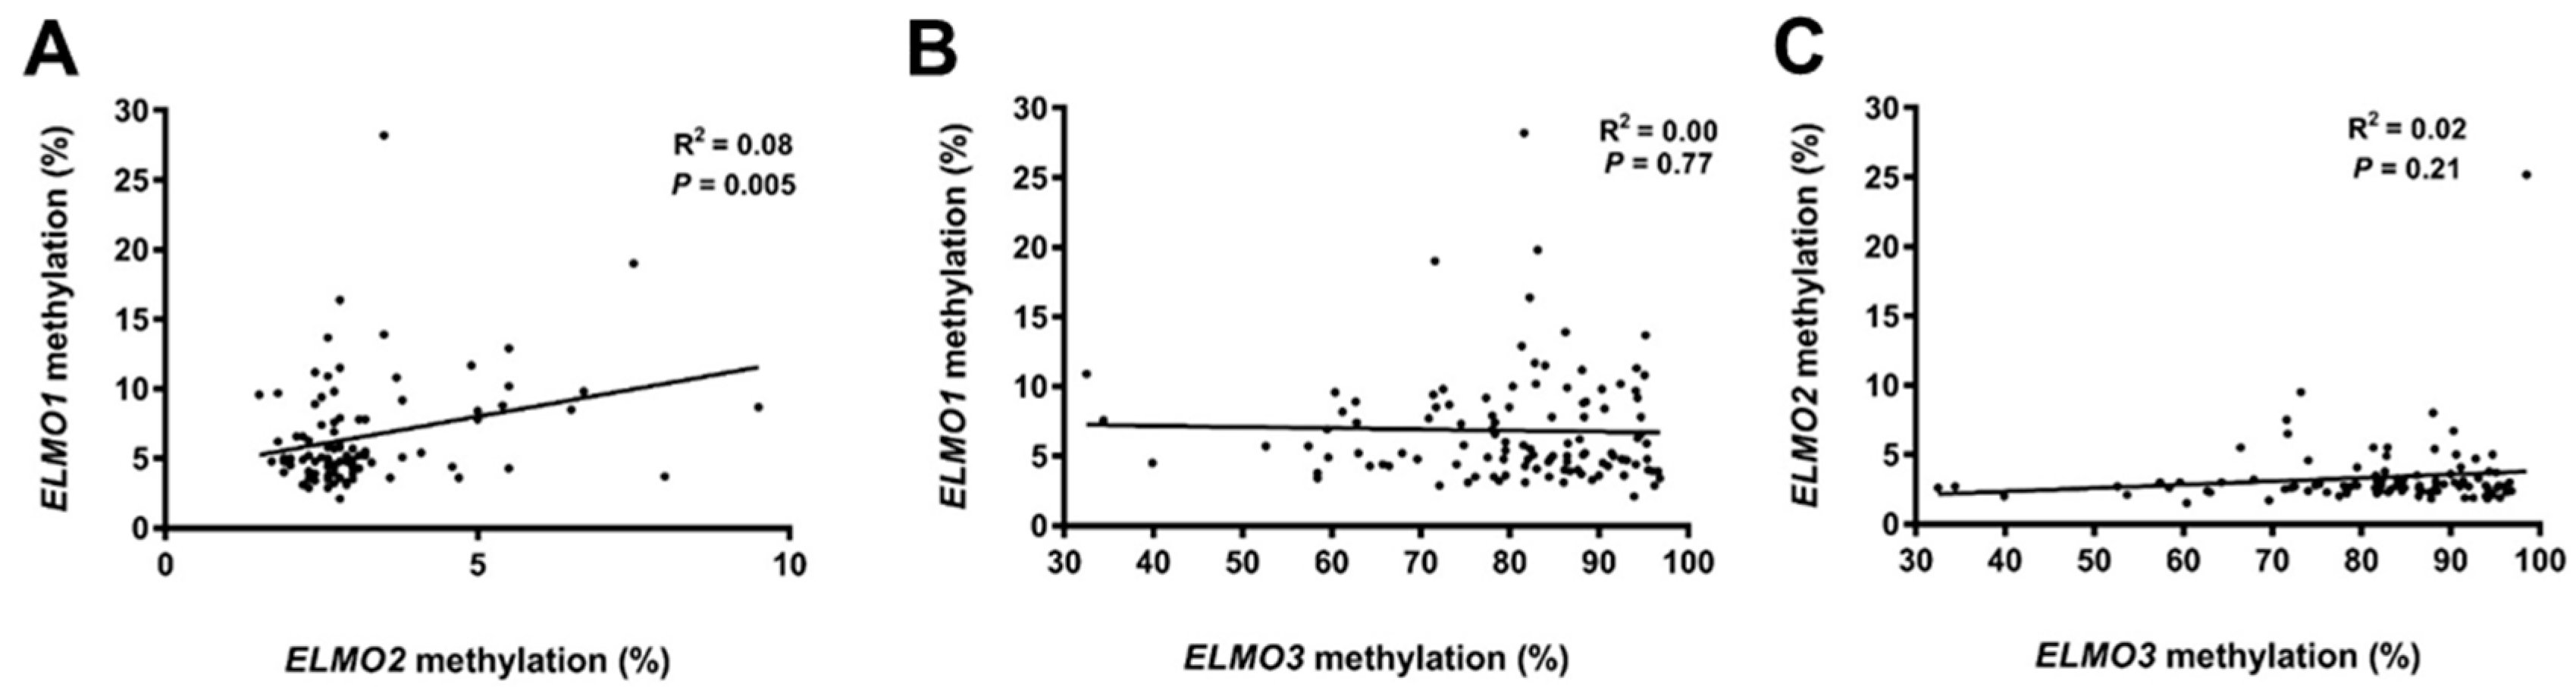
2.1. Methylation Levels of the ELMO Promoter CpG Islands in Glioblastoma
2.2. Methylation Levels of the ELMO Gene Promoters in Normal Tissues
2.3. DNA Methylation Status of the ELMO Promoter CpG Islands According to Patient Characteristics
2.4. Survival Analyses According to DNA Methylation Status of the ELMO Genes
3. Discussion
4. Materials and Methods
4.1. Patient Samples
4.2. Ethics Statement
4.3. DNA Purification and Sodium Bisulfite Treatment
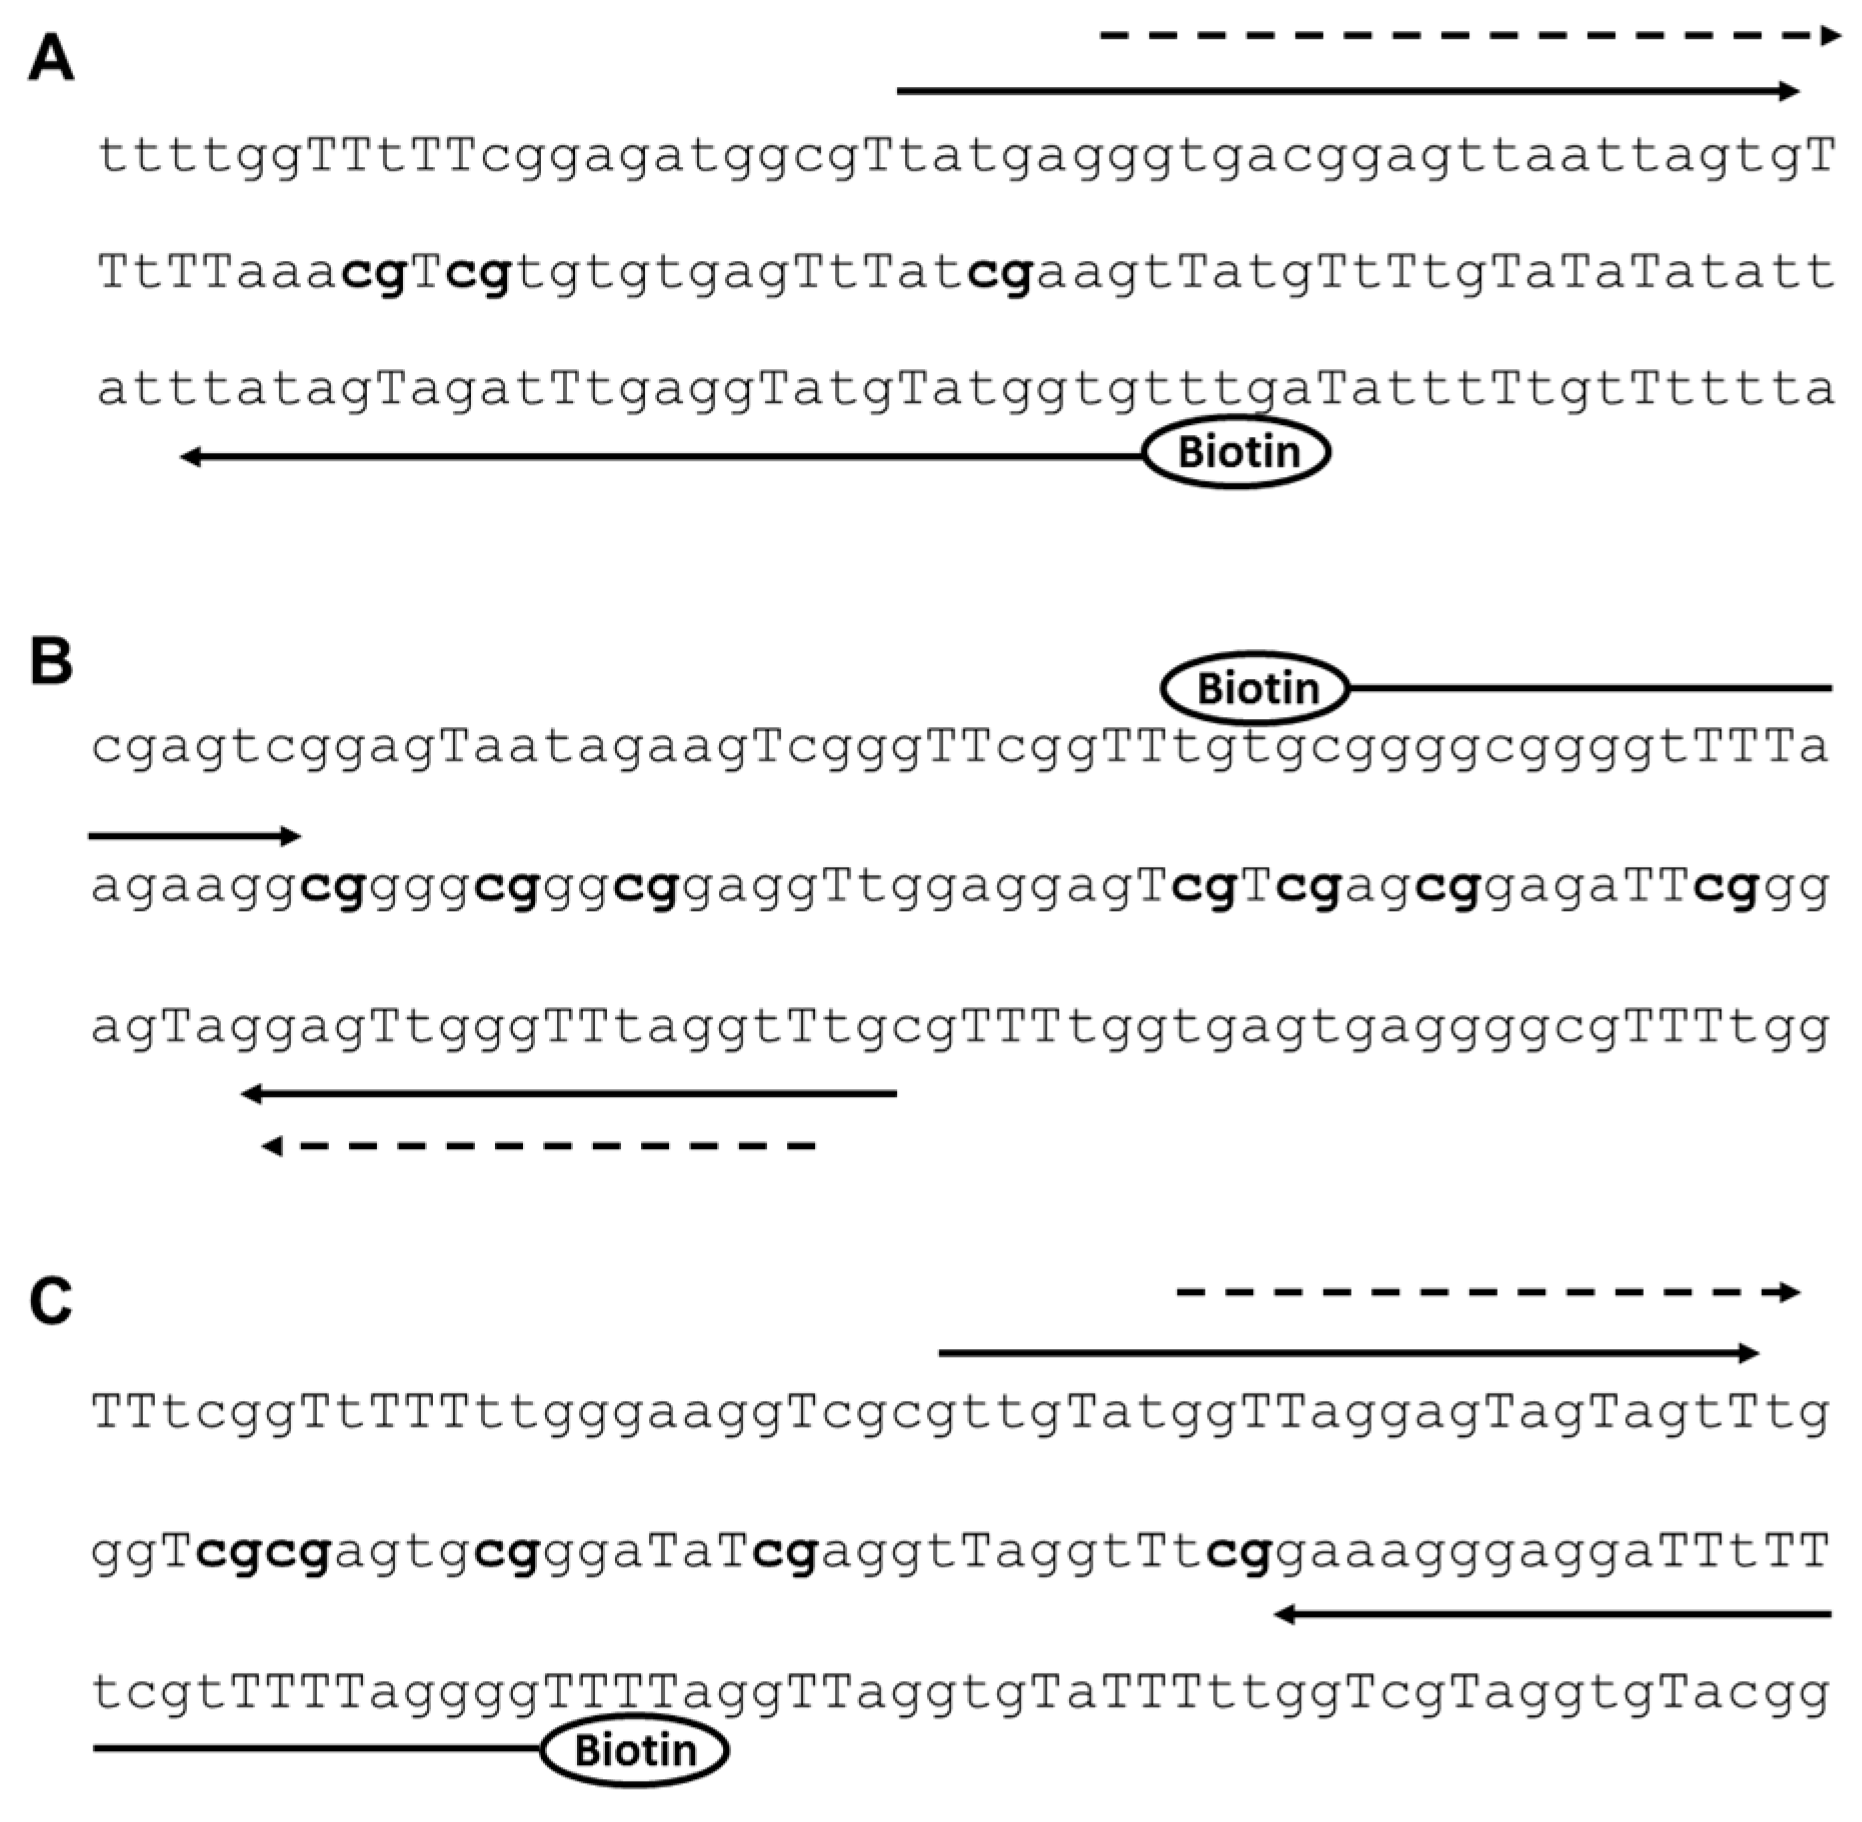
4.4. DNA Methylation Analyses Using Pyrosequencing
4.5. Data Availability
4.6. Statistical Analyses
Supplementary Materials
Acknowledgments
Author Contributions
Conflicts of Interest
References
- Wen, P.Y.; Kesari, S. Malignant gliomas in adults. N. Engl. J. Med. 2008, 359, 492–507. [Google Scholar] [CrossRef] [PubMed]
- Hegi, M.E.; Diserens, A.C.; Gorlia, T.; Hamou, M.F.; de Tribolet, N.; Weller, M.; Kros, J.M.; Hainfellner, J.A.; Mason, W.; Mariani, L.; et al. MGMT gene silencing and benefit from temozolomide in glioblastoma. N. Engl. J. Med. 2005, 352, 997–1003. [Google Scholar] [CrossRef] [PubMed]
- Stupp, R.; Mason, W.P.; van den Bent, M.J.; Weller, M.; Fisher, B.; Taphoorn, M.J.; Belanger, K.; Brandes, A.A.; Marosi, C.; Bogdahn, U.; et al. Radiotherapy plus concomitant and adjuvant temozolomide for glioblastoma. N. Engl. J. Med. 2005, 352, 987–996. [Google Scholar] [CrossRef] [PubMed]
- Giese, A.; Bjerkvig, R.; Berens, M.E.; Westphal, M. Cost of migration: Invasion of malignant gliomas and implications for treatment. J. Clin. Oncol. 2003, 21, 1624–1636. [Google Scholar] [CrossRef] [PubMed]
- Guthrie, B.L.; Laws, E.R., Jr. Supratentorial low-grade gliomas. Neurosurg. Clin. N. Am. 1990, 1, 37–48. [Google Scholar] [PubMed]
- Jarzynka, M.J.; Hu, B.; Hui, K.M.; Bar-Joseph, I.; Gu, W.; Hirose, T.; Haney, L.B.; Ravichandran, K.S.; Nishikawa, R.; Cheng, S.Y. ELMO1 and Dock180, a bipartite Rac1 guanine nucleotide exchange factor, promote human glioma cell invasion. Cancer Res. 2007, 67, 7203–7211. [Google Scholar] [CrossRef] [PubMed]
- Kristensen, L.S.; Soes, S.; Hansen, L.L. ELMO3: A direct driver of cancer metastasis? Cell Cycle 2014, 13, 2483–2484. [Google Scholar] [CrossRef] [PubMed]
- Soes, S.; Daugaard, I.L.; Sorensen, B.S.; Carus, A.; Mattheisen, M.; Alsner, J.; Overgaard, J.; Hager, H.; Hansen, L.L.; Kristensen, L.S. Hypomethylation and increased expression of the putative oncogene ELMO3 are associated with lung cancer development and metastases formation. Oncoscience 2014, 1, 367–374. [Google Scholar] [CrossRef] [PubMed]
- Li, H.; Yang, L.; Fu, H.; Yan, J.; Wang, Y.; Guo, H.; Hao, X.; Xu, X.; Jin, T.; Zhang, N. Association between Galphai2 and ELMO1/Dock180 connects chemokine signalling with Rac activation and metastasis. Nat. Commun. 2013, 4, 1706. [Google Scholar] [CrossRef] [PubMed]
- Abu-Thuraia, A.; Gauthier, R.; Chidiac, R.; Fukui, Y.; Screaton, R.A.; Gratton, J.P.; Cote, J.F. Axl phosphorylates Elmo scaffold proteins to promote Rac activation and cell invasion. Mol. Cell. Biol. 2015, 35, 76–87. [Google Scholar] [CrossRef] [PubMed]
- Peng, H.Y.; Yu, Q.F.; Shen, W.; Guo, C.M.; Li, Z.; Zhou, X.Y.; Zhou, N.J.; Min, W.P.; Gao, D. Knockdown of ELMO3 Suppresses Growth, Invasion and Metastasis of Colorectal Cancer. Int. J. Mol. Sci. 2016, 17. [Google Scholar] [CrossRef] [PubMed]
- Gumienny, T.L.; Brugnera, E.; Tosello-Trampont, A.C.; Kinchen, J.M.; Haney, L.B.; Nishiwaki, K.; Walk, S.F.; Nemergut, M.E.; Macara, I.G.; Francis, R.; et al. CED-12/ELMO, a novel member of the CrkII/Dock180/Rac pathway, is required for phagocytosis and cell migration. Cell 2001, 107, 27–41. [Google Scholar] [CrossRef]
- Coskun, M.; Boyd, M.; Olsen, J.; Troelsen, J.T. Control of intestinal promoter activity of the cellular migratory regulator gene ELMO3 by CDX2 and SP1. J. Cell. Biochem. 2010, 109, 1118–1128. [Google Scholar] [CrossRef] [PubMed]
- Ho, E.; Irvine, T.; Vilk, G.J.; Lajoie, G.; Ravichandran, K.S.; D’Souza, S.J.; Dagnino, L. Integrin-linked kinase interactions with ELMO2 modulate cell polarity. Mol. Biol. Cell 2009, 20, 3033–3043. [Google Scholar] [CrossRef] [PubMed]
- Hernandez-Vasquez, M.N.; Adame-Garcia, S.R.; Hamoud, N.; Chidiac, R.; Reyes-Cruz, G.; Gratton, J.P.; Cote, J.F.; Vazquez-Prado, J. Cell adhesion controlled by adhesion G protein-coupled receptor GPR124/ADGRA2 is mediated by a protein complex comprising intersectins and Elmo-Dock. J. Biol. Chem. 2017, 292, 12178–12191. [Google Scholar] [CrossRef] [PubMed]
- He, Y.; Northey, J.J.; Pelletier, A.; Kos, Z.; Meunier, L.; Haibe-Kains, B.; Mes-Masson, A.M.; Cote, J.F.; Siegel, P.M.; Lamarche-Vane, N. The Cdc42/Rac1 regulator CdGAP is a novel E-cadherin transcriptional co-repressor with Zeb2 in breast cancer. Oncogene 2017, 36, 3490–3503. [Google Scholar] [CrossRef] [PubMed]
- Laurin, M.; Cote, J.F. Insights into the biological functions of Dock family guanine nucleotide exchange factors. Genes Dev. 2014, 28, 533–547. [Google Scholar] [CrossRef] [PubMed]
- Kwiatkowska, A.; Didier, S.; Fortin, S.; Chuang, Y.; White, T.; Berens, M.E.; Rushing, E.; Eschbacher, J.; Tran, N.L.; Chan, A.; et al. The small GTPase RhoG mediates glioblastoma cell invasion. Mol. Cancer 2012, 11, 65. [Google Scholar] [CrossRef] [PubMed] [Green Version]
- Laurin, M.; Huber, J.; Pelletier, A.; Houalla, T.; Park, M.; Fukui, Y.; Haibe-Kains, B.; Muller, W.J.; Cote, J.F. Rac-specific guanine nucleotide exchange factor DOCK1 is a critical regulator of HER2-mediated breast cancer metastasis. Proc. Natl. Acad. Sci. USA 2013, 110, 7434–7439. [Google Scholar] [CrossRef] [PubMed]
- Misek, S.A.; Chen, J.; Schroeder, L.; Rattanasinchai, C.; Sample, A.; Sarkaria, J.N.; Gallo, K.A. EGFR Signals through a DOCK180-MLK3 Axis to Drive Glioblastoma Cell Invasion. Mol. Cancer Res. 2017, 15, 1085–1095. [Google Scholar] [CrossRef] [PubMed]
- Zhang, B.; Shi, L.; Lu, S.; Sun, X.; Liu, Y.; Li, H.; Wang, X.; Zhao, C.; Zhang, H.; Wang, Y. Autocrine IL-8 promotes F-actin polymerization and mediate mesenchymal transition via ELMO1-NF-κB-Snail signaling in glioma. Cancer Biol. Ther. 2015, 16, 898–911. [Google Scholar] [CrossRef] [PubMed]
- Jones, P.A. DNA methylation and cancer. Oncogene 2002, 21, 5358–5360. [Google Scholar] [CrossRef] [PubMed]
- Jones, P.A.; Issa, J.P.; Baylin, S. Targeting the cancer epigenome for therapy. Nat. Rev. Genet. 2016, 17, 630–641. [Google Scholar] [CrossRef] [PubMed]
- Dobrovic, A.; Kristensen, L.S. DNA methylation, epimutations and cancer predisposition. Int. J. Biochem. Cell Biol. 2009, 41, 34–39. [Google Scholar] [CrossRef] [PubMed]
- Pirini, F.; Noazin, S.; Jahuira-Arias, M.H.; Rodriguez-Torres, S.; Friess, L.; Michailidi, C.; Cok, J.; Combe, J.; Vargas, G.; Prado, W.; et al. Early detection of gastric cancer using global, genome-wide and IRF4, ELMO1, CLIP4 and MSC DNA methylation in endoscopic biopsies. Oncotarget 2017, 8, 38501–38516. [Google Scholar] [CrossRef] [PubMed]
- Mikeska, T.; Bock, C.; Do, H.; Dobrovic, A. DNA methylation biomarkers in cancer: Progress towards clinical implementation. Expert Rev. Mol. Diagn. 2012, 12, 473–487. [Google Scholar] [CrossRef] [PubMed]
- How Kit, A.; Nielsen, H.M.; Tost, J. DNA methylation based biomarkers: Practical considerations and applications. Biochimie 2012, 94, 2314–2337. [Google Scholar] [CrossRef] [PubMed]
- Verhaak, R.G.; Hoadley, K.A.; Purdom, E.; Wang, V.; Qi, Y.; Wilkerson, M.D.; Miller, C.R.; Ding, L.; Golub, T.; Mesirov, J.P.; et al. Integrated genomic analysis identifies clinically relevant subtypes of glioblastoma characterized by abnormalities in PDGFRA, IDH1, EGFR, and NF1. Cancer Cell 2010, 17, 98–110. [Google Scholar] [CrossRef] [PubMed]
- Phillips, H.S.; Kharbanda, S.; Chen, R.; Forrest, W.F.; Soriano, R.H.; Wu, T.D.; Misra, A.; Nigro, J.M.; Colman, H.; Soroceanu, L.; et al. Molecular subclasses of high-grade glioma predict prognosis, delineate a pattern of disease progression, and resemble stages in neurogenesis. Cancer Cell 2006, 9, 157–173. [Google Scholar] [CrossRef] [PubMed]
- Noushmehr, H.; Weisenberger, D.J.; Diefes, K.; Phillips, H.S.; Pujara, K.; Berman, B.P.; Pan, F.; Pelloski, C.E.; Sulman, E.P.; Bhat, K.P.; et al. Identification of a CpG island methylator phenotype that defines a distinct subgroup of glioma. Cancer Cell 2010, 17, 510–522. [Google Scholar] [CrossRef] [PubMed]
- Sturm, D.; Witt, H.; Hovestadt, V.; Khuong-Quang, D.A.; Jones, D.T.; Konermann, C.; Pfaff, E.; Tonjes, M.; Sill, M.; Bender, S.; et al. Hotspot mutations in H3F3A and IDH1 define distinct epigenetic and biological subgroups of glioblastoma. Cancer Cell 2012, 22, 425–437. [Google Scholar] [CrossRef] [PubMed]
- Turcan, S.; Rohle, D.; Goenka, A.; Walsh, L.A.; Fang, F.; Yilmaz, E.; Campos, C.; Fabius, A.W.; Lu, C.; Ward, P.S.; et al. IDH1 mutation is sufficient to establish the glioma hypermethylator phenotype. Nature 2012, 483, 479–483. [Google Scholar] [CrossRef] [PubMed]
- Kristensen, L.S.; Michaelsen, S.R.; Dyrbye, H.; Aslan, D.; Grunnet, K.; Christensen, I.J.; Poulsen, H.S.; Gronbaek, K.; Broholm, H. Assessment of Quantitative and Allelic MGMT Methylation Patterns as a Prognostic Marker in Glioblastoma. J. Neuropathol. Exp. Neurol. 2016, 75, 246–255. [Google Scholar] [CrossRef] [PubMed]
- Yagi, K.; Akagi, K.; Hayashi, H.; Nagae, G.; Tsuji, S.; Isagawa, T.; Midorikawa, Y.; Nishimura, Y.; Sakamoto, H.; Seto, Y.; et al. Three DNA methylation epigenotypes in human colorectal cancer. Clin. Cancer Res. 2010, 16, 21–33. [Google Scholar] [CrossRef] [PubMed]
- Slieker, R.C.; Bos, S.D.; Goeman, J.J.; Bovee, J.V.; Talens, R.P.; van der Breggen, R.; Suchiman, H.E.; Lameijer, E.W.; Putter, H.; van den Akker, E.B.; et al. Identification and systematic annotation of tissue-specific differentially methylated regions using the Illumina 450k array. Epigenet. Chromatin 2013, 6, 26. [Google Scholar] [CrossRef] [PubMed]
- Lokk, K.; Modhukur, V.; Rajashekar, B.; Martens, K.; Magi, R.; Kolde, R.; Koltsina, M.; Nilsson, T.K.; Vilo, J.; Salumets, A.; et al. DNA methylome profiling of human tissues identifies global and tissue-specific methylation patterns. Genome Biol. 2014, 15, r54. [Google Scholar] [CrossRef] [PubMed]
- Berchtold, N.C.; Cribbs, D.H.; Coleman, P.D.; Rogers, J.; Head, E.; Kim, R.; Beach, T.; Miller, C.; Troncoso, J.; Trojanowski, J.Q.; et al. Gene expression changes in the course of normal brain aging are sexually dimorphic. Proc. Natl. Acad. Sci. USA 2008, 105, 15605–15610. [Google Scholar] [CrossRef] [PubMed]
- Everhard, S.; Tost, J.; El Abdalaoui, H.; Criniere, E.; Busato, F.; Marie, Y.; Gut, I.G.; Sanson, M.; Mokhtari, K.; Laigle-Donadey, F.; et al. Identification of regions correlating MGMT promoter methylation and gene expression in glioblastomas. Neuro-Oncology 2009, 11, 348–356. [Google Scholar] [CrossRef] [PubMed]
- Lim, A.M.; Candiloro, I.L.; Wong, N.; Collins, M.; Do, H.; Takano, E.A.; Angel, C.; Young, R.J.; Corry, J.; Wiesenfeld, D.; et al. Quantitative methodology is critical for assessing DNA methylation and impacts on correlation with patient outcome. Clin. Epigenet. 2014, 6, 22. [Google Scholar] [CrossRef] [PubMed]
- Wedge, E.; Hansen, J.W.; Garde, C.; Asmar, F.; Tholstrup, D.; Kristensen, S.S.; Munch-Petersen, H.D.; Ralfkiaer, E.; Brown, P.; Gronbaek, K.; et al. Global hypomethylation is an independent prognostic factor in diffuse large B cell lymphoma. Am. J. Hematol. 2017, 92, 689–694. [Google Scholar] [CrossRef] [PubMed]
- Tost, J.; Gut, I.G. DNA methylation analysis by pyrosequencing. Nat. Protoc. 2007, 2, 2265–2275. [Google Scholar] [CrossRef] [PubMed]
- Fan, W.; Yang, H.; Xue, H.; Sun, Y.; Zhang, J. ELMO3 is a novel biomarker for diagnosis and prognosis of non-small cell lung cancer. Int. J. Clin. Exp. Pathol. 2015, 8, 5503–5508. [Google Scholar] [PubMed]
- Kadletz, L.; Heiduschka, G.; Wiebringhaus, R.; Gurnhofer, E.; Kotowski, U.; Haymerle, G.; Brunner, M.; Barry, C.; Kenner, L. ELMO3 expression indicates a poor prognosis in head and neck squamous cell carcinoma—A short report. Cell. Oncol. 2017, 40, 193–198. [Google Scholar] [CrossRef] [PubMed]
- Haymerle, G.; Kadletz, L.; Wiebringhaus, R.; Golabi, B.; Mildner, M.; Thurnher, D.; Heiduschka, G. ELMO3 predicts poor outcome in T1 laryngeal cancer. Clin. Otolaryngol. 2017. [Google Scholar] [CrossRef] [PubMed]
- Michaelsen, S.R.; Christensen, I.J.; Grunnet, K.; Stockhausen, M.T.; Broholm, H.; Kosteljanetz, M.; Poulsen, H.S. Clinical variables serve as prognostic factors in a model for survival from glioblastoma multiforme: An observational study of a cohort of consecutive non-selected patients from a single institution. BMC Cancer 2013, 13, 402. [Google Scholar] [CrossRef] [PubMed]
- Mikeska, T.; Felsberg, J.; Hewitt, C.A.; Dobrovic, A. Analysing DNA methylation using bisulphite pyrosequencing. Methods Mol. Biol. 2011, 791, 33–53. [Google Scholar] [CrossRef] [PubMed]
- Kristensen, L.S.; Hansen, J.W.; Kristensen, S.S.; Tholstrup, D.; Harslof, L.B.; Pedersen, O.B.; De Nully Brown, P.; Gronbaek, K. Aberrant methylation of cell-free circulating DNA in plasma predicts poor outcome in diffuse large B cell lymphoma. Clin. Epigenet. 2016, 8, 95. [Google Scholar] [CrossRef] [PubMed]
- Kristensen, L.S.; Treppendahl, M.B.; Gronbaek, K. Analysis of epigenetic modifications of DNA in human cells. Curr. Protoc. Human Genet. 2013. [Google Scholar] [CrossRef]


| Clinical Variable | All (n = 121) | ELMO1 Hypermet (n = 13) | ELMO1 Normal Met (n = 99) | p-Value | ELMO2 Hypermet (n = 6) | ELMO2 Normal Met (n = 97) | p-Value | ELMO3 Hypomet (n = 18) | ELMO3 Normal Met (n = 101) | p-Value |
|---|---|---|---|---|---|---|---|---|---|---|
| Age (years), median (range) | 59.0 (23–74) | 58.0 (40–67) | 59.0 (23–74) | 0.898 | 56.0 (46–71) | 60 (23–74) | 0.728 | 60.0 (23–74) | 58.0 (31–72) | 0.602 |
| Gender, n (%) | ||||||||||
| Female | 39 (32.2) | 4 (30.8) | 34 (34.3) | 1.000 | 3 (50.0) | 31 (32.0) | 0.394 | 8 (44.4) | 30 (29.7) | 0.273 |
| Male | 82 (67.8) | 9 (69.2) | 65 (65.7) | 3 (50.0) | 66 (68.0) | 10 (55.6) | 71 (70.3) | |||
| WHO performance status, n (%) | ||||||||||
| 0 | 69 (57.0) | 8 (61.5) | 58 (61.7) | 1.000 | 4 (66.7) | 57 (62.0) | 1.000 | 9 (52.9) | 59 (61.5) | 0.594 |
| 1–2 | 46 (38.1) | 5 (38.5) | 36 (38.3) | 2 (33.3) | 35 (38.0) | 8 (47.1) | 37 (38.5) | |||
| Missing | 6 (4.9) | 0 | 5 | 0 | 5 | 1 | 5 | |||
| Diagnosis, n (%) | ||||||||||
| Primary Glioblastoma | 116 (95.9) | 13 (100.0) | 94 (94.9) | 1.000 | 6 (100.0) | 92 (94.8) | 1.000 | 18 (100.0) | 96 (95.0) | 1.000 |
| Secondary Glioblastoma | 5 (4.1) | 0 (0.0) | 5 (5.1) | 0 (0.0) | 5 (5.2) | 0 | 5 (5.0) | |||
| Corticosteroid use, n (%) | ||||||||||
| Yes | 86 (71.1) | 10 (76.9) | 71 (72.4) | 1.000 | 5 (100.0) | 66 (68.8) | 0.318 | 12 (66.7) | 73 (73.7) | 0.570 |
| No | 33 (27.3) | 3 (23.1) | 27 (27.6) | 0 (0.0) | 30 (31.3) | 6 (33.3) | 26 (26.3) | |||
| Missing | 2 (1.7) | 0 | 1 | 1 | 1 | 0 | 2 | |||
| Multifocal Disease, n (%) | ||||||||||
| Yes | 8 (6.6) | 0 (0.0) | 7 (7.1) | 1.000 | 1 (16.7) | 7 (7.2) | 0.392 | 2 (11.1) | 5 (5.0) | 0.286 |
| No | 113 (93.4) | 13 (100.0) | 92 (92.9) | 5 (83.3) | 90 (92.8) | 16 (88.9) | 96 (95.0) | |||
| Tumor brain location, n (%) | ||||||||||
| Frontal | 26 (21.5) | 1 (7.7) | 23 (23.2) | 0.292 | 3 (50.0) | 22 (22.7) | 0.152 | 5 (27.8) | 19 (18.8) | 0.358 |
| Other | 95 (78.5) | 12 (92.3) | 76 (76.8) | 3 (50.0) | 75 (77.3) | 13 (72.2) | 82 (81.2) | |||
| Site of relapse tumor, n (%) | ||||||||||
| Local in primary site | 70 (57.9) | 8 (80.0) | 58 (84.1) | 0.666 | 4 (100.0) | 54 (83.1) | 1.000 | 13 (86.7) | 57 (85.1) | 1.000 |
| Distant from primary site | 13 (10.7) | 2 (20.0) | 11 (15.9) | 0 (0.0) | 11 (16.9) | 2 (13.3) | 10 (14.9) | |||
| Missing | 38 (31.4) | 3 | 30 | 2 | 32 | 3 | 34 | |||
| MGMT promoter methylation, n (%) | ||||||||||
| Yes | 38 (31.4) | 1 (8.3) | 35 (38.5) | 0.053 | 2 (40.0) | 31 (34.8) | 1.000 | 2 (14.3) | 34 (35.8) | 0.137 |
| No | 73 (60.3) | 11 (91.7) | 56 (61.5) | 3 (60.0) | 58 (65.2) | 12 (85.7) | 61 (64.2) | |||
| Missing | 10 (8.3) | 1 | 8 | 1 | 8 | 4 | 6 |
| Clinical Endpoint | All (n = 121) | ELMO1 Hypermet (n = 13) | ELMO1 Normal Met (n = 99) | HR (95% CI) p-Value | ELMO2 Hypermet (n = 6) | ELMO2 Normal Met (n = 97) | HR (95% CI) p-Value | ELMO3 Hypomet (n = 18) | ELMO3 Normal Met (n = 101) | HR (95% CI) p-Value |
|---|---|---|---|---|---|---|---|---|---|---|
| OS (mo), median (range) | 14.0 (1–131) | 14.0 (4–31) | 14.0 (1–131) | 1.12 (0.62–2.01) p = 0.71 | 10.0 (1–27) | 14.0 (1–131) | 1.32 (0.57–3.03) p = 0.530 | 12.0 (7–43) | 14.0 (1–131) | 1.16 (0.70–1.92) p = 0.567 |
| PFS (mo), median (range) | 6.0 (0–131) | 7 (2–21) | 7 (0–131) | 1.03 (0.58–1.85) p = 0.91 | 9.0 (1–16) | 6.0 (0–131) | 1.15 (0.50–2.64) p = 0.75 | 4.0 (3–30) | 7.0 (0–131) | 1.48 (0.89–2.47) p = 0.129 |
| Gene Name | Primers (5′→3′) | Amplicon Size (bp) |
|---|---|---|
| ELMO1 | Forward primer: TATGAGGGTGAAGGAGTTAATTAGTG Reverse primer: Biotin-CACCATACATACCTCAAATCTACTATAA Sequencing primer: AGGGTGAAGGAGTTAATTAGT | 107 |
| ELMO2 | Forward primer: biotin-GGGGAGGGGTTTTAAGAAGG Reverse primer: CAAACCTAAACCCAACTCC Sequencing primer: AACCTAAACCCAACTC | 87 |
| ELMO3 | Forward primer: GTTGTATGGTTAGGAGTAGTAGTT Reverse primer: Biotin-CCCCTAAAAACCAAAAAATCCTCCCTTTC Sequencing primer: GGTTAGGAGTAGTAGTTT | 89 |
© 2018 by the authors. Licensee MDPI, Basel, Switzerland. This article is an open access article distributed under the terms and conditions of the Creative Commons Attribution (CC BY) license (http://creativecommons.org/licenses/by/4.0/).
Share and Cite
Michaelsen, S.R.; Aslan, D.; Urup, T.; Poulsen, H.S.; Grønbæk, K.; Broholm, H.; Kristensen, L.S. DNA Methylation Levels of the ELMO Gene Promoter CpG Islands in Human Glioblastomas. Int. J. Mol. Sci. 2018, 19, 679. https://doi.org/10.3390/ijms19030679
Michaelsen SR, Aslan D, Urup T, Poulsen HS, Grønbæk K, Broholm H, Kristensen LS. DNA Methylation Levels of the ELMO Gene Promoter CpG Islands in Human Glioblastomas. International Journal of Molecular Sciences. 2018; 19(3):679. https://doi.org/10.3390/ijms19030679
Chicago/Turabian StyleMichaelsen, Signe Regner, Derya Aslan, Thomas Urup, Hans Skovgaard Poulsen, Kirsten Grønbæk, Helle Broholm, and Lasse Sommer Kristensen. 2018. "DNA Methylation Levels of the ELMO Gene Promoter CpG Islands in Human Glioblastomas" International Journal of Molecular Sciences 19, no. 3: 679. https://doi.org/10.3390/ijms19030679