Evolution and Stress Responses of Gossypium hirsutum SWEET Genes

Abstract
: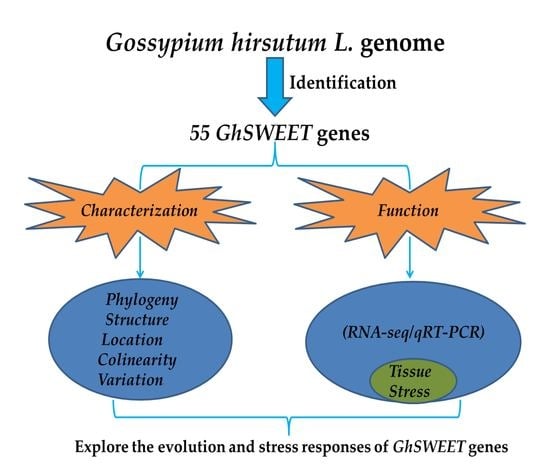
1. Introduction
2. Results
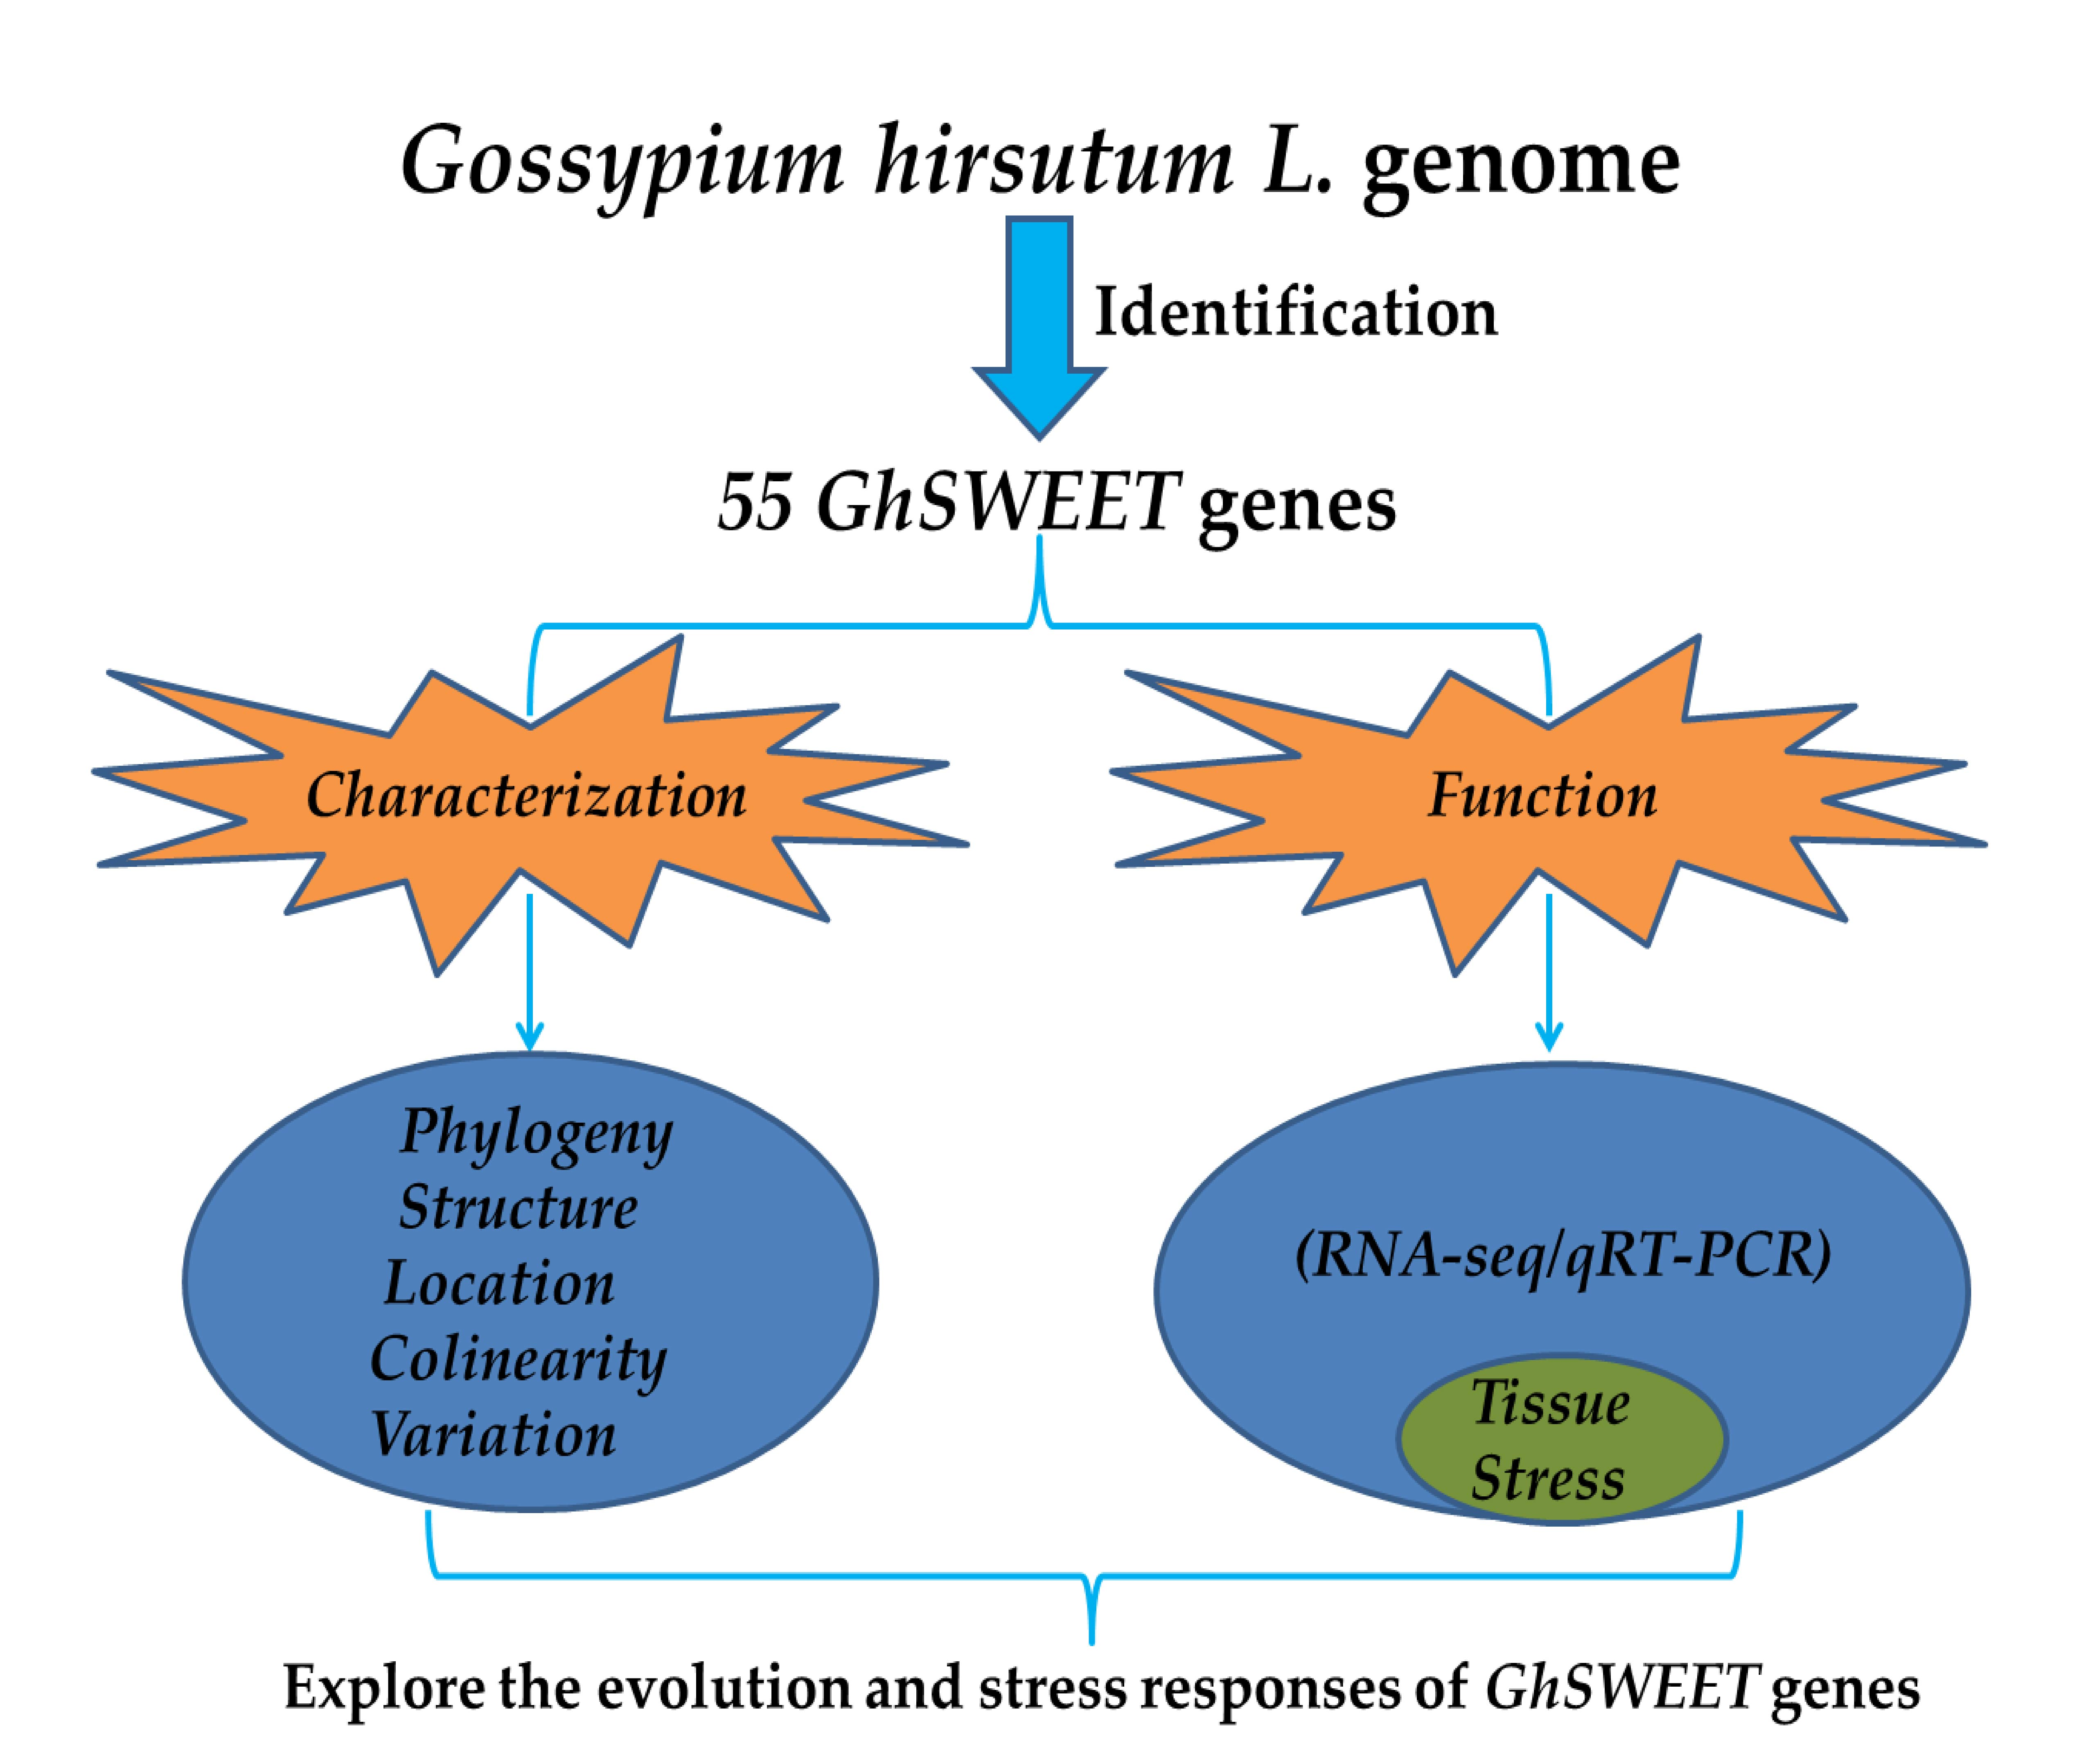
2.1. Identification and Characterization of the G. hirsutum SWEET Gene Family
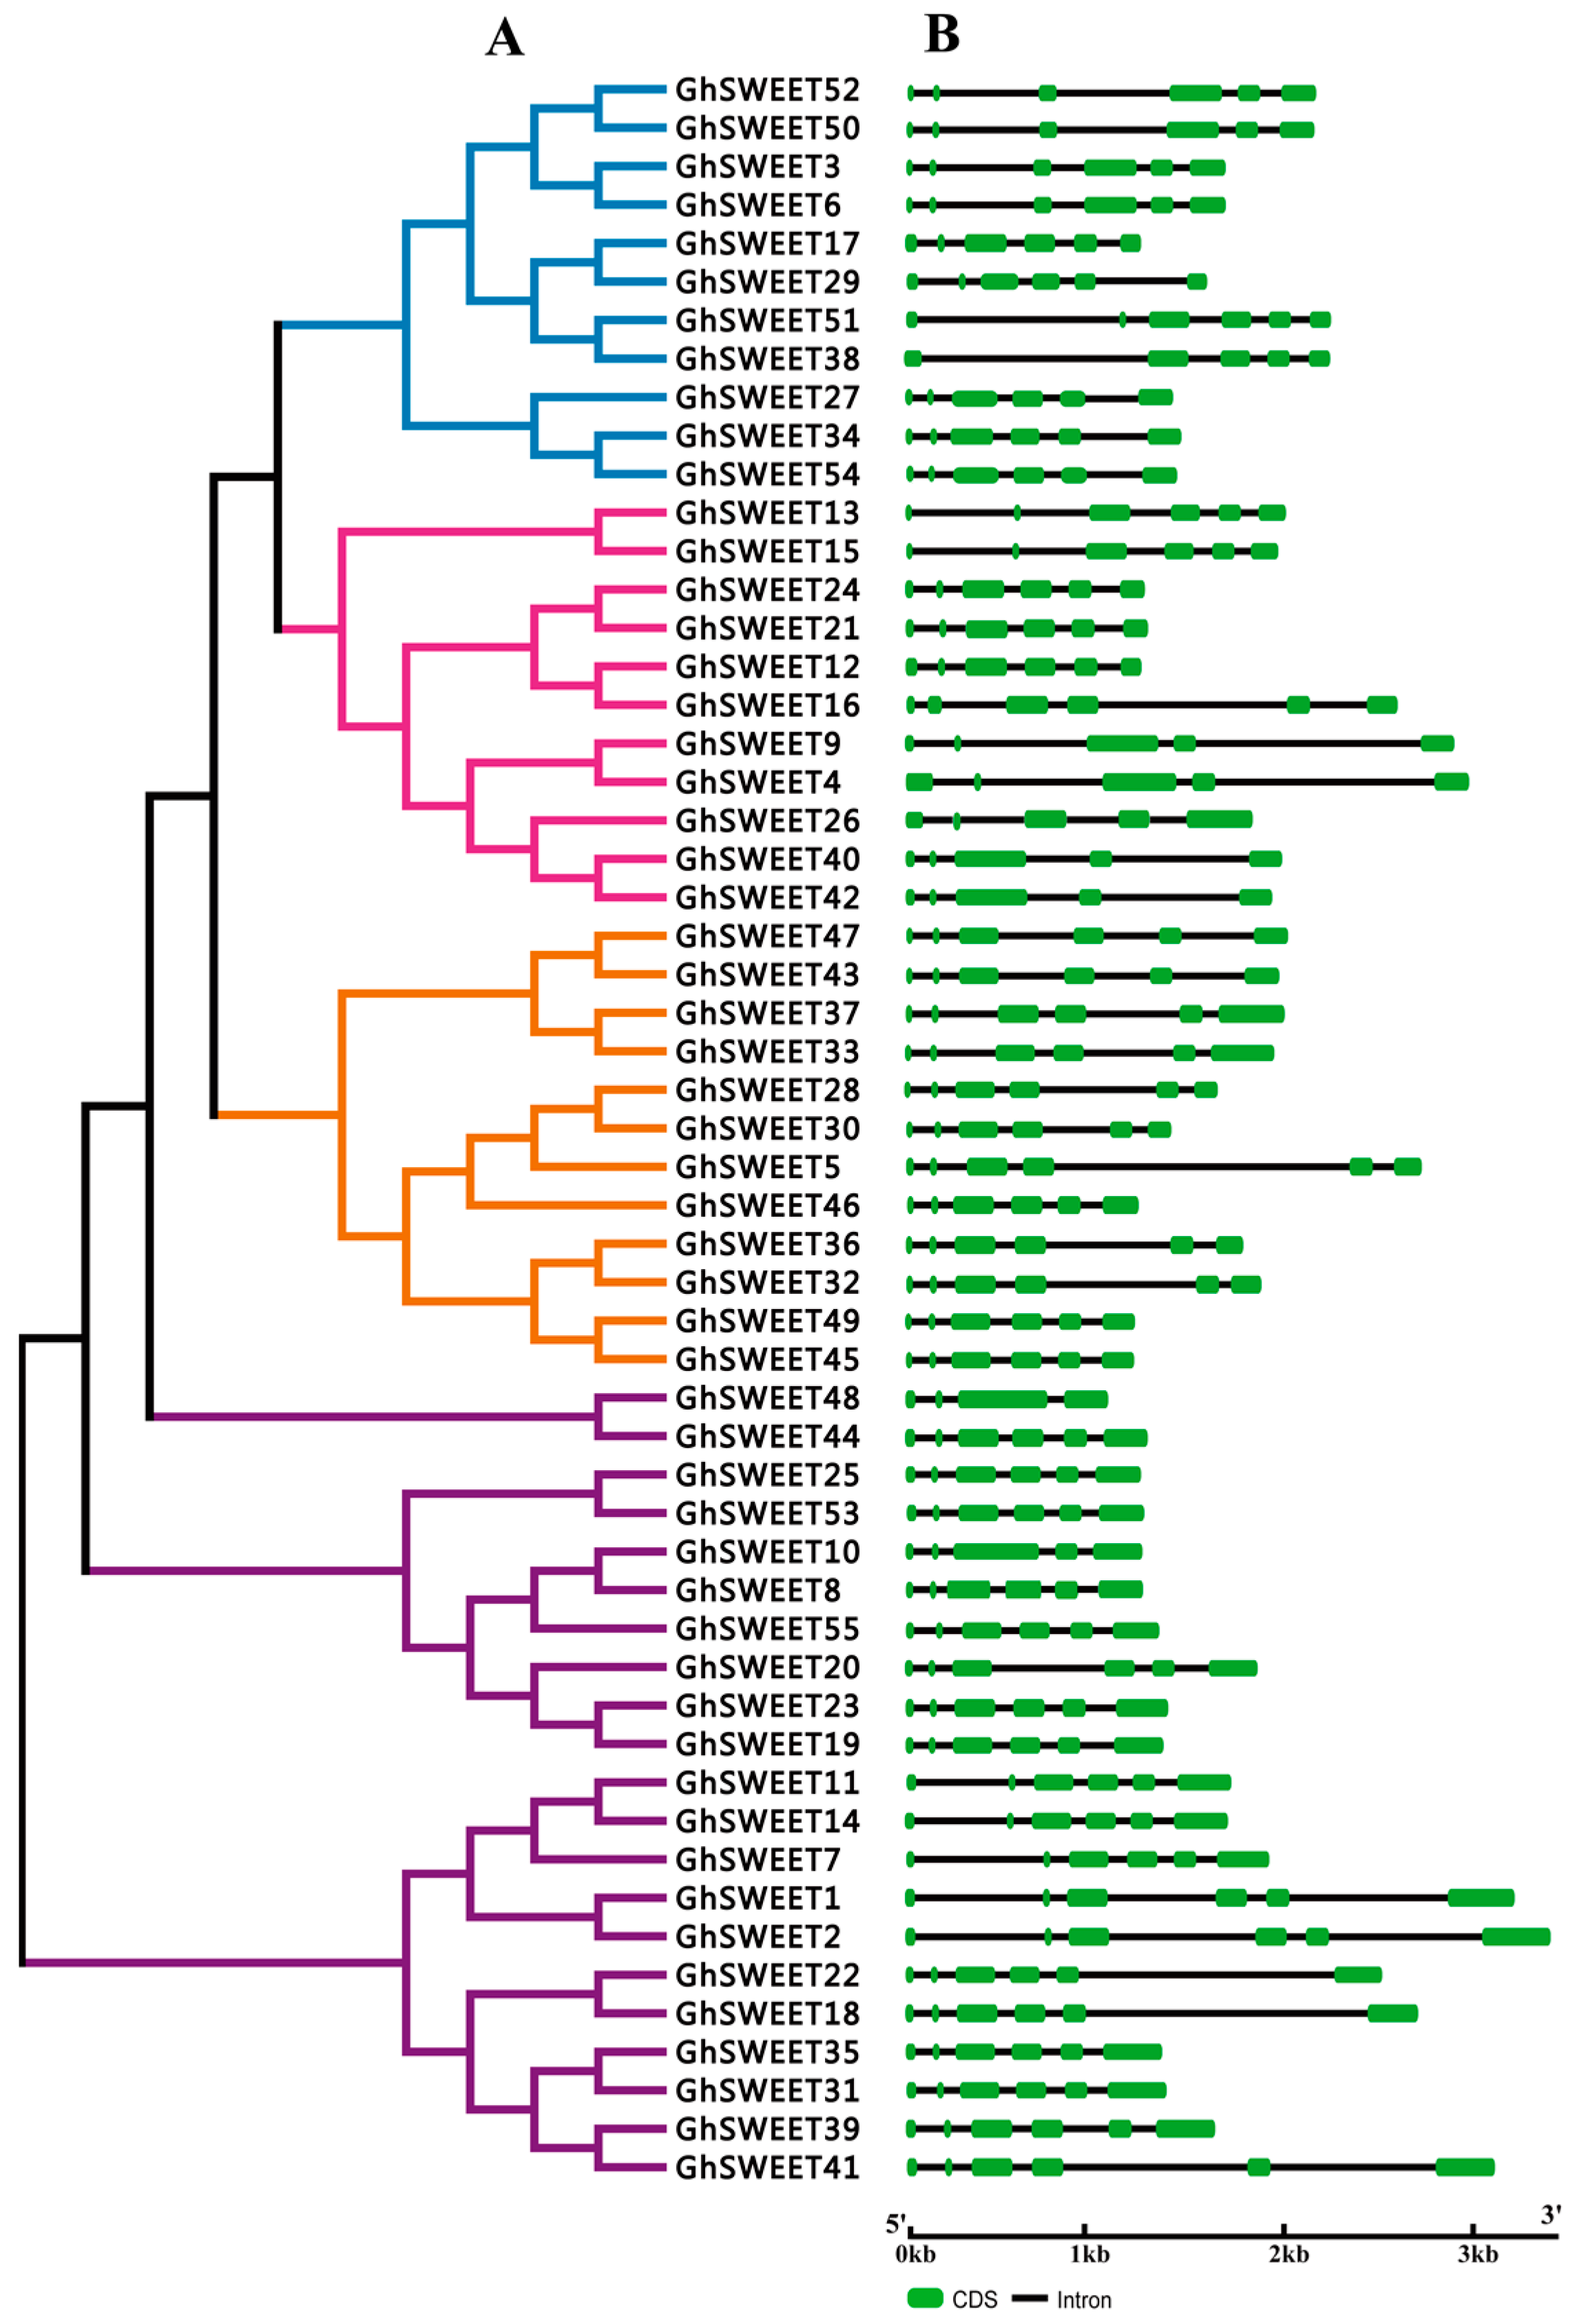
2.2. Phylogenetic Analysis and Structural Features of the SWEET Gene Family
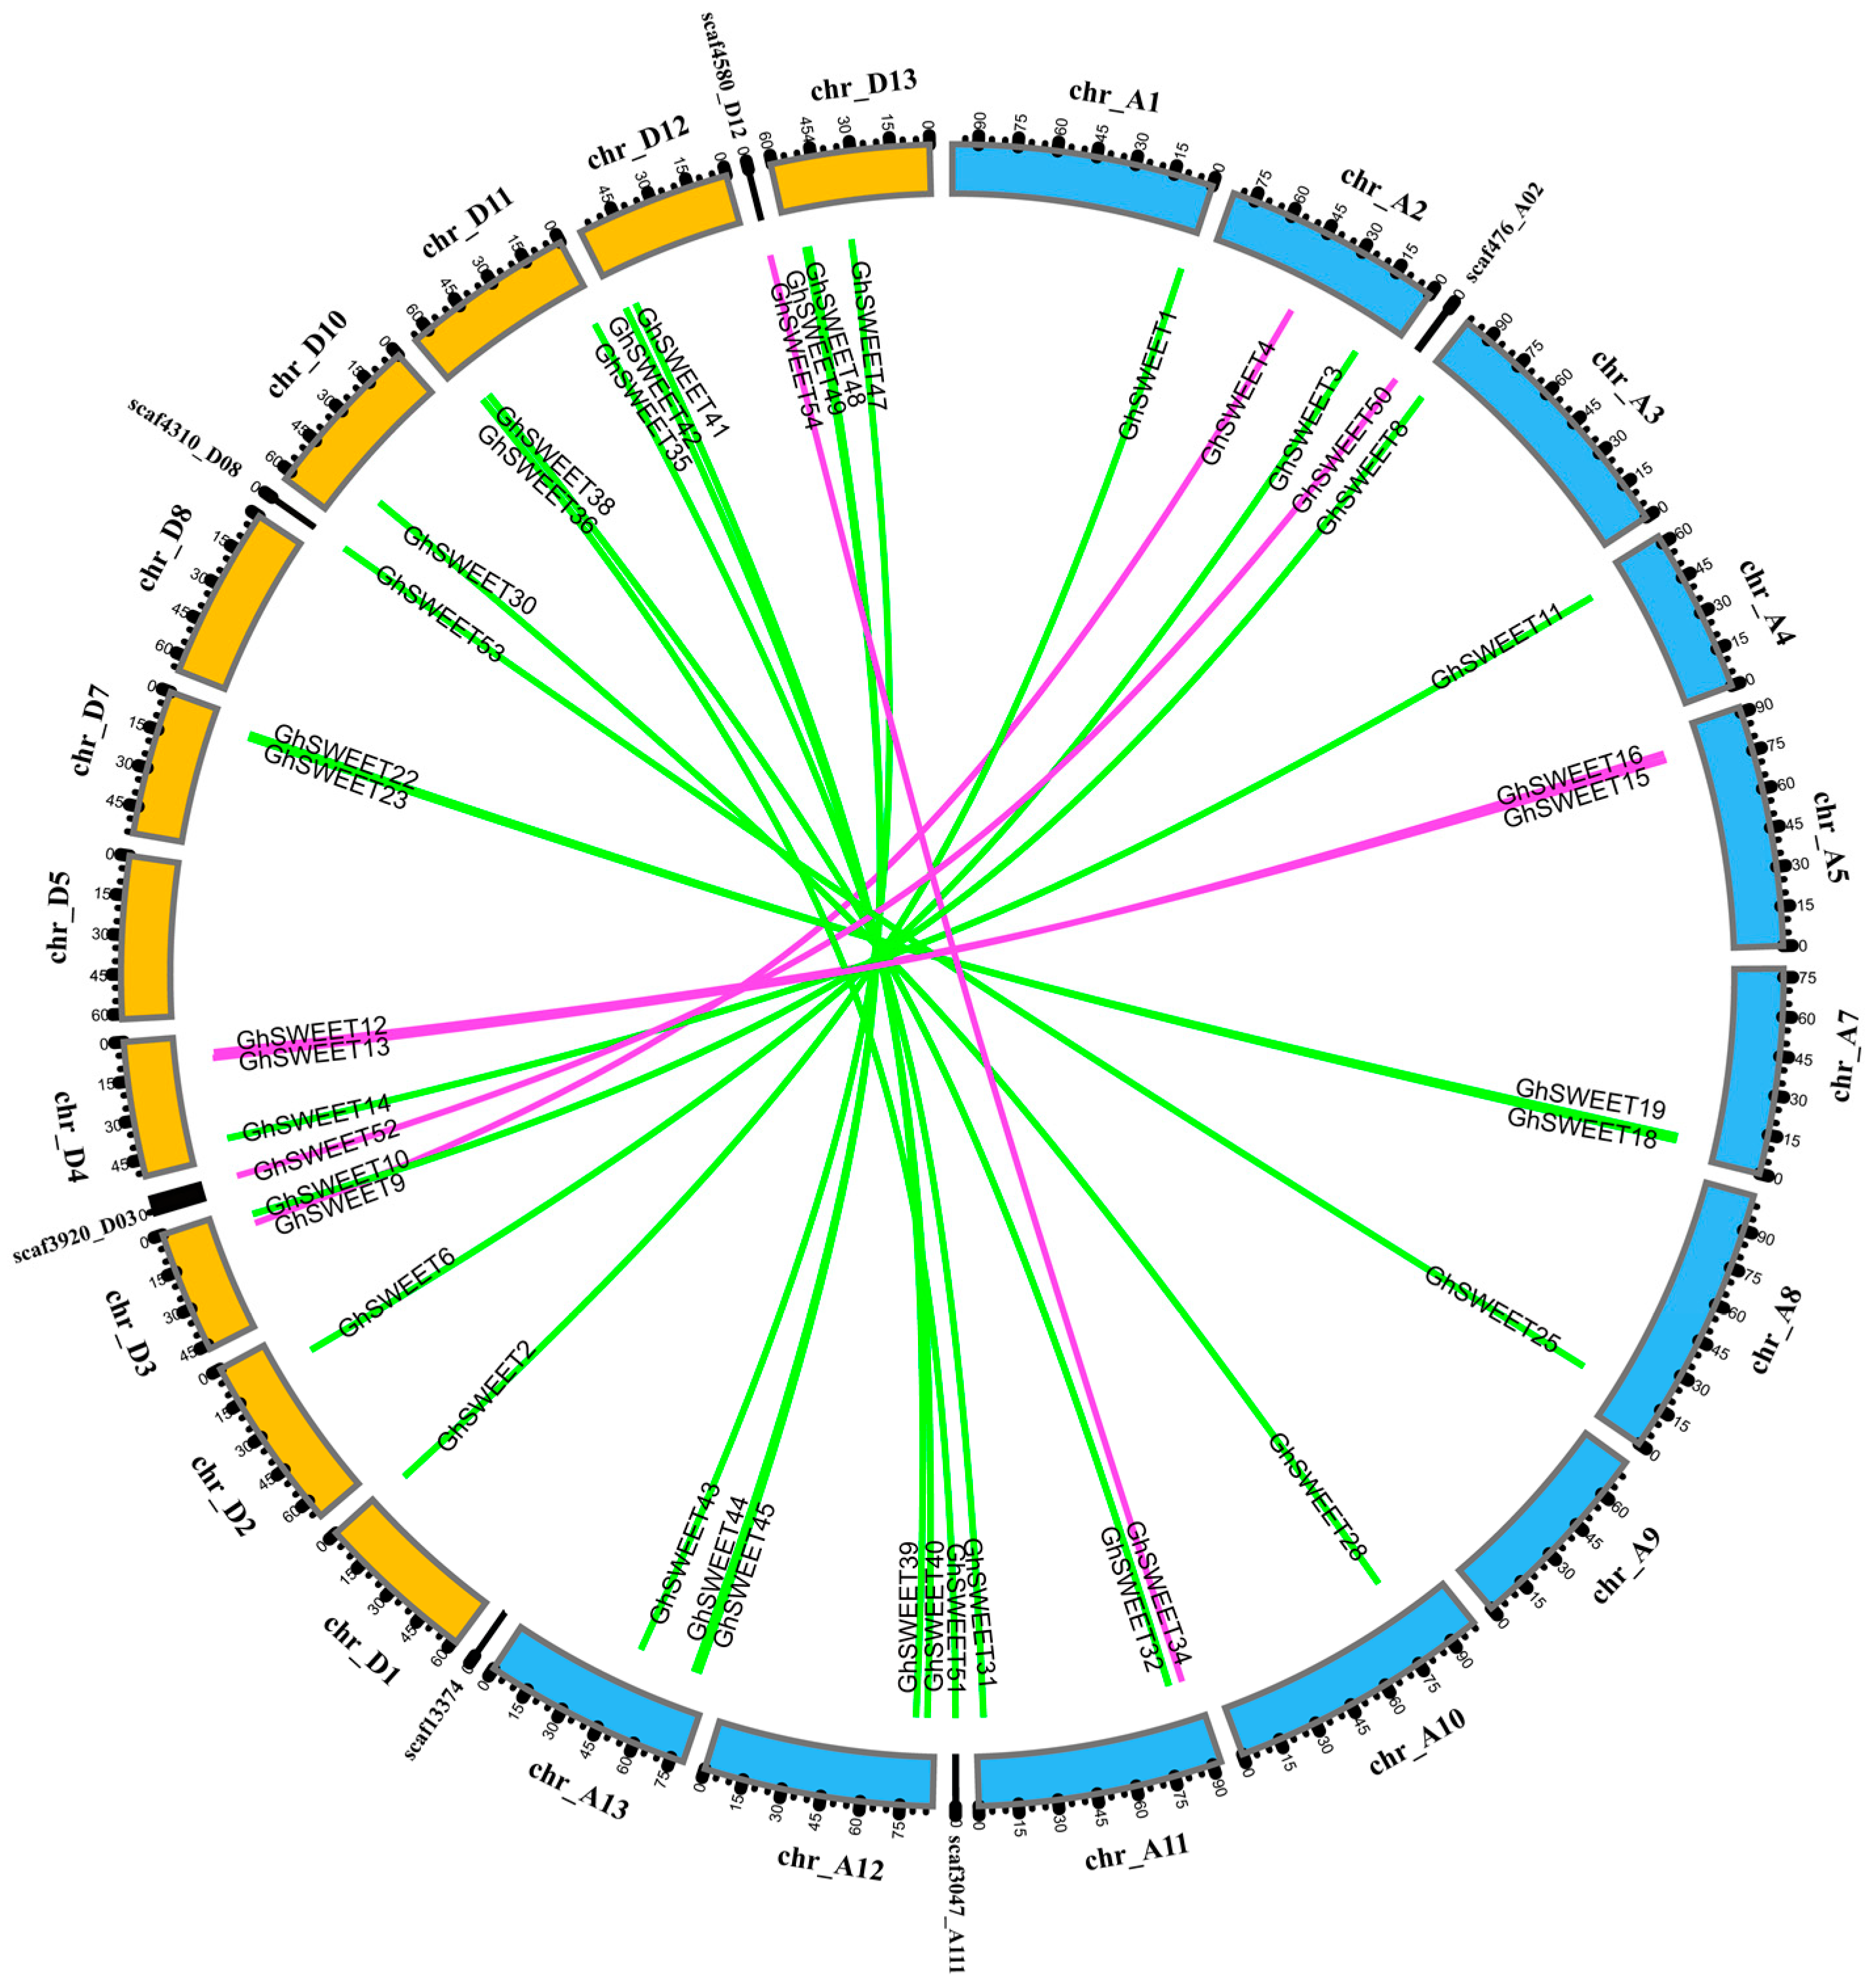
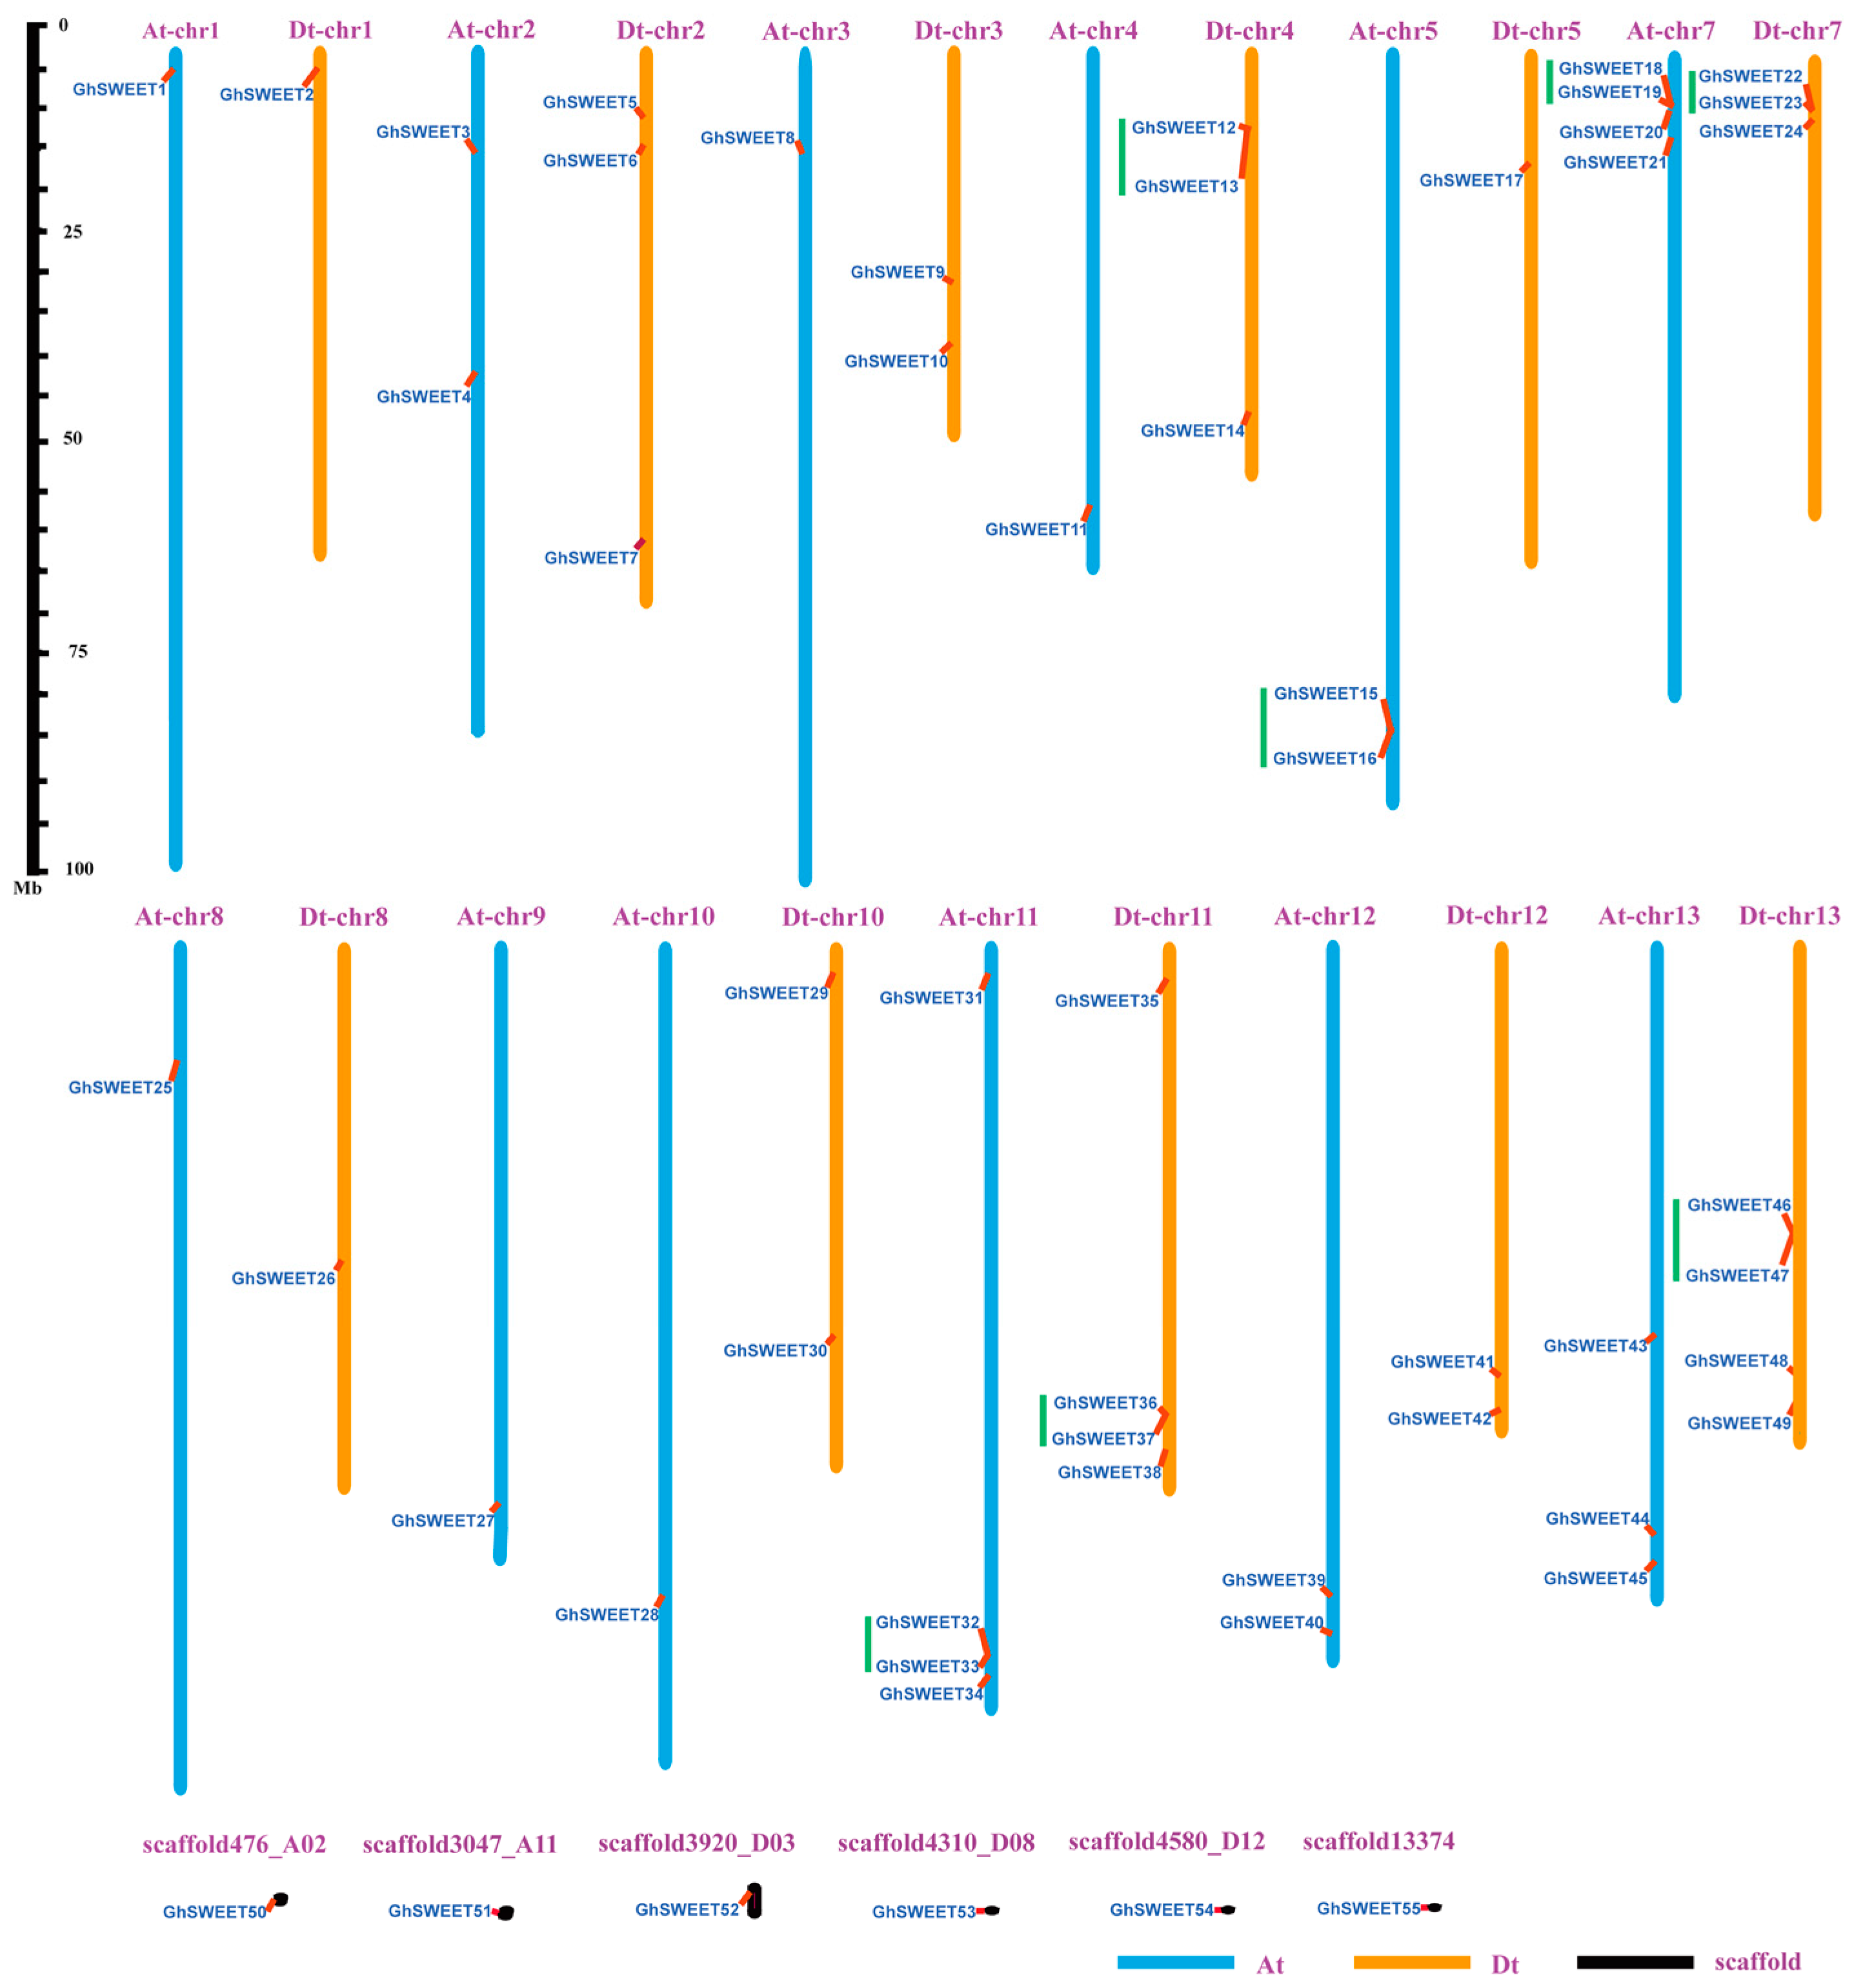
2.3. Chromosomal Distribution and Homology of G. hirsutum SWEET Genes
2.4. Analysis of Cis-Acting Regulatory Elements in the Putative GhSWEET Promoters
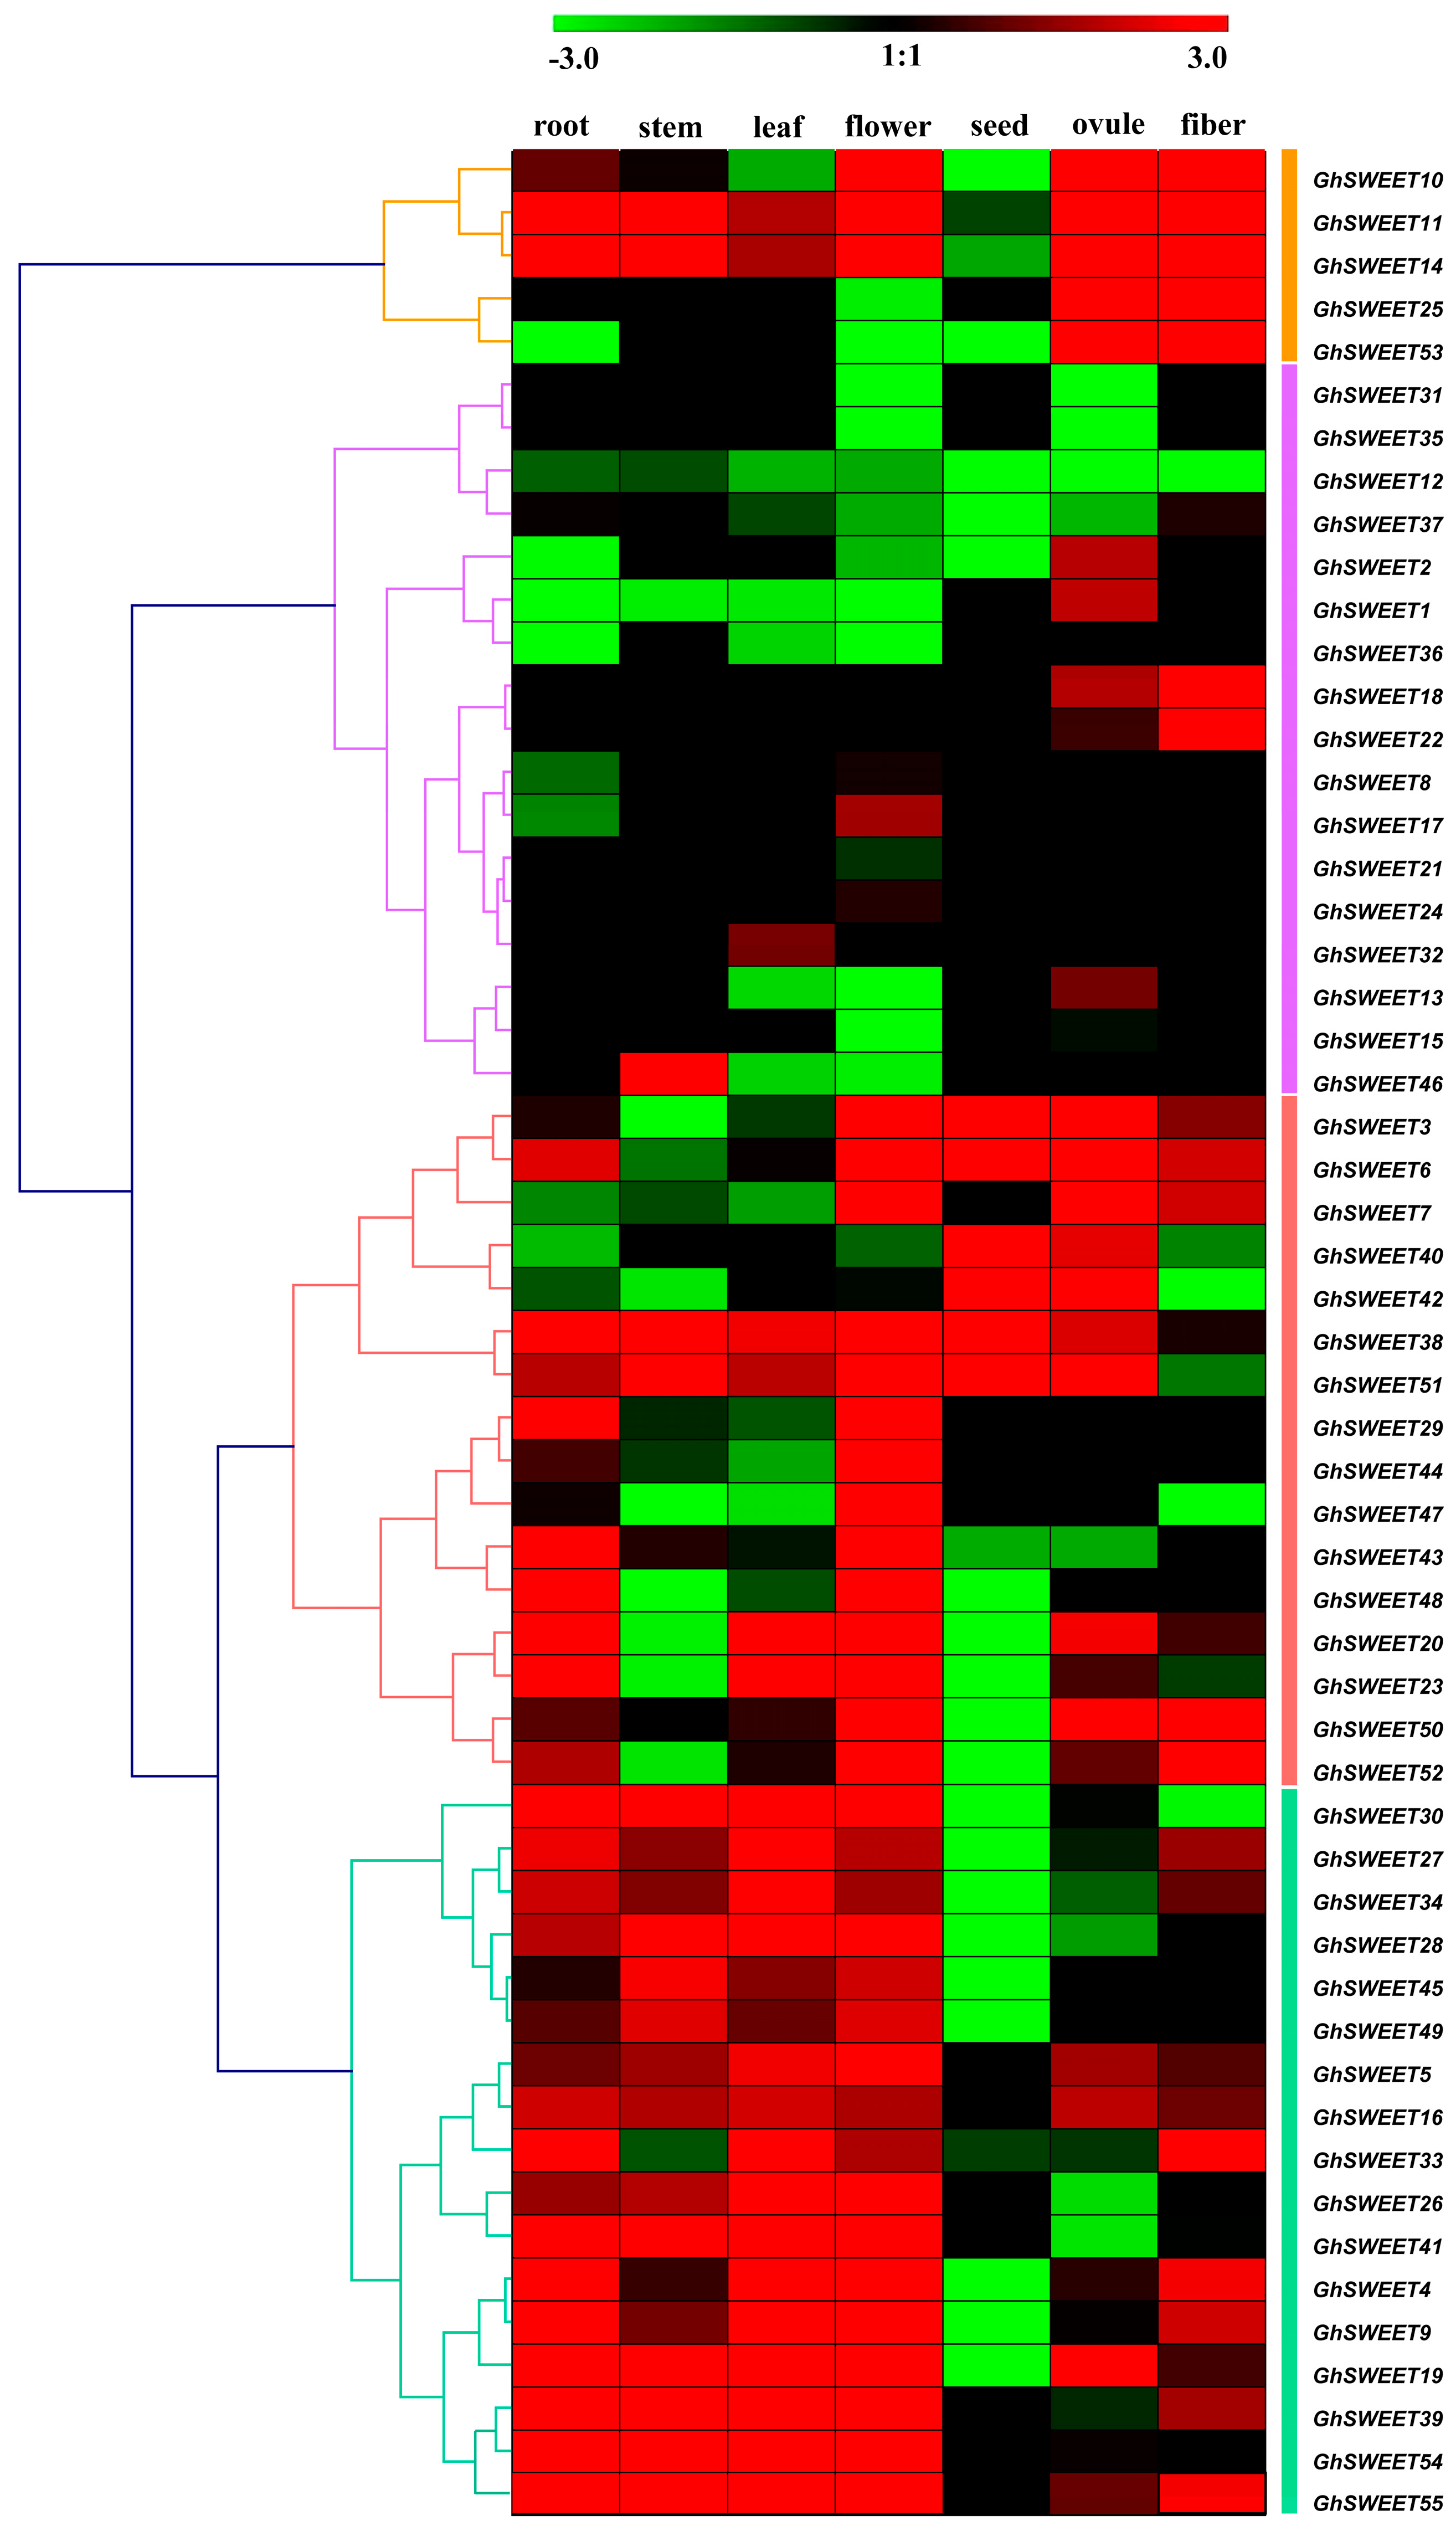
2.5. G. hirsutum SWEET Gene Expression Profiles in Different Tissues
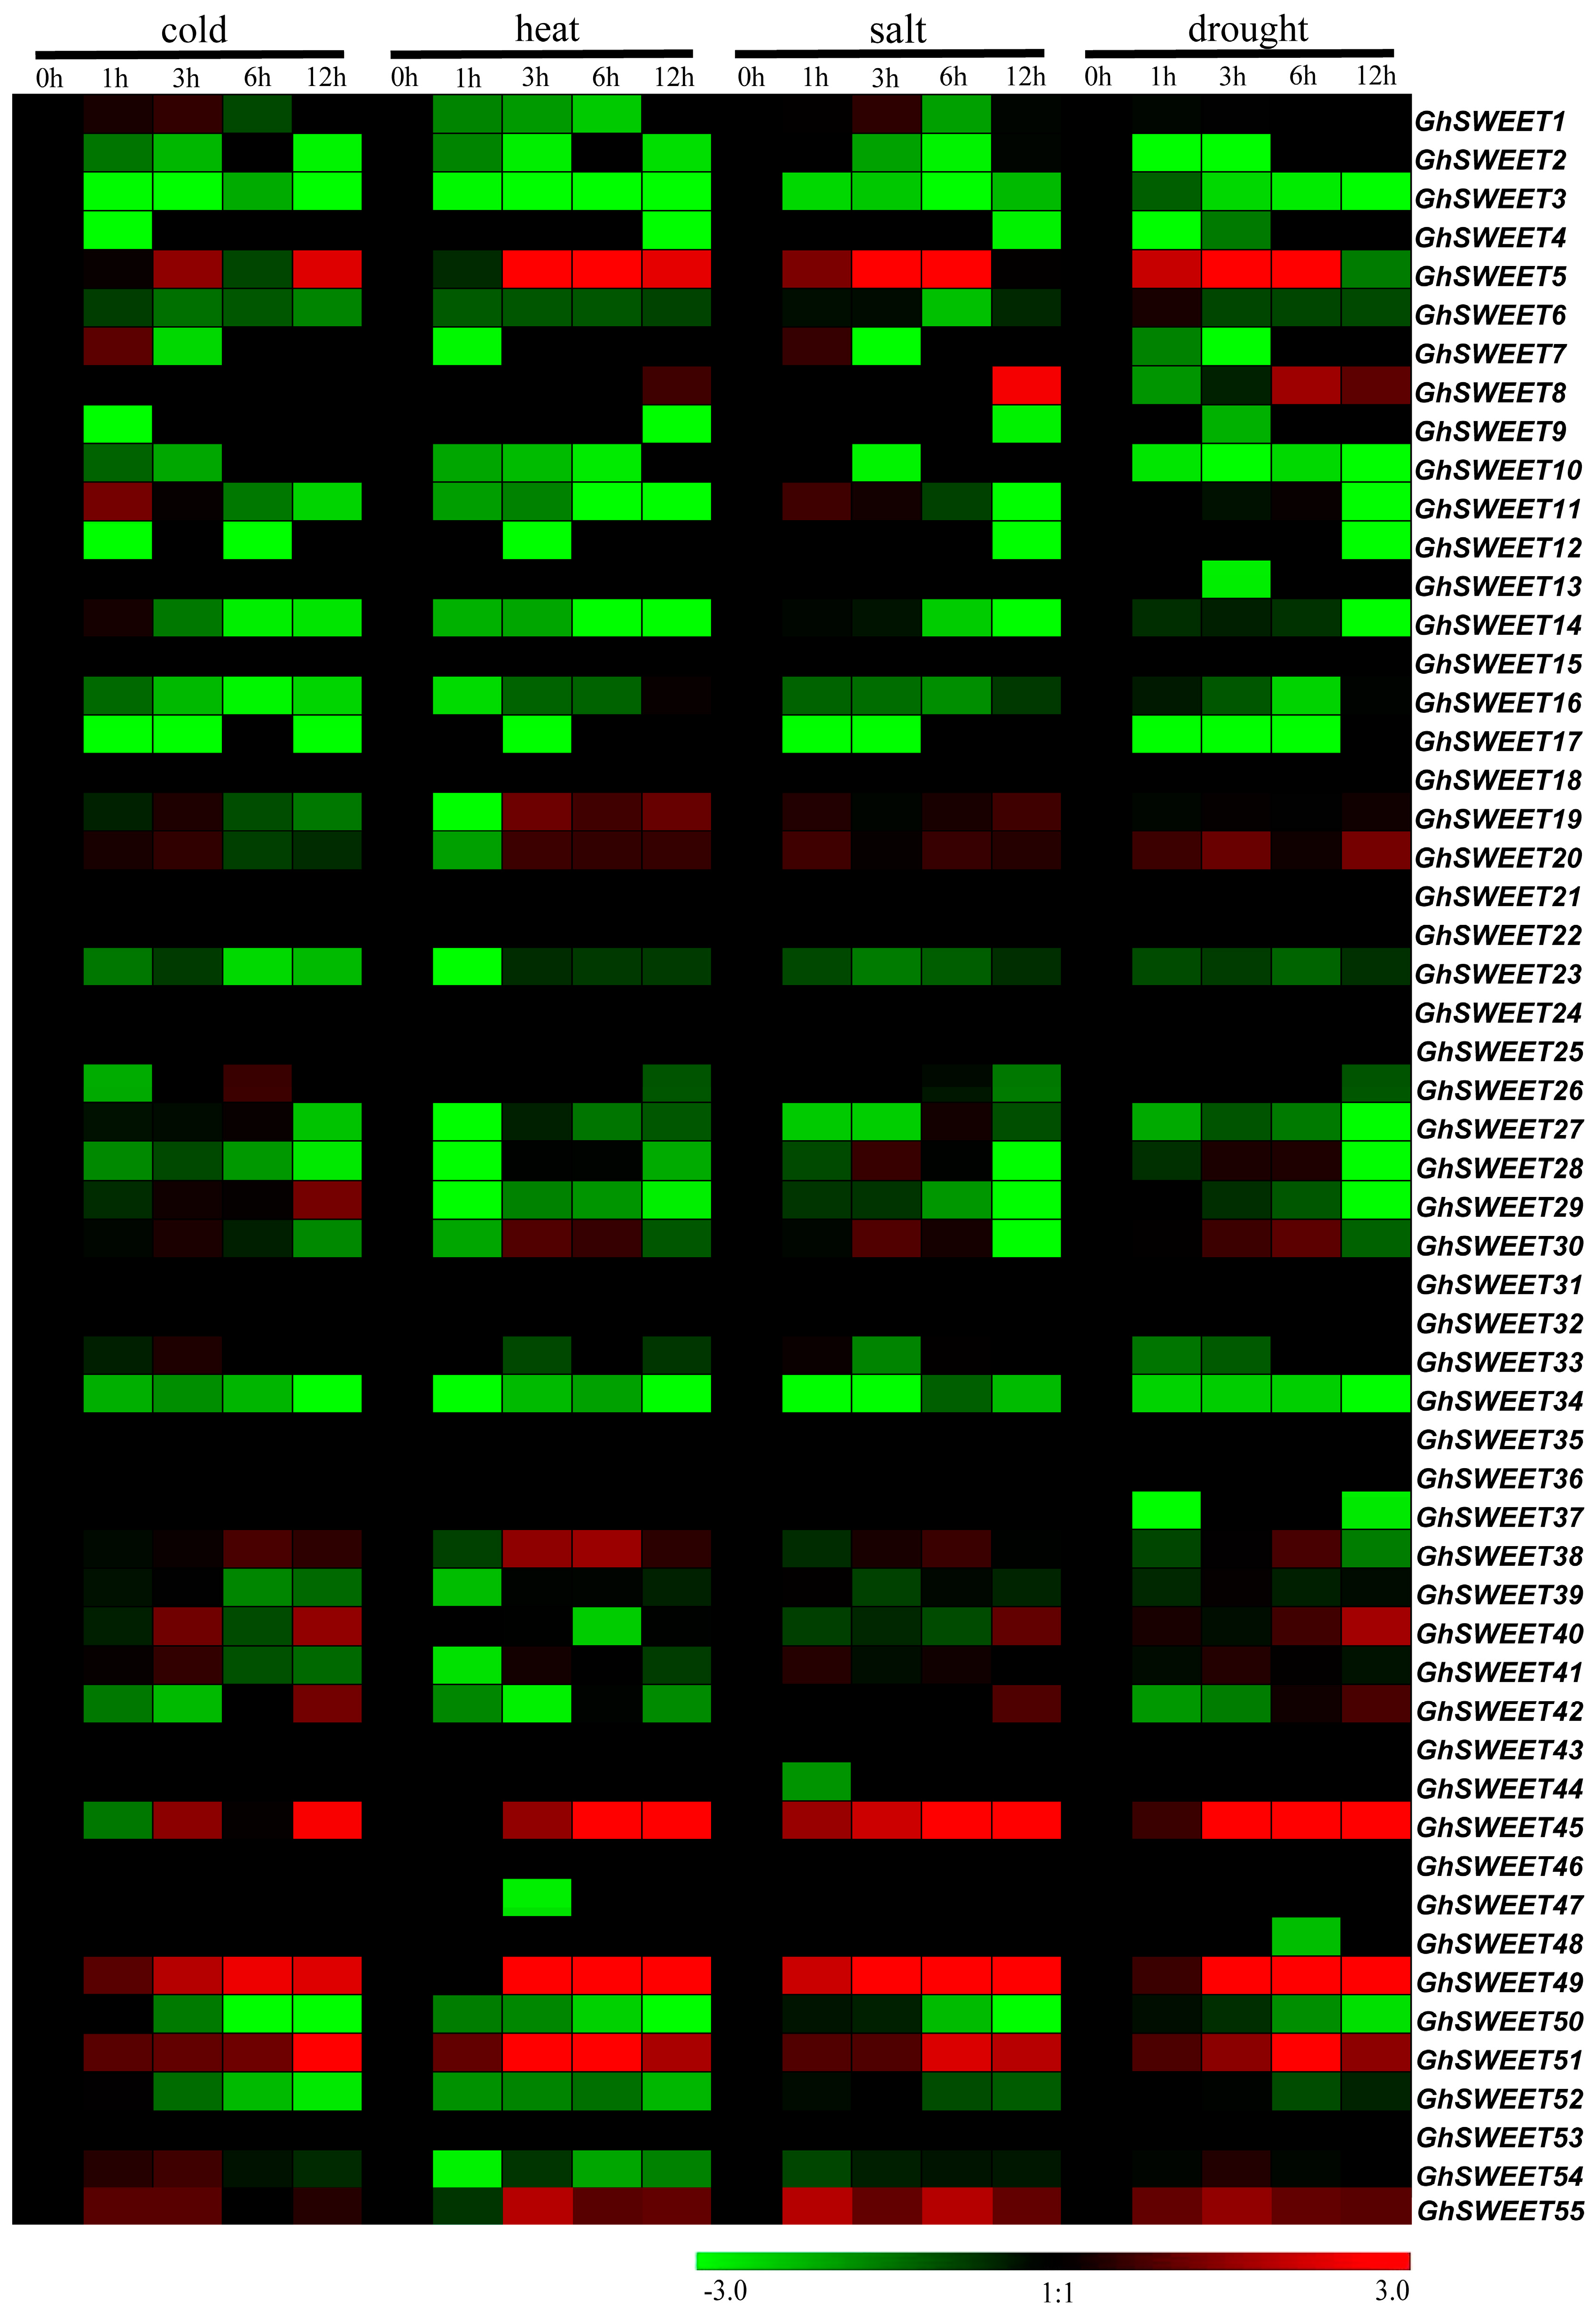
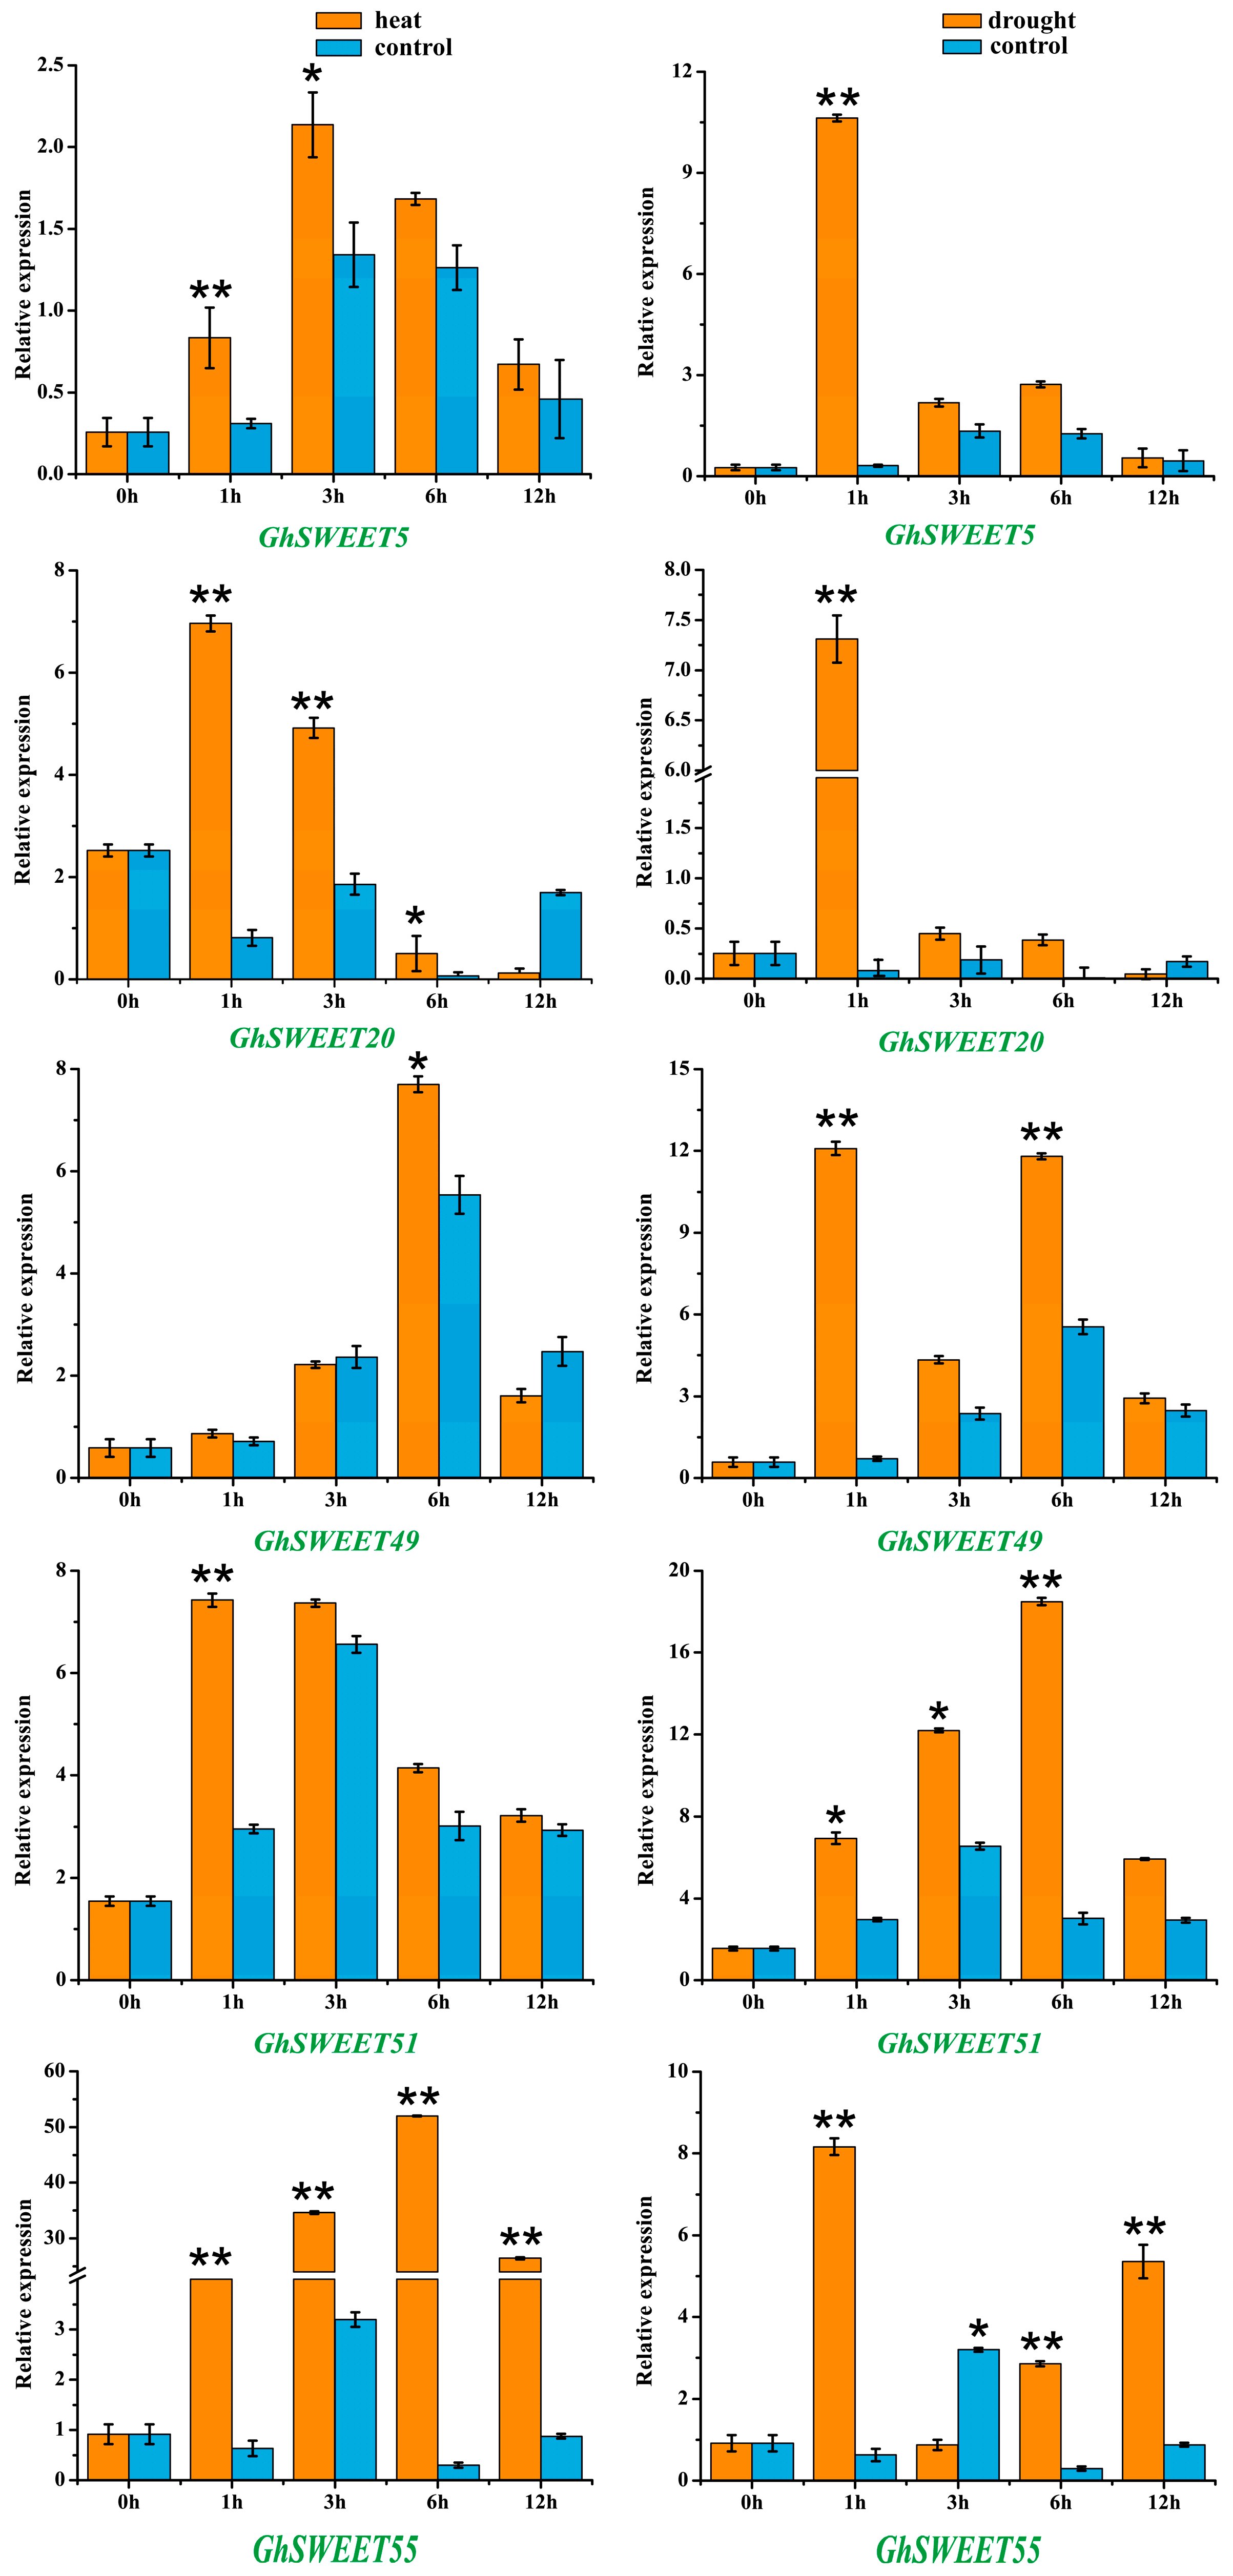
2.6. Stress-Induced Expression Patterns of G. hirsutum SWEET Genes
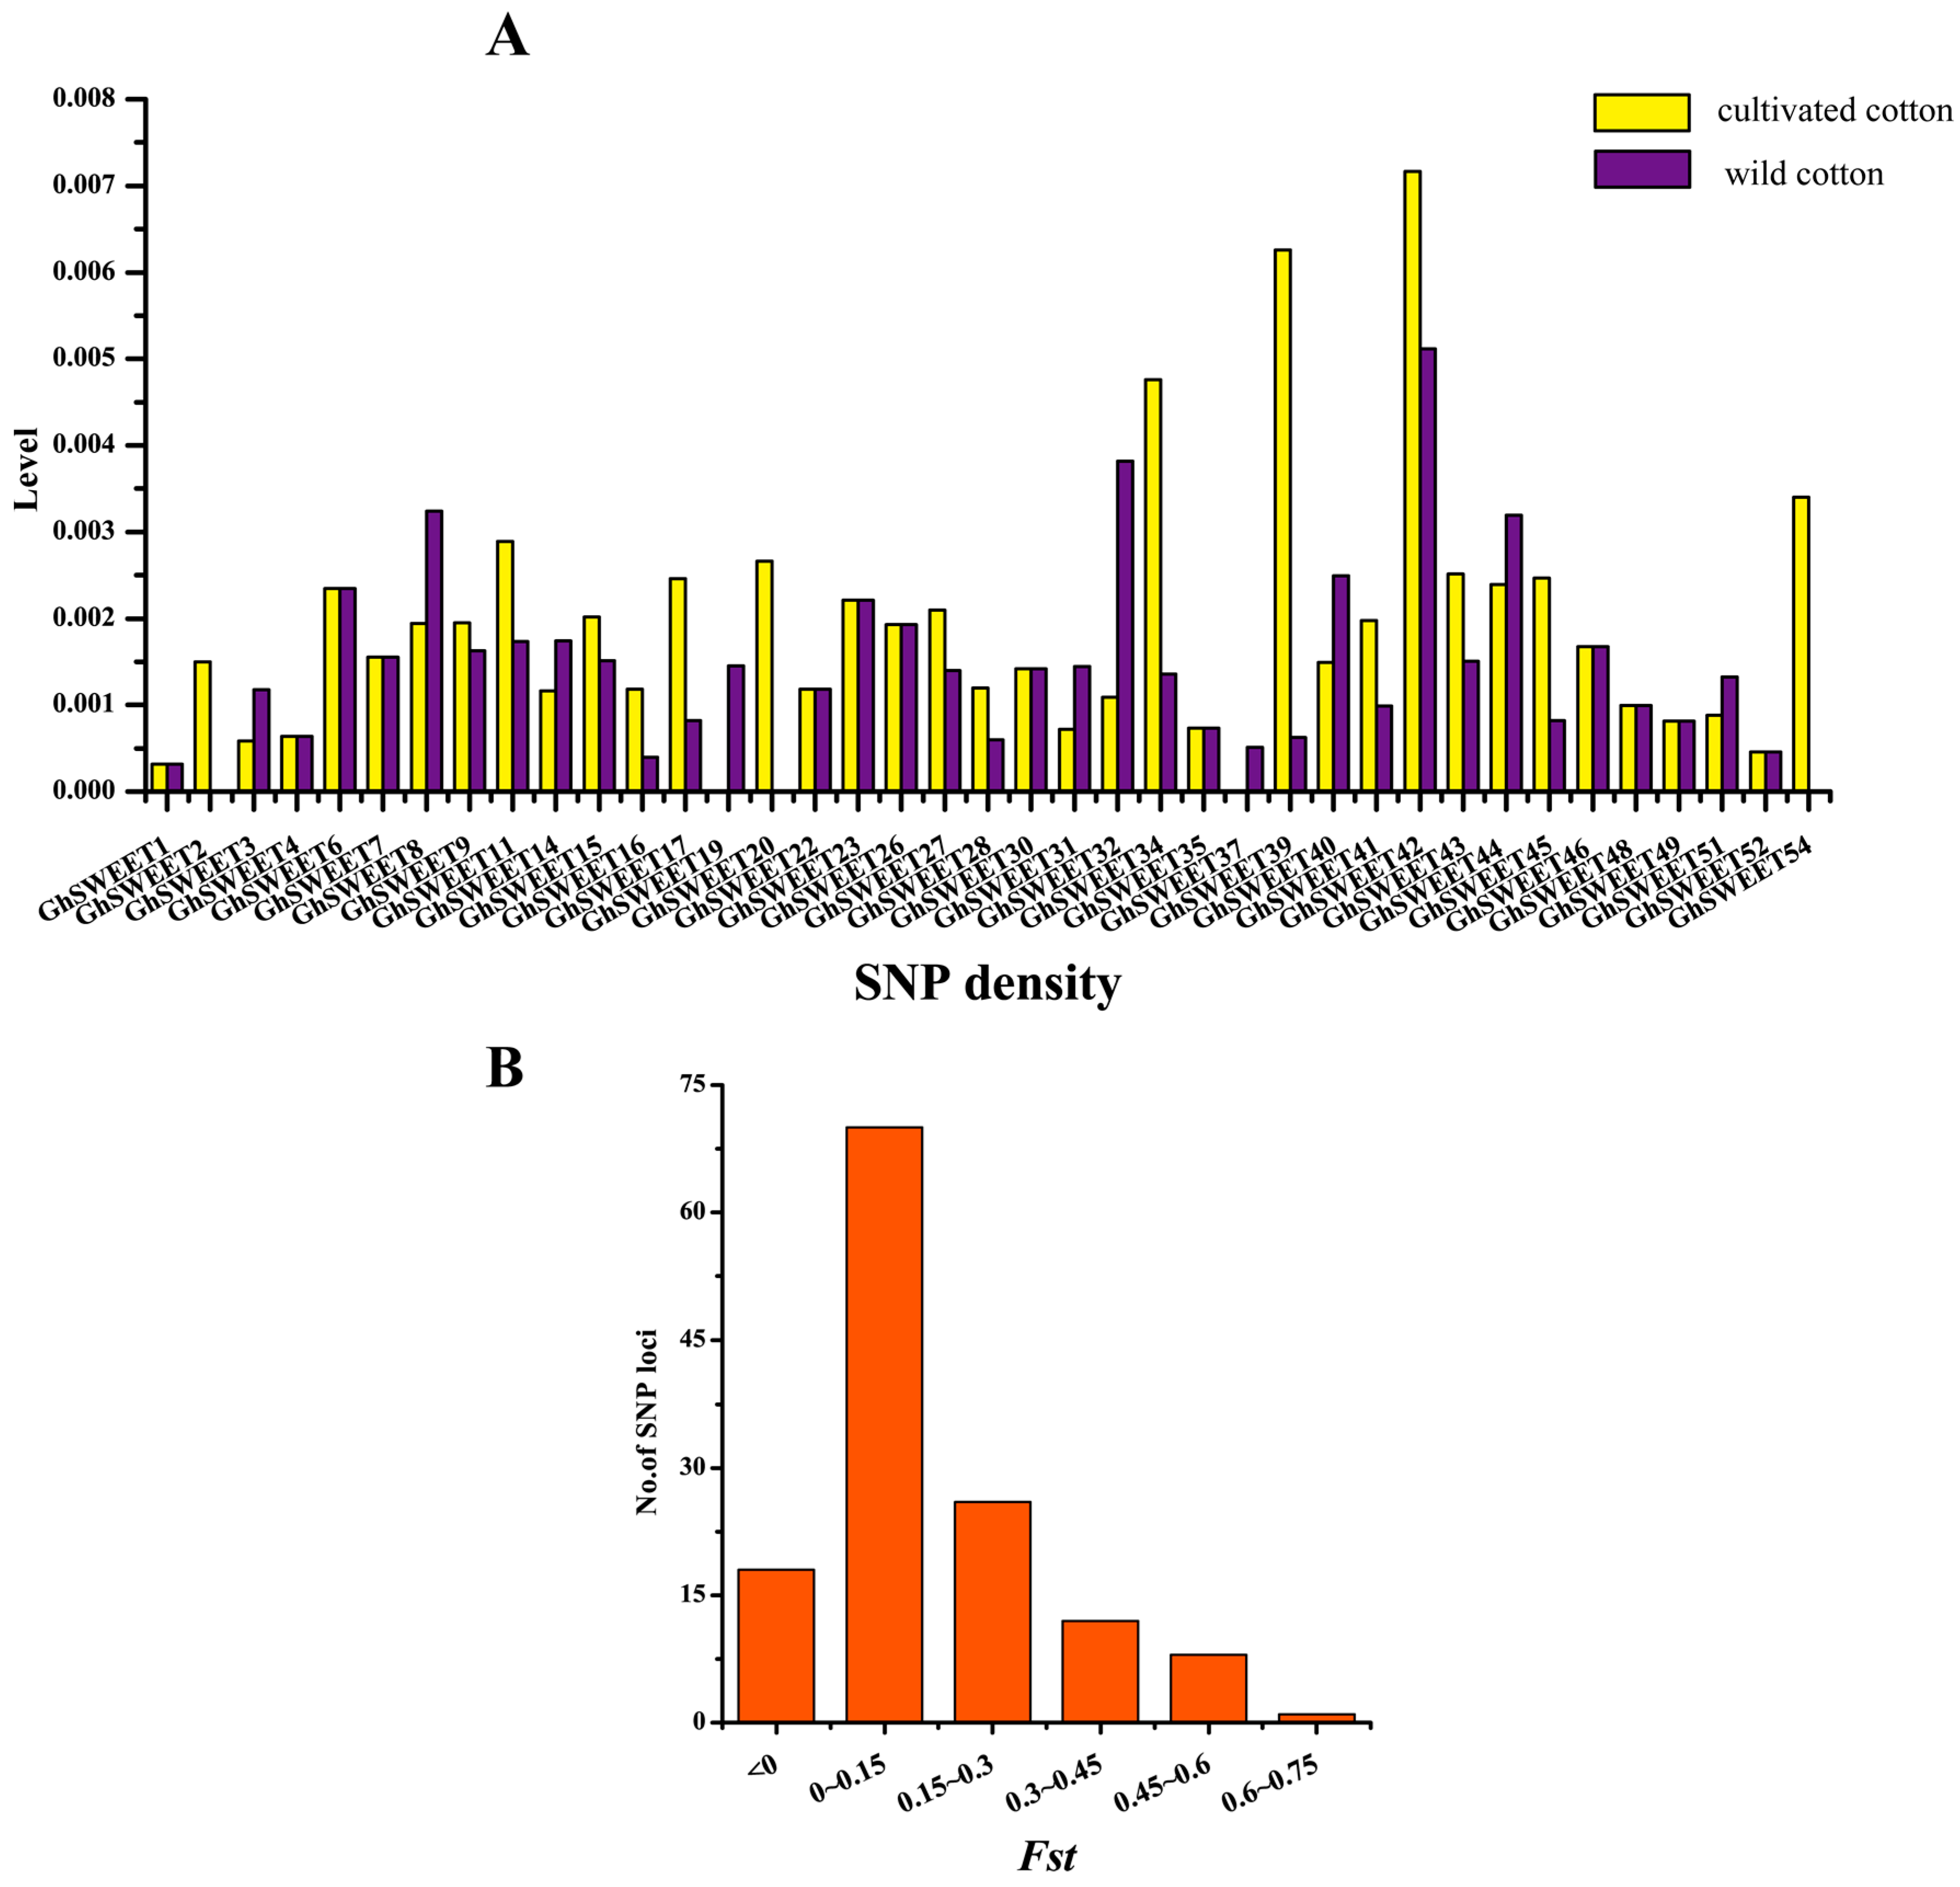
2.7. Genetic Variations and Artificial Selection of GhSWEET Genes During Cotton Domestication
3. Discussion
3.1. Expansion of the Gossypium SWEET Gene Family
3.2. Expression Patterns of SWEET Gene Family
3.3. Functional Divergence of the Gossypium hirsutum SWEET Gene Family
4. Materials and Methods
4.1. Identification and Characterization of G. hirsutum SWEET Genes
4.2. Phylogenetic Analysis
4.3. Gene Structural Features and Chromosomal Localization
4.4. RNA-Sequencing Analysis
4.5. Stress Treatments
4.6. RNA Isolation and Quantitative Real-Time Polymerase Chain Reaction Analysis
4.7. Analysis of Genetic Variations and Artificial Selection of G. hirsutum SWEET Genes
5. Conclusions
Supplementary Materials
Acknowledgments
Author Contributions
Conflicts of Interest
Abbreviations
| SWEET | Sugars will eventually be exported transporters |
| SUT | Sucrose transporter |
| ABA | Abscisic acid |
| SA | Salicylic acid |
| GA | Gibberellin |
| MeJA | Methyl jasmonate |
| BR | Brassinosteroid |
| MW | Molecular weight |
| pI | Isoelectric point |
| FPKM | Fragments per kilobase of transcript per million mapped fragments |
| qRT-PCR | Quantitative real-time polymerase chain reaction |
| SNP | Single nucleotide polymorphism |
| WGD | Whole-genome duplication |
References
- Ruan, Y.L. Sucrose metabolism: Gateway to diverse carbon use and sugar signaling. Annu. Rev. Plant Biol. 2014, 65, 33–67. [Google Scholar] [CrossRef] [PubMed]
- Slewinski, T.L. Diverse functional roles of monosaccharide transporters and their homologs in vascular plants: A physiological perspective. Mol. Plant 2011, 4, 641–662. [Google Scholar] [CrossRef] [PubMed]
- Chen, L.Q.; Qu, X.Q.; Hou, B.H.; Sosso, D.; Osorio, S.; Fernie, A.R.; Frommer, W.B. Sucrose efflux mediated by sweet proteins as a key step for phloem transport. Science 2012, 335, 207–211. [Google Scholar] [CrossRef] [PubMed]
- Slewinski, T.L.; Meeley, R.; Braun, D.M. Sucrose transporter1 functions in phloem loading in maize leaves. J. Exp. Bot. 2009, 60, 881–892. [Google Scholar] [CrossRef] [PubMed]
- Srivastava, A.C.; Ganesan, S.; Ismail, I.O.; Ayre, B.G. Functional characterization of the Arabidopsis AtSUC2 Sucrose/H+ symporter by tissue-specific complementation reveals an essential role in phloem loading but not in long-distance transport. Plant Physiol. 2008, 148, 200–211. [Google Scholar] [CrossRef] [PubMed]
- Sauer, N. Molecular physiology of higher plant sucrose transporters. FEBS Lett. 2007, 581, 2309–2317. [Google Scholar] [CrossRef] [PubMed]
- Sonnewald, U. SWEETs—The missing sugar efflux carriers. Front. Plant Sci. 2011, 2, 7. [Google Scholar] [CrossRef] [PubMed]
- Aoki, N.; Hirose, T.; Scofield, G.N.; Whitfeld, P.R.; Furbank, R.T. The sucrose transporter gene family in rice. Plant Cell Physiol. 2003, 44, 223–232. [Google Scholar] [CrossRef] [PubMed]
- Hamada, M.; Wada, S.; Kobayashi, K.; Satoh, N. Ci-rga, a gene encoding an MtN3/Saliva family transmembrane protein, is essential for tissue differentiation during embryogenesis of the ascidian ciona intestinalis. Differentiation 2005, 73, 364–376. [Google Scholar] [CrossRef] [PubMed]
- Wei, X.; Liu, F.; Chen, C.; Ma, F.; Li, M. The Malus domestica sugar transporter gene family: Identifications based on genome and expression profiling related to the accumulation of fruit sugars. Front. Plant Sci. 2014, 5, 569. [Google Scholar] [CrossRef] [PubMed]
- Follit, J.A.; Tuft, R.A.; Fogarty, K.E.; Pazour, G.J. The intraflagellar transport protein IFT20 is associated with the golgi complex and is required for cilia assembly. Mol. Biol. Cell 2006, 17, 3781–3792. [Google Scholar] [CrossRef] [PubMed]
- Chen, L.Q.; Hou, B.H.; Lalonde, S.; Takanaga, H.; Hartung, M.L.; Qu, X.Q.; Guo, W.J.; Kim, J.G.; Underwood, W.; Chaudhuri, B.; et al. Sugar transporters for intercellular exchange and nutrition of pathogens. Nature 2010, 468, 527–532. [Google Scholar] [CrossRef] [PubMed]
- Yuan, M.; Wang, S. Rice MtN3/Saliva/SWEET family genes and their homologs in cellular organisms. Mol. Plant 2013, 6, 665–674. [Google Scholar] [CrossRef] [PubMed]
- Patil, G.; Valliyodan, B.; Deshmukh, R.; Prince, S.; Nicander, B.; Zhao, M.; Sonah, H.; Song, L.; Lin, L.; Chaudhary, J.; et al. Soybean (Glycine max) SWEET gene family: Insights through comparative genomics, transcriptome profiling and whole genome re-sequence analysis. BMC Genom. 2015, 16, 520. [Google Scholar] [CrossRef] [PubMed]
- Manck-Gotzenberger, J.; Requena, N. Arbuscular mycorrhiza symbiosis induces a major transcriptional reprogramming of the potato SWEET sugar transporter family. Front. Plant Sci. 2016, 7, 487. [Google Scholar] [CrossRef] [PubMed]
- Chandran, D. Co-option of developmentally regulated plant SWEET transporters for pathogen nutrition and abiotic stress tolerance. IUBMB Life 2015, 67, 461–471. [Google Scholar] [CrossRef] [PubMed]
- Kanno, Y.; Oikawa, T.; Chiba, Y.; Ishimaru, Y.; Shimizu, T.; Sano, N.; Koshiba, T.; Kamiya, Y.; Ueda, M.; Seo, M. AtSWEET13 and AtSWEET14 regulate gibberellin-mediated physiological processes. Nat. Commun. 2016, 7, 13245. [Google Scholar] [CrossRef] [PubMed]
- Yamada, K.; Osakabe, Y. Sugar compartmentation as an environmental stress adaptation strategy in plants. Semi. Cell Dev. Biol. 2017. [Google Scholar] [CrossRef] [PubMed]
- Chong, J.; Piron, M.C.; Meyer, S.; Merdinoglu, D.; Bertsch, C.; Mestre, P. The SWEET family of sugar transporters in grapevine: VvSWEET4 is involved in the interaction with botrytis cinerea. J. Exp. Bot. 2014, 65, 6589–6601. [Google Scholar] [CrossRef] [PubMed]
- Feng, C.Y.; Han, J.X.; Han, X.X.; Jiang, J. Genome-wide identification, phylogeny, and expression analysis of the SWEET gene family in tomato. Gene 2015, 573, 261–272. [Google Scholar] [CrossRef] [PubMed]
- Li, Y.; Feng, S.; Ma, S.; Sui, X.; Zhang, Z. Spatiotemporal expression and substrate specificity analysis of the cucumber SWEET gene family. Front. Plant Sci. 2017, 8, 1855. [Google Scholar] [CrossRef] [PubMed]
- Gao, Y.; Wang, Z.Y.; Kumar, V.; Xu, X.F.; Yuan, P.; Zhu, X.F.; Li, T.Y.; Jia, B.L.; Xuan, Y.H. Genome-wide identification of the SWEET gene family in wheat. Gene 2018, 642, 284–292. [Google Scholar] [CrossRef] [PubMed]
- Le Hir, R.; Spinner, L.; Klemens, P.A.; Chakraborti, D.; de Marco, F.; Vilaine, F.; Wolff, N.; Lemoine, R.; Porcheron, B.; Gery, C.; et al. Disruption of the sugar transporters AtSWEET11 and AtSWEET12 affects vascular development and freezing tolerance in Arabidopsis. Mol. Plant 2015, 8, 1687–1690. [Google Scholar] [CrossRef] [PubMed]
- Klemens, P.A.; Patzke, K.; Deitmer, J.; Spinner, L.; Le Hir, R.; Bellini, C.; Bedu, M.; Chardon, F.; Krapp, A.; Neuhaus, H.E. Overexpression of the vacuolar sugar carrier AtSWEET16 modifies germination, growth, and stress tolerance in Arabidopsis. Plant Physiol. 2013, 163, 1338–1352. [Google Scholar] [CrossRef] [PubMed]
- Jian, H.; Lu, K.; Yang, B.; Wang, T.; Zhang, L.; Zhang, A.; Wang, J.; Liu, L.; Qu, C.; Li, J. Genome-wide analysis and expression profiling of the SUC and SWEET gene families of sucrose transporters in oilseed rape (Brassica napus L.). Front. Plant Sci. 2016, 7, 1464. [Google Scholar] [CrossRef] [PubMed]
- Lin, I.W.; Sosso, D.; Chen, L.Q.; Gase, K.; Kim, S.G.; Kessler, D.; Klinkenberg, P.M.; Gorder, M.K.; Hou, B.H.; Qu, X.Q.; et al. Nectar secretion requires sucrose phosphate synthases and the sugar transporter SWEET9. Nature 2014, 508, 546–549. [Google Scholar] [CrossRef] [PubMed]
- Alhassan, Y.; Kumar, N.; Bugaje, I.M.; Pali, H.S.; Kathkar, P. Co-solvents transesterification of cotton seed oil into biodiesel: Effects of reaction conditions on quality of fatty acids methyl esters. Energy Conver. Manag. 2014, 84, 640–648. [Google Scholar] [CrossRef]
- Yang, T.; Zheng, Y. State and trends of oil crops production in China. Oil. Crops Lipids 2016, 23, D603. [Google Scholar] [CrossRef]
- Li, F.; Fan, G.; Lu, C.; Xiao, G.; Zou, C.; Kohel, R.J.; Ma, Z.; Shang, H.; Ma, X.; Wu, J.; et al. Genome sequence of cultivated upland cotton (Gossypium hirsutum TM-1) provides insights into genome evolution. Nat. Biotechnol. 2015, 33, 524–530. [Google Scholar] [CrossRef] [PubMed]
- Cox, K.L.; Meng, F.; Wilkins, K.E.; Li, F.; Wang, P.; Booher, N.J.; Carpenter, S.C.D.; Chen, L.Q.; Zheng, H.; Gao, X.; et al. Tal effector driven induction of a SWEET gene confers susceptibility to bacterial blight of cotton. Nat. Commun. 2017, 8, 15588. [Google Scholar] [CrossRef] [PubMed]
- Zhang, Z.; Ruan, Y.L.; Zhou, N.; Wang, F.; Guan, X.; Fang, L.; Shang, X.; Guo, W.; Zhu, S.; Zhang, T. Suppressing a putative sterol carrier gene reduces plasmodesmal permeability and activates sucrose transporter genes during cotton fiber elongation. Plant Cell 2017, 29, 2027–2046. [Google Scholar] [CrossRef] [PubMed]
- Paterson, A.H.; Bowers, J.E.; Chapman, B.A. Ancient polyploidization predating divergence of the cereals, and its consequences for comparative genomics. Proc. Natl. Acad. Sci. USA 2004, 101, 9903–9908. [Google Scholar] [CrossRef] [PubMed]
- Paterson, A.H.; Wendel, J.F.; Gundlach, H.; Guo, H.; Jenkins, J.; Jin, D.; Llewellyn, D.; Showmaker, K.C.; Shu, S.; Udall, J.; et al. Repeated polyploidization of Gossypium genomes and the evolution of spinnable cotton fibres. Nature 2012, 492, 423–427. [Google Scholar] [CrossRef] [PubMed]
- Fei, H.; Kang, J.Q.; Xin, Z.; Zhen, S.; Qu, L.J.; Gu, H.Y. Variation at the transcriptional level among Chinese natural populations of Arabidopsis thaliana in response to cold stress. Chin. Sci. Bull. 2008, 53, 2989–2999. [Google Scholar]
- Seo, P.J.; Park, J.M.; Kang, S.K.; Kim, S.G.; Park, C.M. An Arabidopsis senescence-associated protein SAG29 regulates cell viability under high salinity. Planta 2011, 233, 189–200. [Google Scholar] [CrossRef] [PubMed]
- Lemoine, R.; La, C.S.; Atanassova, R.; Dédaldéchamp, F.; Allario, T.; Pourtau, N.; Bonnemain, J.L.; Laloi, M.; Coutos-Thévenot, P.; Maurousset, L.; et al. Source-to-sink transport of sugar and regulation by environmental factors. Front. Plant Sci. 2013, 4, 272. [Google Scholar] [CrossRef] [PubMed]
- Lescot, M.; Déhais, P.; Thijs, G.; Marchal, K.; Moreau, Y.; Peer, Y.V.D.; Rouz, P.; Rombauts, S. Plantcare, a database of plant cis-acting regulatory elements and a portal to tools for in silico analysis of promoter sequences. Nucleic Acids Res. 2002, 30, 325–327. [Google Scholar] [CrossRef] [PubMed]
- Phillips, A.Z.; Berry, J.C.; Wilson, M.C.; Vijayaraghavan, A.; Burke, J.; Bunn, J.I.; Allen, T.W.; Wheeler, T.; Bart, R.S. Genomics-enabled analysis of the emergent disease cotton bacterial blight. PLoS Genet. 2017, 13, e1007003. [Google Scholar] [CrossRef] [PubMed]
- Zhang, T.; Hu, Y.; Jiang, W.; Fang, L.; Guan, X.; Chen, J.; Zhang, J.; Saski, C.A.; Scheffler, B.E.; Stelly, D.M.; et al. Sequencing of allotetraploid cotton (Gossypium hirsutum L. Acc. TM-1) provides a resource for fiber improvement. Nat. Biotechnol. 2015, 33, 531–537. [Google Scholar] [CrossRef] [PubMed]
- Li, F.; Fan, G.; Wang, K.; Sun, F.; Yuan, Y.; Song, G.; Li, Q.; Ma, Z.; Lu, C.; Zou, C. Genome sequence of the cultivated cotton Gossypium arboreum. Nat. Genet. 2014, 46, 567–572. [Google Scholar] [CrossRef] [PubMed]
- Wang, K.; Wang, Z.; Li, F.; Ye, W.; Wang, J.; Song, G.; Yue, Z.; Cong, L.; Shang, H.; Zhu, S.; et al. The draft genome of a diploid cotton Gossypium raimondii. Nat. Genet. 2012, 44, 1098–1103. [Google Scholar] [CrossRef] [PubMed]
- Yin, G.; Xu, H.; Xiao, S.; Qin, Y.; Li, Y.; Yan, Y.; Hu, Y. The large soybean (Glycine max) wrky tf family expanded by segmental duplication events and subsequent divergent selection among subgroups. BMC Plant Biol. 2013, 13, 148. [Google Scholar] [CrossRef] [PubMed]
- Dong, Y.; Li, C.; Zhang, Y.; He, Q.; Daud, M.K.; Chen, J.; Zhu, S. Glutathione s-transferase gene family in Gossypium raimondii and g. Arboreum: Comparative genomic study and their expression under salt stress. Front. Plant Sci. 2016, 7, 139. [Google Scholar] [CrossRef] [PubMed]
- Guo, X.; Wang, Y.; Lu, H.; Cai, X.; Wang, X.; Zhou, Z.; Wang, C.; Wang, Y.; Zhang, Z.; Wang, K.; et al. Genome-wide characterization and expression analysis of the aldehyde dehydrogenase ALDH) gene superfamily under abiotic stresses in cotton. Gene 2017, 628, 230–245. [Google Scholar] [CrossRef] [PubMed]
- Roulin, A.; Auer, P.L.; Libault, M.; Schlueter, J.; Farmer, A.; May, G.; Stacey, G.; Doerge, R.W.; Jackson, S.A. The fate of duplicated genes in a polyploid plant genome. Plant J. 2013, 73, 143–153. [Google Scholar] [CrossRef] [PubMed]
- Haecker, A.; Großhardt, R.; Geiges, B.; Sarkar, A.; Breuninger, H.; Herrmann, M.; Laux, T. Expression dynamics of wox genes mark cell fate decisions duringearly embryonic patterning in Arabidopsis thaliana. Development 2004, 131, 657–668. [Google Scholar] [CrossRef] [PubMed]
- Lynch, M.; Force, A. The probability of duplicate gene preservation by subfunctionalization. Genetics 2000, 154, 459–473. [Google Scholar] [PubMed]
- Sheehan, M.J.; Kennedy, L.M.; Costich, D.E.; Brutnell, T.P. Subfunctionalization of phyB1 and phyB2 in the control of seedling and mature plant traits in maize. Plant J. 2007, 49, 338–353. [Google Scholar] [CrossRef] [PubMed]
- Wendel, J.F. Gene duplication and evolutionary novelty in plants. New Phytol. 2009, 183, 557–564. [Google Scholar]
- Pandey, D.K.; Chaudhary, B. Evolutionary expansion and structural functionalism of the ancient family of profilin proteins. Gene 2017, 626, 70–86. [Google Scholar] [CrossRef] [PubMed]
- Solovyev, V.; Kosarev, P.; Seledsov, I.; Vorobyev, D. Automatic annotation of eukaryotic genes, pseudogenes and promoters. Genome Biol. 2006, 7, S10. [Google Scholar] [CrossRef] [PubMed]
- Kumar, S.; Stecher, G.; Tamura, K. Mega7: Molecular evolutionary genetics analysis version 7.0 for bigger datasets. Mol. Biol. Evol. 2016, 33, 1870–1874. [Google Scholar] [CrossRef] [PubMed]
- Guo, A.Y.; Zhu, Q.H.; Chen, X.; Luo, J.C. GSDS: A gene structure display server. Hereditas 2007, 29, 1023–1026. [Google Scholar] [CrossRef] [PubMed]
- Liu, W.; Li, W.; He, Q.; Daud, M.K.; Chen, J.; Zhu, S. Characterization of 19 genes encoding membrane-bound fatty acid desaturases and their expression profiles in Gossypium raimondii under low temperature. PLoS ONE 2015, 10, e0123281. [Google Scholar] [CrossRef] [PubMed]
- Krzywinski, M.; Schein, J.; Birol, I.; Connors, J.; Gascoyne, R.; Horsman, D.; Jones, S.J.; Marra, M.A. Circos: An information aesthetic for comparative genomics. Genome Res. 2009, 19, 1639–1645. [Google Scholar] [CrossRef] [PubMed]
- Messer, P.W.; Arndt, P.F. The majority of recent short DNA insertions in the human genome are tandem duplications. Mol. Biol. Evol. 2007, 24, 1190–1197. [Google Scholar] [CrossRef] [PubMed]
- Cui, Y.; Zhao, Y.; Wang, Y.; Liu, Z.; Ijaz, B.; Huang, Y.; Hua, J. Genome-wide identification and expression analysis of the biotin carboxyl carrier subunits of heteromeric acetyl-coa carboxylase in Gossypium. Front. Plant Sci. 2017, 8, 624. [Google Scholar] [CrossRef] [PubMed]
- Wang, J.; Sun, N.; Deng, T.; Zhang, L.; Zuo, K. Genome-wide cloning, identification, classification and functional analysis of cotton heat shock transcription factors in cotton (Gossypium hirsutum). BMC Genom. 2014, 15, 961. [Google Scholar] [CrossRef] [PubMed]
- Sturn, A.; Quackenbush, J.; Trajanoski, Z. Genesis: Cluster analysis of microarray data. Bioinformatics 2002, 18, 207–208. [Google Scholar] [CrossRef] [PubMed]
- Schmittgen, T.D.; Livak, K.J. Analyzing Real-time PCR data by the comparative c(t) method. Nat. Protoc. 2008, 3, 1101–1108. [Google Scholar] [CrossRef] [PubMed]
- Wang, M.; Tu, L.; Lin, M.; Lin, Z.; Wang, P.; Yang, Q.; Ye, Z.; Shen, C.; Li, J.; Zhang, L.; et al. Asymmetric subgenome selection and cis-regulatory divergence during cotton domestication. Nat. Genet. 2017, 49, 579–587. [Google Scholar] [CrossRef] [PubMed]
- Rousset, F. Genepop’007: A complete re-implementation of the genepop software for windows and linux. Mol. Ecol. Res. 2008, 8, 103–106. [Google Scholar] [CrossRef] [PubMed]


| Gene Name | Locus ID | Protein Length (aa) | MW (Da) | pI | Chromosome | Strand | Location |
|---|---|---|---|---|---|---|---|
| GhSWEET1 a | Gh_A01G0160 | 308 | 34,313.8 | 6.39 | A01 | Plus | 1,535,209—1,538,355 |
| GhSWEET2 a | Gh_D01G0202 | 311 | 34,634.0 | 5.58 | D01 | Plus | 1,717,547—1,720,877 |
| GhSWEET3 | Gh_A02G0694 | 252 | 27,923.1 | 10.03 | A02 | Plus | 11,719,940—11,721,641 |
| GhSWEET4 | Gh_A02G0950 | 295 | 33,137.6 | 6.99 | A02 | Minus | 39,459,757—39,462,756 |
| GhSWEET5 a | Gh_D02G0542 | 237 | 25,846.9 | 8.41 | D02 | Minus | 7,239,140—7,241,801 |
| GhSWEET6 | Gh_D02G0740 | 252 | 27,953.1 | 10.03 | D02 | Plus | 11,060,974—11,062,676 |
| GhSWEET7 | Gh_D02G1767 | 283 | 31,651.9 | 7.84 | D02 | Minus | 60,142,543—60,144,477 |
| GhSWEET8 a | Gh_A03G0461 | 315 | 36,712.1 | 9.97 | A03 | Plus | 10,189,210—10,190,467 |
| GhSWEET9 | Gh_D03G0812 | 255 | 28,298.8 | 9.88 | D03 | Plus | 27,825,277—27,828,205 |
| GhSWEET10 | Gh_D03G1078 | 306 | 34,864.5 | 9.09 | D03 | Minus | 35,954,015—35,955,277 |
| GhSWEET11 | Gh_A04G0861 | 289 | 32,503.8 | 7.90 | A04 | Minus | 55,950,153—55,951,883 |
| GhSWEET12 | Gh_D04G0509 | 257 | 28,434.0 | 9.08 | D04 | Plus | 8,687,271—8,689,780 |
| GhSWEET13 | Gh_D04G0510 | 237 | 26,541.9 | 9.22 | D04 | Plus | 8,700,584—8,702,611 |
| GhSWEET14 | Gh_D04G1360 | 289 | 32,430.8 | 7.90 | D04 | Minus | 44,257,813—44,259,535 |
| GhSWEET15 | Gh_A05G3127 | 237 | 26,556.0 | 9.22 | A05 | Minus | 80,724,645—80,726,627 |
| GhSWEET16 a | Gh_A05G3128 | 257 | 28,415.9 | 9.41 | A05 | Minus | 80,737,385—80,739,919 |
| GhSWEET17 a | Gh_D05G1448 | 230 | 26,064.4 | 7.18 | D05 | Minus | 12,908,186—12,909,403 |
| GhSWEET18 a | Gh_A07G0421 | 276 | 30,996.2 | 9.64 | A07 | Plus | 5,396,344—5,398,990 |
| GhSWEET19 | Gh_A07G0422 | 280 | 31,849.3 | 9.74 | A07 | Plus | 5,417,794—5,419,168 |
| GhSWEET20 | Gh_A07G0423 | 277 | 31,350.6 | 9.61 | A07 | Plus | 5,441,891—5,443,770 |
| GhSWEET21 a | Gh_A07G0535 | 235 | 26,705.5 | 9.96 | A07 | Minus | 7,195,579—7,196,830 |
| GhSWEET22 | Gh_D07G0486 | 274 | 30,709.0 | 9.63 | D07 | Plus | 5,386,349—5,388,888 |
| GhSWEET23 a | Gh_D07G0487 | 280 | 31,876.4 | 9.74 | D07 | Plus | 5,393,200—5,394,555 |
| GhSWEET24 a | Gh_D07G0604 | 235 | 26,719.5 | 9.96 | D07 | Minus | 6,953,608—6,954,845 |
| GhSWEET25 | Gh_A08G0663 | 275 | 30,950.1 | 9.18 | A08 | Minus | 13,836,649—13,837,903 |
| GhSWEET26 a | Gh_D08G1194 | 258 | 22,445.5 | 9.80 | D08 | Plus | 38,403,775—38,405,327 |
| GhSWEET27 a | Gh_A09G1524 | 250 | 13,186.5 | 9.50 | A09 | Minus | 68,504,026—68,505,455 |
| GhSWEET28 | Gh_A10G1468 | 229 | 24,973.0 | 7.40 | A10 | Minus | 79,914,294—79,915,964 |
| GhSWEET29 a | Gh_D10G0303 | 230 | 20,367.1 | 9.64 | D10 | Minus | 2,608,669—2,610,376 |
| GhSWEET30 | Gh_D10G1709 | 229 | 24,987.0 | 7.40 | D10 | Minus | 47,620,123—47,621,535 |
| GhSWEET31 | Gh_A11G0347 | 298 | 33,545.7 | 8.12 | A11 | Minus | 3,182,270—3,183,655 |
| GhSWEET32 a | Gh_A11G2442 | 238 | 26,970.4 | 7.89 | A11 | Minus | 82,756,807—82,758,639 |
| GhSWEET33 | Gh_A11G2446 | 300 | 32,893.8 | 9.72 | A11 | Minus | 82,867,355—82,869,323 |
| GhSWEET34 | Gh_A11G2655 | 251 | 28,283.5 | 9.25 | A11 | Plus | 88,688,141—88,689,610 |
| GhSWEET35 | Gh_D11G0404 | 298 | 33,559.8 | 8.34 | D11 | Minus | 3,381,068—3,382,434 |
| GhSWEET36 a | Gh_D11G2760 | 234 | 26,215.2 | 8.15 | D11 | Minus | 57,260,671—57,262,412 |
| GhSWEET37 a | Gh_D11G2763 | 301 | 33,196.0 | 8.79 | D11 | Minus | 57,340,382—57,342,337 |
| GhSWEET38 | Gh_D11G2975 | 234 | 26,205.7 | 9.32 | D11 | Plus | 60,589,364—60,591,634 |
| GhSWEET39 a | Gh_A12G1747 | 295 | 33,121.3 | 7.09 | A12 | Minus | 79,539,983—79,541,579 |
| GhSWEET40 | Gh_A12G2152 | 254 | 28,192.6 | 10.07 | A12 | Minus | 84,324,046—84,326,052 |
| GhSWEET41 a | Gh_D12G1898 | 295 | 33,145.2 | 6.39 | D12 | Minus | 51,822,209—51,825,243 |
| GhSWEET42 | Gh_D12G2328 | 254 | 28,177.6 | 9.98 | D12 | Minus | 56,415,133—56,417,086 |
| GhSWEET43 | Gh_A13G0907 | 249 | 26,768.6 | 8.59 | A13 | Minus | 47,687,824—47,689,812 |
| GhSWEET44 a | Gh_A13G1434 | 269 | 30,513.0 | 8.89 | A13 | Plus | 72,034,747—72,035,999 |
| GhSWEET45 | Gh_A13G1540 | 245 | 27,174.2 | 8.60 | A13 | Minus | 73,975,893—73,977,109 |
| GhSWEET46 a | Gh_D13G1146 | 249 | 27,432.3 | 7.43 | D13 | Minus | 34,001,023—34,002,217 |
| GhSWEET47 | Gh_D13G1148 | 248 | 26,555.3 | 9.14 | D13 | Minus | 34,107,380—34,109,414 |
| GhSWEET48 a | Gh_D13G1763 | 269 | 30,478.9 | 8.89 | D13 | Minus | 52,413,794—52,414,799 |
| GhSWEET49 | Gh_D13G1875 | 245 | 27,108.2 | 8.60 | D13 | Minus | 53,858,190—53,859,414 |
| GhSWEET50 | Gh_A02G1806 | 250 | 27,450.6 | 9.85 | scaffold476_A02 | Plus | 194,323—196,496 |
| GhSWEET51 | Gh_A11G3285 | 235 | 26,286.6 | 8.85 | scaffold3047_A11 | Minus | 190,443—192,707 |
| GhSWEET52 | Gh_D03G1717 | 250 | 27,574.7 | 9.37 | scaffold3920_D03 | Plus | 575,817—577,994 |
| GhSWEET53 | Gh_D08G2730 | 275 | 30,879.1 | 9.18 | scaffold4310_D08 | Plus | 24,770—26,035 |
| GhSWEET54 a | Gh_D12G2692 | 252 | 16,414.6 | 8.47 | scaffold4580_D12 | Plus | 11,296—12,765 |
| GhSWEET55 | Gh_Sca013374G01 | 273 | 30,600.0 | 9.85 | scaffold13374 | Plus | 471—1,821 |
© 2018 by the authors. Licensee MDPI, Basel, Switzerland. This article is an open access article distributed under the terms and conditions of the Creative Commons Attribution (CC BY) license (http://creativecommons.org/licenses/by/4.0/).
Share and Cite
Li, W.; Ren, Z.; Wang, Z.; Sun, K.; Pei, X.; Liu, Y.; He, K.; Zhang, F.; Song, C.; Zhou, X.; et al. Evolution and Stress Responses of Gossypium hirsutum SWEET Genes. Int. J. Mol. Sci. 2018, 19, 769. https://doi.org/10.3390/ijms19030769
Li W, Ren Z, Wang Z, Sun K, Pei X, Liu Y, He K, Zhang F, Song C, Zhou X, et al. Evolution and Stress Responses of Gossypium hirsutum SWEET Genes. International Journal of Molecular Sciences. 2018; 19(3):769. https://doi.org/10.3390/ijms19030769
Chicago/Turabian StyleLi, Wei, Zhongying Ren, Zhenyu Wang, Kuan Sun, Xiaoyu Pei, Yangai Liu, Kunlun He, Fei Zhang, Chengxiang Song, Xiaojian Zhou, and et al. 2018. "Evolution and Stress Responses of Gossypium hirsutum SWEET Genes" International Journal of Molecular Sciences 19, no. 3: 769. https://doi.org/10.3390/ijms19030769