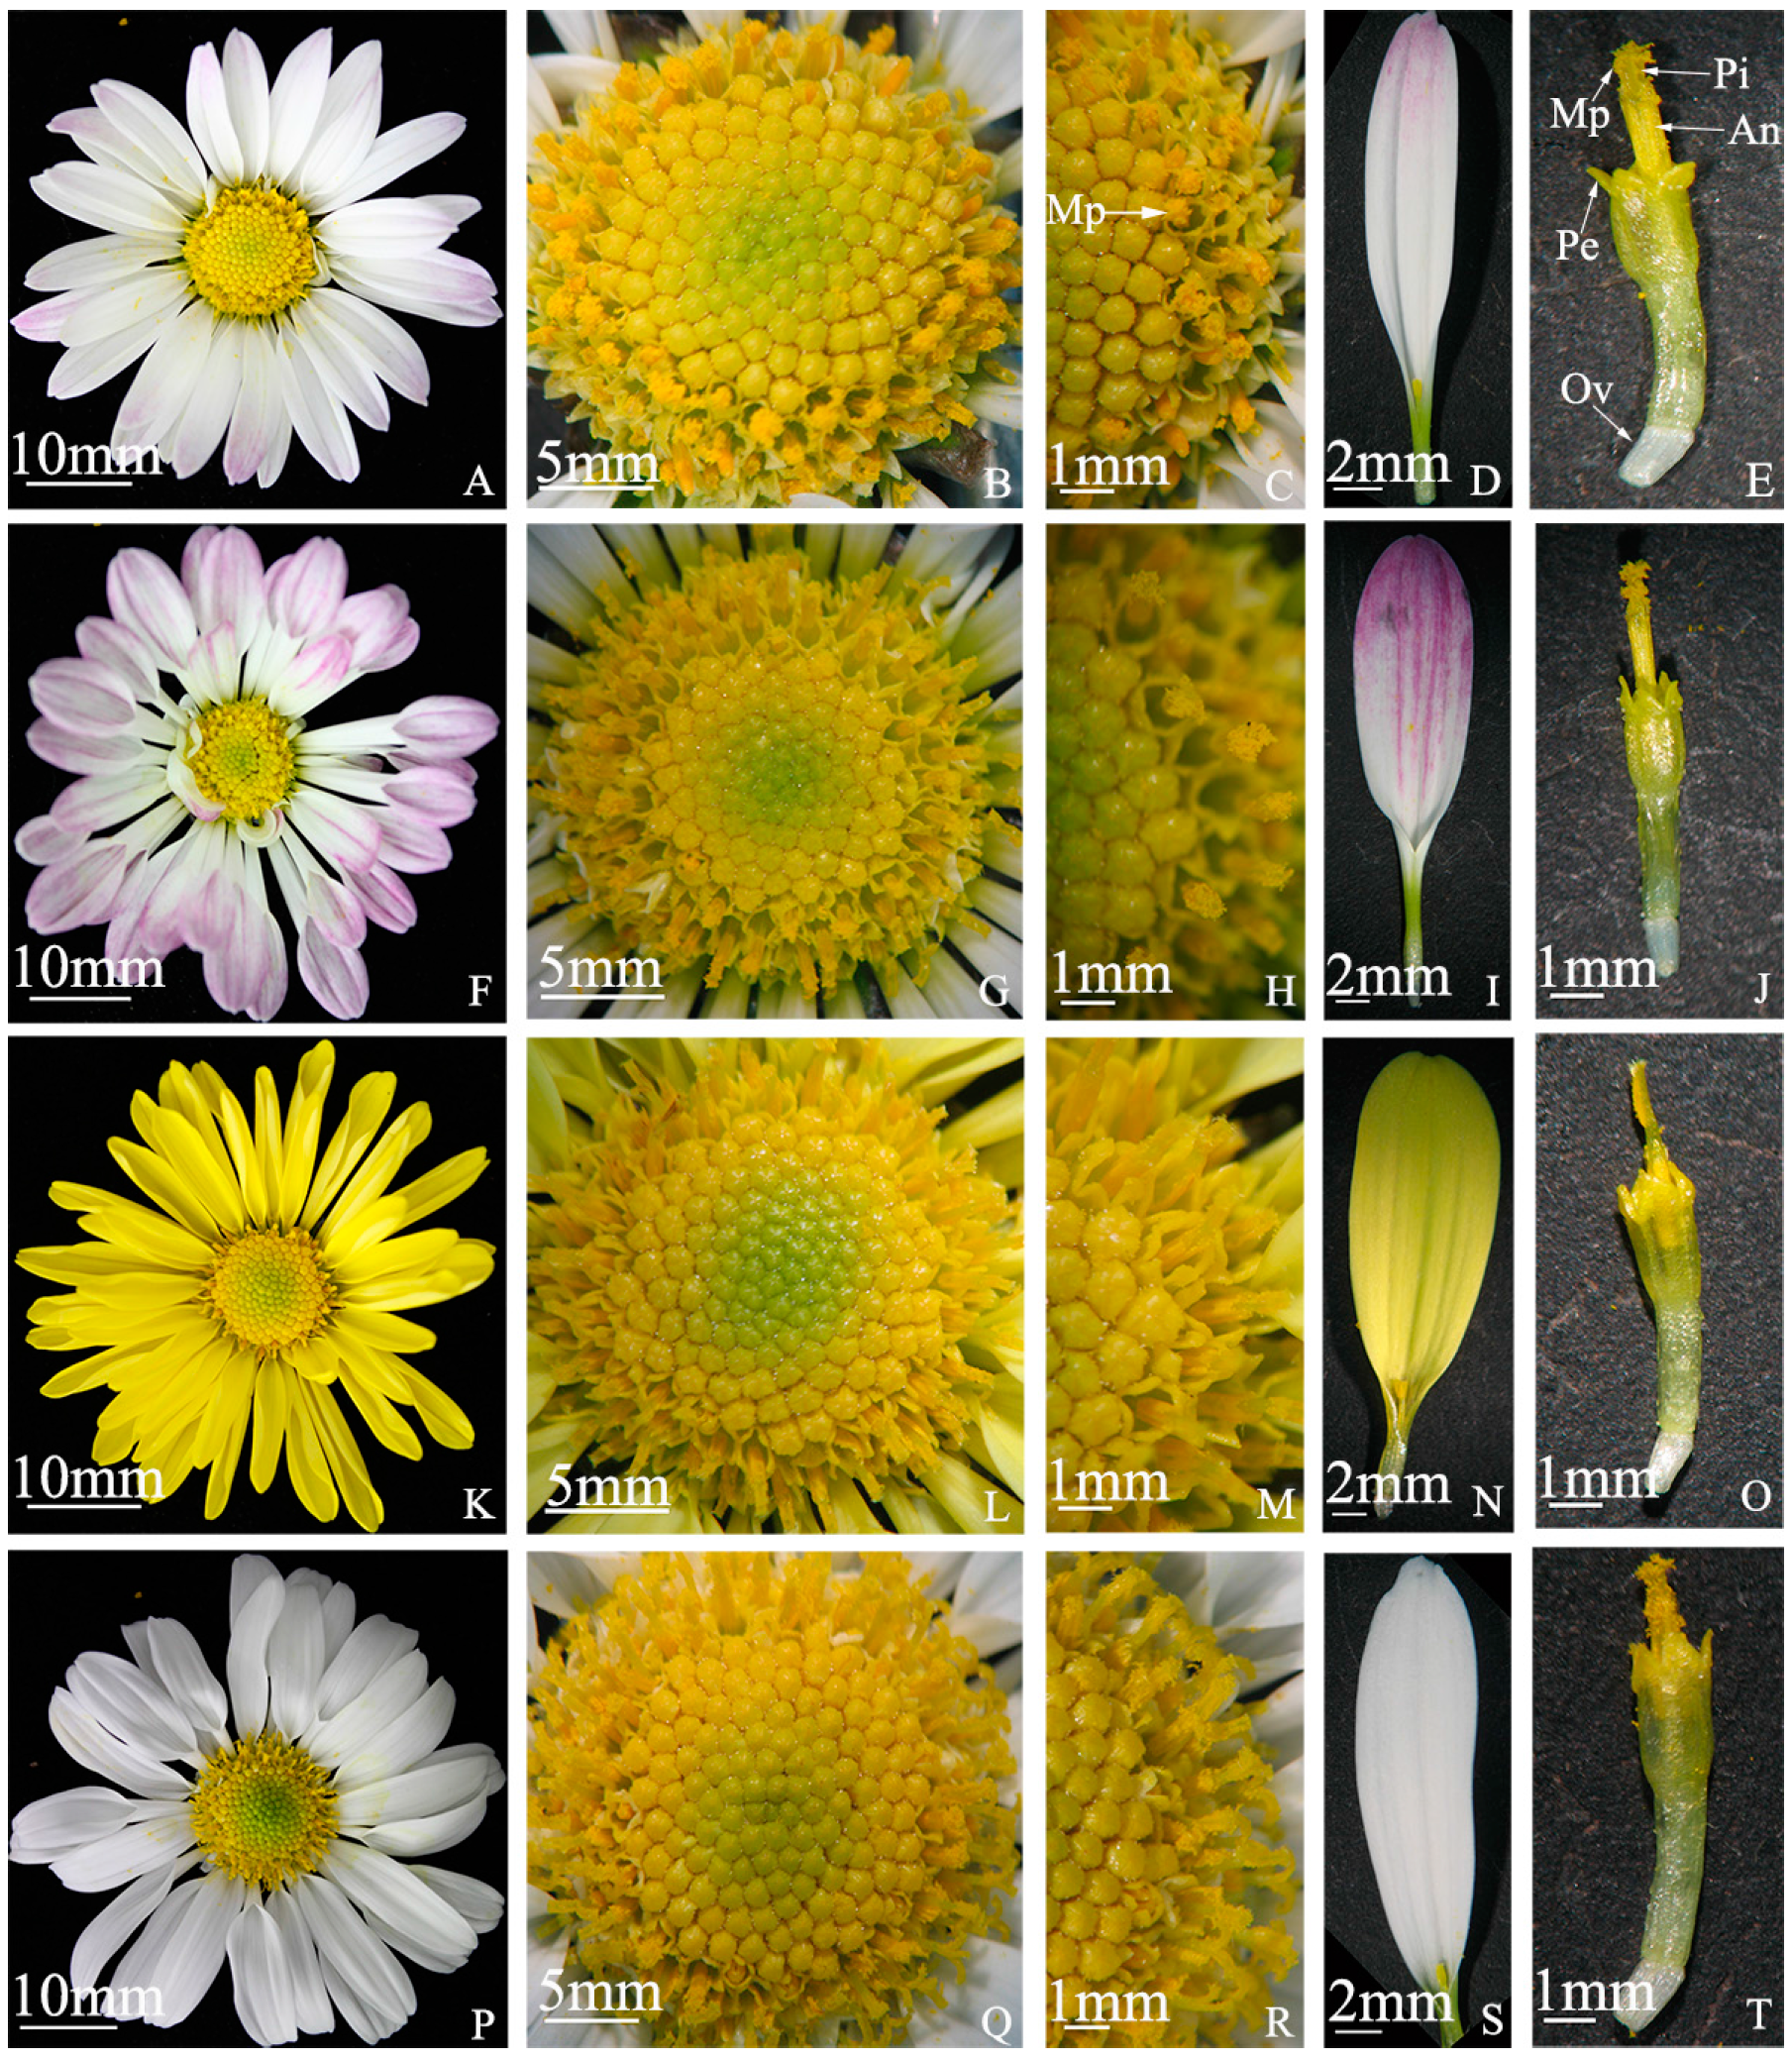
Figure 1.
Flowering traits of “Q10-33-1”’s four progenies. (A–E) “Q10-33-1①”; (F–J) “Q10-33-1③”; (K–O) “Q10-33-1④”; (P–T) “Q10-33-1⑩”. The first column is the whole inflorescence, the second column is the whole tubular flower, the third column is a part of the tubular flower, the fourth column is the ray floret, and the last column is the tubiform floret. Abbreviations: Mp: mass of pollen grains, An: anther, Pi: pistil, Pe: petal, Ov: ovary.
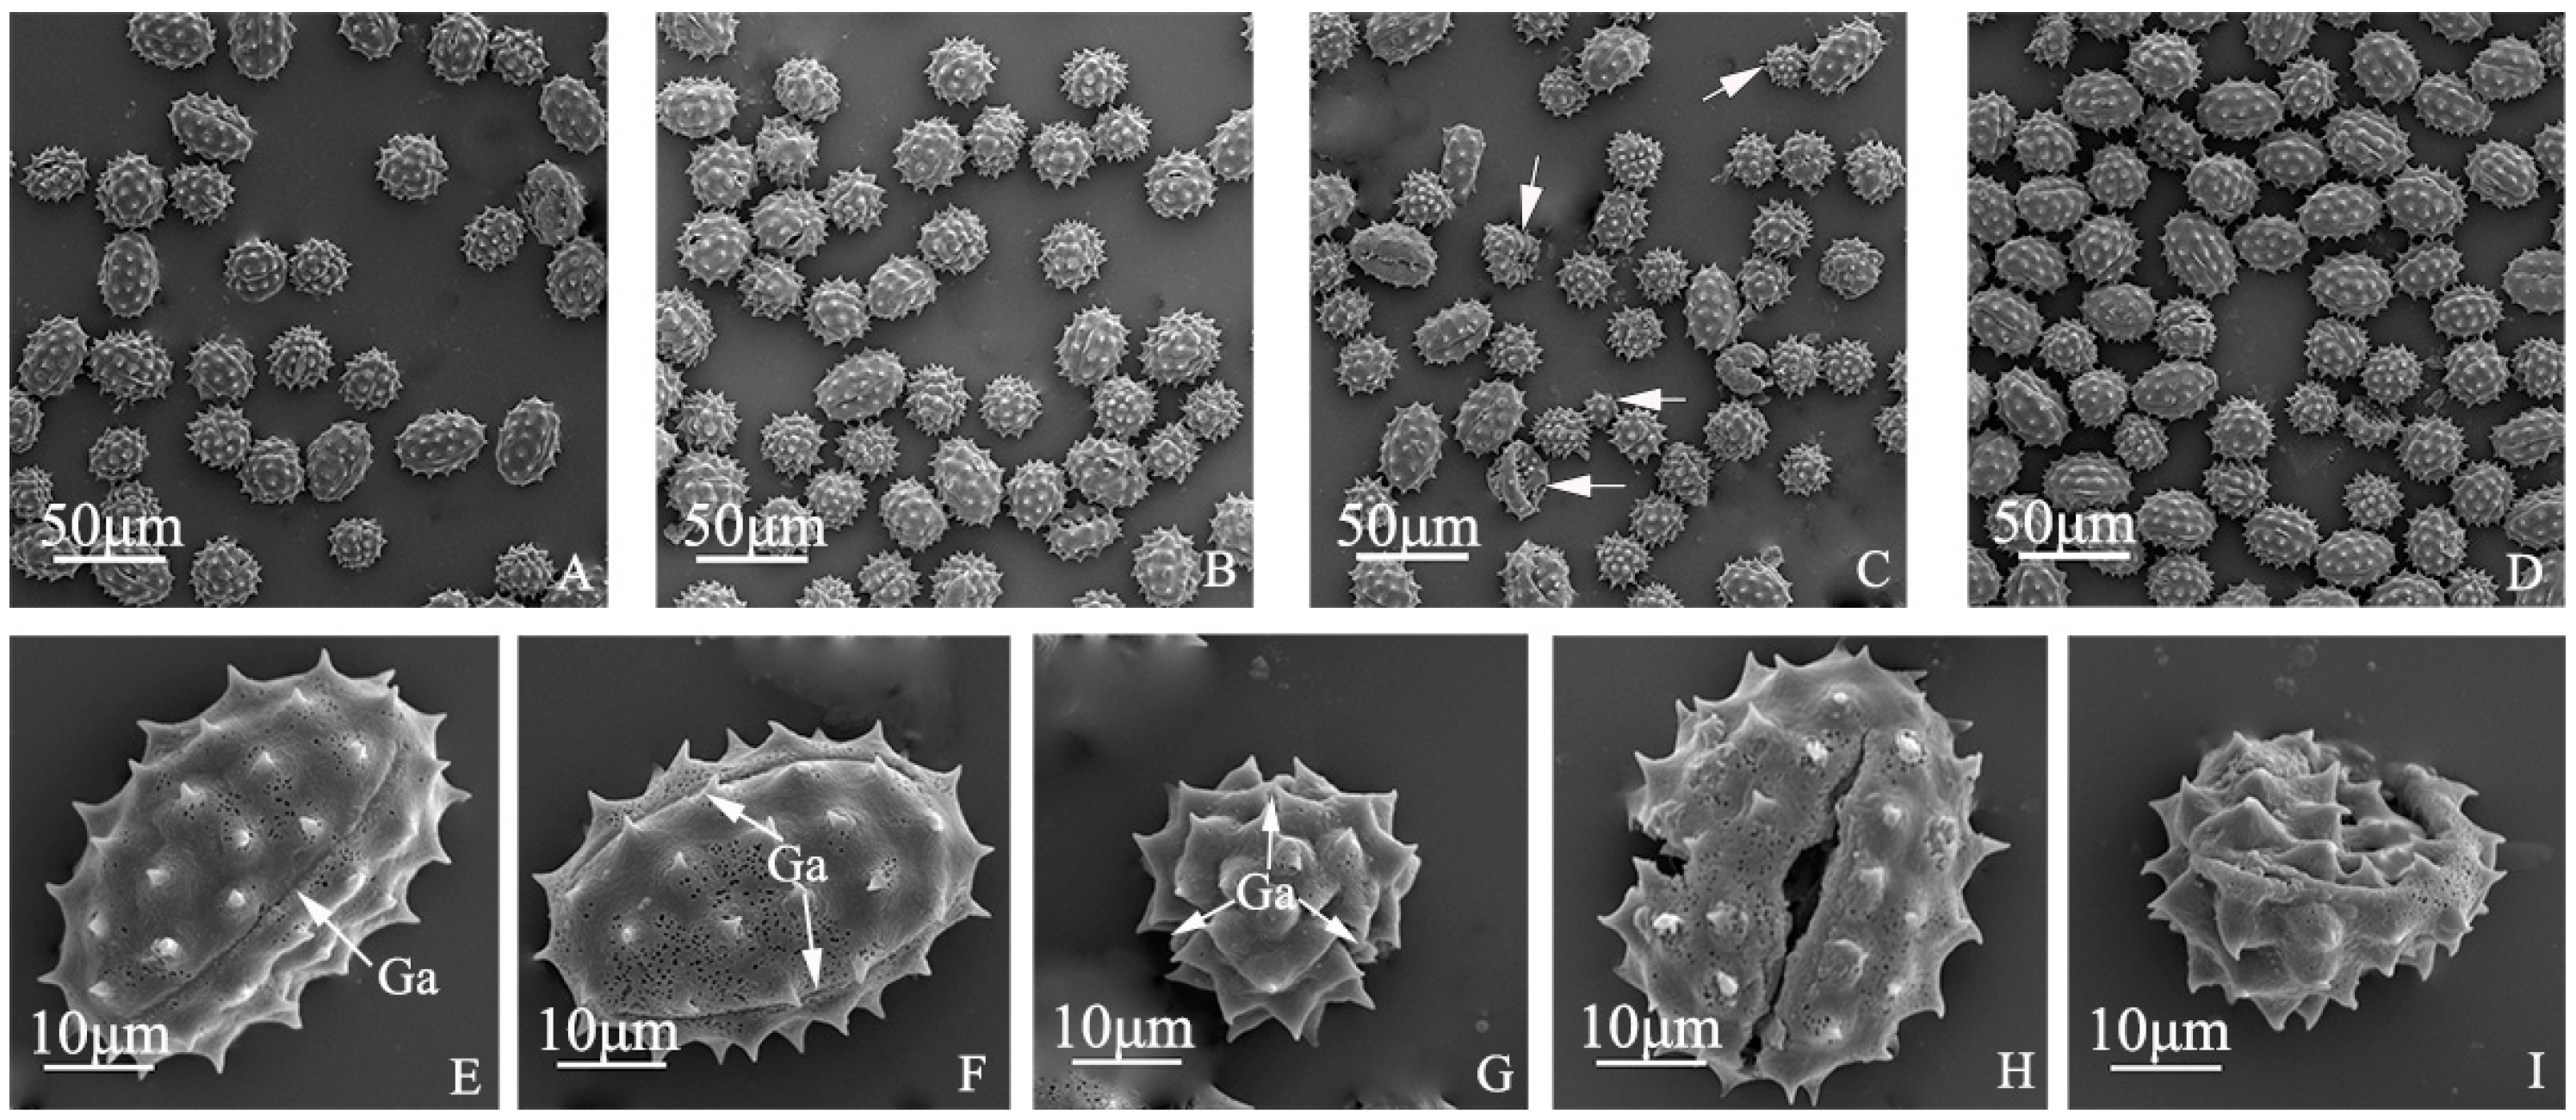
Figure 2.
Pollen morphology of “Q10-33-1”’s four progenies. (A) “Q10-33-1①”; (B) “Q10-33-1③”; (C) “Q10-33-1④”, the white arrows indicated abnormal pollen grains; (D) “Q10-33-1⑩”; (E–G) three germinal apertures in equatorial and polar view; (H, I) Abnormal pollen morphology. Abbreviations: Ga: germinal aperture.
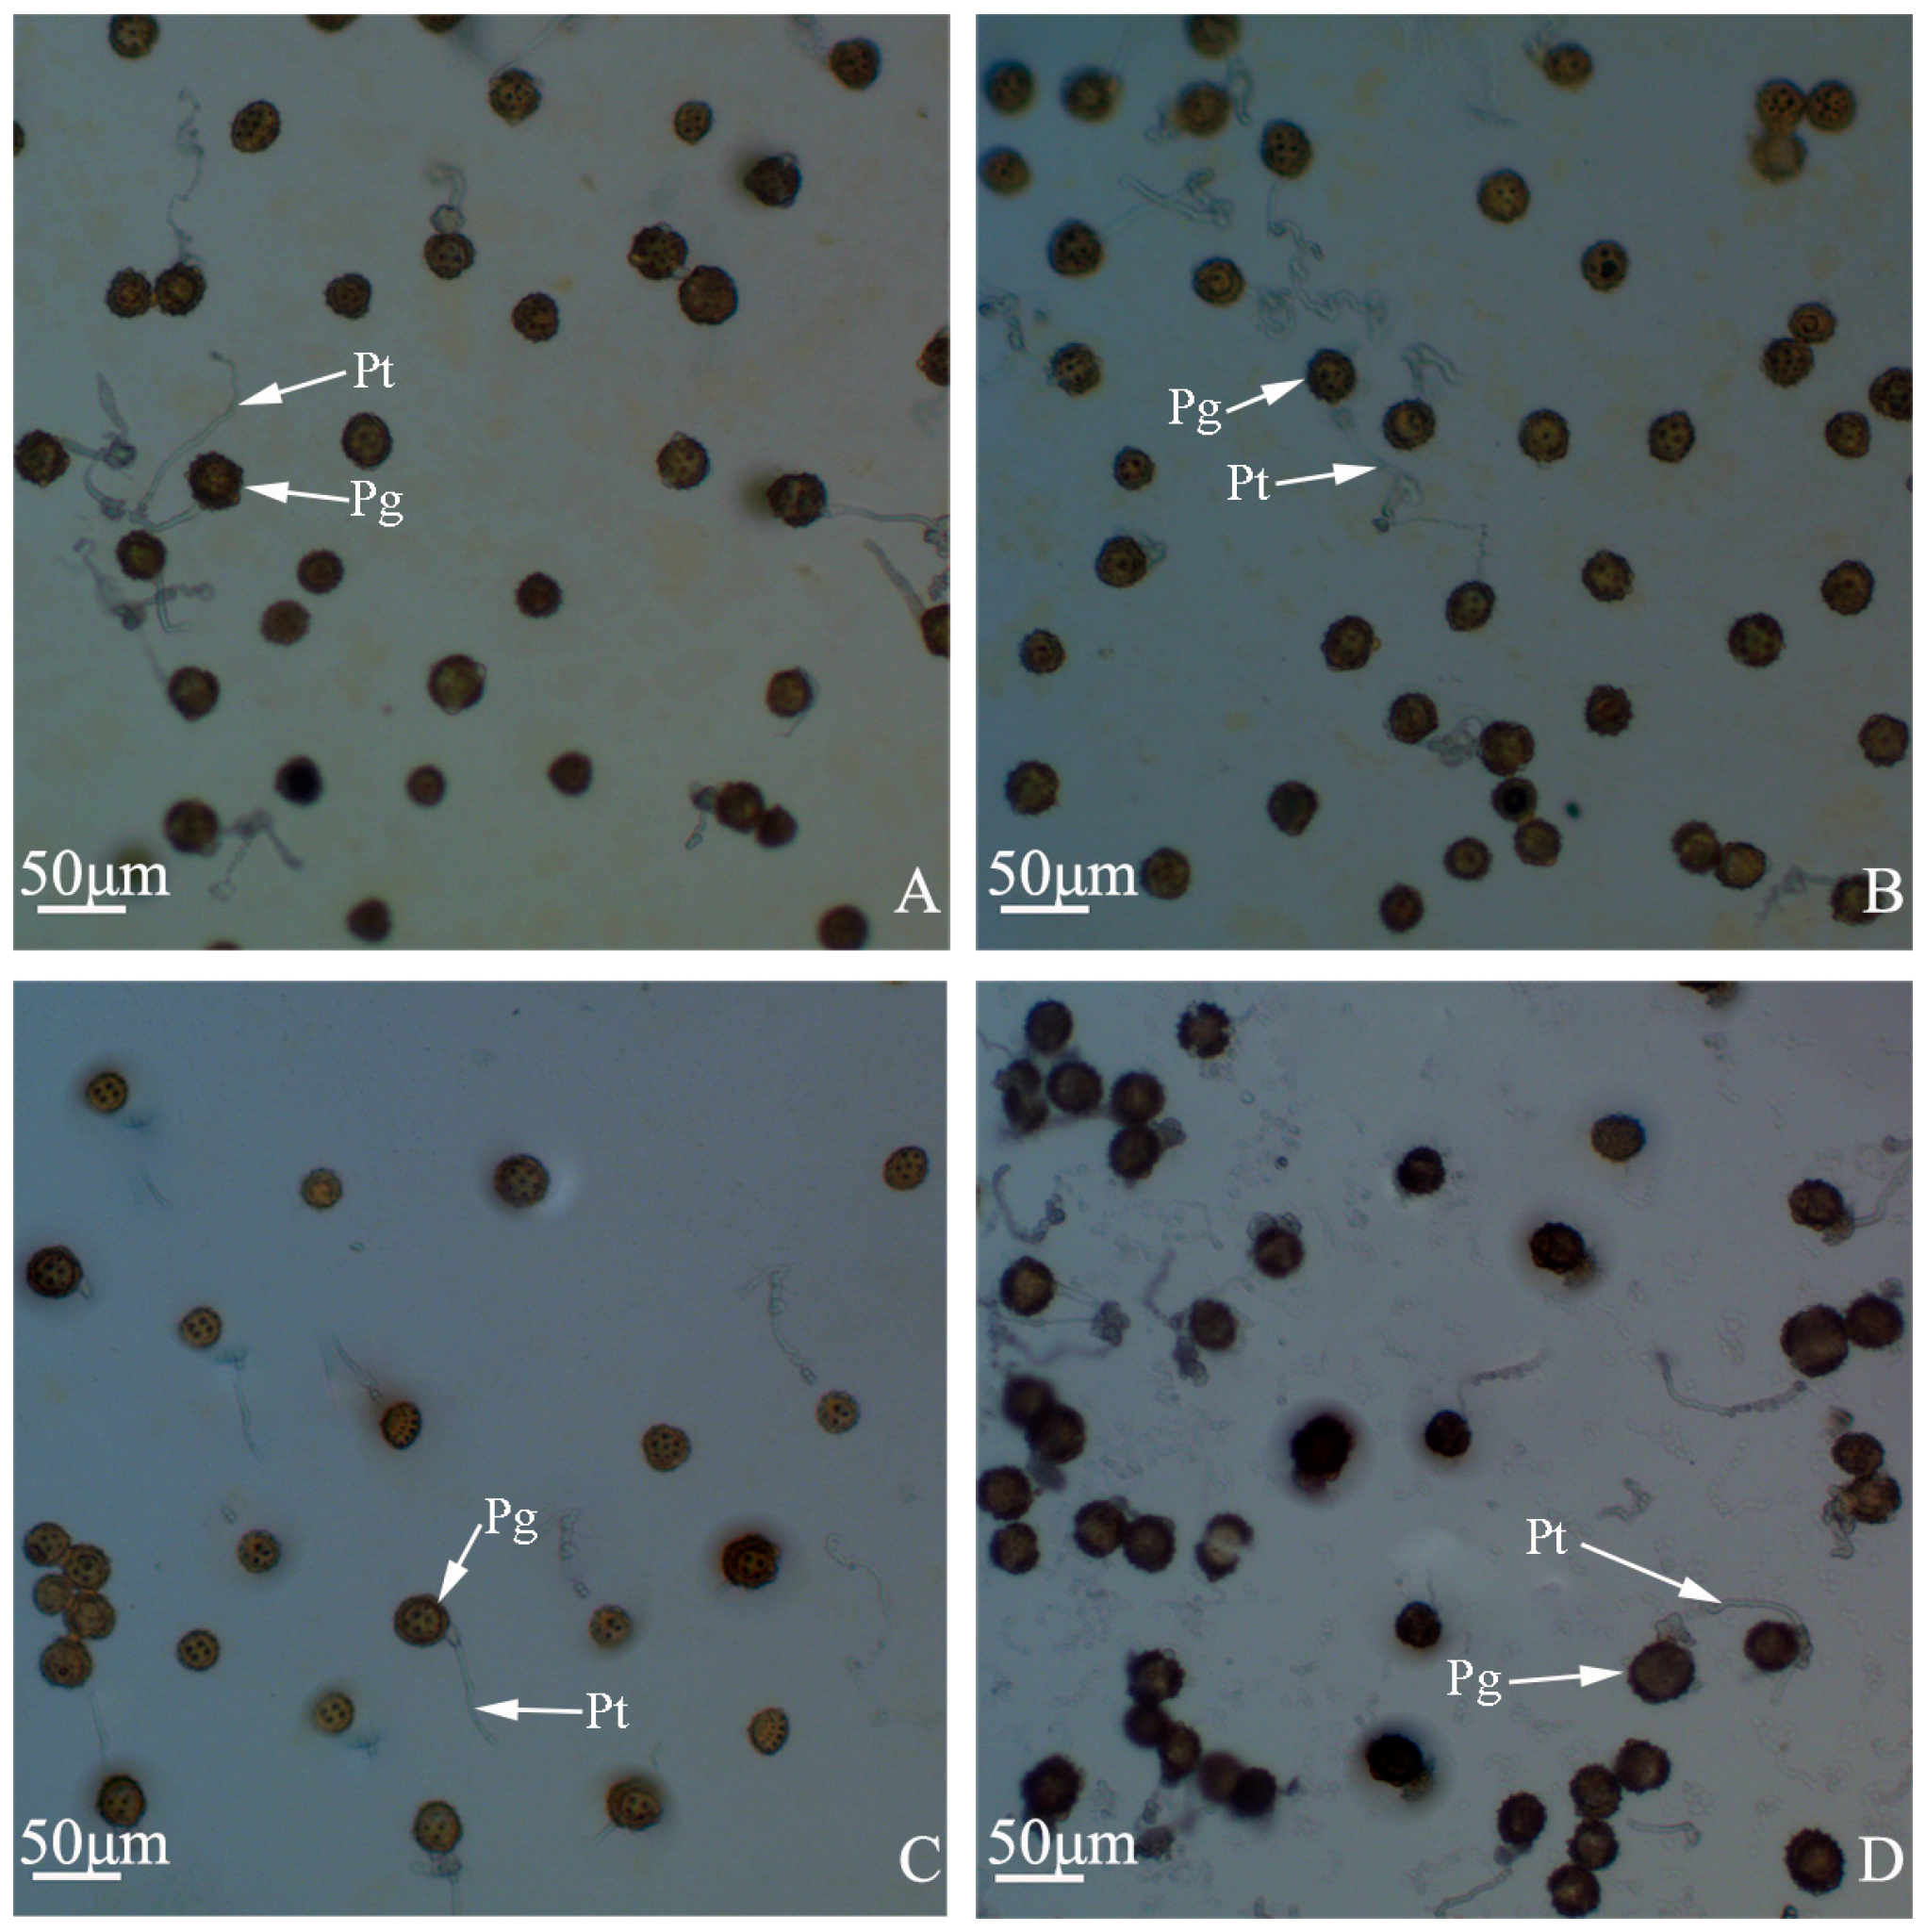
Figure 3.
Pollen germination percentages of “Q10-33-1”’s four progenies. (A) “Q10-33-1①”; (B) “Q10-33-1③”; (C) “Q10-33-1④”; (D) “Q10-33-1⑩”. Abbreviations: Pg: pollen grain, Pt: pollen tube.
Figure 3.
Pollen germination percentages of “Q10-33-1”’s four progenies. (A) “Q10-33-1①”; (B) “Q10-33-1③”; (C) “Q10-33-1④”; (D) “Q10-33-1⑩”. Abbreviations: Pg: pollen grain, Pt: pollen tube.
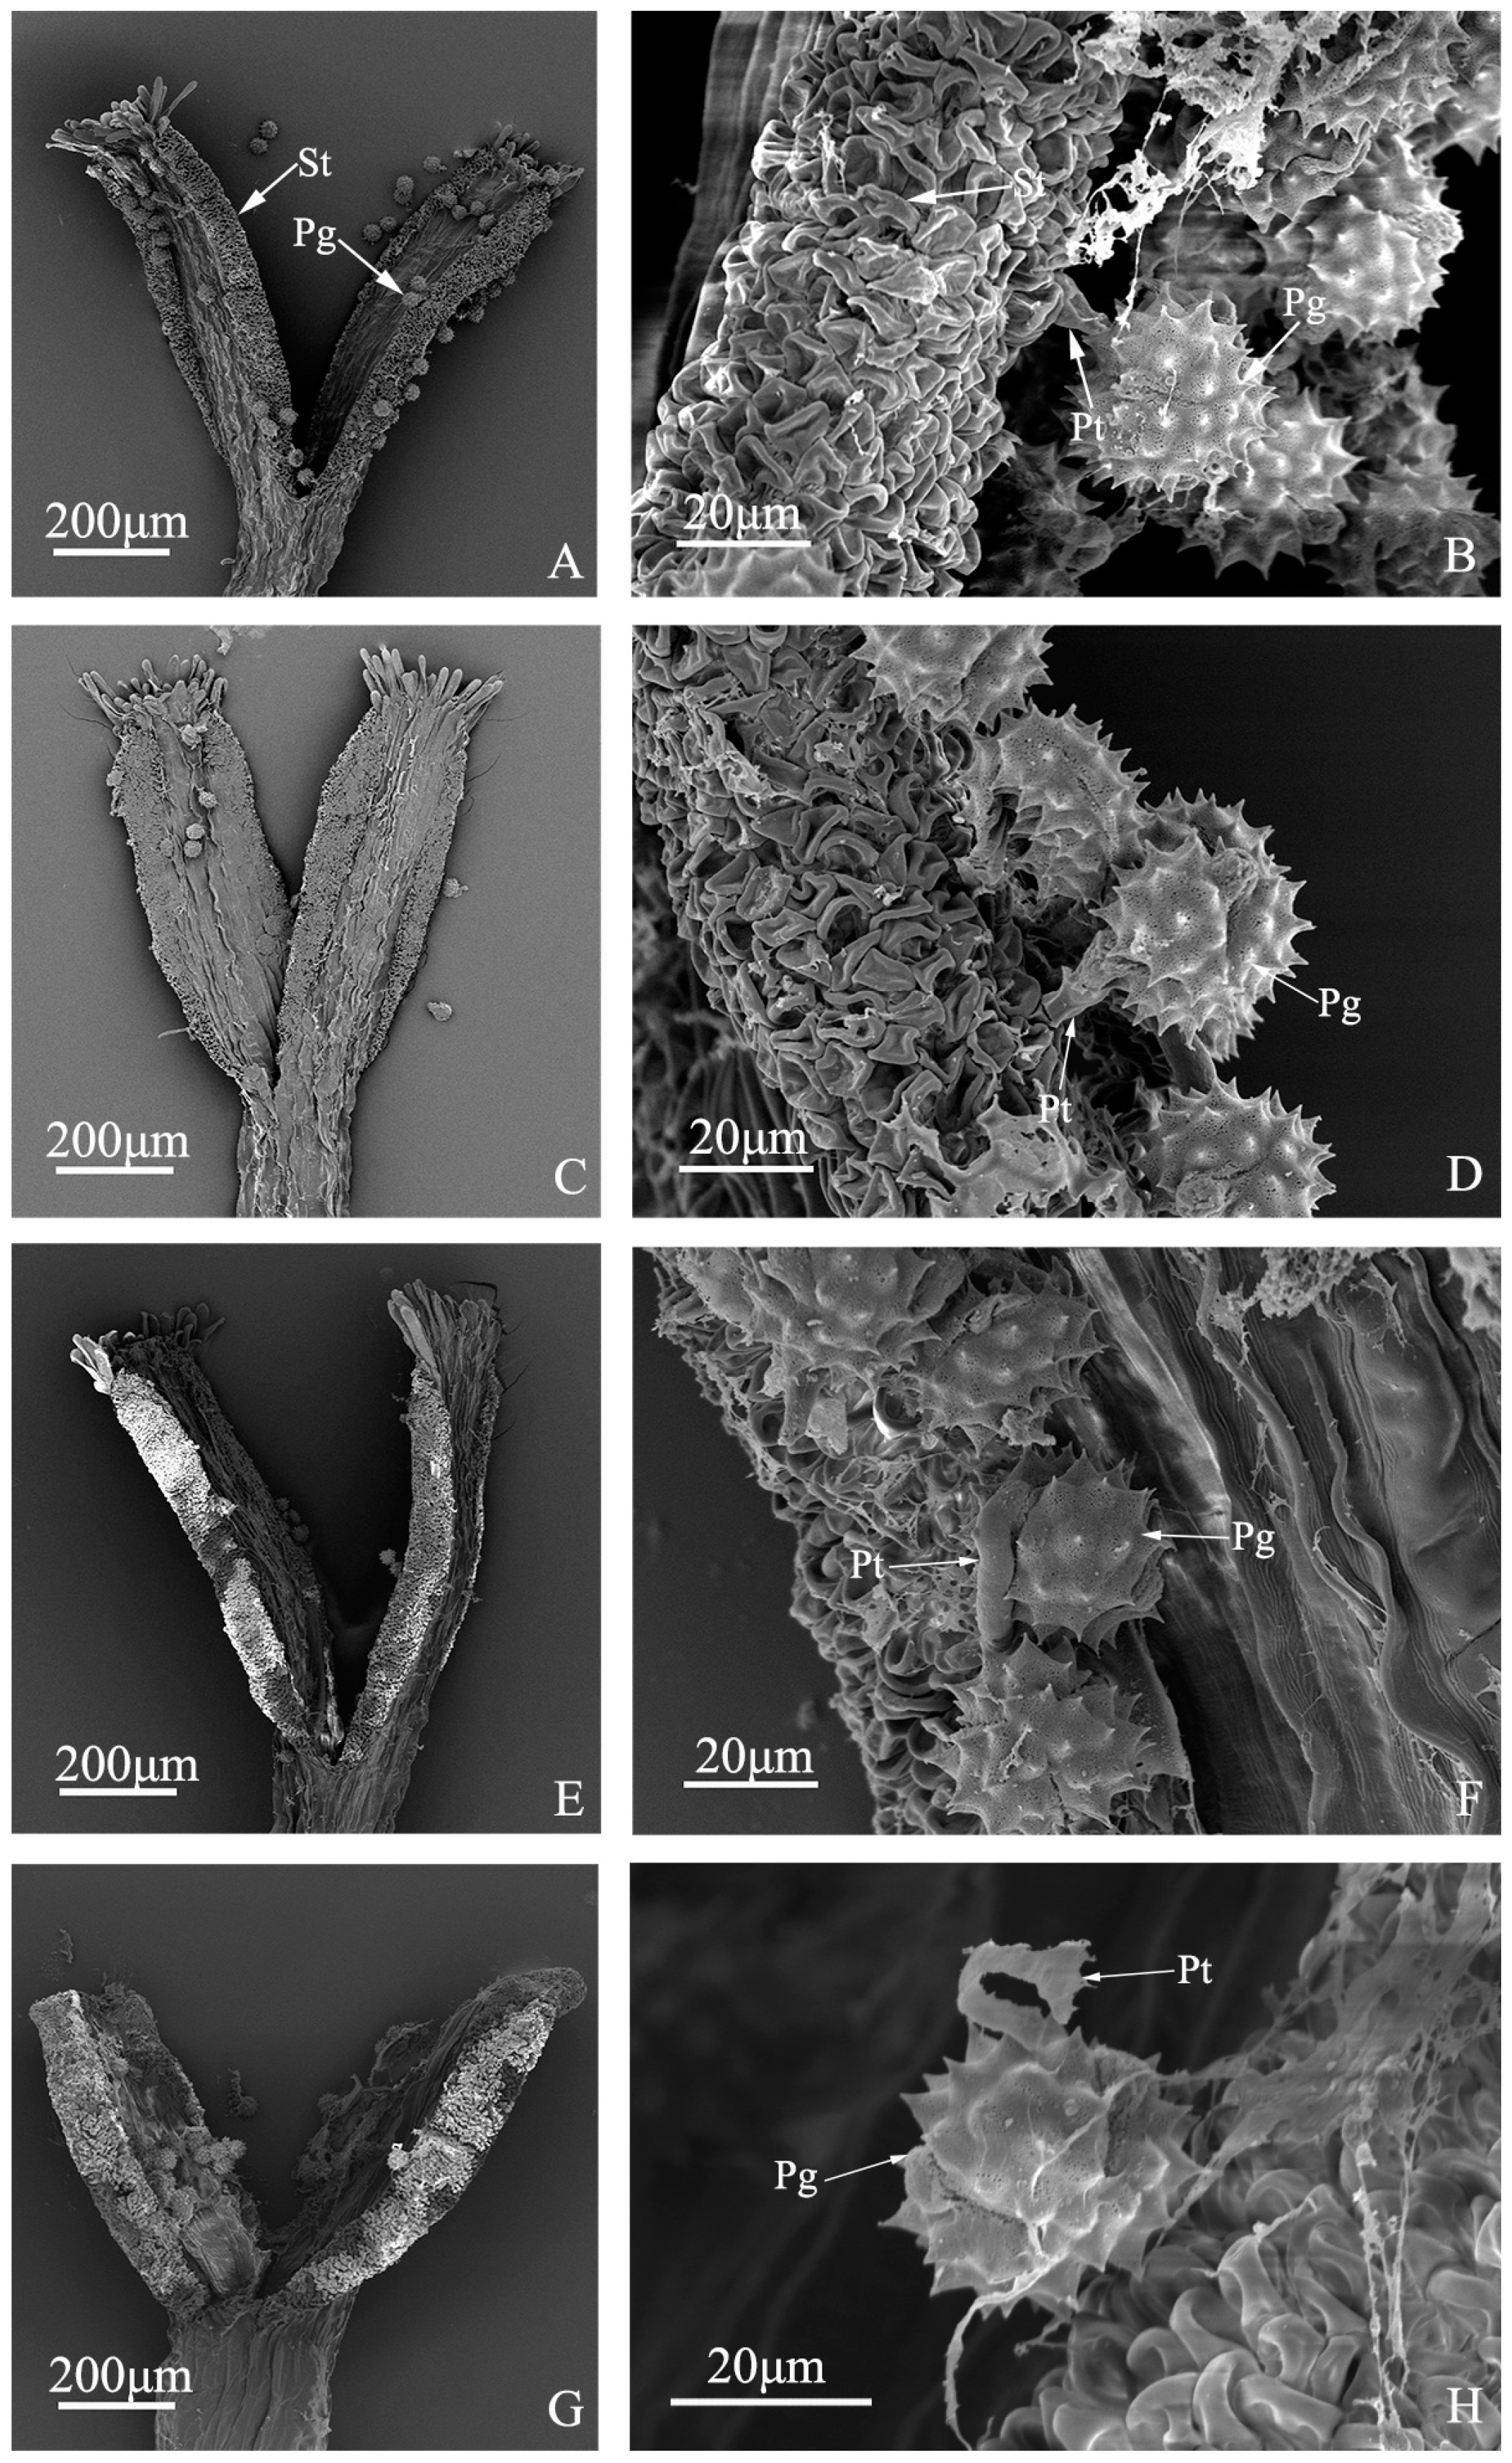
Figure 4.
Pollen tube growth of “Q10-33-1”’s four progenies at ultrastructural level. (A, B) “Q10-33-1①”; (C, D) “Q10-33-1③”; (E, F) “Q10-33-1④”; (G, H) “Q10-33-1⑩”; (B, D, F) Pollen tube grew into the stigma; (H) Pollen tube stopped growing and failed to penetrate the stigma’s surface. Abbreviations: St: stigma, Pg: pollen grain, Pt: pollen tube.
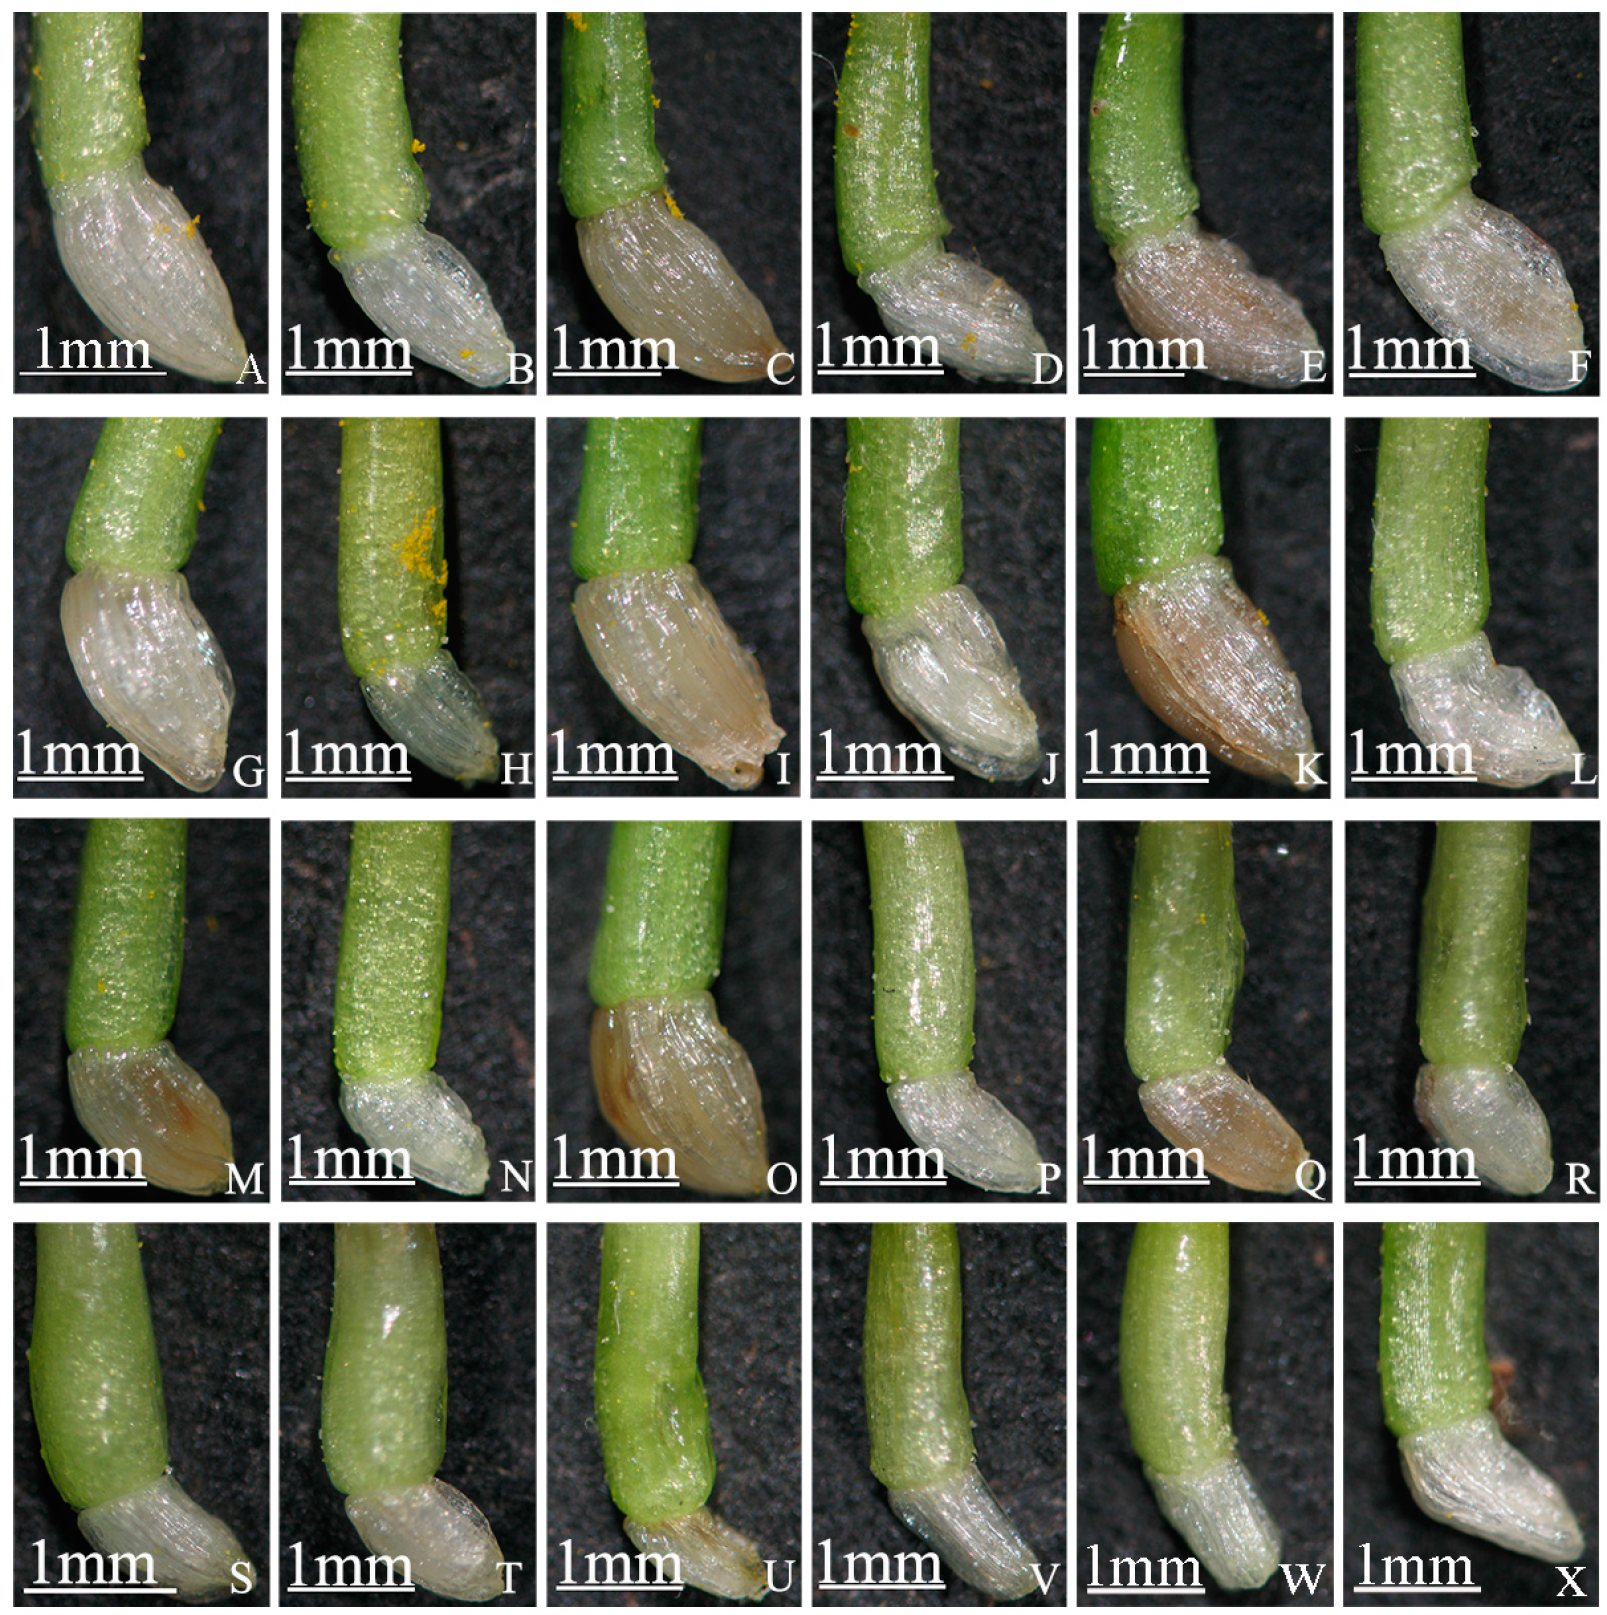
Figure 5.
Full and unful ovaries at different days after self-pollination in “Q10-33-1”’s four progenies. (A–F) “Q10-33-1①”; (G–L) “Q10-33-1③”; (M–R) “Q10-33-1④”; (S–U) “Q10-33-1⑩”; (V–X) Ovaries without pollination; (A, G, M) Full ovaries at 12 days after self-pollination; (B, H, N, S) Unful ovaries at 12 days after self-pollination; (C, I, O) Full ovaries at 18 days after self-pollination; (D, J, P, T) Unful ovaries at 18 days after self-pollination; (E, K, Q) Full ovaries at 30 days after self-pollination; (F, L, R, U) Unful ovaries at 30 days after self-pollination.
Figure 6.
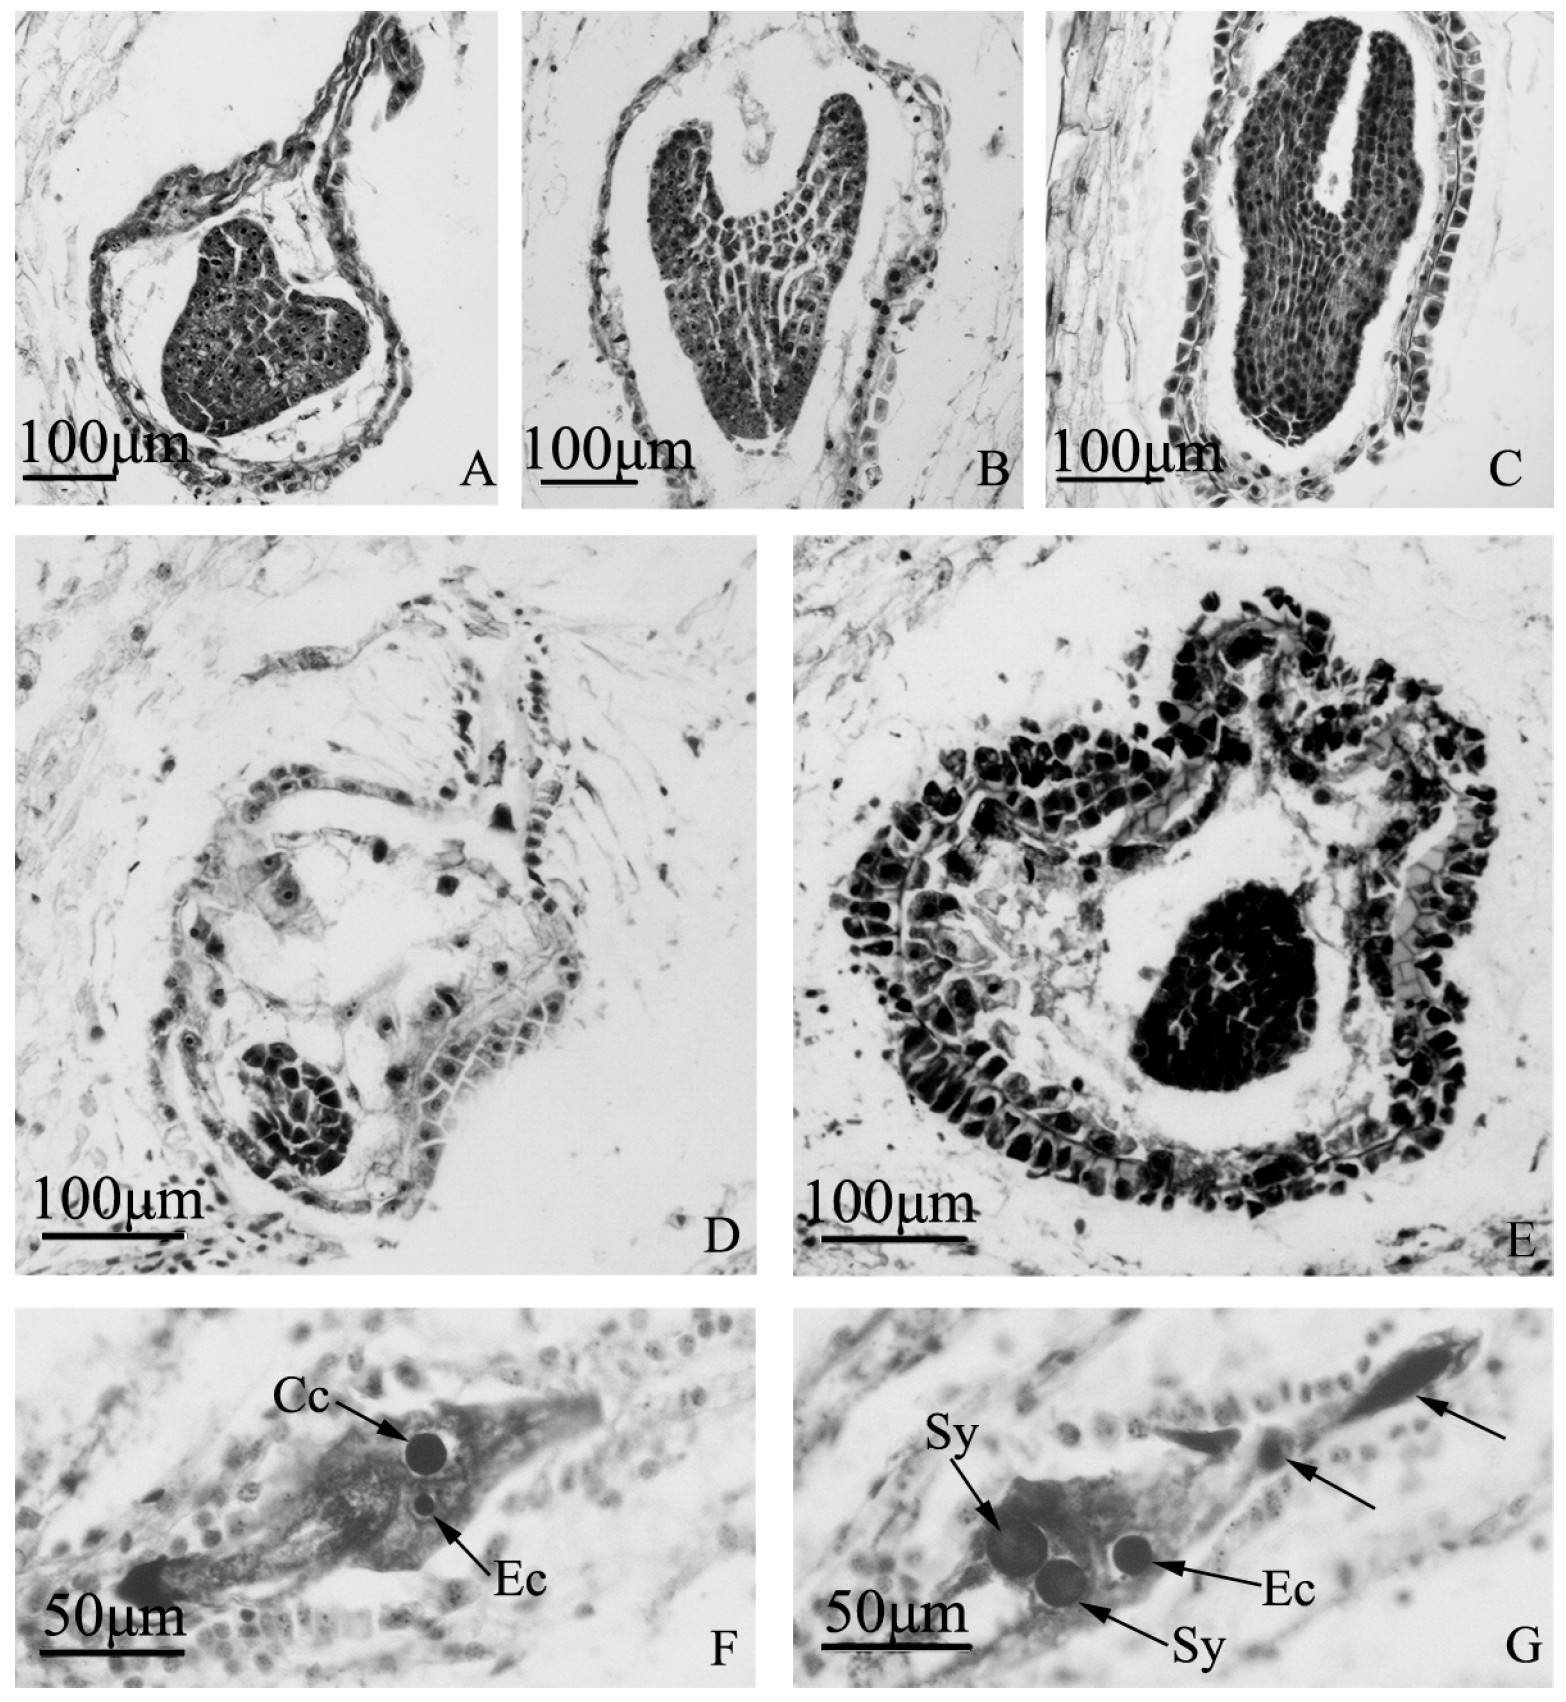
Embryo development of “Q10-33-1”’s three progenies at microscopic level. (A–C) Normal embryo development of “Q10-33-1①”; (A) Heart embryo at 12 days after self-pollination; (B) Torpedo embryo at 18 days after self-pollination; (C) Cotyledon embryo at 18 days after self-pollination; (D, E) Embryo abortion of “Q10-33-1④”; (D) Embryo abortion at 12 days after self-pollination, the embryo was degenerating; (E) Embryo abortion at 18 days after self-pollination, the embryo was degenerating and the integument was thickening; (F, G) Unfertilized ovules of “Q10-33-1⑩”, tetranucleate embryo sacs, two black arrows indicated two degenerated megaspores. Abbreviations: Cc: central cell, Ec: egg cell, Sy: synergid.
Figure 6.
Embryo development of “Q10-33-1”’s three progenies at microscopic level. (A–C) Normal embryo development of “Q10-33-1①”; (A) Heart embryo at 12 days after self-pollination; (B) Torpedo embryo at 18 days after self-pollination; (C) Cotyledon embryo at 18 days after self-pollination; (D, E) Embryo abortion of “Q10-33-1④”; (D) Embryo abortion at 12 days after self-pollination, the embryo was degenerating; (E) Embryo abortion at 18 days after self-pollination, the embryo was degenerating and the integument was thickening; (F, G) Unfertilized ovules of “Q10-33-1⑩”, tetranucleate embryo sacs, two black arrows indicated two degenerated megaspores. Abbreviations: Cc: central cell, Ec: egg cell, Sy: synergid.
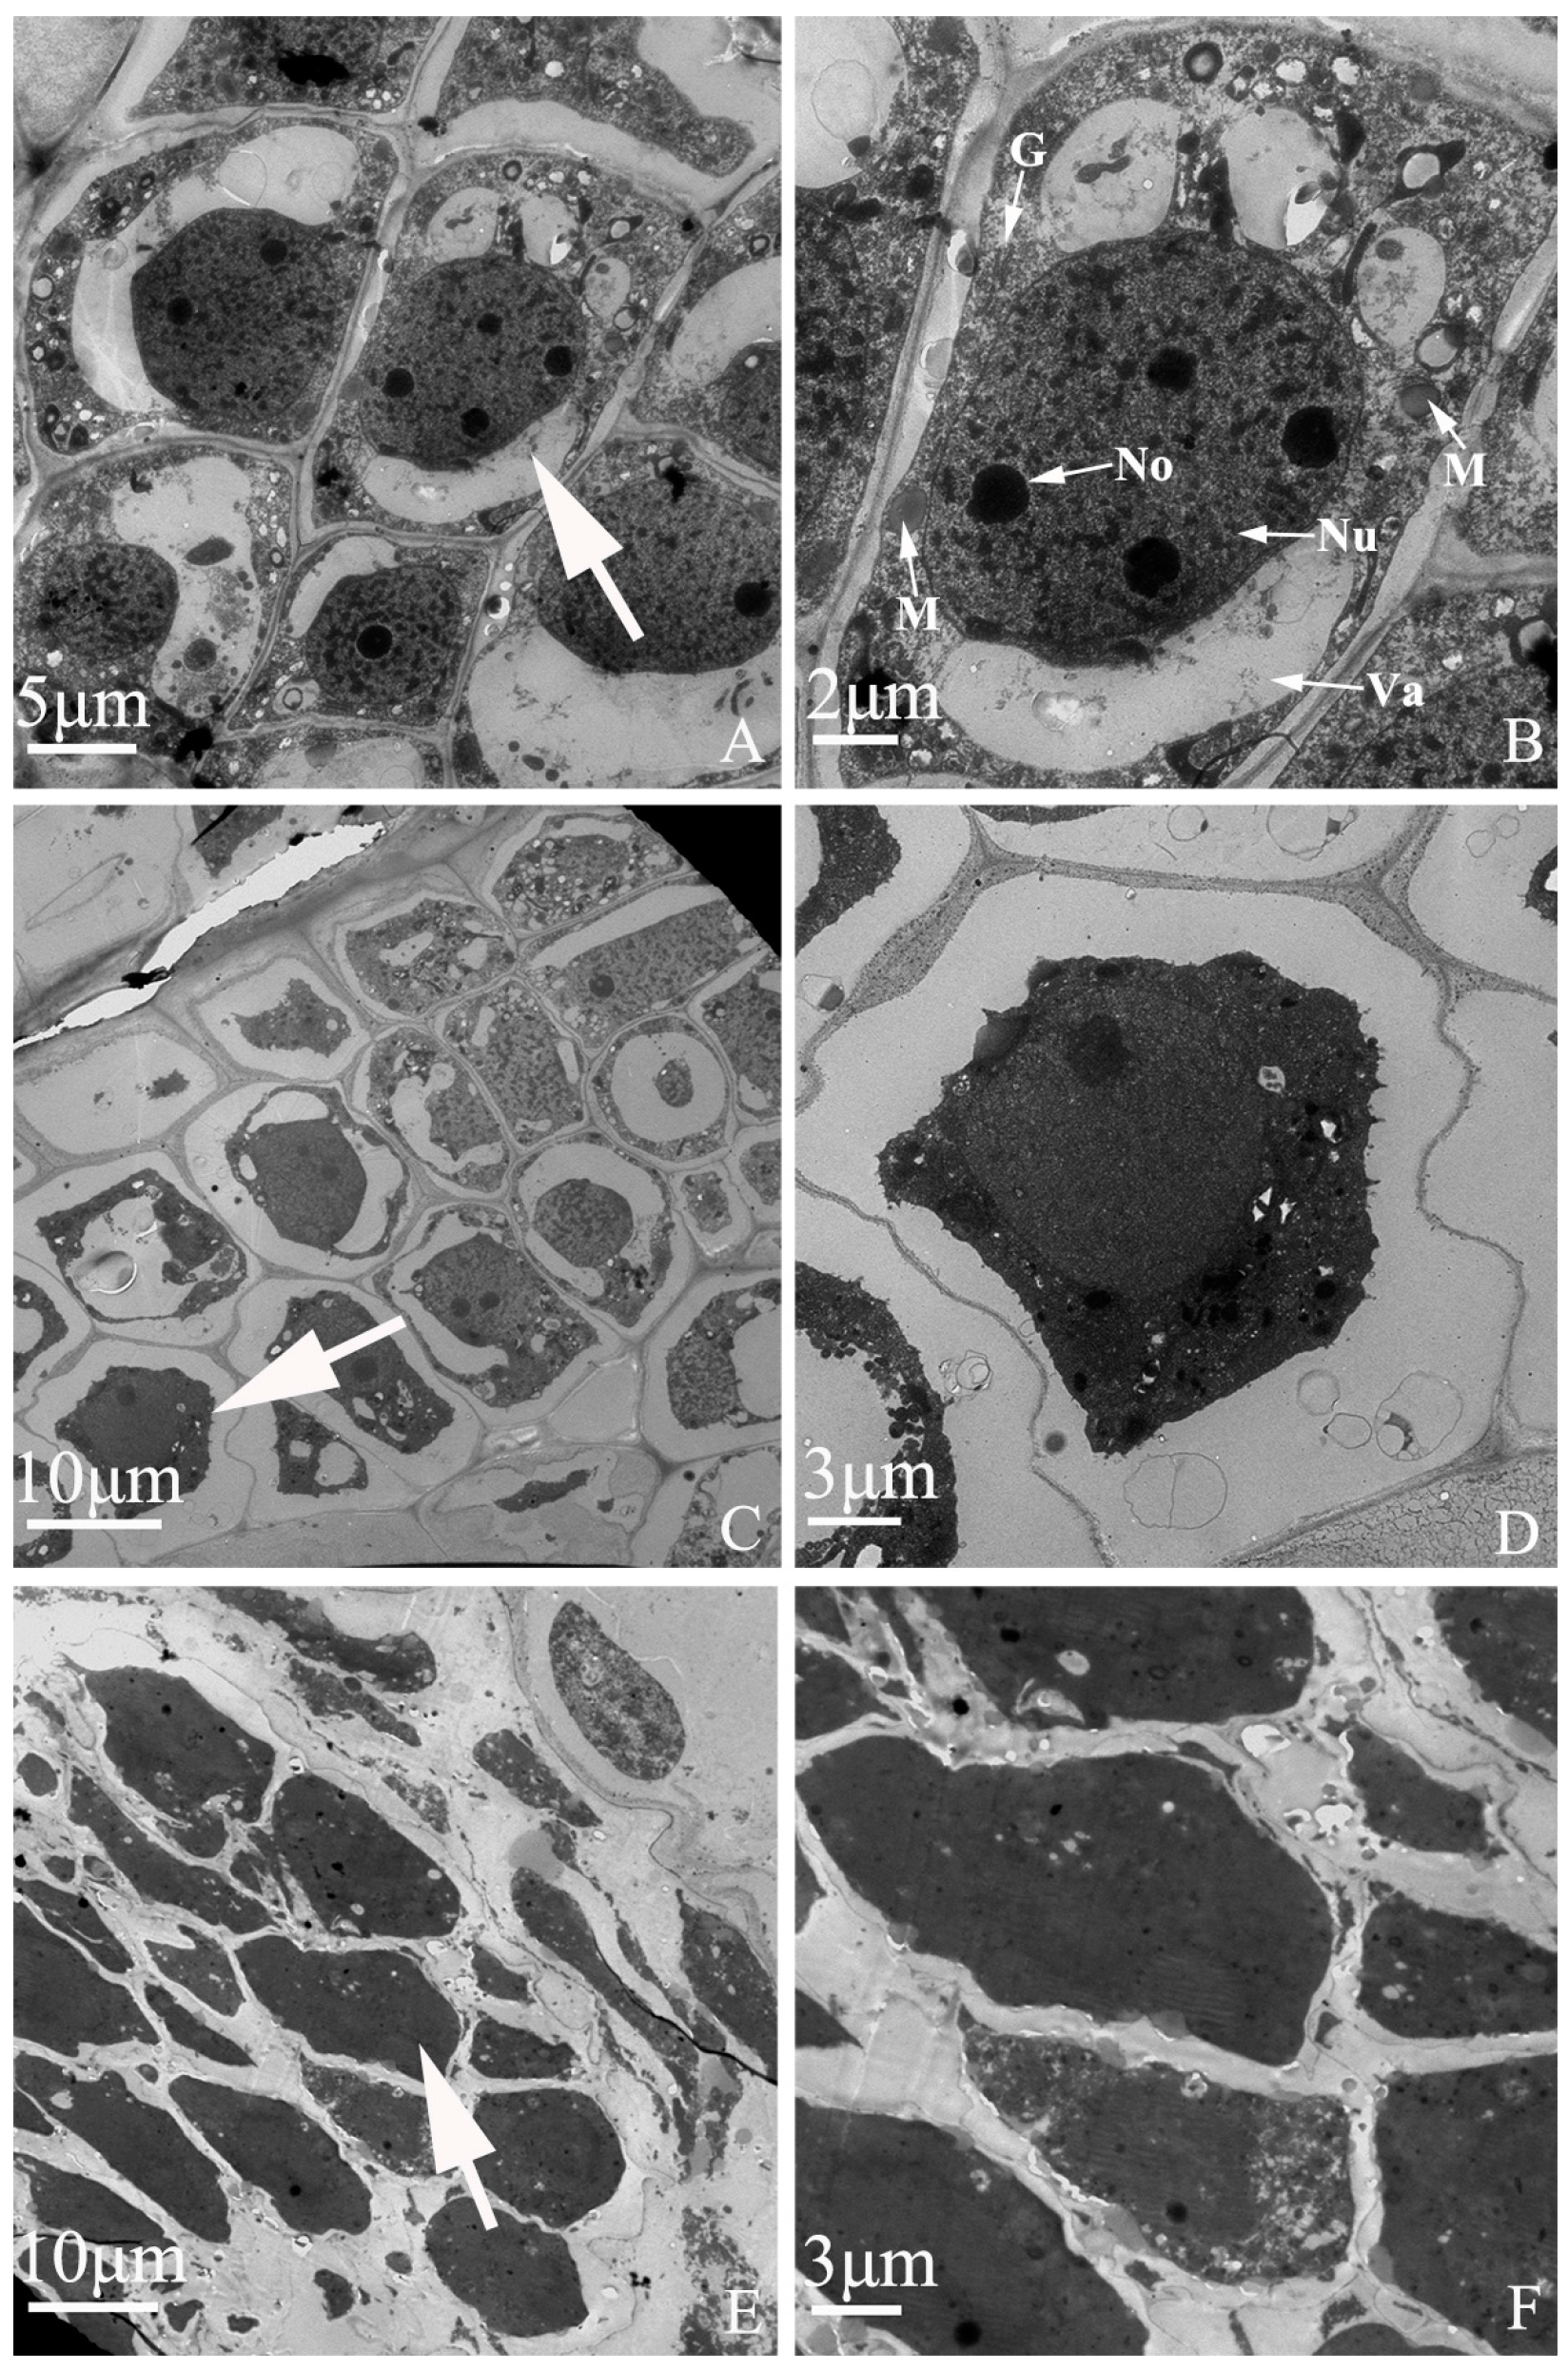
Figure 7.
Embryo development of “Q10-33-1①” at ultrastructural level. (A, B) Normal embryonic cells; (C, D) Abortive embryonic cells at 12 days after self-pollination; (E, F) Abortive embryonic cells at 18 days after self-pollination. (B, D, F) were partial enlarged views of cells pointed by the white arrows in (A, C, E). Abbreviations: Nu: nucleus, No: nucleolus, M: mitochondria, G: Golgi complex, Va: vacuole.
Figure 8.
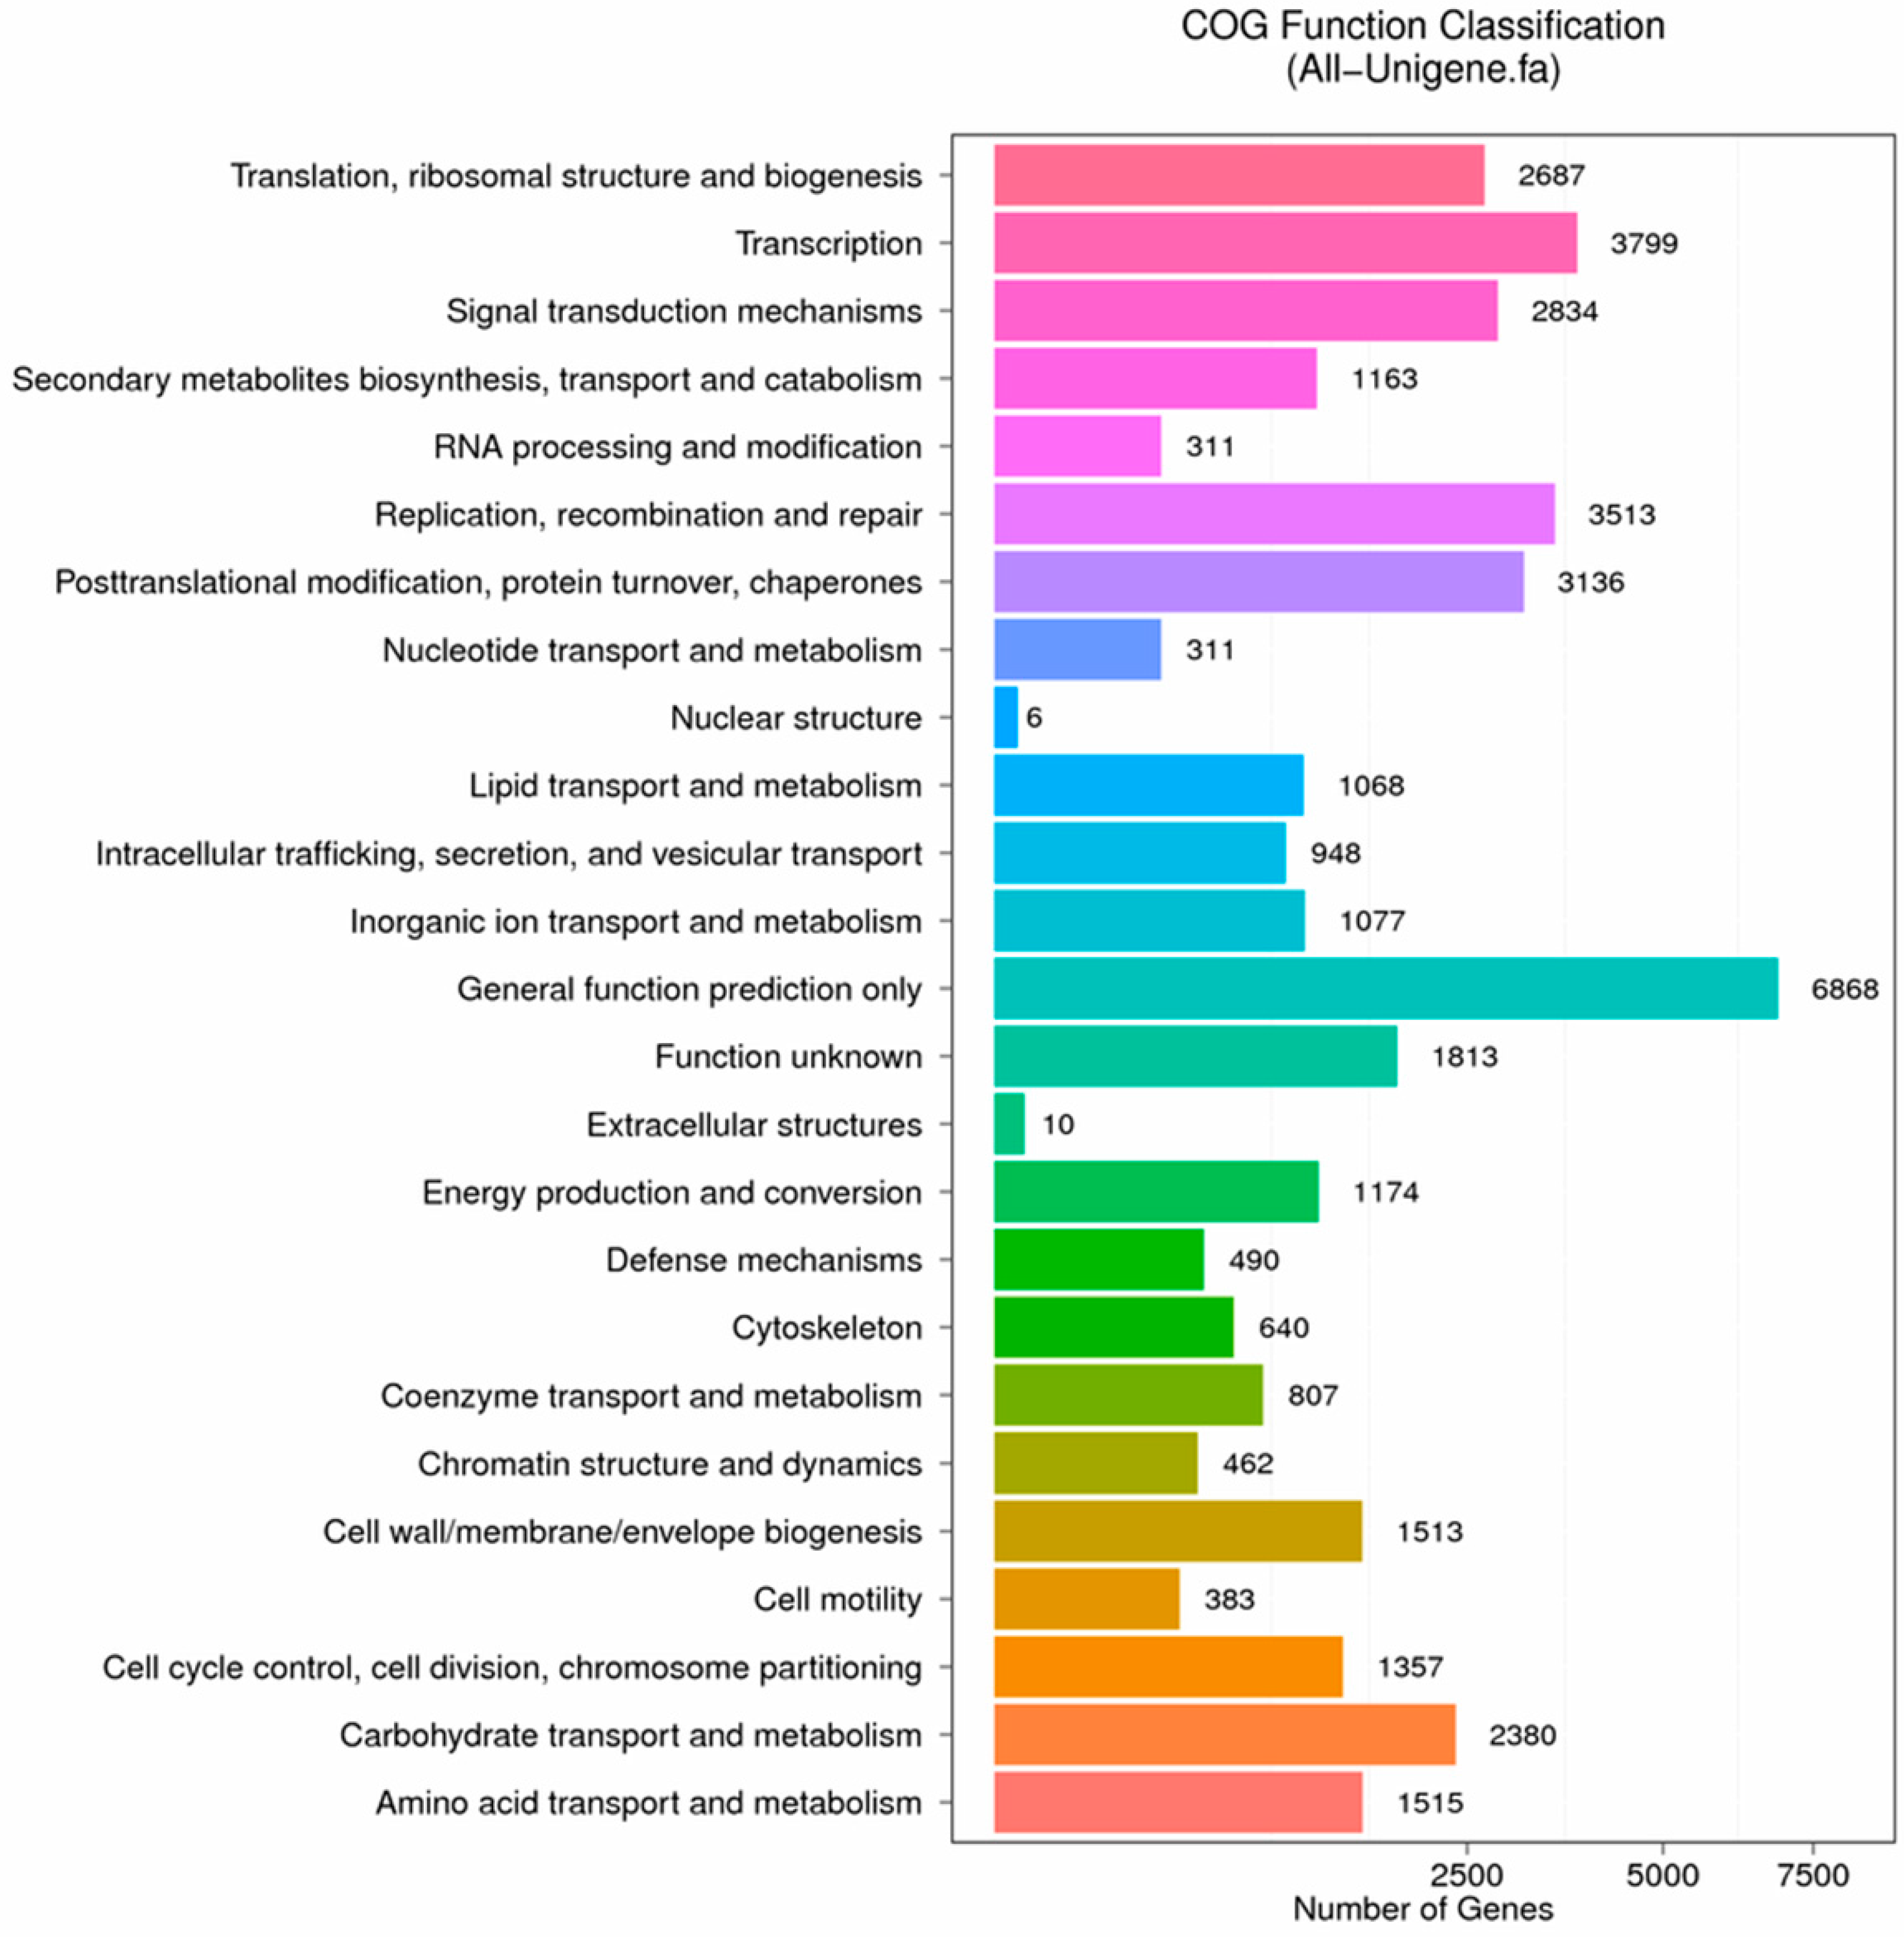
COG function classification of stigma transcriptome. X axis represents the number of Unigenes. Y axis represents the COG functional category.
Figure 8.
COG function classification of stigma transcriptome. X axis represents the number of Unigenes. Y axis represents the COG functional category.
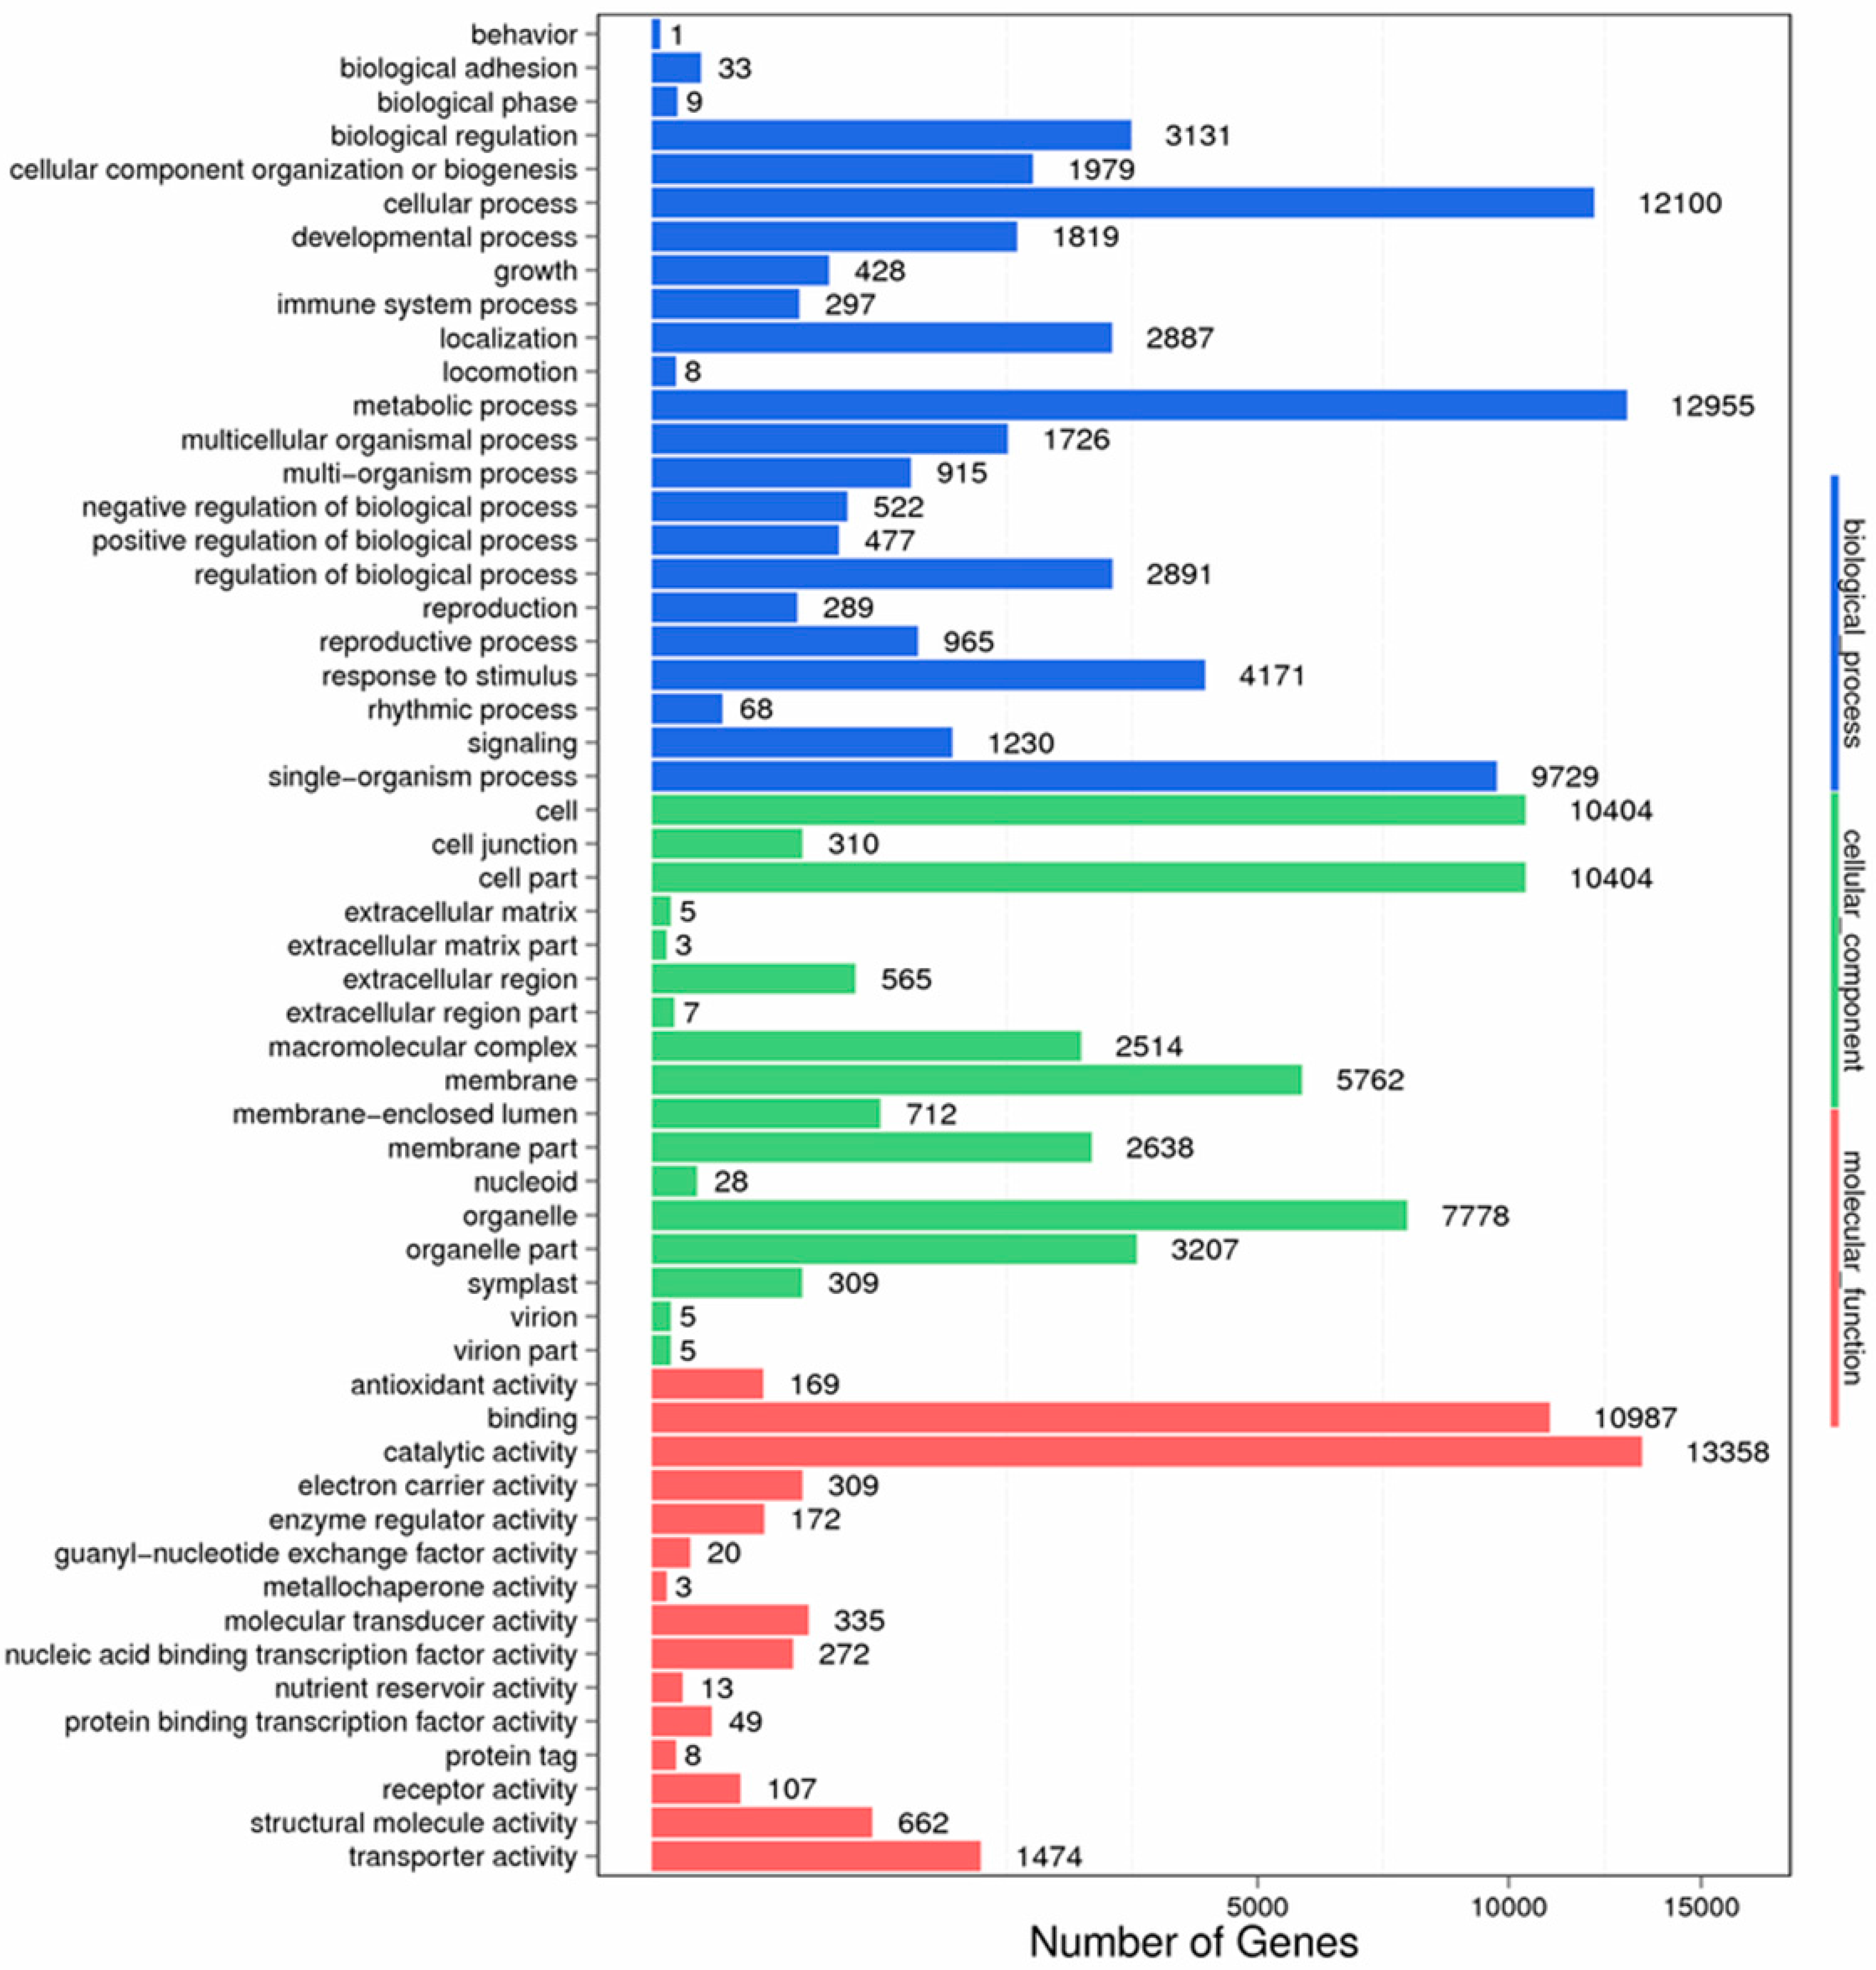
Figure 9.
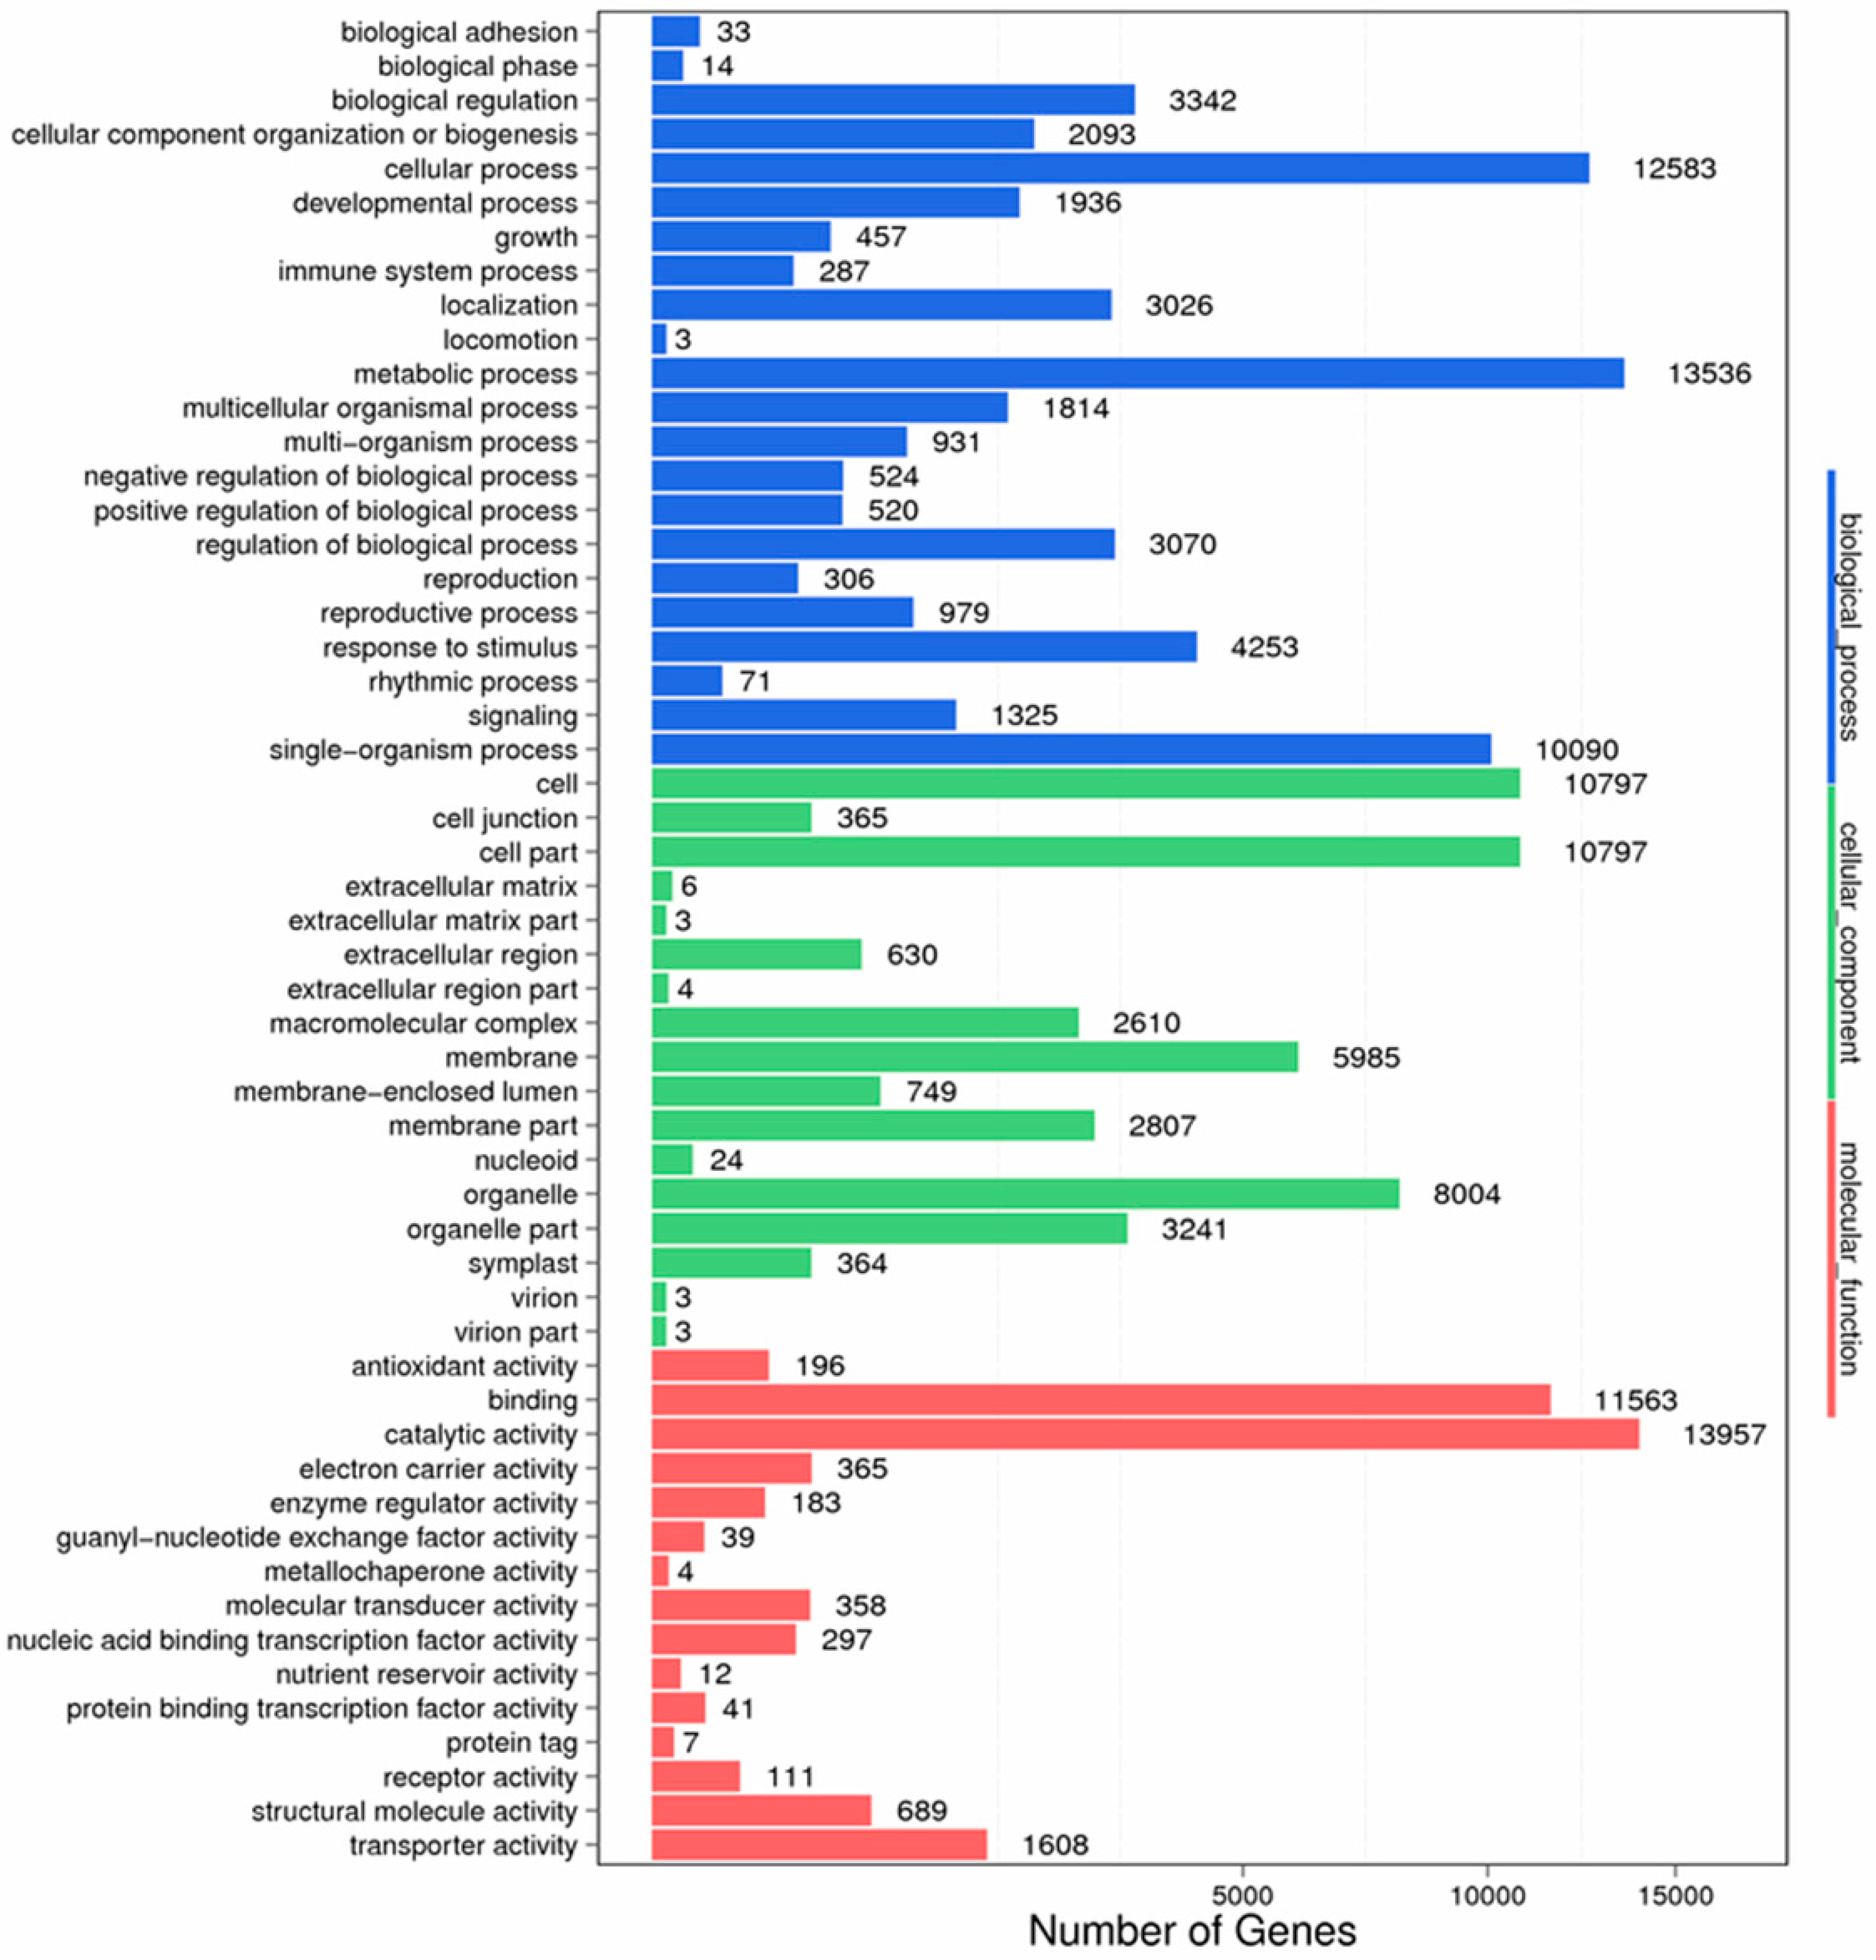
GO function classification of stigma transcriptome. X axis represents the number of Unigenes. Y axis represents the GO functional category.
Figure 9.
GO function classification of stigma transcriptome. X axis represents the number of Unigenes. Y axis represents the GO functional category.
Figure 10.
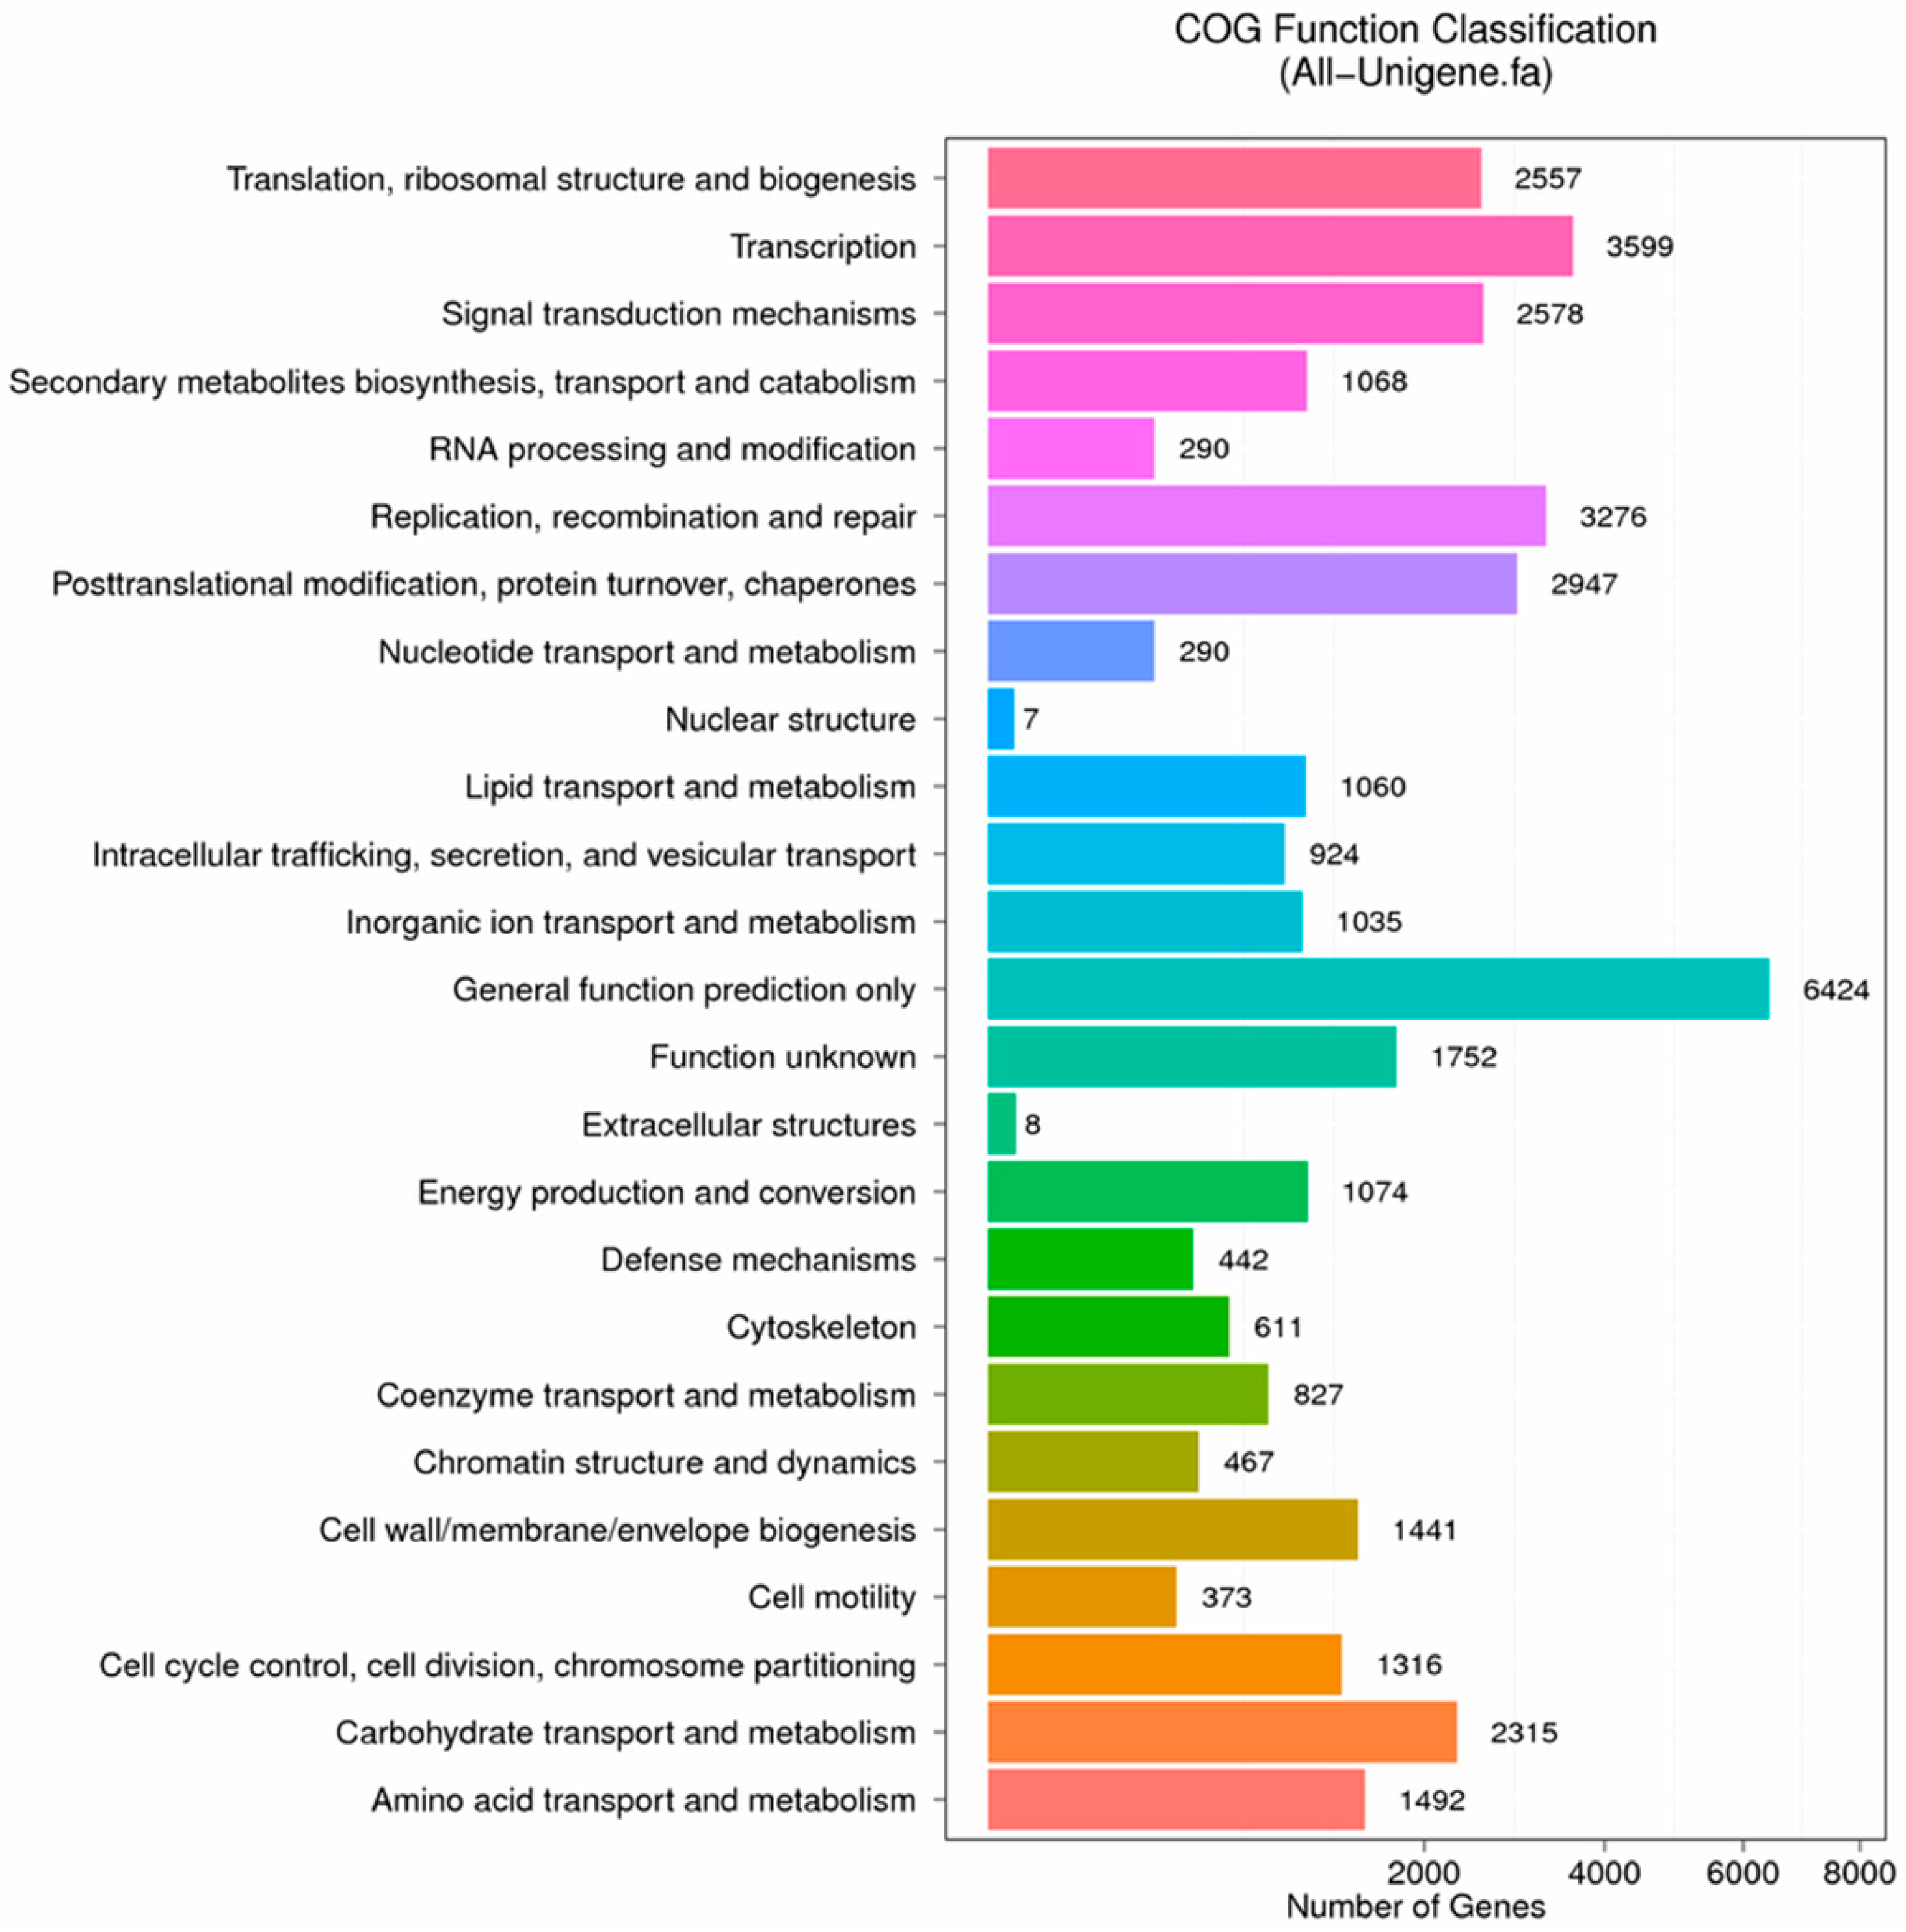
COG function classification of anther transcriptome. X axis represents the number of Unigenes. Y axis represents the COG functional category.
Figure 10.
COG function classification of anther transcriptome. X axis represents the number of Unigenes. Y axis represents the COG functional category.
Figure 11.
GO function classification of anther transcriptome. X axis represents the number of Unigenes. Y axis represents the GO functional category.
Figure 11.
GO function classification of anther transcriptome. X axis represents the number of Unigenes. Y axis represents the GO functional category.
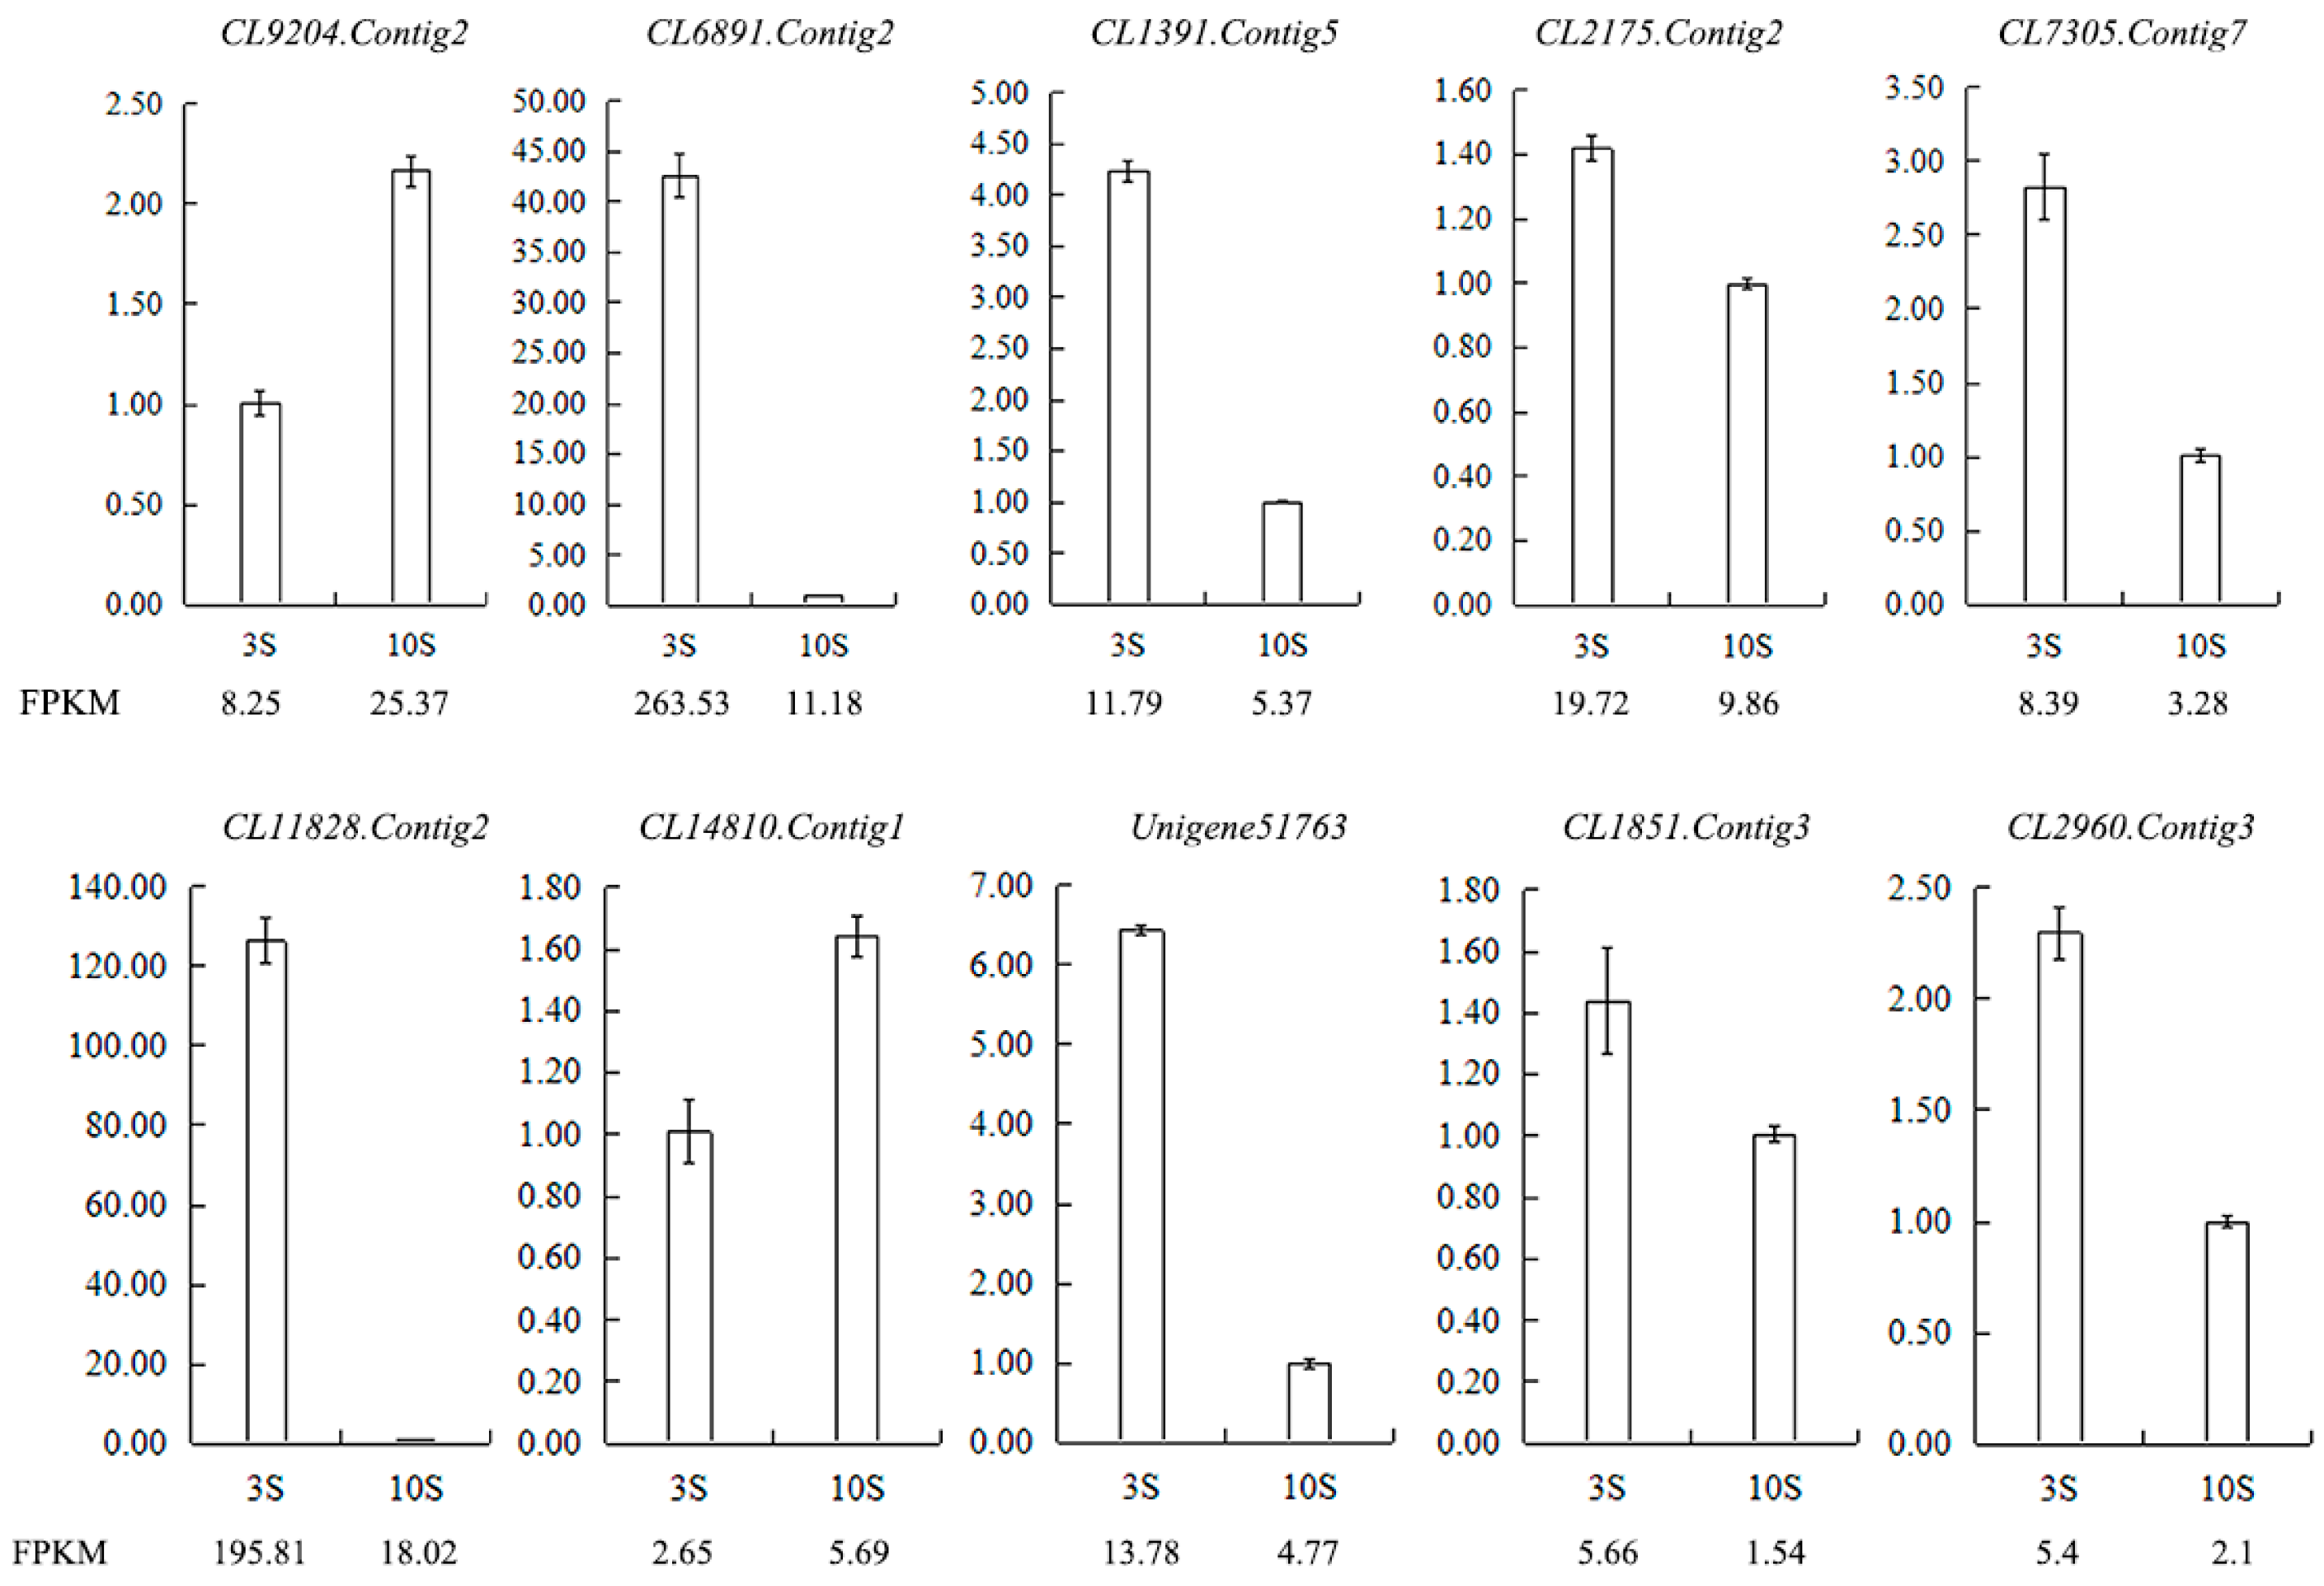
Figure 12.
Validation of the RNA-seq results for stigma transcriptome libraries by qRT-PCR. FPKM is their abundance in the sequencing data of the transcriptome libraries. Abbreviations: CL9204.Contig2: ribonuclease 1, ribonuclease T2 family, CL6891.Contig2: epidermis-specific secreted glycoprotein EP1, CL1391.Contig5: G-type lectin S-receptor-like serine/threonine-protein kinase SD1-1, CL2175.Contig2: S-receptor kinase-like protein 1, CL7305.Contig7: G-type lectin S-receptor-like serine/threonine-protein kinase SD1-29, CL11828.Contig2: G-type lectin S-receptor-like serine/threonine-protein kinase RLK1, CL14810.Contig1: G-type lectin S-receptor-like serine/threonine-protein kinase At1g67520, Unigene51763: S-receptor kinase-like protein 1, CL1851.Contig3: G-type lectin S-receptor-like serine/threonine-protein kinase SD1-1, CL2960.Contig3: G-type lectin S-receptor-like serine/threonine-protein kinase At4g27290.
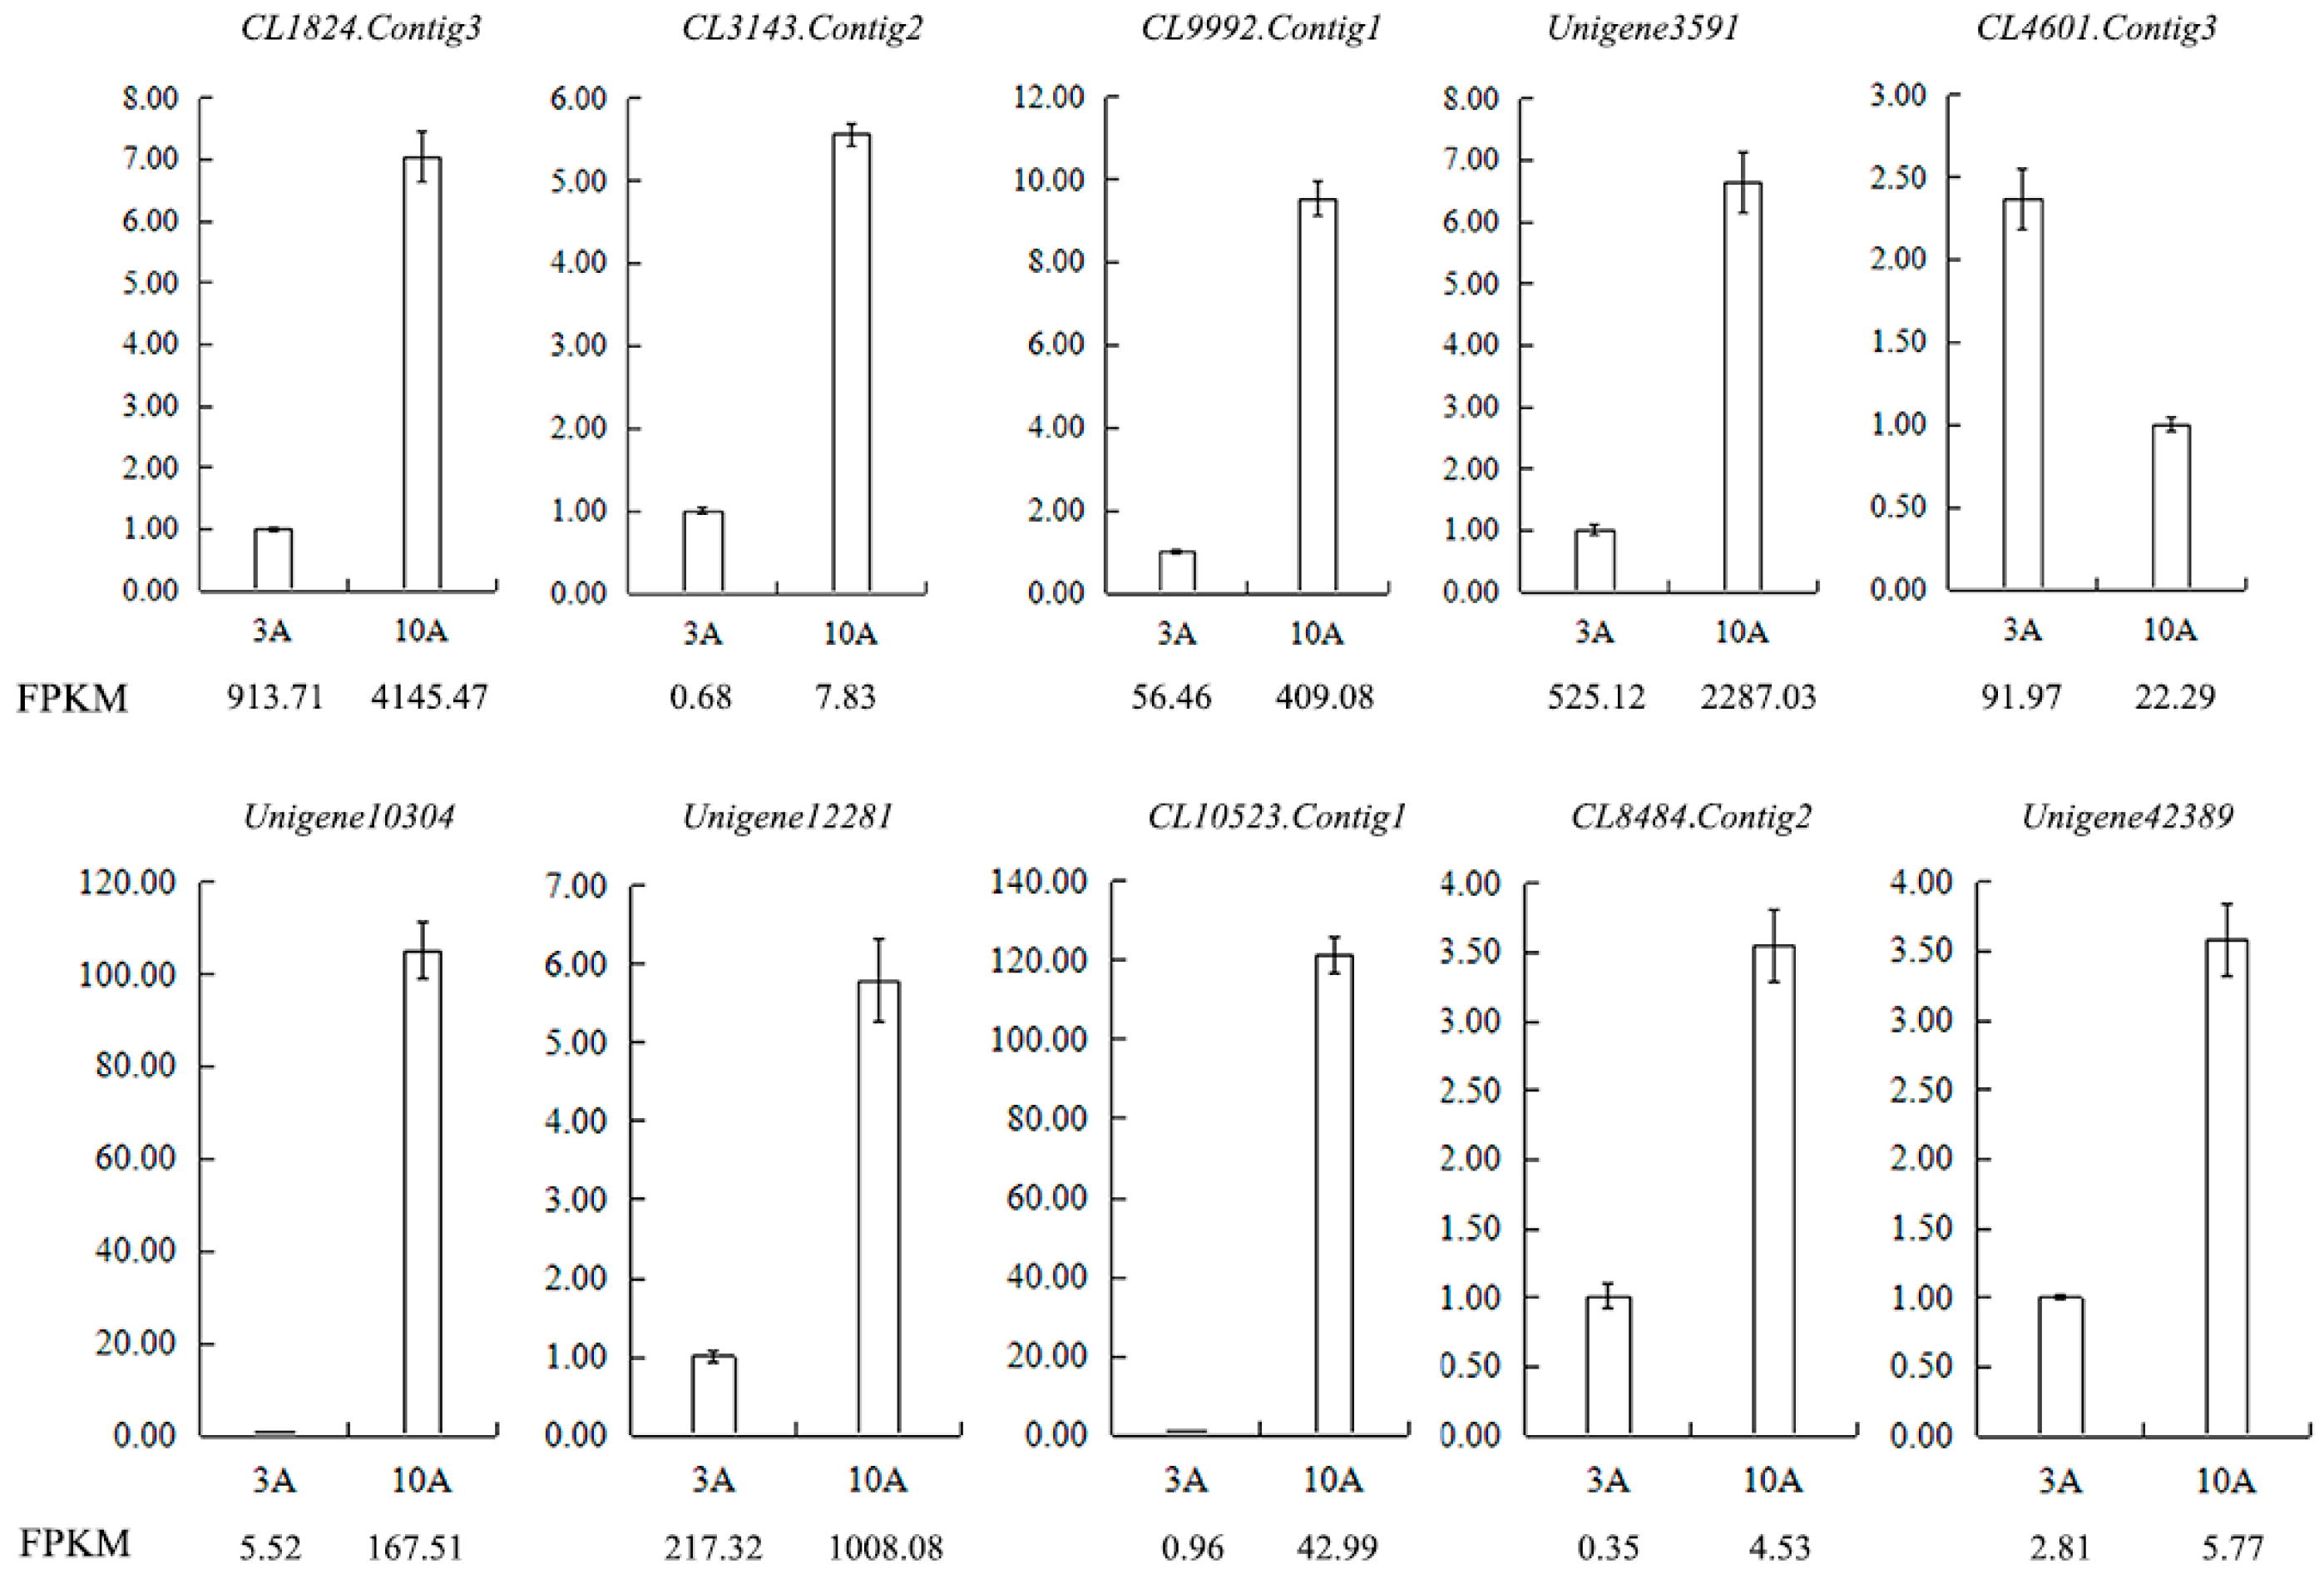
Figure 13.
Validation of the RNA-seq results for anther transcriptome libraries by qRT-PCR. FPKM is their abundance in the sequencing data of the transcriptome libraries. Abbreviations: CL1824.Contig3: pollen-specific protein SF3, CL3143.Contig2: participates in pollen germination and pollen tube growth, CL9992.Contig1: regulates pollen tube growth, Unigene3591: participates in pollen tube growth, CL4601.Contig3: pollen-specific leucine-rich repeat extensin-like protein 1, Unigene10304: S locus-related glycoprotein 1 binding pollen coat protein (SLR1-BP), Unigene12281: pollen coat-like protein, CL10523.Contig1: S locus-related glycoprotein 1 binding pollen coat protein (SLR1-BP), CL8484.Contig2: SKP1-like protein 1A, Unigene42389: Cullin-1.
Table 1.
Flowering traits of “Q10-33-1”’s four progenies.
Table 1.
Flowering traits of “Q10-33-1”’s four progenies.
| Progeny | Flower Color | Petal Shape | Anthotaxy Diameter (cm) | Flower Disc Diameter (cm) | Length of Ray Floret (cm) | Width of Ray Floret (cm) | The Number of Ray Floret | The Number of Tubiform Floret |
|---|
| “Q10-33-1①” | Pink-white | flat | 5.00 ± 0.09 b | 1.37 ± 0.04 a | 2.57 ± 0.11 ab | 0.64 ± 0.02 c | 25.60 ± 1.36 b | 208.00 ± 7.49 b |
| “Q10-33-1③” | Pink-white | cochleariform | 5.30 ± 0.04 a | 1.36 ± 0.02 a | 2.72 ± 0.04 a | 0.78 ± 0.02 b | 28.80 ± 1.16 ab | 168.40 ± 4.56 c |
| “Q10-33-1④” | Yellow | flat | 5.31 ± 0.05 a | 1.36 ± 0.01 a | 2.47 ± 0.05 b | 0.86 ± 0.03 a | 34.40 ± 2.77 a | 202.20 ± 4.66 b |
| “Q10-33-1⑩” | White | flat | 5.30 ± 0.08 a | 1.38 ± 0.01 a | 2.65 ± 0.03 ab | 0.83 ± 0.01 a | 32.60 ± 1.21 a | 246.80 ± 5.60 a |
Table 2.
Pollen germination percentages of “Q10-33-1”s four progenies.
Table 2.
Pollen germination percentages of “Q10-33-1”s four progenies.
| Progeny | Pollen Germination Percentage (%) |
|---|
| “Q10-33-1①” | 28.81 ± 1.42 b |
| “Q10-33-1③” | 21.02 ± 1.36 c |
| “Q10-33-1④” | 15.13 ± 1.63 d |
| “Q10-33-1⑩” | 33.60 ± 2.85 a |
Table 3.
Percentage of full ovaries at different days after self-pollination in “Q10-33-1”’s four progenies.
Table 3.
Percentage of full ovaries at different days after self-pollination in “Q10-33-1”’s four progenies.
| Progeny | Days after Self-Pollination | Seed Set (%) |
|---|
| 12 Days | 18 Days | 30 Days |
|---|
| Full Ovary (%) | Full Ovary (%) | Full Ovary (%) |
|---|
| “Q10-33-1①” | 58.68 ± 5.32 a | 44.83 ± 3.60 a | 42.11 ± 2.41 a | 37.23 ± 3.17 |
| “Q10-33-1③” | 25.72 ± 5.52 b | 20.96 ± 2.20 b | 18.46 ± 2.92 b | 26.77 ± 2.24 |
| “Q10-33-1④” | 22.98 ± 4.40 c | 14.64 ± 1.66 c | 12.12 ± 3.35 c | 7.97 ± 0.93 |
| “Q10-33-1⑩” | 0 d | 0 d | 0 d | 0 |
Table 4.
Summary of sequencing reads after filtering in chrysanthemum stigmas.
Table 4.
Summary of sequencing reads after filtering in chrysanthemum stigmas.
| Sample | Total Raw Reads (Mb) | Total Clean Reads (Mb) | Total Clean Bases (Gb) | Clean Reads Q20 (%) | Clean Reads Q30 (%) | Clean Reads Ratio (%) |
|---|
| 3S | 55.53 | 44.52 | 6.68 | 97.18 | 91.68 | 80.17 |
| 10S | 55.53 | 44.19 | 6.63 | 97.10 | 91.54 | 79.58 |
Table 5.
Quality metrics of unigenes in chrysanthemum stigmas.
Table 5.
Quality metrics of unigenes in chrysanthemum stigmas.
| Sample | Total Number | Total Length | Mean Length | N50 | N70 | N90 | GC (%) |
|---|
| 3S | 80,646 | 61,510,907 | 762 | 1178 | 693 | 315 | 39.89 |
| 10S | 91,382 | 73,442,479 | 803 | 1261 | 744 | 331 | 39.36 |
| All-Unigene | 113,800 | 94,376,715 | 829 | 1317 | 782 | 340 | 39.40 |
Table 6.
Summary of sequencing reads after filtering in chrysanthemum anthers.
Table 6.
Summary of sequencing reads after filtering in chrysanthemum anthers.
| Sample | Total Raw Reads (Mb) | Total Clean Reads (Mb) | Total Clean Bases (Gb) | Clean Reads Q20 (%) | Clean Reads Q30 (%) | Clean Reads Ratio (%) |
|---|
| 3A | 55.53 | 44.25 | 6.64 | 97.15 | 91.60 | 79.69 |
| 10A | 55.53 | 44.37 | 6.65 | 97.16 | 91.68 | 79.90 |
Table 7.
Quality metrics of unigenes in chrysanthemum anthers.
Table 7.
Quality metrics of unigenes in chrysanthemum anthers.
| Sample | Total Number | Total Length | Mean Length | N50 | N70 | N90 | GC (%) |
|---|
| 3A | 77,343 | 58,453,744 | 755 | 1178 | 689 | 311 | 40.11 |
| 10A | 93,204 | 71,619,379 | 768 | 1195 | 703 | 318 | 39.63 |
| All-Unigene | 113,638 | 91,284,692 | 803 | 1276 | 754 | 328 | 39.66 |
Table 8.
Summary of functional annotation result in chrysanthemum stigmas.
Table 8.
Summary of functional annotation result in chrysanthemum stigmas.
| Values | Number | Percentage |
|---|
| Total | 113,800 | 100% |
| NR-Annotated | 57,127 | 50.20% |
| NT-Annotated | 42,115 | 37.01% |
| Swiss-Prot-Annotated | 39,577 | 34.78% |
| KEGG-Annotated | 42,586 | 37.42% |
| COG-Annotated | 19,476 | 17.11% |
| Interpro-Annotated | 38,563 | 33.89% |
| GO-Annotated | 23,423 | 20.58% |
| Overall | 61,731 | 54.25% |
Table 9.
Summary of functional annotation result in chrysanthemum anthers.
Table 9.
Summary of functional annotation result in chrysanthemum anthers.
| Values | Number | Percentage |
|---|
| Total | 113,638 | 100% |
| NR-Annotated | 59,346 | 52.22% |
| NT-Annotated | 42,785 | 37.65% |
| Swiss-Prot-Annotated | 40,774 | 35.88% |
| KEGG-Annotated | 43,970 | 38.69% |
| COG-Annotated | 20,580 | 18.11% |
| Interpro-Annotated | 40,653 | 35.77% |
| GO-Annotated | 24,313 | 21.40% |
| Overall | 63,517 | 55.89% |
Table 10.
Potential stigma S genes.
Table 10.
Potential stigma S genes.
| Unigene | 10S_FPKM | 3S_FPKM | Annotation |
|---|
| CL13054.Contig1_All | 2.92 | 0.16 | S-receptor-like serine/threonine-protein kinase SD2-5-like |
| Unigene8775_All | 4.3 | 0.84 | S-receptor-like serine/threonine-protein kinase At2g19130-like |
| Unigene12923_All | 8.86 | 3.51 | S-receptor-like serine/threonine-protein kinase At4g27290 |
| CL49.Contig2_All | 4.82 | 2.05 | S-receptor-like serine/threonine-protein kinase At2g23200 |
| CL1851.Contig6_All | 4.48 | 1.84 | S-receptor-like serine/threonine-protein kinase At4g27290 |
| CL2175.Contig4_All | 5.54 | 0.25 | S-receptor-like serine/threonine-protein kinase B120 |
| CL2302.Contig1_All | 5.51 | 0 | S-receptor-like serine/threonine-protein kinase B120 |
| CL4068.Contig2_All | 3.68 | 0.31 | S-receptor-like serine/threonine-protein kinase At2g19130 |
| CL5636.Contig1_All | 7.58 | 1.63 | S-receptor-like serine/threonine-protein kinase At1g61440 |
| CL13888.Contig1_All | 3.91 | 1.07 | S-receptor-like serine/threonine-protein kinase At1g11330 |
| CL14810.Contig1_All | 5.69 | 2.65 | S-receptor-like serine/threonine-protein kinase At1g67520 |
| Unigene6395_All | 2.16 | 0.18 | S-receptor-like serine/threonine-protein kinase SD2-5 |
| Unigene7043_All | 4.68 | 0.83 | S-receptor-like serine/threonine-protein kinase At4g27290 |
| Unigene12924_All | 4.8 | 0.52 | S-receptor-like serine/threonine-protein kinase At4g27290 |
| Unigene21655_All | 8.72 | 3.57 | S-receptor-like serine/threonine-protein kinase SD1-1 |
| Unigene26414_All | 2.7 | 0 | S-receptor-like serine/threonine-protein kinase SD1-7 |
| Unigene27592_All | 1.85 | 0.17 | S-receptor-like serine/threonine-protein kinase At1g11280 |
| Unigene28018_All | 2.63 | 0.29 | S-receptor-like serine/threonine-protein kinase SD1-1 |
| CL9204.Contig1_All | 2.36 | 0.66 | Extracellular ribonuclease LE-like |
| CL9204.Contig2_All | 25.37 | 8.25 | Extracellular ribonuclease LE-like |
| Unigene9014_All | 120.17 | 65.25 | Ribonuclease S-F11-like |
| Unigene61187_All | 1.04 | 0 | Self-incompatibility ribonuclease S5 |
Table 11.
Potential pollen S genes.
Table 11.
Potential pollen S genes.
| Unigene | 10A_FPKM | 3A_FPKM | Annotation |
|---|
| CL3238.Contig2_All | 3.54 | 1.1 | S3 self-incompatibility locus-linked pollen 3.15 protein |
| CL10523.Contig1_All | 42.99 | 0.96 | S-locus-related glycoprotein 1 binding pollen coat protein |
| CL10523.Contig2_All | 16.58 | 1.79 | S-locus-related glycoprotein 1 binding pollen coat protein |
| Unigene8136_All | 438.67 | 87.33 | pollen coat-like protein |
| Unigene10304_All | 167.51 | 5.52 | S-locus-related glycoprotein 1 binding pollen coat protein |
| Unigene12281_All | 1008.08 | 217.32 | pollen coat-like protein |
| CL442.Contig8_All | 0.73 | 0 | S-locus F-Box protein c |
| CL442.Contig9_All | 1.87 | 1.1 | S-locus F-Box protein c |


