Examining the Genetic Background of Porcine Muscle Growth and Development Based on Transcriptome and miRNAome Data

 ,
,  ,
,
Abstract
:1. Introduction
2. Results
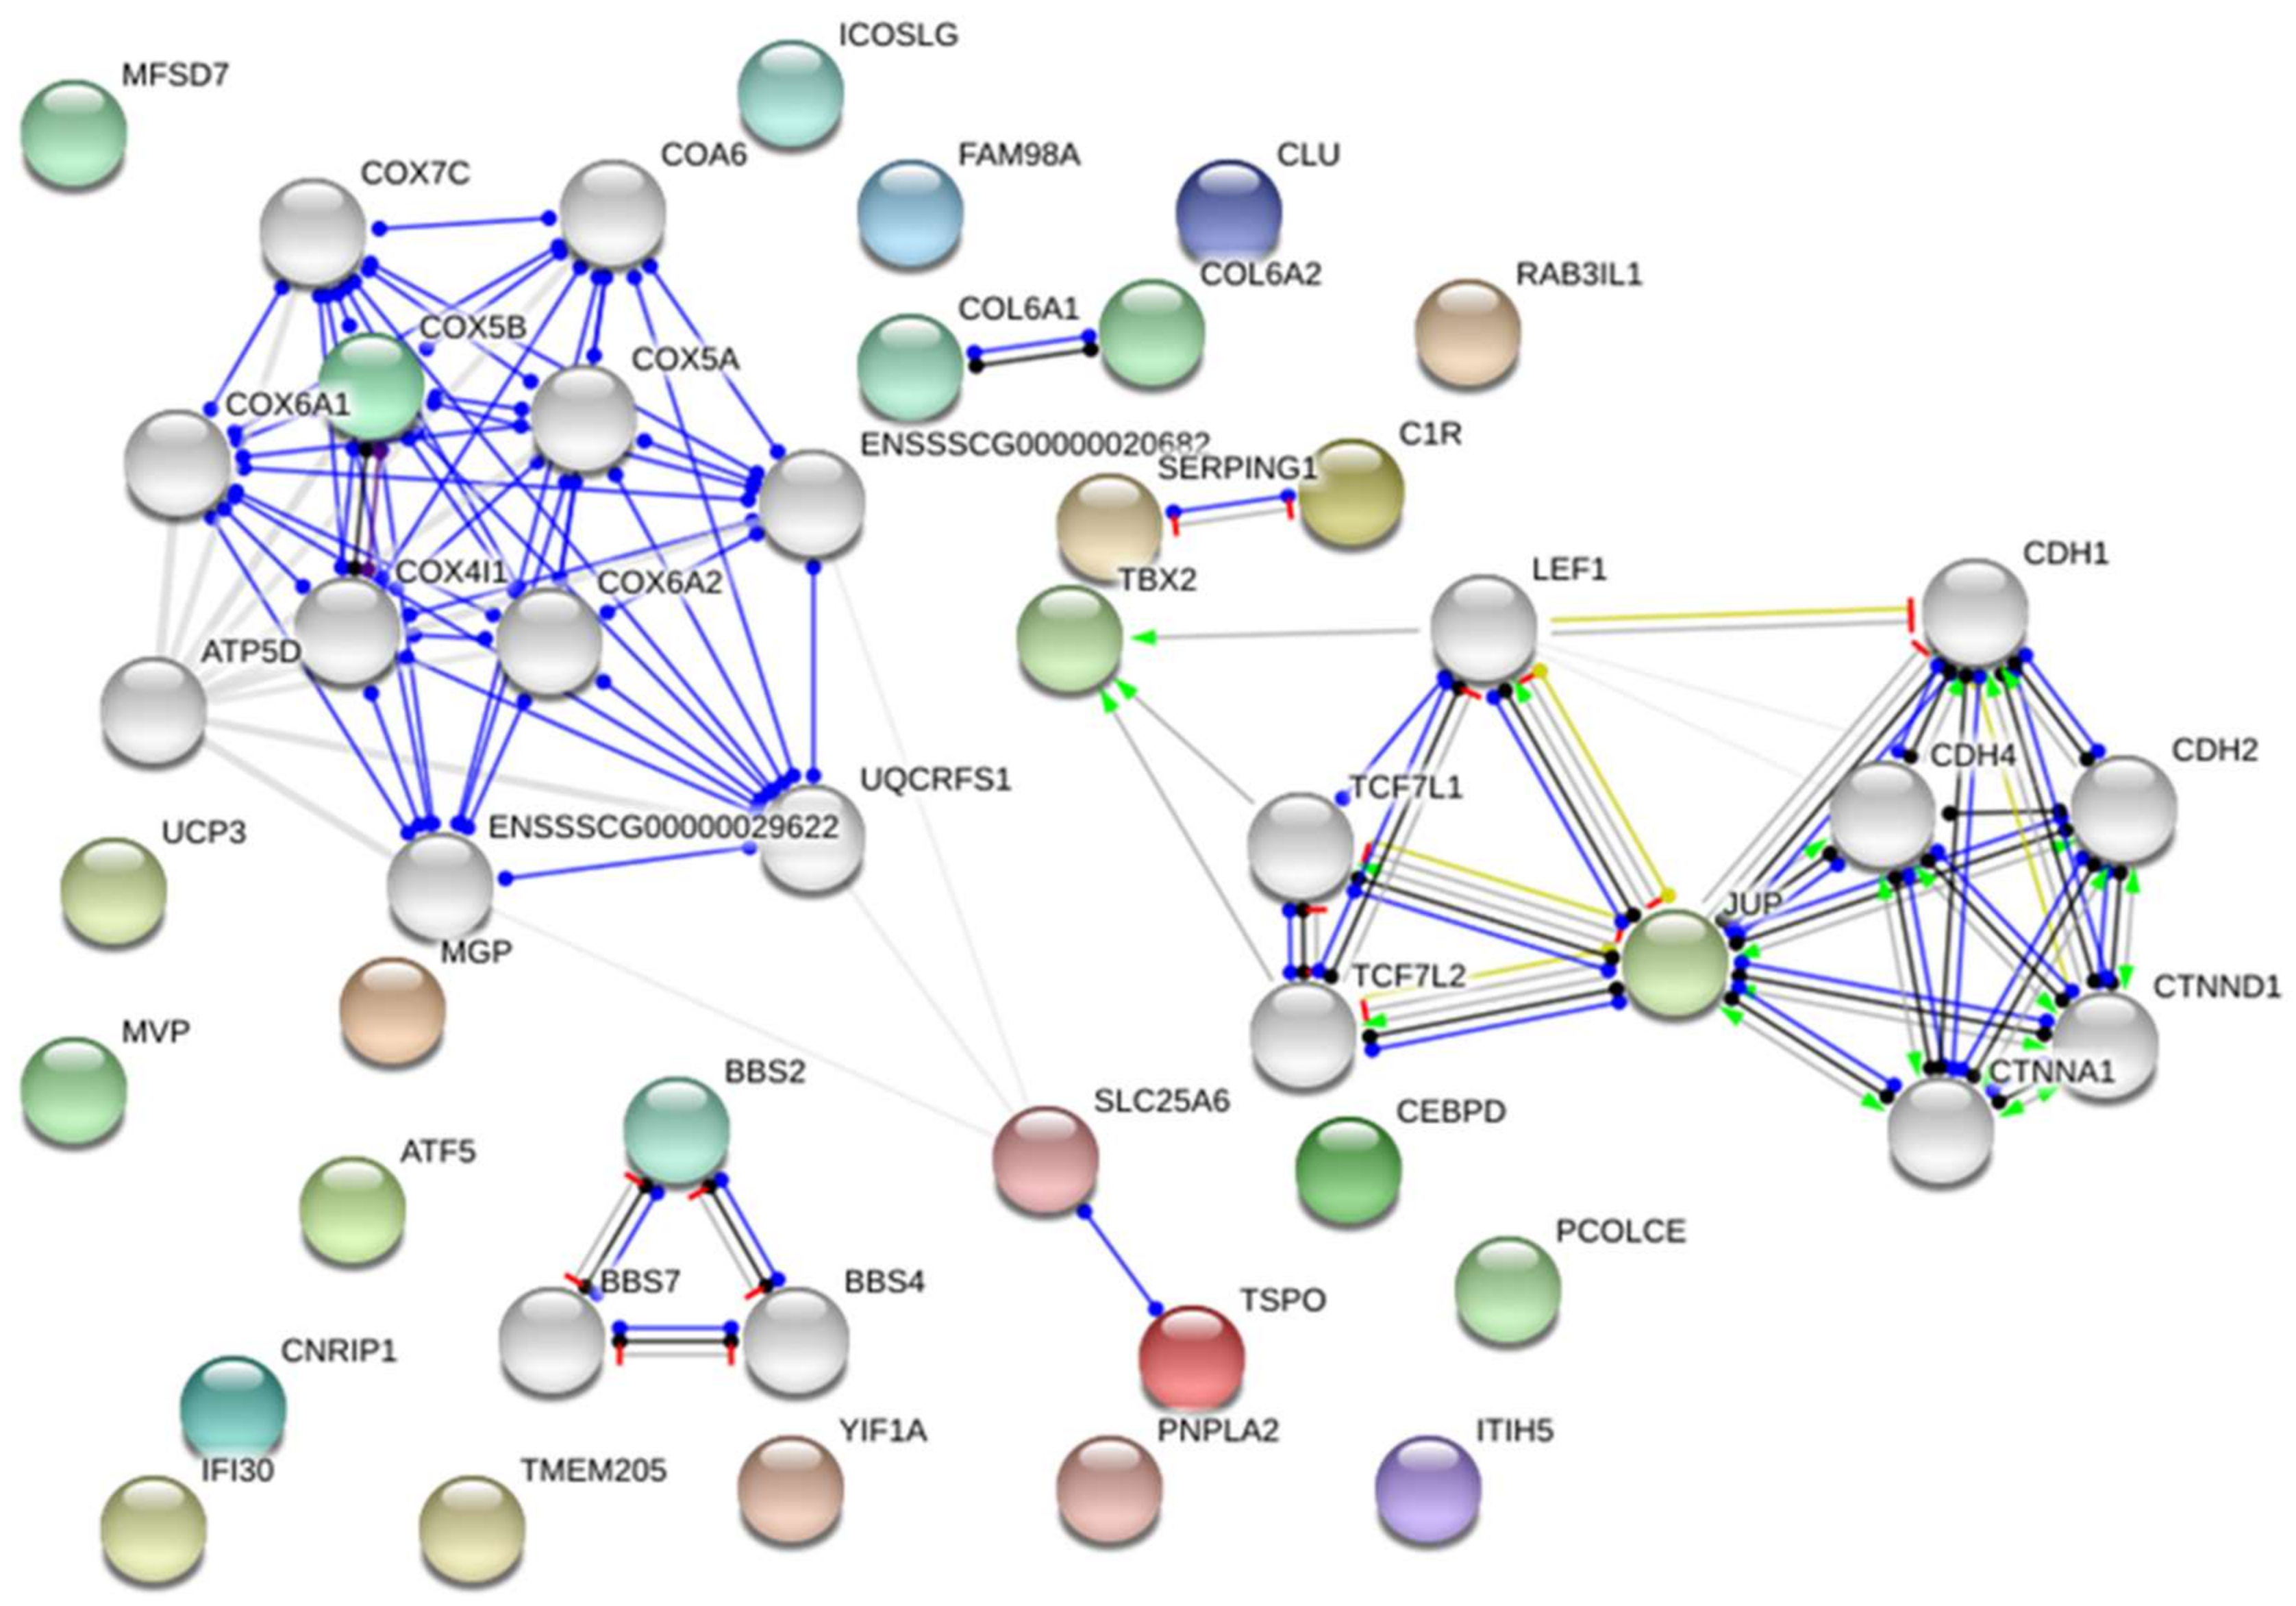
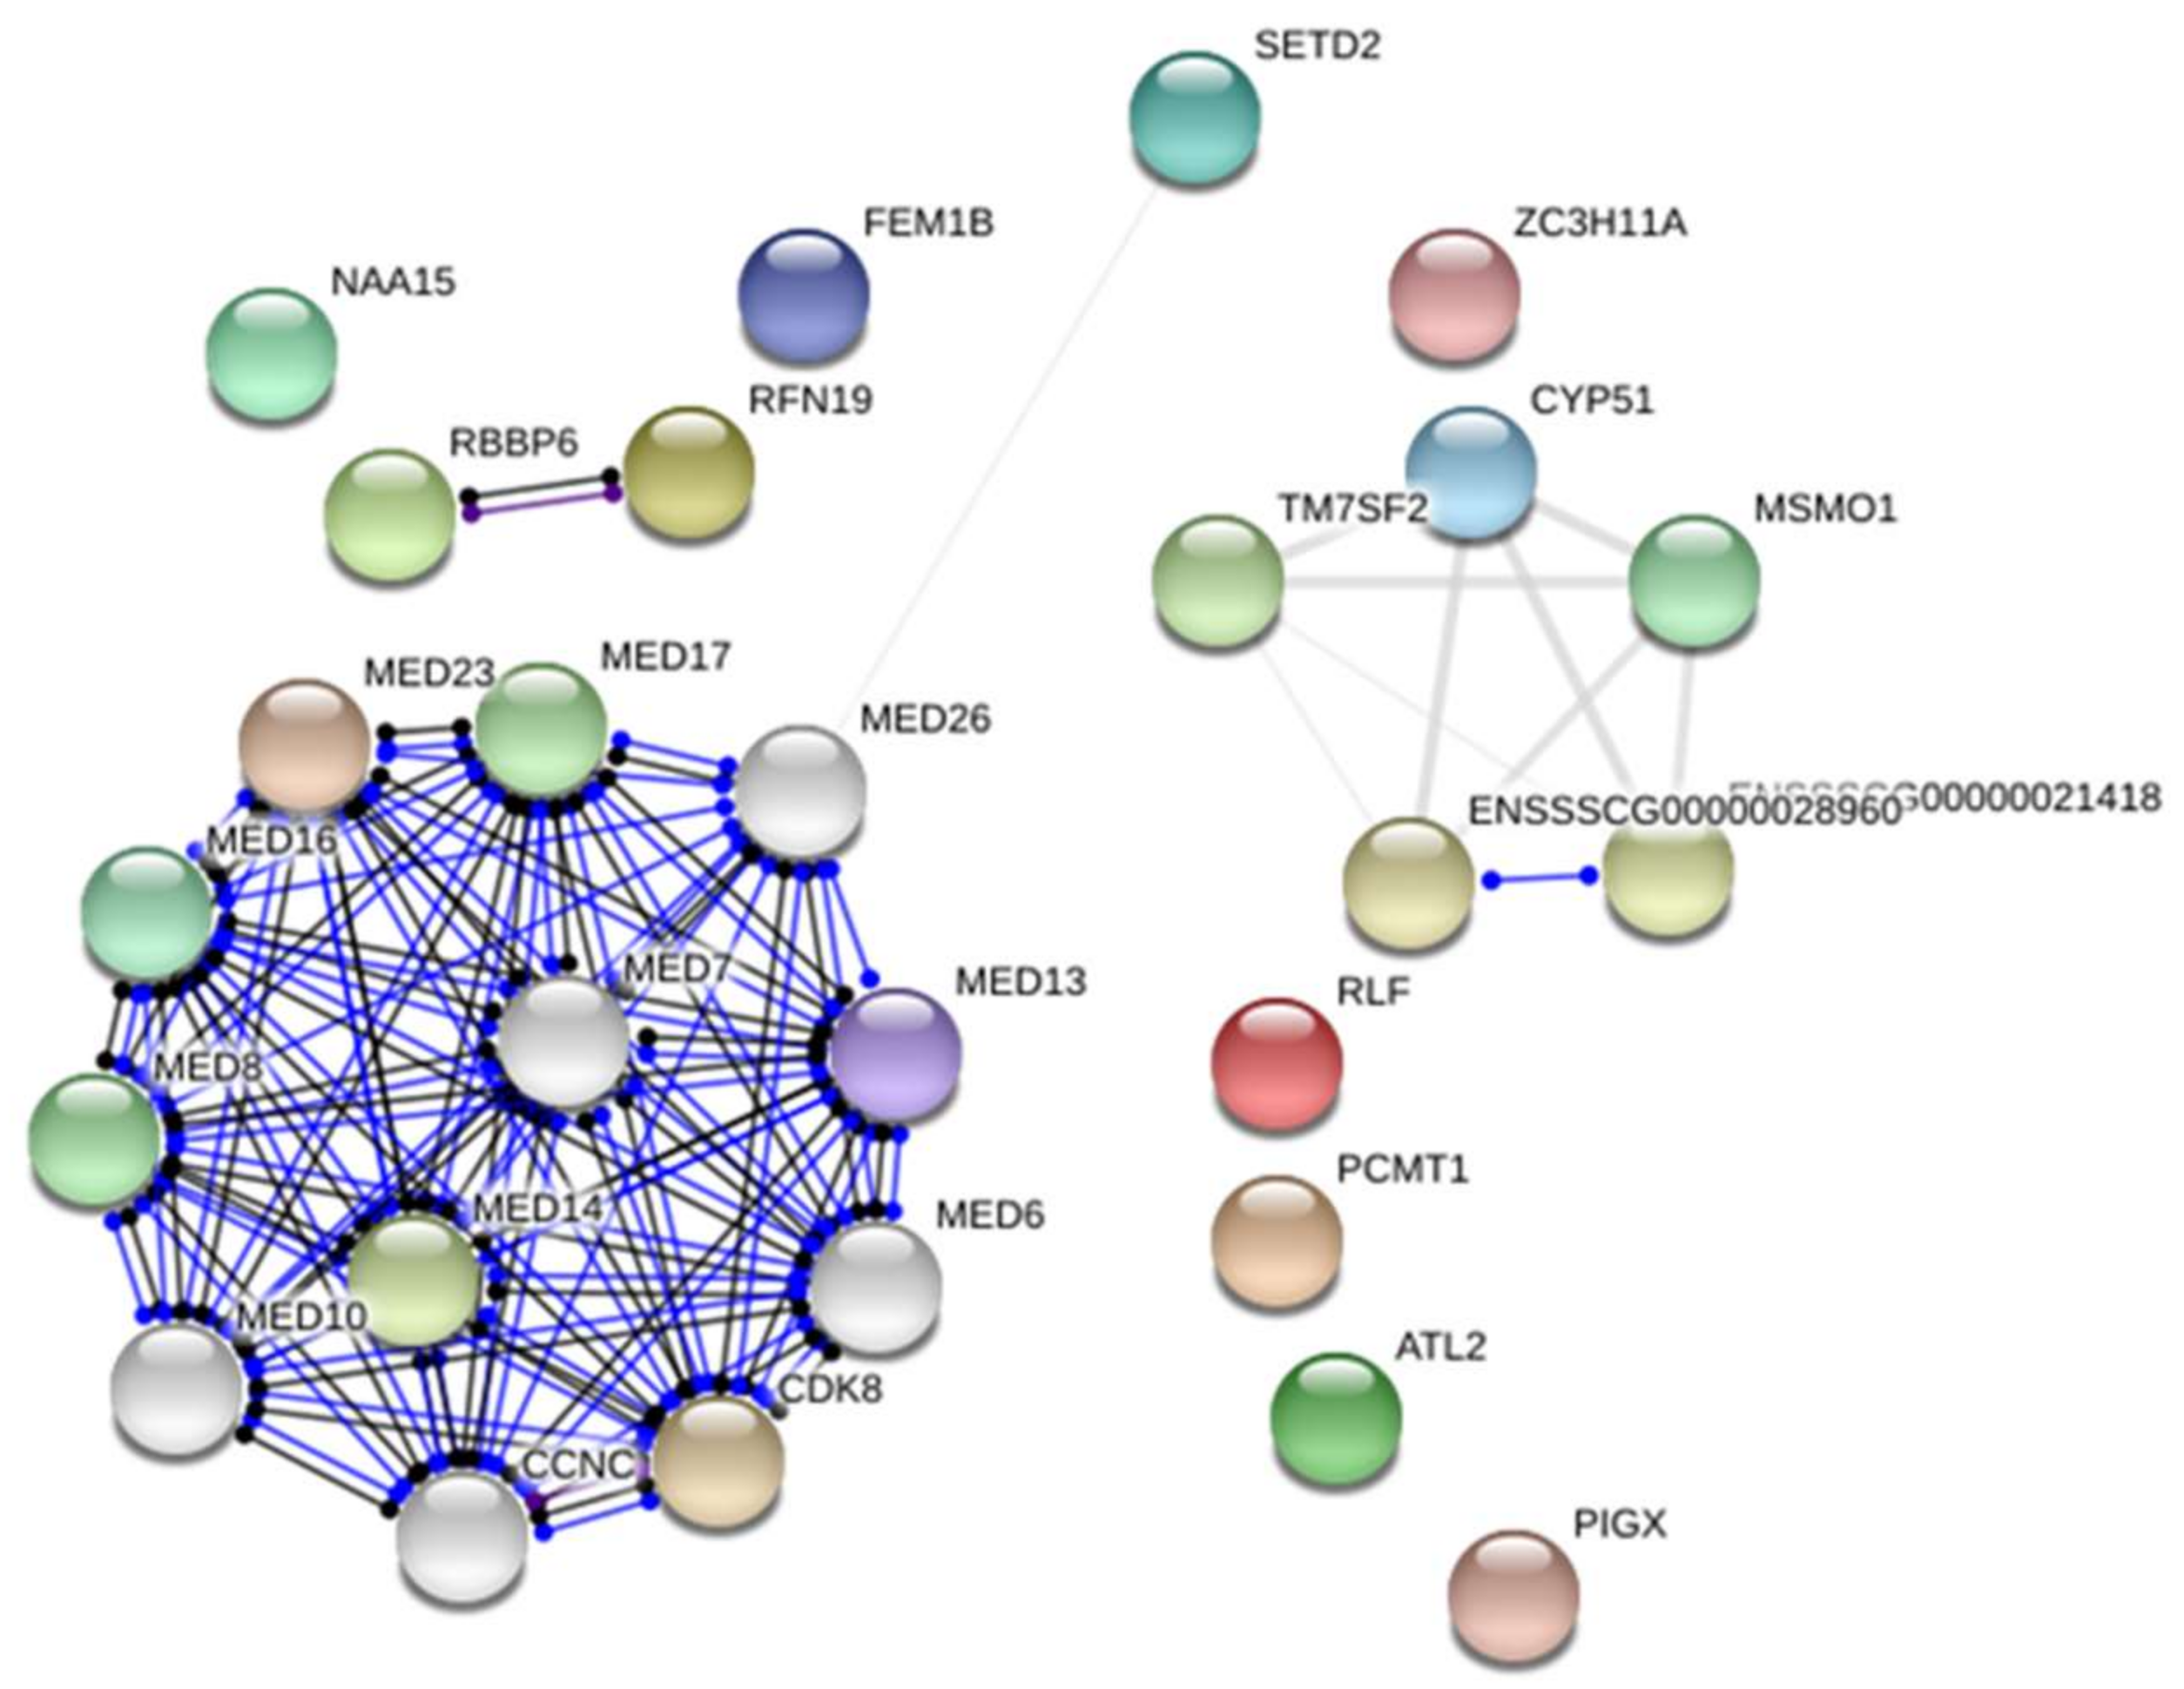
2.1. Transcriptome Analysis—Differentially Expressed Genes (DEGs)
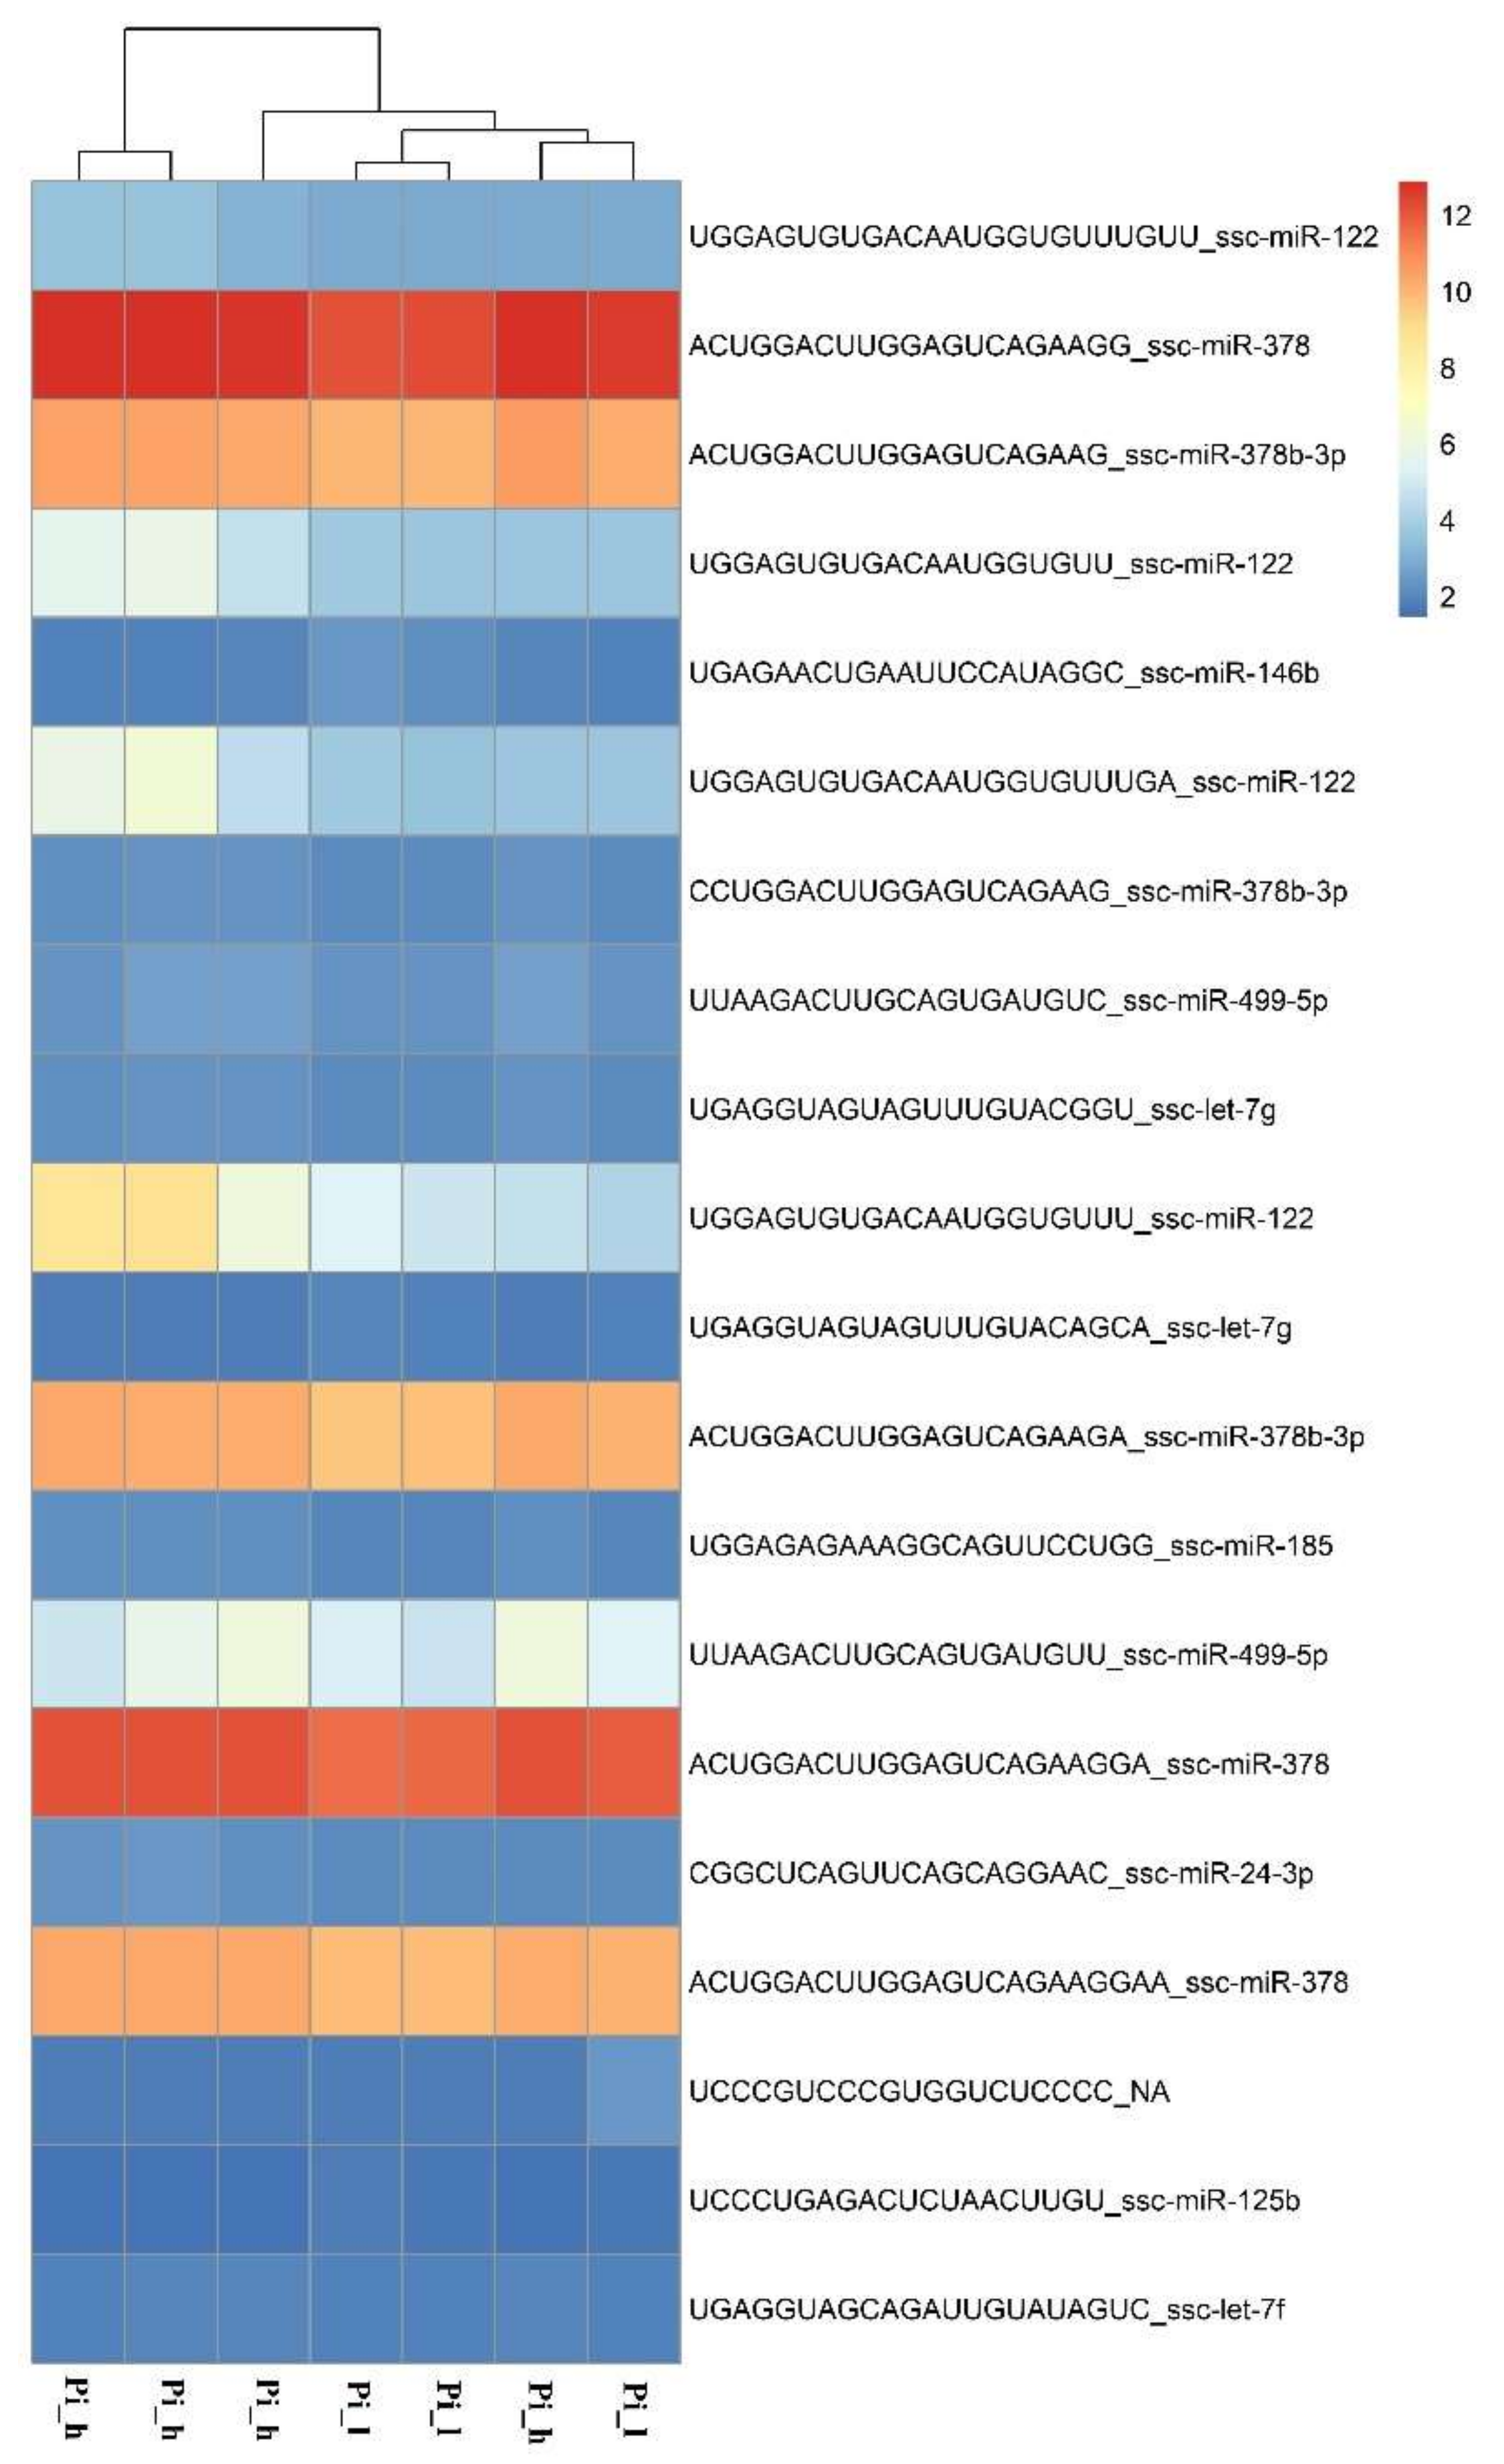
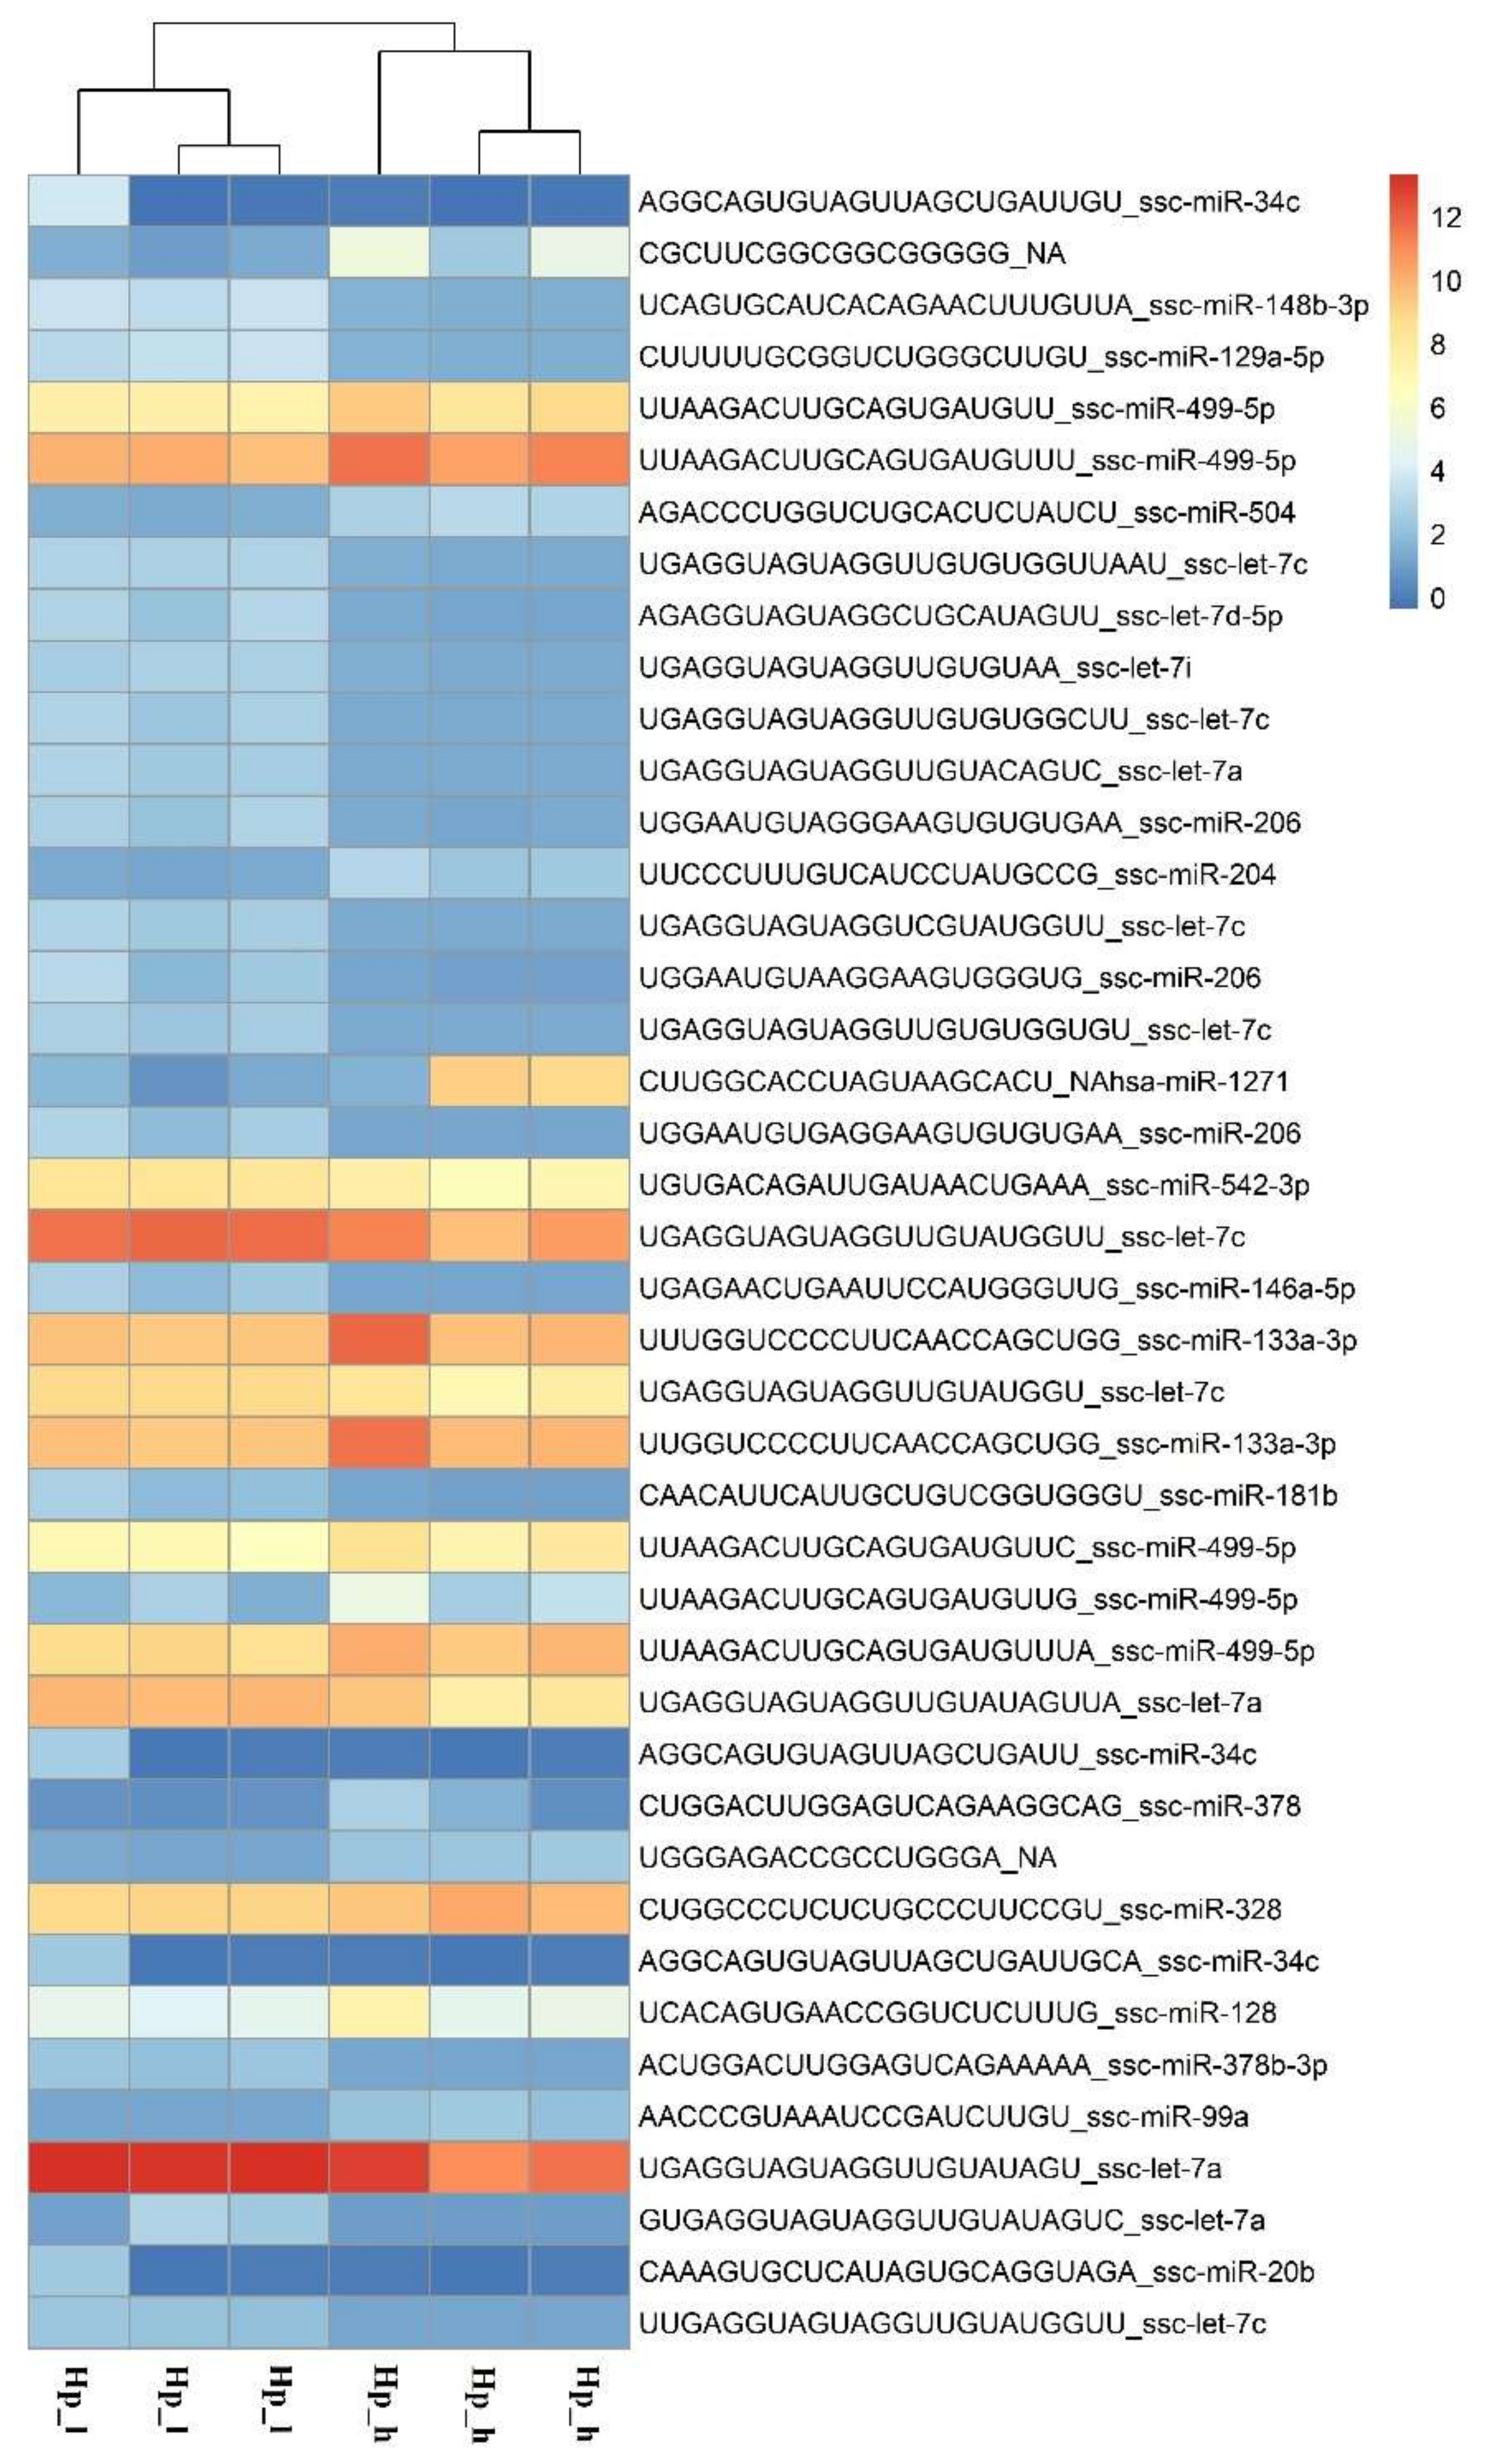
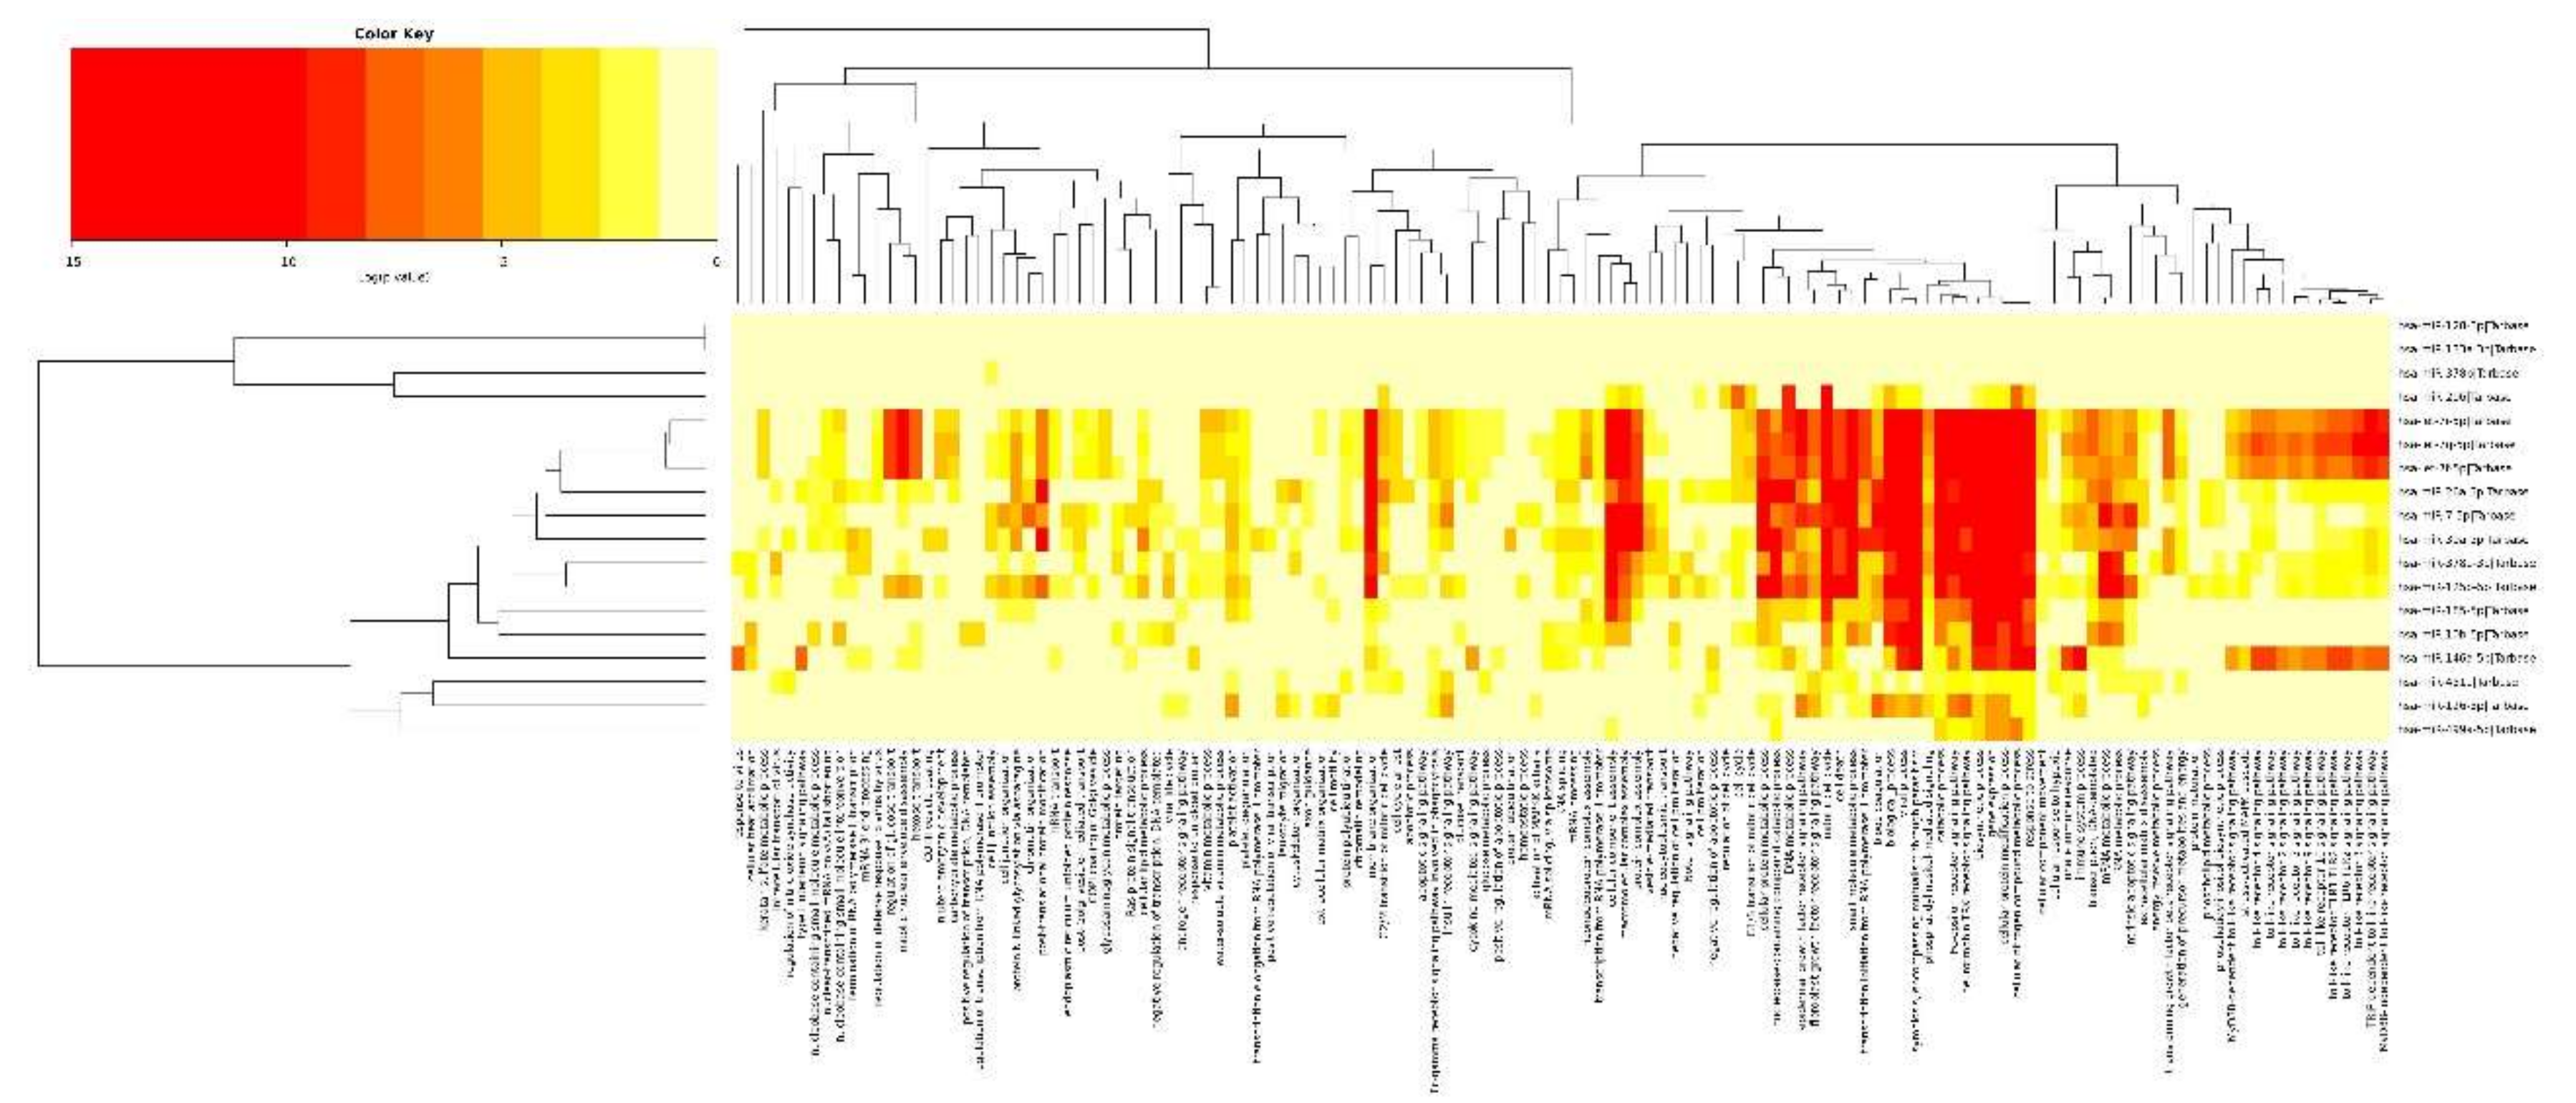
2.2. miRNAome Analysis—Differentially Expressed miRNA
2.3. Integrated Analysis of Transcriptome and miRNAome
2.4. Validation of the Obtained Results
3. Discussion
4. Materials and Methods
4.1. Animals
4.2. Transcriptome Sequencing and Data Analysis
4.3. miRNAome Sequencing and Data Analysis
4.4. Validation of NGS Data by qPCR
5. Conclusions
Supplementary Materials
Acknowledgments
Author Contributions
Conflicts of Interest
References
- Wang, Z.; Gerstein, M.; Snyder, M. RNA-Seq: A revolutionary tool for transcriptomics. Nat. Rev. Genet. 2009, 10, 57–63. [Google Scholar] [CrossRef] [PubMed]
- Ropka-Molik, K.; Żukowski, K.; Eckert, R.; Gurgul, A.; Piórkowska, K.; Oczkowicz, M. Comprehensive analysis of the whole transcriptomes from two different pig breeds using RNA-seq method. Anim. Genet. 2014, 45, 674–684. [Google Scholar] [CrossRef] [PubMed]
- Wang, Z.; Li, Q.; Chamba, Y.; Zhang, B.; Shang, P.; Zhang, H.; Wu, H. Correction: Identification of Genes Related to Growth and Lipid Deposition from Transcriptome Profiles of Pig Muscle Tissue. PLoS ONE 2017, 12, e0172930. [Google Scholar] [CrossRef] [PubMed]
- Ropka-Molik, K.; Żukowski, K.; Eckert, R.; Piórkowska, K.; Oczkowicz, M.; Gurgul, A.; Szmatoła, T. Whole transcriptome analysis of the porcine muscle tissue of breeds differing in muscularity and meat quality traits. Livest. Sci. 2015, 182, 93–100. [Google Scholar] [CrossRef]
- Güller, I.; Russell, A.P. MicroRNAs in skeletal muscle: Their role and regulation in development, disease and function. J. Physiol. 2010, 588, 4075–4087. [Google Scholar] [CrossRef] [PubMed]
- Kovanda, A.; Režen, T.; Rogelj, B. MicroRNA in skeletal muscle development, growth, atrophy, and disease. Wiley Interdiscip. Rev. RNA 2014, 5, 509–525. [Google Scholar] [CrossRef] [PubMed]
- Liu, N.; Bassel-Duby, R. Regulation of skeletal muscle development and disease by microRNAs. Results Probl. Cell Differ. 2015, 56, 165–190. [Google Scholar] [PubMed]
- Verardoa, L.L.; Nascimentoa, C.S.; Silvab, F.F.; Gasparinoc, E.; Toriyamaa, E.; Barbosaa, A.R.; Périsséd, I.V.; Cpstaa, K.A.; Lopesa, P.S.; Guimarãe, S.E.F. Identification and expression levels of pig miRNAs in skeletal muscle. Livest. Sci. 2013, 154, 45–54. [Google Scholar] [CrossRef]
- Tang, Z.; Yang, Y.; Wang, Z.; Zhao, S.; Mu, Y.; Li, K. Integrated analysis of miRNA and mRNA paired expression profiling of prenatal skeletal muscle development in three genotype pigs. Sci. Rep. 2015, 5, 15544. [Google Scholar] [CrossRef] [PubMed]
- Vlachos, I.S.; Vergoulis, T.; Paraskevopoulou, M.D.; Lykokanellos, F.; Georgakilas, G.; Georgiou, P.; Chatzopoulos, S.; Karagkouni, D.; Christodoulou, F.; Dalamagas, T.; et al. DIANA-mirExTra v2.0: Uncovering microRNAs and transcription factors with crucial roles in NGS expression data. Nucleic Acids Res. 2016, 44, W128–W134. [Google Scholar] [CrossRef] [PubMed]
- Hu, W.; Coller, J. What comes first: Translational repression or mRNA degradation? The deepening mystery of microRNA function. Cell Res. 2012, 22, 1322–1324. [Google Scholar] [CrossRef] [PubMed]
- Bartel, D.P. MicroRNAs: Genomics, biogenesis, mechanism, and function. Cell 2004, 116, 281–297. [Google Scholar] [CrossRef]
- Lim, L.P.; Lau, N.C.; Garrett-Engele, P.; Grimson, A.; Schelter, J.M.; Castle, J.; Bartel, D.P.; Linsley, P.S.; Johnson, J.M. Microarray analysis shows that some microRNAs downregulate large numbers of target mRNAs. Nature 2005, 433, 769–773. [Google Scholar] [CrossRef] [PubMed]
- Morozova, N.; Zinovyev, A.; Nonne, N.; Pritchard, L.L.; Gorban, A.N.; Harel-Bellan, A. Kinetic signatures of microRNA modes of action. RNA 2012, 18, 1635–1655. [Google Scholar] [CrossRef] [PubMed]
- Li, M.; Li, X.; Zhua, L.; Teng, X.; Xiao, H.; Shuai, S.; Chen, L.; Li, Q.; Guo, Y. Differential expression analysis and regulatory network reconstruction for genes associated with muscle growth and adipose deposition in obese and lean pigs. Prog. Nat. Sci. 2008, 18, 387–399. [Google Scholar] [CrossRef]
- Schrauwen, P.; Hesselink, M. UCP2 and UCP3 in muscle controlling body metabolism. J. Exp. Biol. 2002, 205, 2275–2285. [Google Scholar] [PubMed]
- Schrauwen, P. Skeletal muscle uncoupling protein 3 (UCP3): Mitochondrial uncoupling protein in search of a function. Curr. Opin. Clin. Nutr. Metab. Care 2002, 5, 265–270. [Google Scholar] [CrossRef] [PubMed]
- Guess, M.G.; Barthel, K.K.B.; Harrison, B.C.; Leinwand, L.A. miR-30 Family microRNAs Regulate Myogenic Differentiation and Provide Negative Feedback on the microRNA Pathway. PLoS ONE 2015, 10, e0118229. [Google Scholar] [CrossRef] [PubMed]
- Kim, H.K.; Lee, Y.S.; Sivaprasad, U.; Malhotra, A.; Dutta, A. Muscle-specific microRNA miR-206 promotes muscle differentiation. J. Cell Biol. 2006, 174, 677–687. [Google Scholar] [CrossRef] [PubMed]
- Liu, N.; Williams, A.H.; Maxeiner, J.M.; Bezprozvannaya, S.; Shelton, J.M.; Richardson, J.A.; Bassel-Duby, R.; Olson, E.N. microRNA-206 promotes skeletal muscle regeneration and delays progression of Duchenne muscular dystrophy in mice. J. Clin. Investig. 2012, 122, 2054–2065. [Google Scholar] [CrossRef] [PubMed]
- Sheng, X.; Wang, L.; Ni, H.; Wang, L.; Qi, X.; Xing, S.; Guo, Y. Comparative Analyses between Skeletal Muscle miRNAomes from Large White and Min Pigs Revealed MicroRNAs Associated with Postnatal Muscle Hypertrophy. PLoS ONE 2016, 11, e0156780. [Google Scholar] [CrossRef] [PubMed]
- Cai, Z.; Zhang, L.; Jiang, X.; Sheng, Y.; Xu, N. Differential miRNA expression profiles in the longissimus dorsi muscle between intact and castrated male pigs. Res. Vet. Sci. 2015, 99, 99–104. [Google Scholar] [CrossRef] [PubMed]
- Huang, M.B.; Xu, H.; Xie, S.J.; Zhou, H.; Qu, L.H. Insulin-like growth factor-1 receptor is regulated by microRNA-133 during skeletal myogenesis. PLoS ONE 2011, 6, e29173. [Google Scholar] [CrossRef] [PubMed]
- Yan, B.; Zhu, C.D.; Guo, J.T.; Zhao, L.H.; Zhao, J.L. miR-206 regulates the growth of the teleost tilapia (Oreochromis niloticus) through the modulation of IGF-1 gene expression. J. Exp. Biol. 2013, 216, 1265–1269. [Google Scholar] [CrossRef] [PubMed]
- Rivas, D.A.; Lessard, S.J.; Rice, N.P.; Lustgarten, M.S.; Therefore, K.; Goodyear, L.J.; Parnell, L.D.; Fielding, R.A. Diminished skeletal muscle microRNA expression with aging is associated with attenuated muscle plasticity and inhibition of IGF-1 signaling. FASEB J. 2014, 28, 4133–4147. [Google Scholar] [CrossRef] [PubMed]
- Zaharieva, I.T.; Calissano, M.; Scoto, M.; Preston, M.; Cirak, S.; Feng, L.; Collins, J.; Kole, R.; Guglieri, M.; Straub, V.; et al. Dystromirs as serum biomarkers for monitoring the disease severity in Duchenne muscular dystrophy. PLoS ONE 2013, 8, e80263. [Google Scholar] [CrossRef] [PubMed]
- Larrouy, D.; Barbe, P.; Valle, C.; Déjean, S.; Pelloux, V.; Thalamas, C.; Bastard, J.P.; Le Bouil, A.; Diquet, B.; Clément, K.; et al. Gene expression profiling of human skeletal muscle in response to stabilized weight loss. Am. J. Clin. Nutr. 2008, 88, 125–132. [Google Scholar] [CrossRef] [PubMed]
- Yi, X.; Tao, Y.; Lin, X.; Dai, Y.; Yang, T.; Yue, X.; Jiang, X.; Li, X.; Jiang, D.S.; Andrade, K.C.; et al. Histone methyltransferase Setd2 is critical for the proliferation and differentiation of myoblasts. Biochim. Biophys. Acta 2017, 1864, 697–707. [Google Scholar] [CrossRef] [PubMed]
- Wackerhage, H.; Del Re, D.P.; Judson, R.N.; Sudol, M.; Sadoshima, J. The Hippo signal transduction network in skeletal and cardiac muscle. Sci. Signal. 2014, 7, re4. [Google Scholar] [CrossRef] [PubMed]
- Watt, K.I.; Turner, B.J.; Hagg, A.; Zhang, X.; Davey, J.R.; Qian, H.; Beyer, C.; Winbanks, C.E.; Harvey, K.F.; Gregorevic, P. The Hippo pathway effector YAP is a critical regulator of skeletal muscle fibre size. Nat. Commun. 2015, 6, 6048. [Google Scholar] [CrossRef] [PubMed]
- Meng, Z.; Moroishi, T.; Guan, K.-L. Mechanisms of Hippo pathway regulation. Genes Dev. 2016, 30, 1–17. [Google Scholar] [CrossRef] [PubMed]
- Csibi, A.; Blenis, J. Hippo-YAP and mTOR pathways collaborate to regulate organ size. Nat. Cell Biol. 2012, 14, 1244–1245. [Google Scholar] [CrossRef] [PubMed]
- Gnimassou, O.; Francaux, M.; Deldicque, L. Hippo Pathway and Skeletal Muscle Mass Regulation in Mammals: A Controversial Relationship. Front. Physiol. 2017, 8, 190. [Google Scholar] [CrossRef] [PubMed]
- Obsilová, V.; Silhan, J.; Boura, E.; Teisinger, J.; Obsil, T. 14-3-3 proteins: A family of versatile molecular regulators. Physiol. Res. 2008, 57, S11–S21. [Google Scholar] [PubMed]
- Kleppe, R.; Martinez, A.; Døskeland, S.O.; Haavik, J. The 14-3-3 proteins in regulation of cellular metabolism. Cell Dev. Biol. 2011, 22, 713–719. [Google Scholar] [CrossRef] [PubMed]
- Schiaffino, S.; Dyar, K.A.; Ciciliot, S.; Blaauw, B.; Sandri, M. Mechanisms regulating skeletal muscle growth and atrophy. FEBS J. 2013, 280, 4294–4314. [Google Scholar] [CrossRef] [PubMed]
- Raz, V.; Sterrenburg, E.; Routledge, S.; Venema, A.; van der Sluijs, B.M.; Trollet, C.; Dickson, G.; van Engelen, B.G.; van der Maarel, S.M.; Antoniou, M.N. Nuclear entrapment and extracellular depletion of PCOLCE is associated with muscle degeneration in oculopharyngeal muscular dystrophy. BMC Neurol. 2013, 13, 70. [Google Scholar] [CrossRef] [PubMed]
- Giusti, B.; Lucarini, L.; Pietroni, V.; Lucioli, S.; Bandinelli, B.; Sabatelli, P.; Squarzoni, S.; Petrini, S.; Gartioux, C.; Talim, B.; et al. Dominant and recessive COL6A1 mutations in Ullrich scleroatonic muscular dystrophy. Ann. Neurol. 2005, 58, 400–410. [Google Scholar] [CrossRef] [PubMed]
- Martoni, E.; Urciuolo, A.; Sabatelli, P.; Fabris, M.; Bovolenta, M.; Neri, M.; Grumati, P.; D’Amico, A.; Pane, M.; Mercuri, E.; et al. Identification and characterization of novel collagen VI non-canonical splicing mutations causing Ullrich congenital muscular dystrophy. Hum. Mutat. 2009, 30, E662–E672. [Google Scholar] [CrossRef] [PubMed]
- Zhu, B.; Zhang, M.; Byrum, S.D.; Tackett, A.J.; Davie, J.K. TBX2 blocks myogenesis and promotes proliferation in rhabdomyosarcoma cells. Int. J. Cancer 2014, 135, 785–797. [Google Scholar] [CrossRef] [PubMed]
- Zhu, B.; Zhang, M.; Williams, E.M.; Keller, C.; Mansoor, A.; Davie, J.K. TBX2 represses PTEN in rhabdomyosarcoma and skeletal muscle. Oncogene 2016, 35, 4212–4224. [Google Scholar] [CrossRef] [PubMed]
- Ropka-Molik, K.; Dusik, A.; Piórkowska, K.; Tyra, M.; Oczkowicz, M.; Szmatoła, T. Polymorphisms of the membrane-associated ring finger 4, ubiquitin protein ligase gene (MARCH4) and its relationship with porcine production traits. Livest. Sci. 2015, 178, 18–26. [Google Scholar] [CrossRef]
- Ropka-Molik, K.; Stefaniuk-Szmukier, M.; Żukowski, K.; Piórkowska, K.; Gurgul, A.; Bugno-Poniewierska, M. Transcriptome profiling of Arabian horse blood during training regimens. BMC Genet. 2017, 18, 31. [Google Scholar] [CrossRef] [PubMed]
- Love, M.I.; Huber, W.; Anders, S. Moderated estimation of fold change and dispersion for RNA-seq data with DESeq2. Genome Biol. 2014, 15, 550. [Google Scholar] [CrossRef] [PubMed]
- Mi, H.; Huang, X.; Muruganujan, A.; Tang, H.; Mills, C.; Kang, D.; Thomas, P.D. PANTHER version 11: Expanded annotation data from Gene Ontology and Reactome pathways, and data analysis tool enhancements. Nucleic Acids Res. 2017, 45, D183–D189. [Google Scholar] [CrossRef] [PubMed]
- Huang, D.W.; Sherman, B.T.; Lempicki, R.A. Bioinformatics enrichment tools: Paths toward the comprehensive functional analysis of large gene lists. Nucleic Acids Res. 2009, 37, 1–13. [Google Scholar] [CrossRef] [PubMed]
- Andrews, S. FastQC: A Quality Control Tool for High Throughput Sequence Data. 2010. Available online: http://www.bioinformatics.babraham.ac.uk/projects/fastqc (accessed on 1 May 2017).
- Stocks, M.B.; Moxon, S.; Mapleson, D.; Woolfenden, H.C.; Mohorianu, I.; Folkes, L.; Schwach, F.; Dalmay, T.; Moulton, V. The UEA sRNA workbench: A suite of tools for analysing and visualizing next generation sequencing microRNA and small RNA datasets. Bioinformatics 2012, 28, 2059–2061. [Google Scholar] [CrossRef] [PubMed]
- Griffiths-Jones, S.; Grocock, R.J.; van Dongen, S.; Bateman, A.; Enright, A.J. Mirbase: microRNA sequences, targets and gene nomenclature. Nucleic Acids Res. 2006, 34, D140–D144. [Google Scholar] [CrossRef] [PubMed]
- Griffiths-Jones, S.; Saini, H.K.; van Dongen, S.; Enright, A.J. miRBase: Tools for microRNA genomics. Nucleic Acids Res. 2008, 36, D154–D158. [Google Scholar] [CrossRef] [PubMed]
- The RNAcentral Consortium. RNAcentral: A Comprehensive Database of Non-Coding RNA Sequences. Nucleic Acids Res. 2017, 45, D128–D134. [Google Scholar]
- Urgese, G.; Paciello, G.; Acquaviva, A.; Ficarra, E. isomiR-SEA: An RNA-Seq analysis tool for miRNAs/isomiRs expression level profiling and miRNA-mRNA interaction sites evaluation. BMC Bioinf. 2016, 17, 148. [Google Scholar] [CrossRef] [PubMed]
- Vlachos, I.S.; Zagganas, K.; Paraskevopoulou, M.D.; Georgakilas, G.; Karagkouni, D.; Vergoulis, T.; Dalamagas, T.; Hatzigeorgiou, A.G. DIANA-miRPath v3.0: Deciphering microRNA function with experimental support. Nucleic Acids Res. 2015, 43, W460–W466. [Google Scholar] [CrossRef] [PubMed]
- Vlachos, I.S.; Paraskevopoulou, M.D.; Karagkouni, D.; Georgakilas, G.; Vergoulis, T.; Kanellos, I.; Anastasopoulos, I-L.; Maniou, S.; Karathanou, K.; Kalfakakou, D.; et al. DIANA-TarBase v7.0: indexing more than half a million experimentally supported miRNA:mRNA interactions. Nucleic Acids Res. 2015, 43, D153–D159. [Google Scholar] [CrossRef] [PubMed]
- Pfaffl, M.W. A new mathematical model for relative quantification in real-time RT-PCR. Nucleic Acids Res. 2001, 29, e45. [Google Scholar] [CrossRef] [PubMed]
- Andersen, C.L.; Jensen, J.L.; Ørntoft, T.F. Normalization of real-time quantitative reverse transcription-PCR data: A model-based variance estimation approach to identify genes suited for normalization, applied to bladder and colon cancer data sets. Cancer Res. 2004, 64, 5245–5250. [Google Scholar] [CrossRef] [PubMed]


| GO Term | p-Value/Genes | Number of Genes Detected/Genes | Hp | Pi | |
|---|---|---|---|---|---|
| Signal transduction | 0.034 | 11 | FC | FC | |
| ENSSSCG00000013901 | IFI30 | IFI30, lysosomal thiol reductase | 1.82 | 1.37 | |
| ENSSSCG00000009668 | CLU | clusterin | 1.92 | 1.45 | |
| ENSSSCG00000028022 | COL6A2 | collagen type VI alpha 2 chain | 1.71 | 1.36 | |
| ENSSSCG00000022236 | FOLR1 | folate receptor 1 (adult) | 2.01 | 1.53 | |
| ENSSSCG00000022246 | ICOSLG | inducible T-cell costimulator ligand | 1.83 | 1.39 | |
| ENSSSCG00000011129 | ITIH5 | inter-alpha-trypsin inhibitor heavy chain family member 5 | 1.67 | 1.38 | |
| ENSSSCG00000000606 | MGP | matrix Gla protein | 2.04 | 1.30 | |
| ENSSSCG00000026934 | PIGX | phosphatidylinositol glycan anchor biosynthesis class X | 1.27 | 1.36 | |
| ENSSSCG00000027466 | PCOLCE | procollagen C-endopeptidase enhancer | 2.23 | 1.27 | |
| ENSSSCG00000013181 | SERPING1 | serpin family G member 1 | 2.38 | 1.27 | |
| ENSSSCG00000014834 | UCP3 | uncoupling protein 3 | 2.73 | 1.68 | |
| Nucleid acid binding | 0.010 | 9 | |||
| ENSSSCG00000014834 | UCP3 | uncoupling protein 3 | 2.73 | 1.68 | |
| ENSSSCG00000007830 | RBBP6 | RB binding protein 6, ubiquitin ligase | 2.06 | 1.25 | |
| ENSSSCG00000027060 | TBX2 | T-box 2 | 1.73 | 1.39 | |
| ENSSSCG00000011332 | SETD2 | SET domain containing 2 | 1.87 | 1.27 | |
| ENSSSCG00000006276 | CEBPD | CCAAT/enhancer binding protein delta | 2.57 | 1.38 | |
| ENSSSCG00000027946 | MVP | major vault protein | 1.32 | 1.53 | |
| ENSSSCG00000003670 | RLF | rearranged L-myc fusion | 1.80 | 1.25 | |
| ENSSSCG00000026631 | SLC25A6 | solute carrier family 25 Member 6 | 1.73 | 1.35 | |
| ENSSSCG00000028035 | ZC3H11A | zinc finger CCCH-Type Containing 11A | 2.73 | 1.68 | |
| Cytoplasm | 0.032 | 5 | |||
| ENSSSCG00000025417 | BBS2 | Bardet-Biedl syndrome 2 | 1.37 | 1.35 | |
| ENSSSCG00000009668 | CLU | clusterin | 1.92 | 1.45 | |
| ENSSSCG00000017428 | JUP | junction plakoglobin | 1.31 | 1.39 | |
| ENSSSCG00000004103 | PCMT1 | protein-L-isoaspartate (D-aspartate) O-methyltransferase | 1.46 | 1.26 | |
| ENSSSCG00000006066 | RNF19A | ring finger protein 19A, RBR E3 ubiquitin protein ligase | 2.10 | 1.31 | |
| Enzyme modulator | 0.015 | 4 | |||
| ENSSSCG00000003201 | ATF5 | activating transcription factor 5 | 1.51 | 1.54 | |
| ENSSSCG00000013181 | SERPING1 | serpin family G member 1 | 2.38 | 1.27 | |
| ENSSSCG00000011129 | ITIH5 | inter-Alpha (Globulin) Inhibitor H5 | 1.67 | 1.38 | |
| ENSSSCG00000013074 | RAB3IL1 | RAB3A Interacting Protein Like 1 | 2.16 | 1.59 | |
| Cytoskeleton | 0,021 | 3 | |||
| ENSSSCG00000025417 | BBS2 | Bardet-Biedl syndrome 2 | 1.37 | 1.35 | |
| ENSSSCG00000017428 | JUP | junction plakoglobin | 1.31 | 1.39 | |
| ENSSSCG00000006066 | RNF19A | ring finger protein 19A, RBR E3 ubiquitin protein ligase | 2.10 | 1.31 | |
| Methyltransferase | 0.0066 | 3 | |||
| ENSSSCG00000011332 | SETD2 | SET domain containing 2 | 1.87 | 1.27 | |
| ENSSSCG00000015311 | CYP51 | cytochrome P450, family 51, subfamily A, polypeptide 1 | 2.27 | 1.41 | |
| ENSSSCG00000004103 | PCMT1 | protein-L-isoaspartate (D-aspartate) O-methyltransferase | 1.46 | 1.26 | |
| GO | Detected miRNA | N | Most Interesting Genes Related with GO Term | p-Value |
|---|---|---|---|---|
| Cell cycle (hsa04110) | 1.026 × 10⁻⁹ | |||
| hsa-let-7i-5p | 32 | CDK4; CDK2; CDK6; TP53; RBL2; ESPL1; ORC2 | ||
| hsa-let-7g-5p | 33 | CDK4; CDK2; CDK6; TP53; RBL2; ESPL1; ORC2 | ||
| hsa-miR-30a-5p | 24 | PCNA; SMAD2; TP53; MYC; YWHAE | ||
| hsa-let-7f-5p | 35 | ESPL1; CCNB2; RBL2; SMC1A; CDK4; TP53; ATR | ||
| hsa-miR-499a-5p | 7 | YWHAG; E2F5; SKP2; MYC; CDC27; PRKDC; MDM2 | ||
| hsa-miR-146a-5p | 12 | GSK3B; CCNB1; CCNA2; SMAD4; RBL1; CDC23; PRKDC; MDM2; ABL1 | ||
| hsa-miR-378a-3p | 20 | CCNB1; YWHAG; CCND2; MCM4; CDK1; BUB3; MDM2 | ||
| hsa-miR-10b-5p | 13 | YWHALE; CDK2; CCND2; CUL1; TP53; CDC27 | ||
| hsa-miR-7-5p | 20 | YWHAH; YWHAE; CCNB1; E2F2; CDK2; ATM; | ||
| hsa-miR-26a-5p | 32 | CDC6; CCNB1; YWHAE; YWHAG; YWHAZ; SMAD4; WEE1; EP300 | ||
| hsa-miR-185-5p | 16 | CDK4; YWHAE; YWHAG; YWHAB; YWHAQ; ORC4; | ||
| hsa-miR-126-3p | 4 | E2F1; E2F3; CCNE2; CCNE1 | ||
| hsa-miR-125b-5p | 19 | CDC6; E2F2; E2F3; ATR; TP53; CUL1; ORC5 | ||
| hsa-miR-206 | 9 | CDK4; CCND2; CDC7; WEE1; MCM7; CDC25C | ||
| Fatty acid biosynthesis (hsa00061) | ||||
| hsa-miR-30a-5p | 4 | FASN; ACSL1; ACSL3; ACSL4 | 6.038 × 10⁻⁹ | |
| hsa-miR-26a-5p | 4 | FASN; ACSL1; ACSL3; ACSL4 | ||
| hsa-miR-378a-3p | 2 | ACSL4; ACACA | ||
| hsa-miR-7-5p | 4 | FASN; OXSM; ACACA; ACSL4 | ||
| hsa-let-7i-5p | 1 | MCAT | ||
| hsa-let-7g-5p | 1 | MCAT | ||
| hsa-let-7f-5p | 1 | MCAT | ||
| hsa-miR-125b-5p | 1 | FASN | ||
| Regulation of actin cytoskeleto n (hsa04810) | 0.0218 | |||
| hsa-let-7i-5p | 31 | PPP1CA; PFN1; BRAF; ACTB; SSH2; CRK; GNA13; FN1; RAC1; VAV3; MAPK1; FGFR1 | ||
| hsa-let-7g-5p | 31 | PPP1CA; PFN1; BRAF; ACTB; SSH2; CRK; GNA13; FN1; RAC1; VAV3; MAPK1; FGFR1 | ||
| hsa-miR-125b-5p | 27 | SSH2; EZR; NRAS; CRKL; CRK; PAK2; PXN; MYL9; FGFR2; FGFR1; MYH9 | ||
| hsa-let-7f-5p | 32 | PPP1CA; PFN1; BRAF; ACTB; SSH2; CRK; GNA13; FN1; RAC1; VAV3; MAPK1; FGFR1 | ||
| hsa-miR-378a-3p | 17 | ACTB; SSH2; ITGA9; CRKL; GNA13; PFN2; PAK4; MAPK1; MYLK | ||
| hsa-miR-146a-5p | 9 | BRK1; ROCK1; WASL; EDFR; ACTN1; ITGB2; WASF2 | ||
| hsa-miR-7-5p | 35 | ACTB; ACTN2; NRAS; APC; RRAS2; FN1; FGF1; ACTN4; MAPK1; PIK3CB; EGFR | ||
| hsa-miR-185-5p | 14 | PIP5K1C; FN1; MYLK; ENAH; CDC42; ITGB5; RHOA; EGFR; PPP1CC | ||
| hsa-miR-378b | 4 | SSH2; ITGB1; ROCK2; MSN | ||
| hsa-miR-26a-5p | 32 | SSH2; EZR; NRAS; CRK; ITGA8; PAK1; ITGB3; ITGA6 | ||
| hsa-miR-30a-5p | 29 | ARPC5; WASL; NRAS; SSH1; GNA13; EGFR; FN1; RAC1; PIK3CA; PPP1CB | ||
| hsa-miR-10b-5p | 6 | CRK; ARPC5; ACTG1; TIAMI; PIK3CD; DIAPH2 | ||
| hsa-miR-126-3p | 8 | PIK3CA; PIK3CD; ITGA6; MAPK1; KRAS; CRK; PIK3R2 | ||
| hsa-miR-451a | 3 | BRAF; WASL; PIK3CA | ||
| hsa-miR-206 | 2 | EGFR; FN1 | ||
| hsa-miR-499a-5p | 2 | CFL2; FGF2 | ||
| Lysine degradation (hsa00310) | ||||
| hsa-let-7i-5p | 12 | WHC1L1; SETD1B; PLOD2; ASHIL; SETD1A; KMT2B | 7.854 × 10⁻⁷ | |
| hsa-let-7g-5p | 11 | PLOD2; SETD1B; ASH1L; DOT1L; KMT2D; KMT2E | ||
| hsa-miR-125b-5p | 7 | KMT2D; WHSC1; KMT2C; KMT2B; SUV39H1; SUV420H2 | ||
| hsa-let-7f-5p | 12 | ALDH7A1; SETD1B; KMT2D; DOT1L; SETD1A; KMT2B; KMT2E | ||
| hsa-miR-7-5p | 15 | ALDH3A2; SETD1B; PLOD2; PLOD1; SETD2; NSD1; OGDH; | ||
| hsa-miR-378a-3p | 4 | SETD7; ASH1L; KMT2D; SUV420H1 | ||
| hsa-miR-30a-5p | 12 | SETD7; PLOD2; OGDH; NSD1; SETD2; ALDH2 | ||
| hsa-miR-185-5p | 3 | ASHIL; KMT2D; WHSC1 | ||
| hsa-miR-10b-5p | 4 | SETD7; SUV420H1; WHSC1L1; ALDH3A2 | ||
| hsa-miR-26a-5p | 9 | SETD2; NSD1; ACAT2; SETD8; SETDB1; KMT2D; KMT2C; KMT2A; ALDH9A1 | ||
| hsa-miR-146a-5p | 2 | NSD1; KMT2C | ||
| Ubiquitin mediated proteolysis (hsa04120) | ||||
| hsa-let-7i-5p | 29 | BCBL; MAP3KI; UBE3B; BTRC; HUWEI; SKP2; NEDD4L; MID1U; BOX5 | 9.766 × 10⁻⁵ | |
| hsa-let-7g-5p | 30 | UBE3B; CBL; CUL2; NEDD4L; MAP3K1; MID1; BIRC3; UBOX5; SKP2 | ||
| hsa-miR-30a-5p | 42 | UBE3B; CUL2; NEDD4L; MAP3K1; MID1; BIRC3; UBOX5; SKP2; UBA6; SEA1 | ||
| hsa-let-7f-5p | 29 | UBE2Z; CBL; UBE2R2; UBR5; STUB1; XIAP; FBXW7; BIRC6 | ||
| hsa-miR-7-5p | 23 | UBE2Z; CBL; UBE2R2; UBR5; STUB1; XIAP; FBXW7; BIRC6 | ||
| hsa-miR-26a-5p | 23 | WWP2; SMURF2; HUWE1; SKP1; BRCA1; CDC23; MDM2; | ||
| hsa-miR-378a-3p | 9 | UBE2Z; CBL; BTRC; FBXW7; HUWE1; PML; RBX1; MDM2 | ||
| hsa-miR-206 | 1 | BRCA1 | ||
| hsa-miR-146a-5p | 6 | ITCH; MID1; BRCA1; TRAF6; CDC23; MDM2 | ||
| hsa-miR-10b-5p | 11 | UBE2Z; UBE3B; CUL1; BRCA1; NEDD4; CDC27; MDM2 | ||
| hsa-miR-185-5p | 12 | UBE2Z; UBR5; HUWE1; BIRC6; MDM2; TRIP12; UBE4A | ||
| hsa-miR-125b-5p | 10 | HUWE1; CUL1; UBA6; BIRC6; SAE1; CDC27; XIAP | ||
| hsa-miR-499a-5p | 4 | SKP2; CDC27; MDM2; KLHL9 | ||
| hsa-miR-126-3p | 2 | UBE2K; FBXW11 | ||
| hsa-miR-378b | 1 | RBX1 | ||
| Pathway | miRNA Involved in Pathway Regulation | n | Target Genes | p-Value |
|---|---|---|---|---|
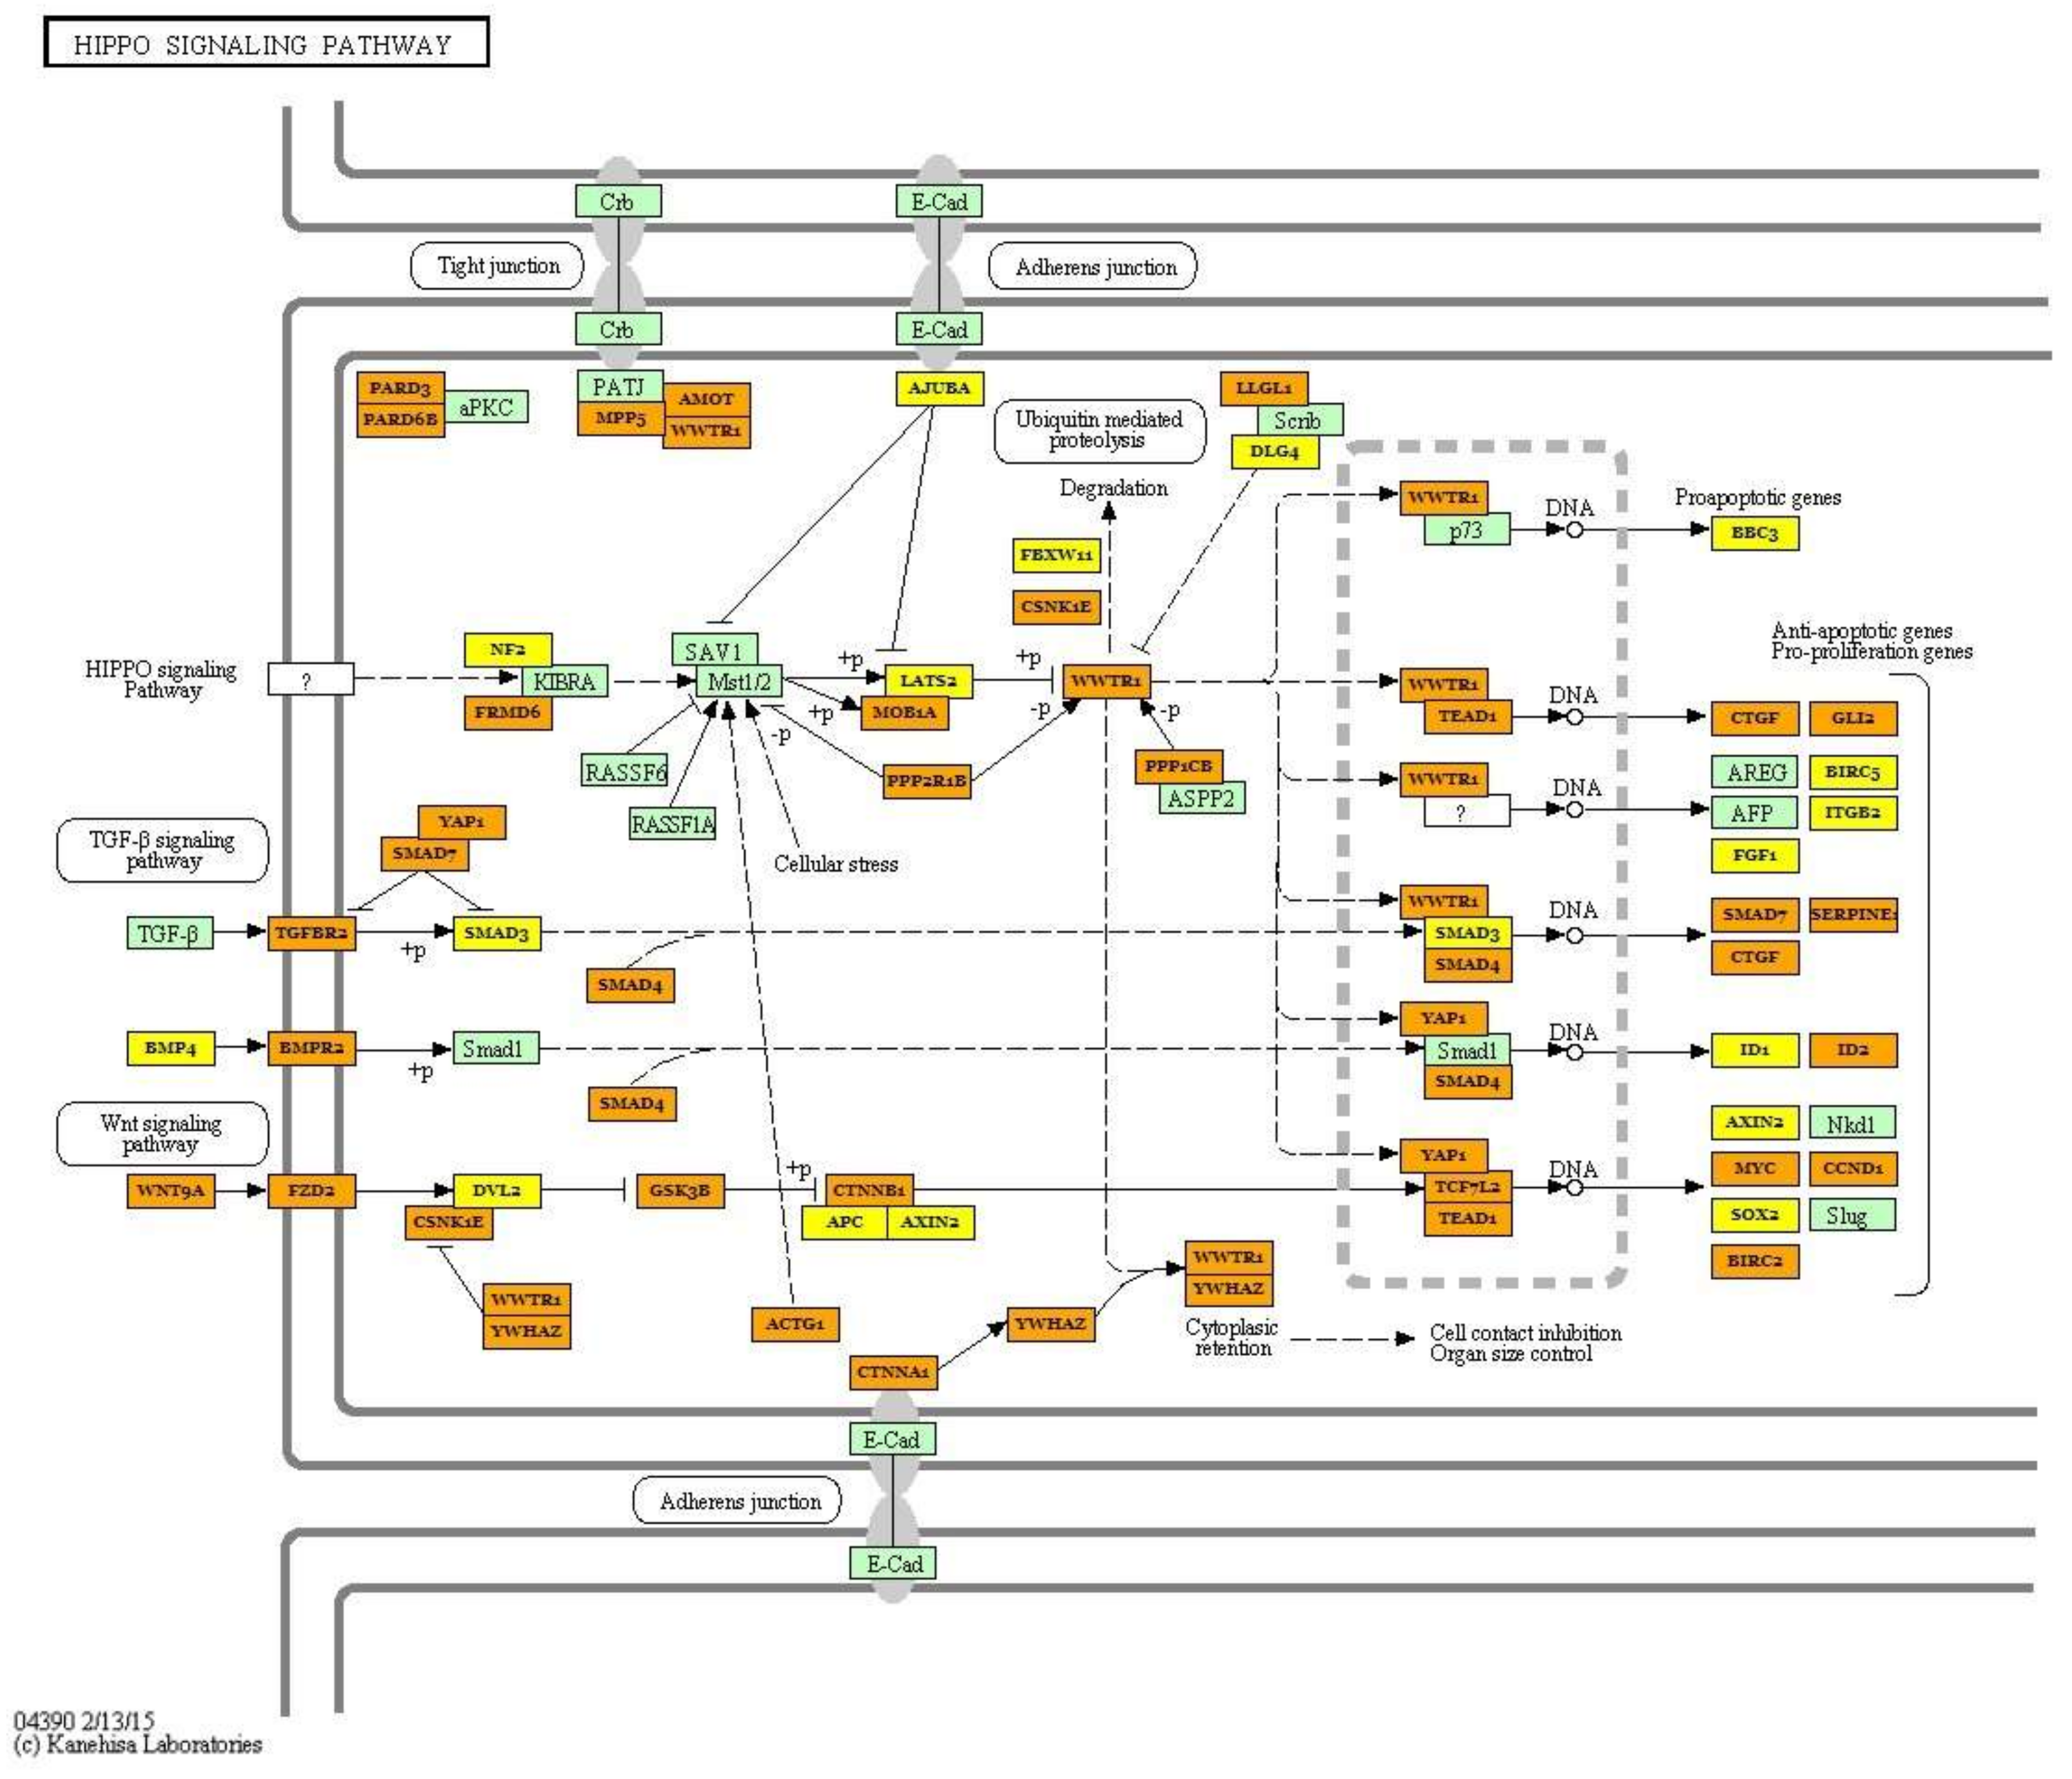
| Hippo signaling pathway (hsa04390) | hsa-miR-499a-5p; hsa-miR-30a-5p, hsa-miR-7-5p; hsa-let-7i-5p; hsa-let-7g-5p; hsa-miR-125b-5p; hsa-let-7f-5p; hsa-miR-26a-5p; hsa-miR-185-5p; hsa-miR-146a-5p;hsa-miR-10b-5p; hsa-miR-378a-3p; hsa-miR-451a; hsa-miR-126-3p; hsa-miR-206; hsa-miR-378b | 87 | PPP1CA; ACTB; TGFBR1; BMP5; BMPR1B; WNT5A; YWHAE; WNT10B; WNT3A; WNT8B; BMP2; YWHAB; YWHAQ; MOB1B; SMAD4; BMP4; SOX2; BMPR2 | 6.038 × 10⁻⁹ |
| FoxO signaling pathway (hsa04068) | hsa-let-7i-5p; hsa-let-7g-5p; hsa-let-7f-5p; hsa-miR-206; hsa-miR-378a-3p; hsa-miR-30a-5p; hsa-miR-7-5p; hsa-miR-185-5p; hsa-miR-26a-5p; hsa-miR-126-3p; hsa-miR-499a-5p; hsa-miR-146a-5p; hsa-miR-451a; hsa-miR-125b-5p; hsa-miR-10b-5p | 88 | BRAF; NRAS; KRAS; TGFBR1; TGFBR2; PIK3R2; FBX032; IGFR; SIRT1; IRS2; FOXO6; FOXO3; USP7 | 2.159 × 10⁻⁸ |
| TGF-β signaling pathway (hsa04350) | hsa-miR-10b-5p; hsa-let-7i-5p; hsa-let-7g-5p; hsa-miR-30a-5p; hsa-let-7f-5p; hsa-miR-26a-5p;hsa-miR-378a-3p; hsa-miR-499a-5p; hsa-miR-451a; hsa-miR-7-5p; hsa-miR-126-3p, hsa-miR-146a-5p; hsa-miR-125b-5p; hsa-miR-185-5p; hsa-miR-378b; hsa-miR-206 | 50 | FST; TGFBR1; ID2; ID4; ROCK1; SMAD2; SMAD3; SMAD4; SMAD7; SP1; BMP4; BMP2; BMP5; BMPR1B; BMPR2; MAPK1 | 1.357 × 10⁻⁶ |
| PI3K-Akt signaling pathway (hsa04151) | hsa-miR-30a-5p; hsa-miR-7-5p; hsa-let-7i-5p; hsa-miR-10b-5p; hsa-let-7g-5p; hsa-let-7f-5p; hsa-miR-125b-5p;hsa-miR-185-5p; hsa-miR-206; hsa-miR-378a-3p; hsa-miR-26a-5p; hsa-miR-499a-5p; hsa-miR-146a-5p; hsa-miR-126-3p;hsa-miR-451a;hsa-miR-378b | 167 | TLR2; PRLR; MET; ITGB1; ATF2; CDK2; GNG5; GNG11; GNG12; CDK2; STK11; CK6; IGF1R; EGFR; TP53; PIK3CD; PIK3R3; FGF9; ITGA5; FGF1 | 0.016 |
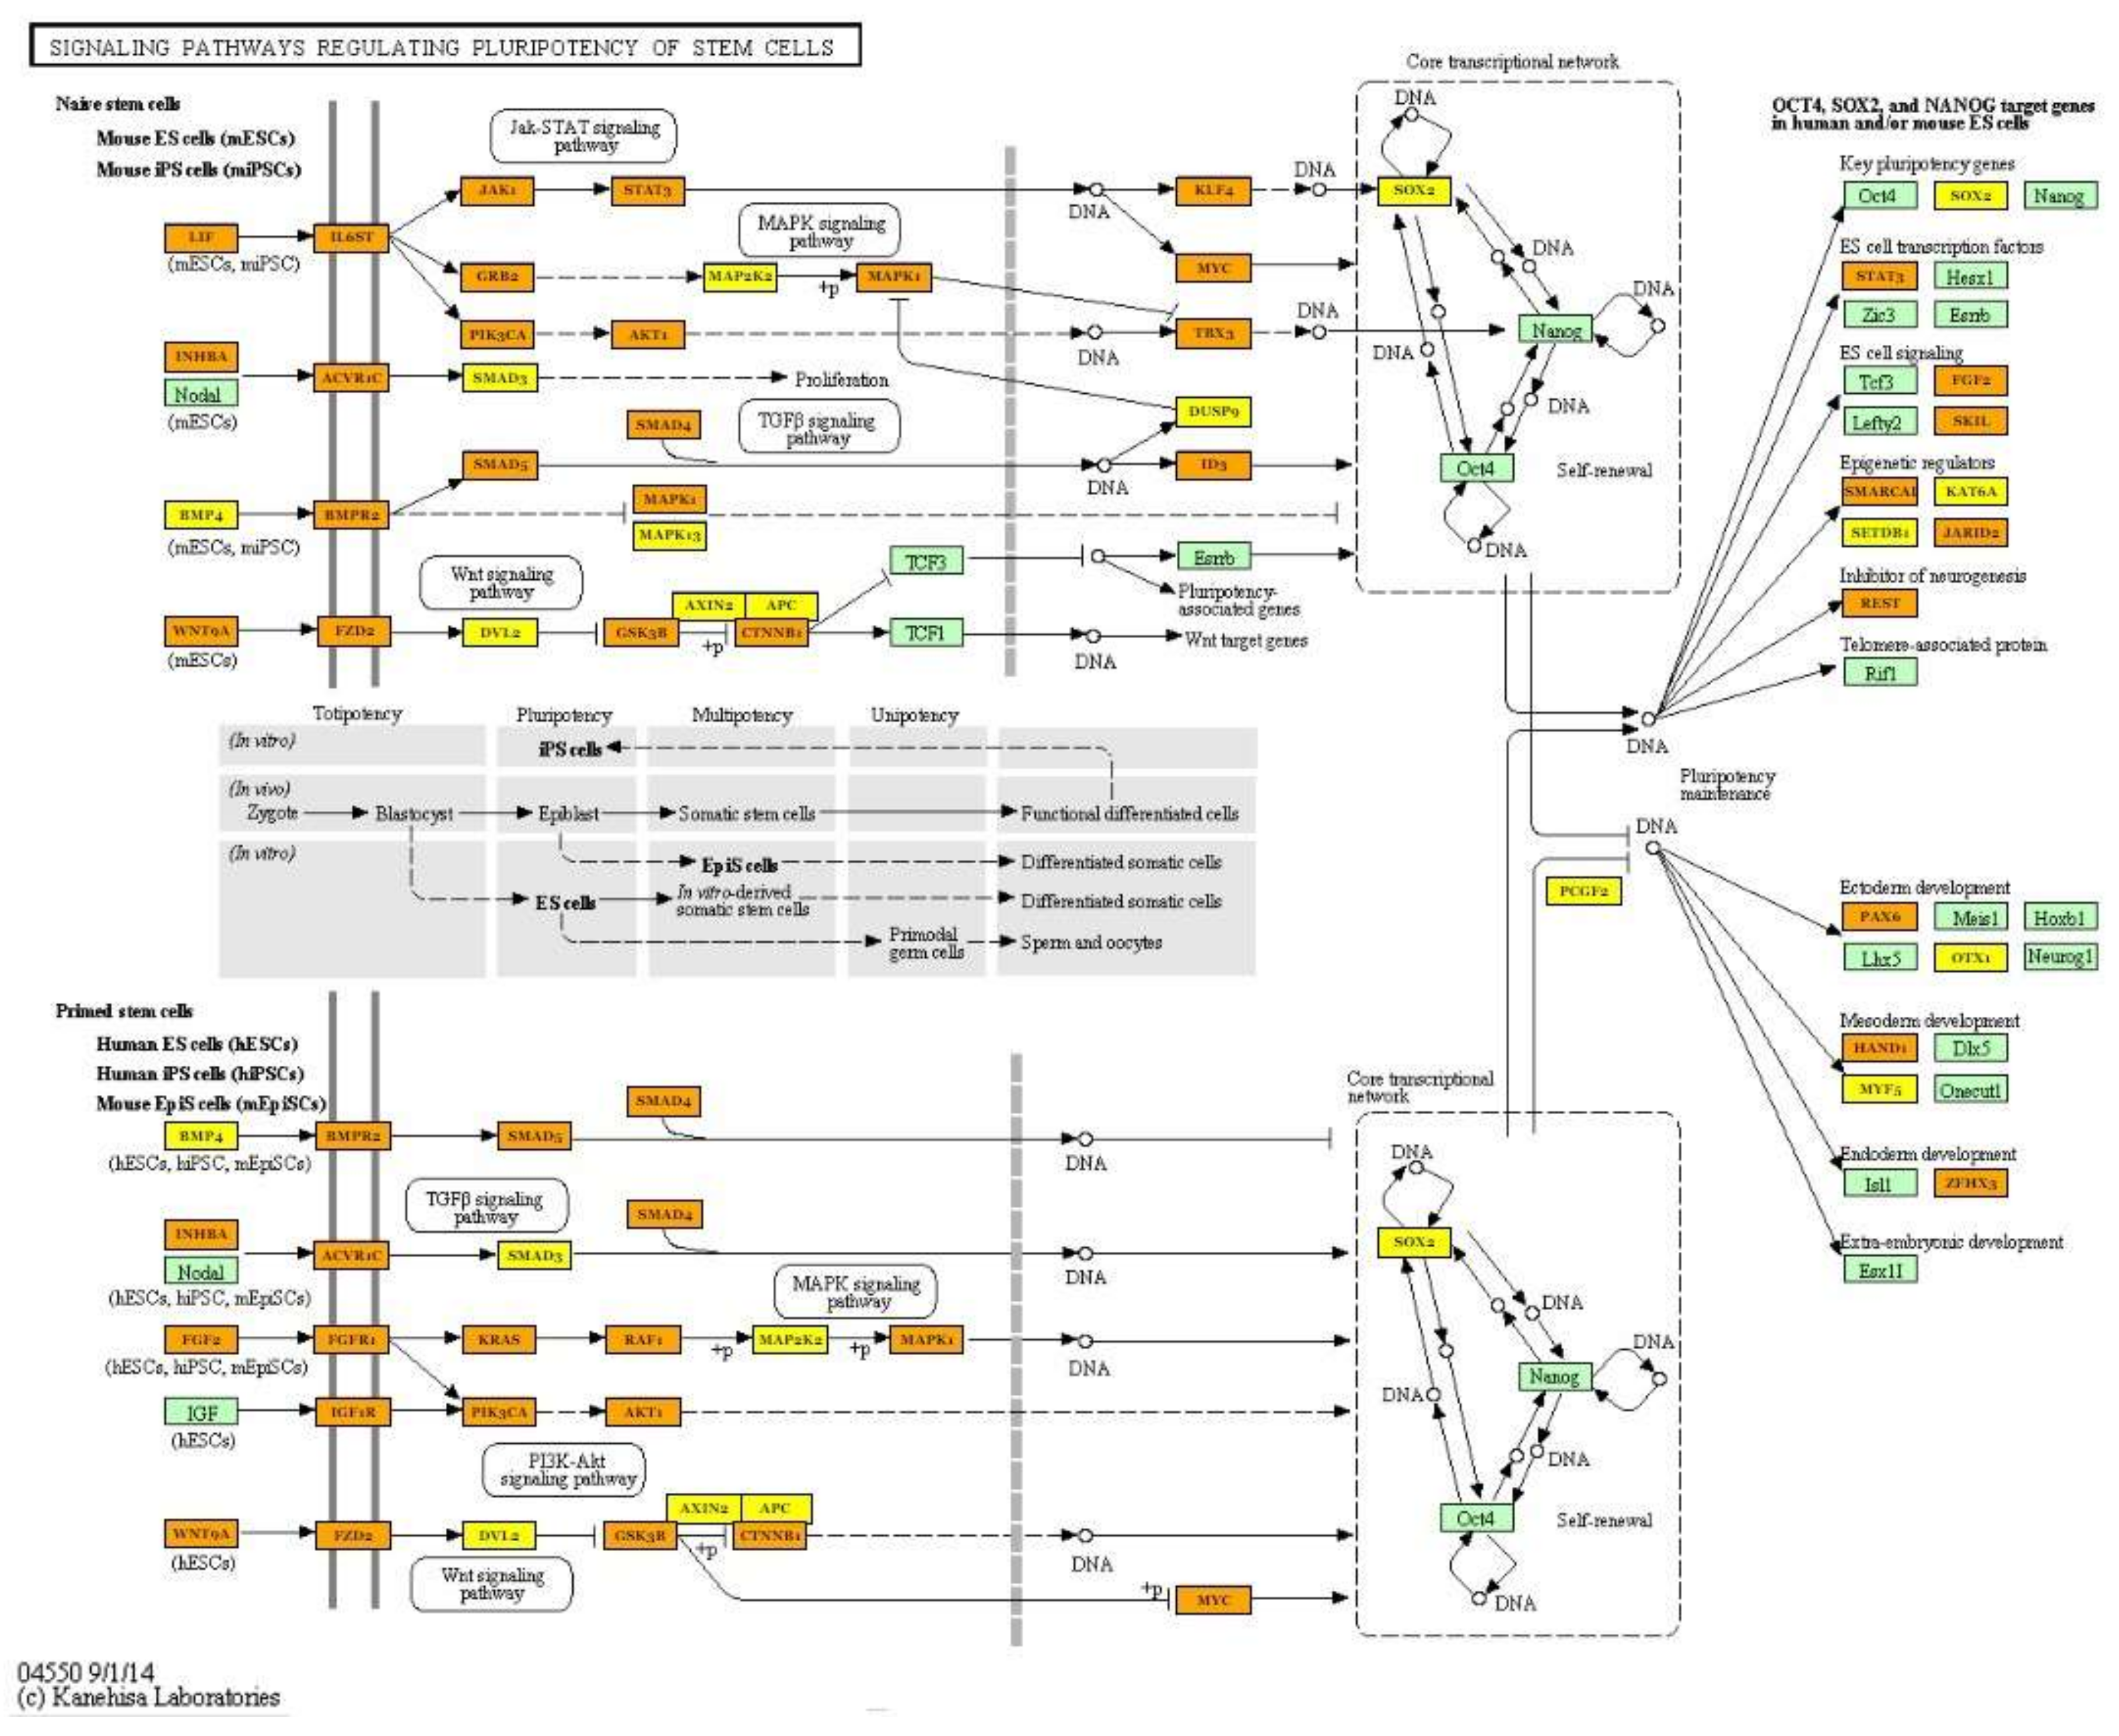
| Signaling pathways regulating pluripotency of stem cells (hsa04550) | hsa-miR-125b-5p; hsa-miR-30a-5p; hsa-miR-378a-3p; hsa-miR-10b-5p; hsa-let-7i-5p; hsa-let-7g-5p; hsa-let-7f-5p; hsa-miR-7-5p; hsa-miR-26a-5p; hsa-miR-146a-5p; hsa-miR-185-5p; hsa-miR-126-3p; hsa-miR-499a-5p; hsa-miR-451a | 86 | SOX2; KLF4; PAX6; PIK3R2; FZD3; MAPK13; KRAS; SMAD6; NRAS; IGF1R; TBX3; LIF; MYC; BPO2; FGF2; LIFR; CTNNB1; PIK3CA; SMP4; BMPR2; JAKI | 1.27 × 10⁻⁶ |
| Hampshire | Pietrain | ||
|---|---|---|---|
| miRNA | DEGs | miRNA | DEGs |
| hsa-miR-155-5p | RNF19A; FEM1B; ATL2; CYP51A1; XPO1 | hsa-miR-199b-5p | CYP51A1 |
| hsa-miR-30c-5p | SETD2; ATL2; PIGX; RBB6P; CYP51A1; XPO1 | hsa-miR-126-5p | RNF19A1 |
| hsa-miR-133a-3p | XPO1; RNF19A; PNPLA2 | ||
| Gene | Accession Number | Hampshire | Pietrain | R | ||
|---|---|---|---|---|---|---|
| FC RNA-seq | FC RQ | FC RNA-seq | FC RQ | |||
| MGP | ENSSSCG00000000606 | 2.45 | 2.07 | 1.63 | 1.80 | 0.928 *** |
| BBS2 | ENSSSCG00000025417 | −2.25 | −1.76 | −1.53 | −1.03 | 0.646 *** |
| PCOLCE | ENSSSCG00000027466 | 3.35 | 2.79 | 1.57 | 1.10 | 0.886 *** |
| COL6A1 | ENSSSCG00000022506 | 2.20 | 1.40 | 1.97 | 1.70 | 0.643 ** |
| TBX2 | ENSSSCG00000027060 | 2.05 | 1.91 | 2.21 | 1.09 | 0.360 ns |
| XPO1 | ENSSSCG00000028228 | −1.71 | −0.62 | −1.50 | −1.80 | 0.280 ns |
| miRNA | R |
|---|---|
| let-7g-5p | 0.738 ** |
| miR-126-3p | 0.794 ** |
| miR-181b-5p | 0.658 * |
| miR-30a-5p | 0.888 *** |
| miR-378a-3p | 0.635 * |
| miR-451a | 0.756 ** |
| miR-499a-5p | 0.878 *** |
| miR-7-5p | 0.402 ns |
| miR-125b-5p | 0.232 ns |
| Hampshire | Pietrain | |||||||||||
|---|---|---|---|---|---|---|---|---|---|---|---|---|
| Low (n = 3) | High (n = 3) | Low (n = 3) | High (n = 3) | |||||||||
| Weight of loin (kg) | 54.0 | ±2.80 | b | 63.4 | ±2.05 | a | 57.9 | ±1.27 | B | 64.3 | ±0.41 | A |
| Lean meat percentage | 63.3 | ±1.73 | 66.1 | ±0.35 | 68.1 | ±2.45 | 69.8 | ±2.5 | ||||
| Weight of ham (kg) | 8.69 | ±0.31 | b | 10.37 | ±0.25 | a | 9.51 | ±0.54 | 9.83 | ±0.49 | ||
© 2018 by the authors. Licensee MDPI, Basel, Switzerland. This article is an open access article distributed under the terms and conditions of the Creative Commons Attribution (CC BY) license (http://creativecommons.org/licenses/by/4.0/).
Share and Cite
Ropka-Molik, K.; Pawlina-Tyszko, K.; Żukowski, K.; Piórkowska, K.; Żak, G.; Gurgul, A.; Derebecka, N.; Wesoły, J. Examining the Genetic Background of Porcine Muscle Growth and Development Based on Transcriptome and miRNAome Data. Int. J. Mol. Sci. 2018, 19, 1208. https://doi.org/10.3390/ijms19041208
Ropka-Molik K, Pawlina-Tyszko K, Żukowski K, Piórkowska K, Żak G, Gurgul A, Derebecka N, Wesoły J. Examining the Genetic Background of Porcine Muscle Growth and Development Based on Transcriptome and miRNAome Data. International Journal of Molecular Sciences. 2018; 19(4):1208. https://doi.org/10.3390/ijms19041208
Chicago/Turabian StyleRopka-Molik, Katarzyna, Klaudia Pawlina-Tyszko, Kacper Żukowski, Katarzyna Piórkowska, Grzegorz Żak, Artur Gurgul, Natalia Derebecka, and Joanna Wesoły. 2018. "Examining the Genetic Background of Porcine Muscle Growth and Development Based on Transcriptome and miRNAome Data" International Journal of Molecular Sciences 19, no. 4: 1208. https://doi.org/10.3390/ijms19041208