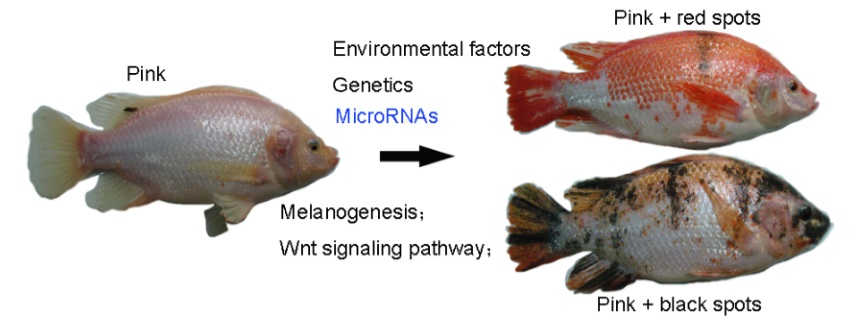
Comparative microRNA-seq Analysis Depicts Candidate miRNAs Involved in Skin Color Differentiation in Red Tilapia


Abstract
: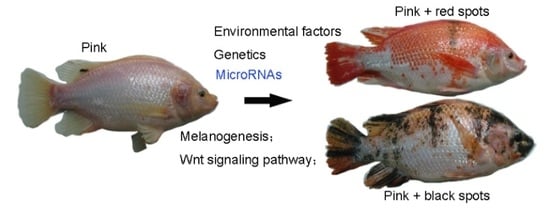
1. Introduction
2. Results and Discussion
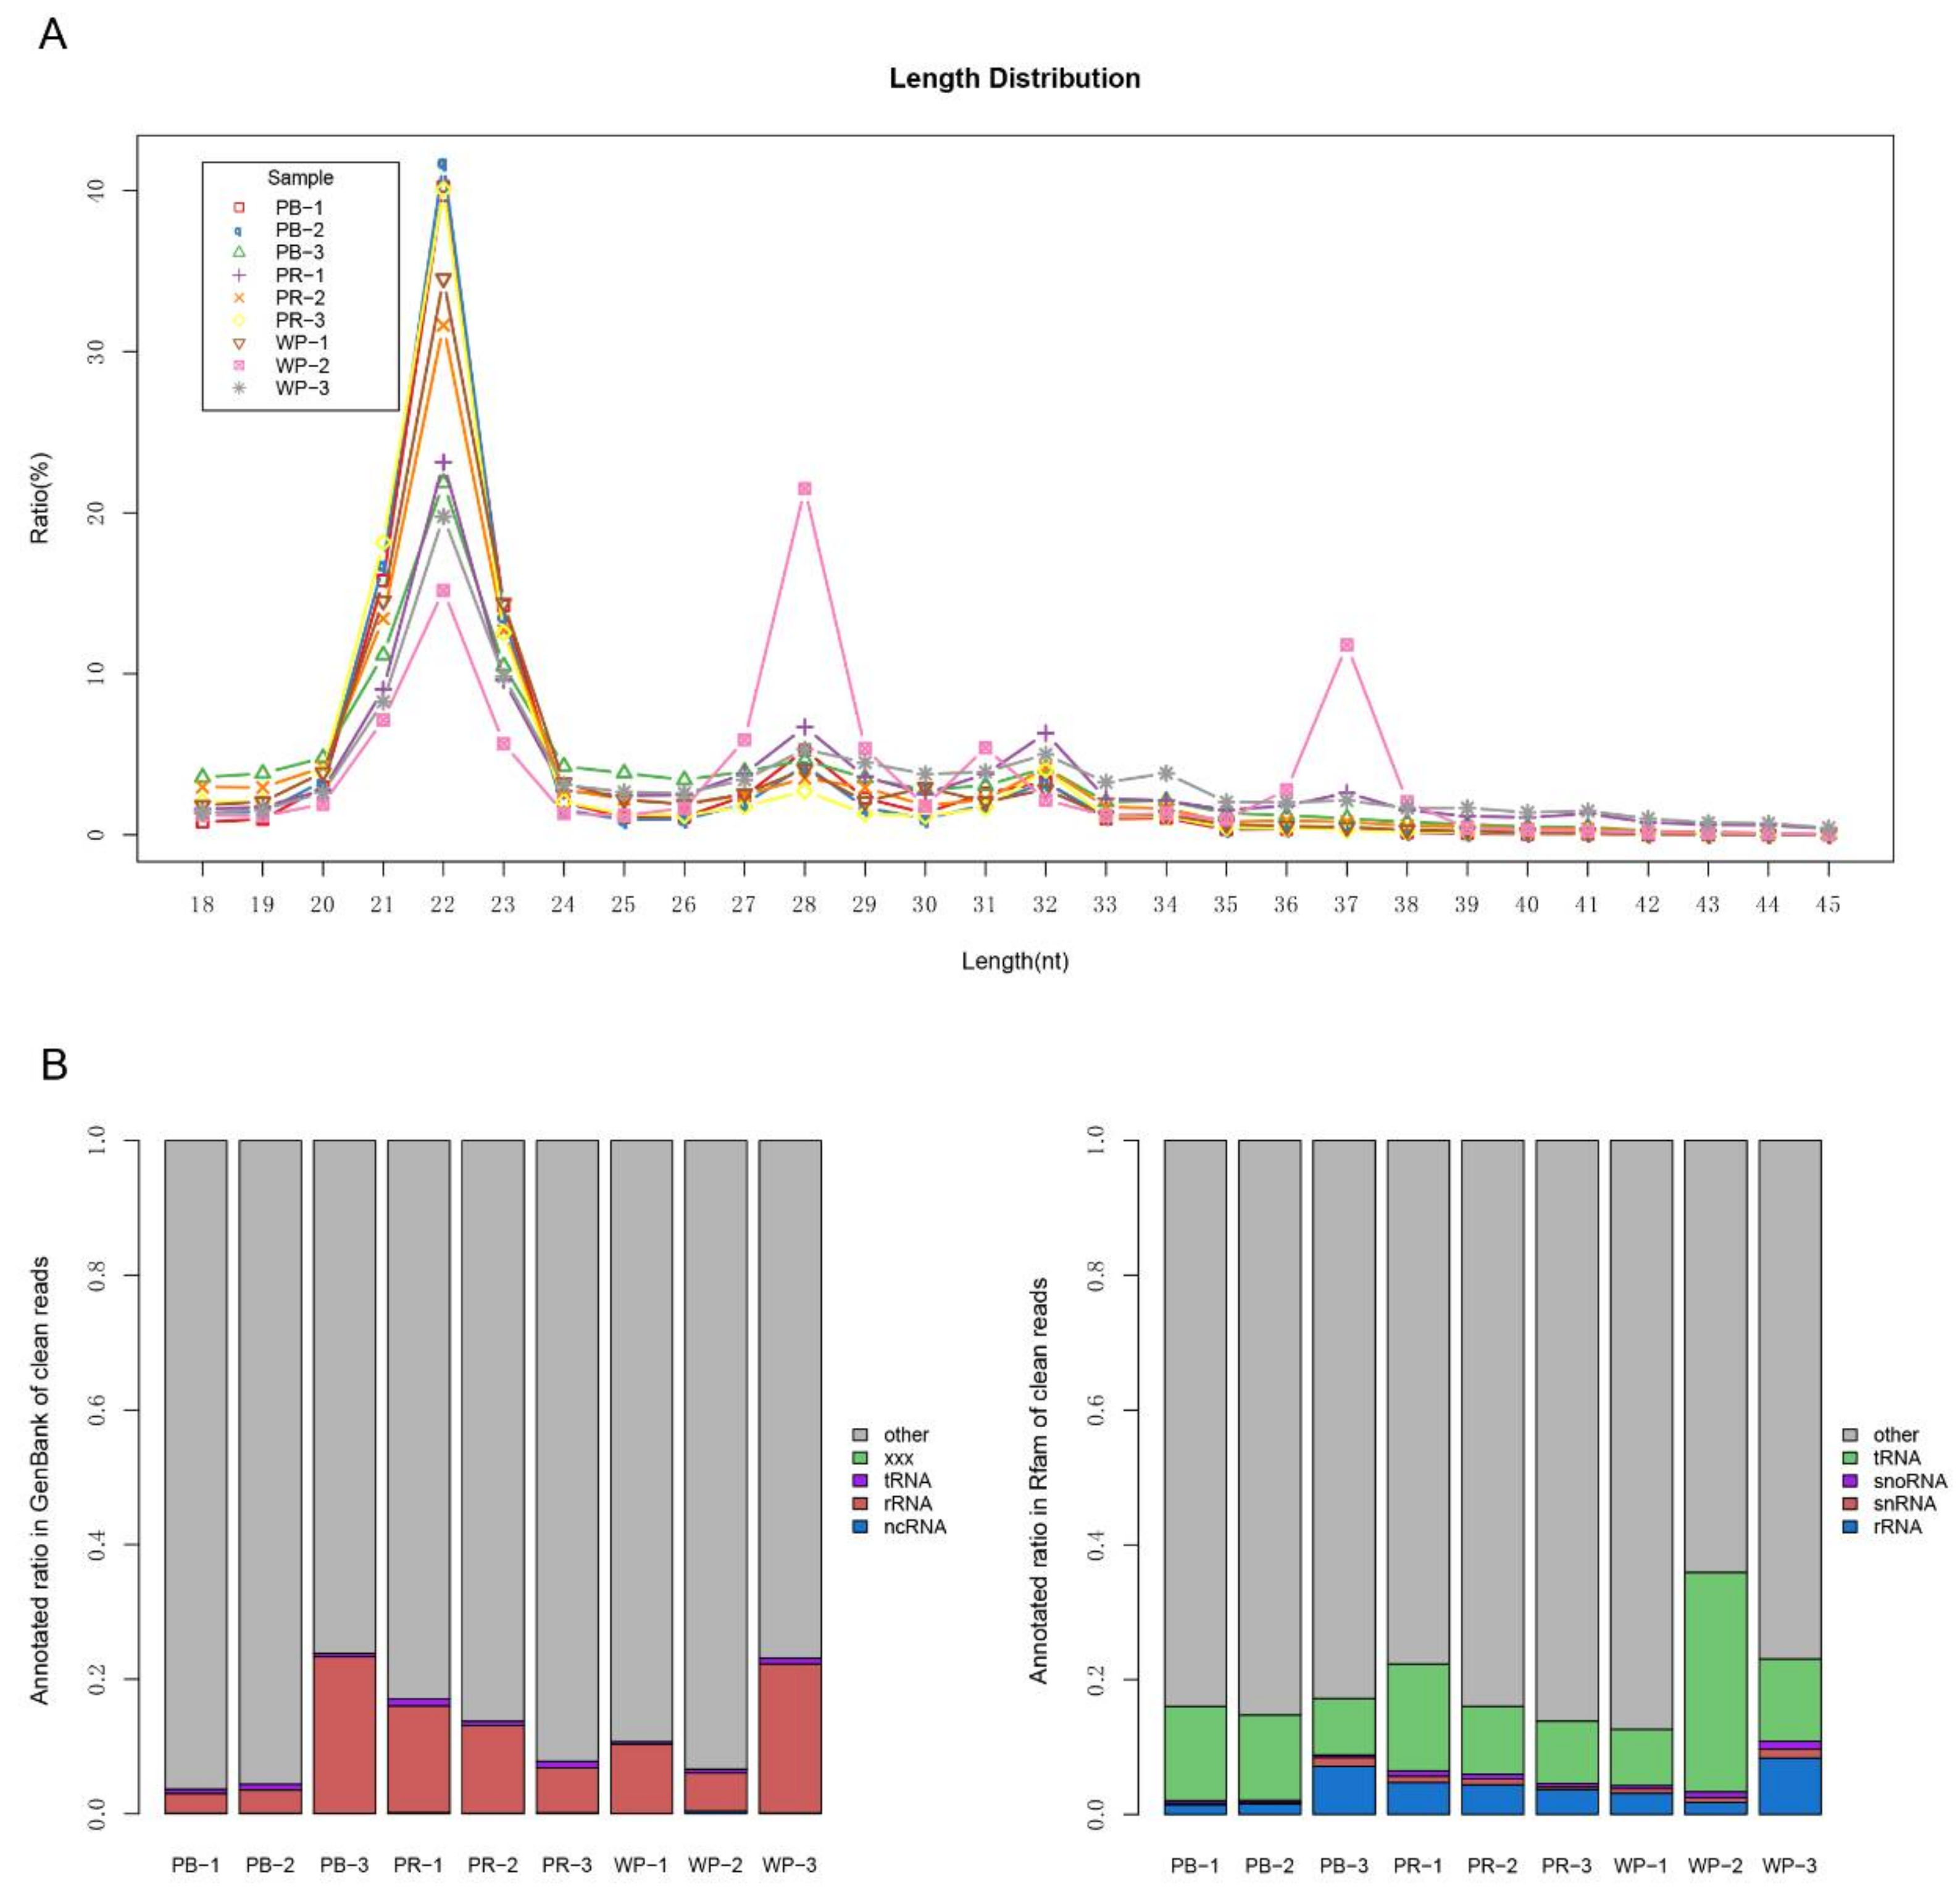
2.1. Signature of Sequencing Data in Red Tilapia.
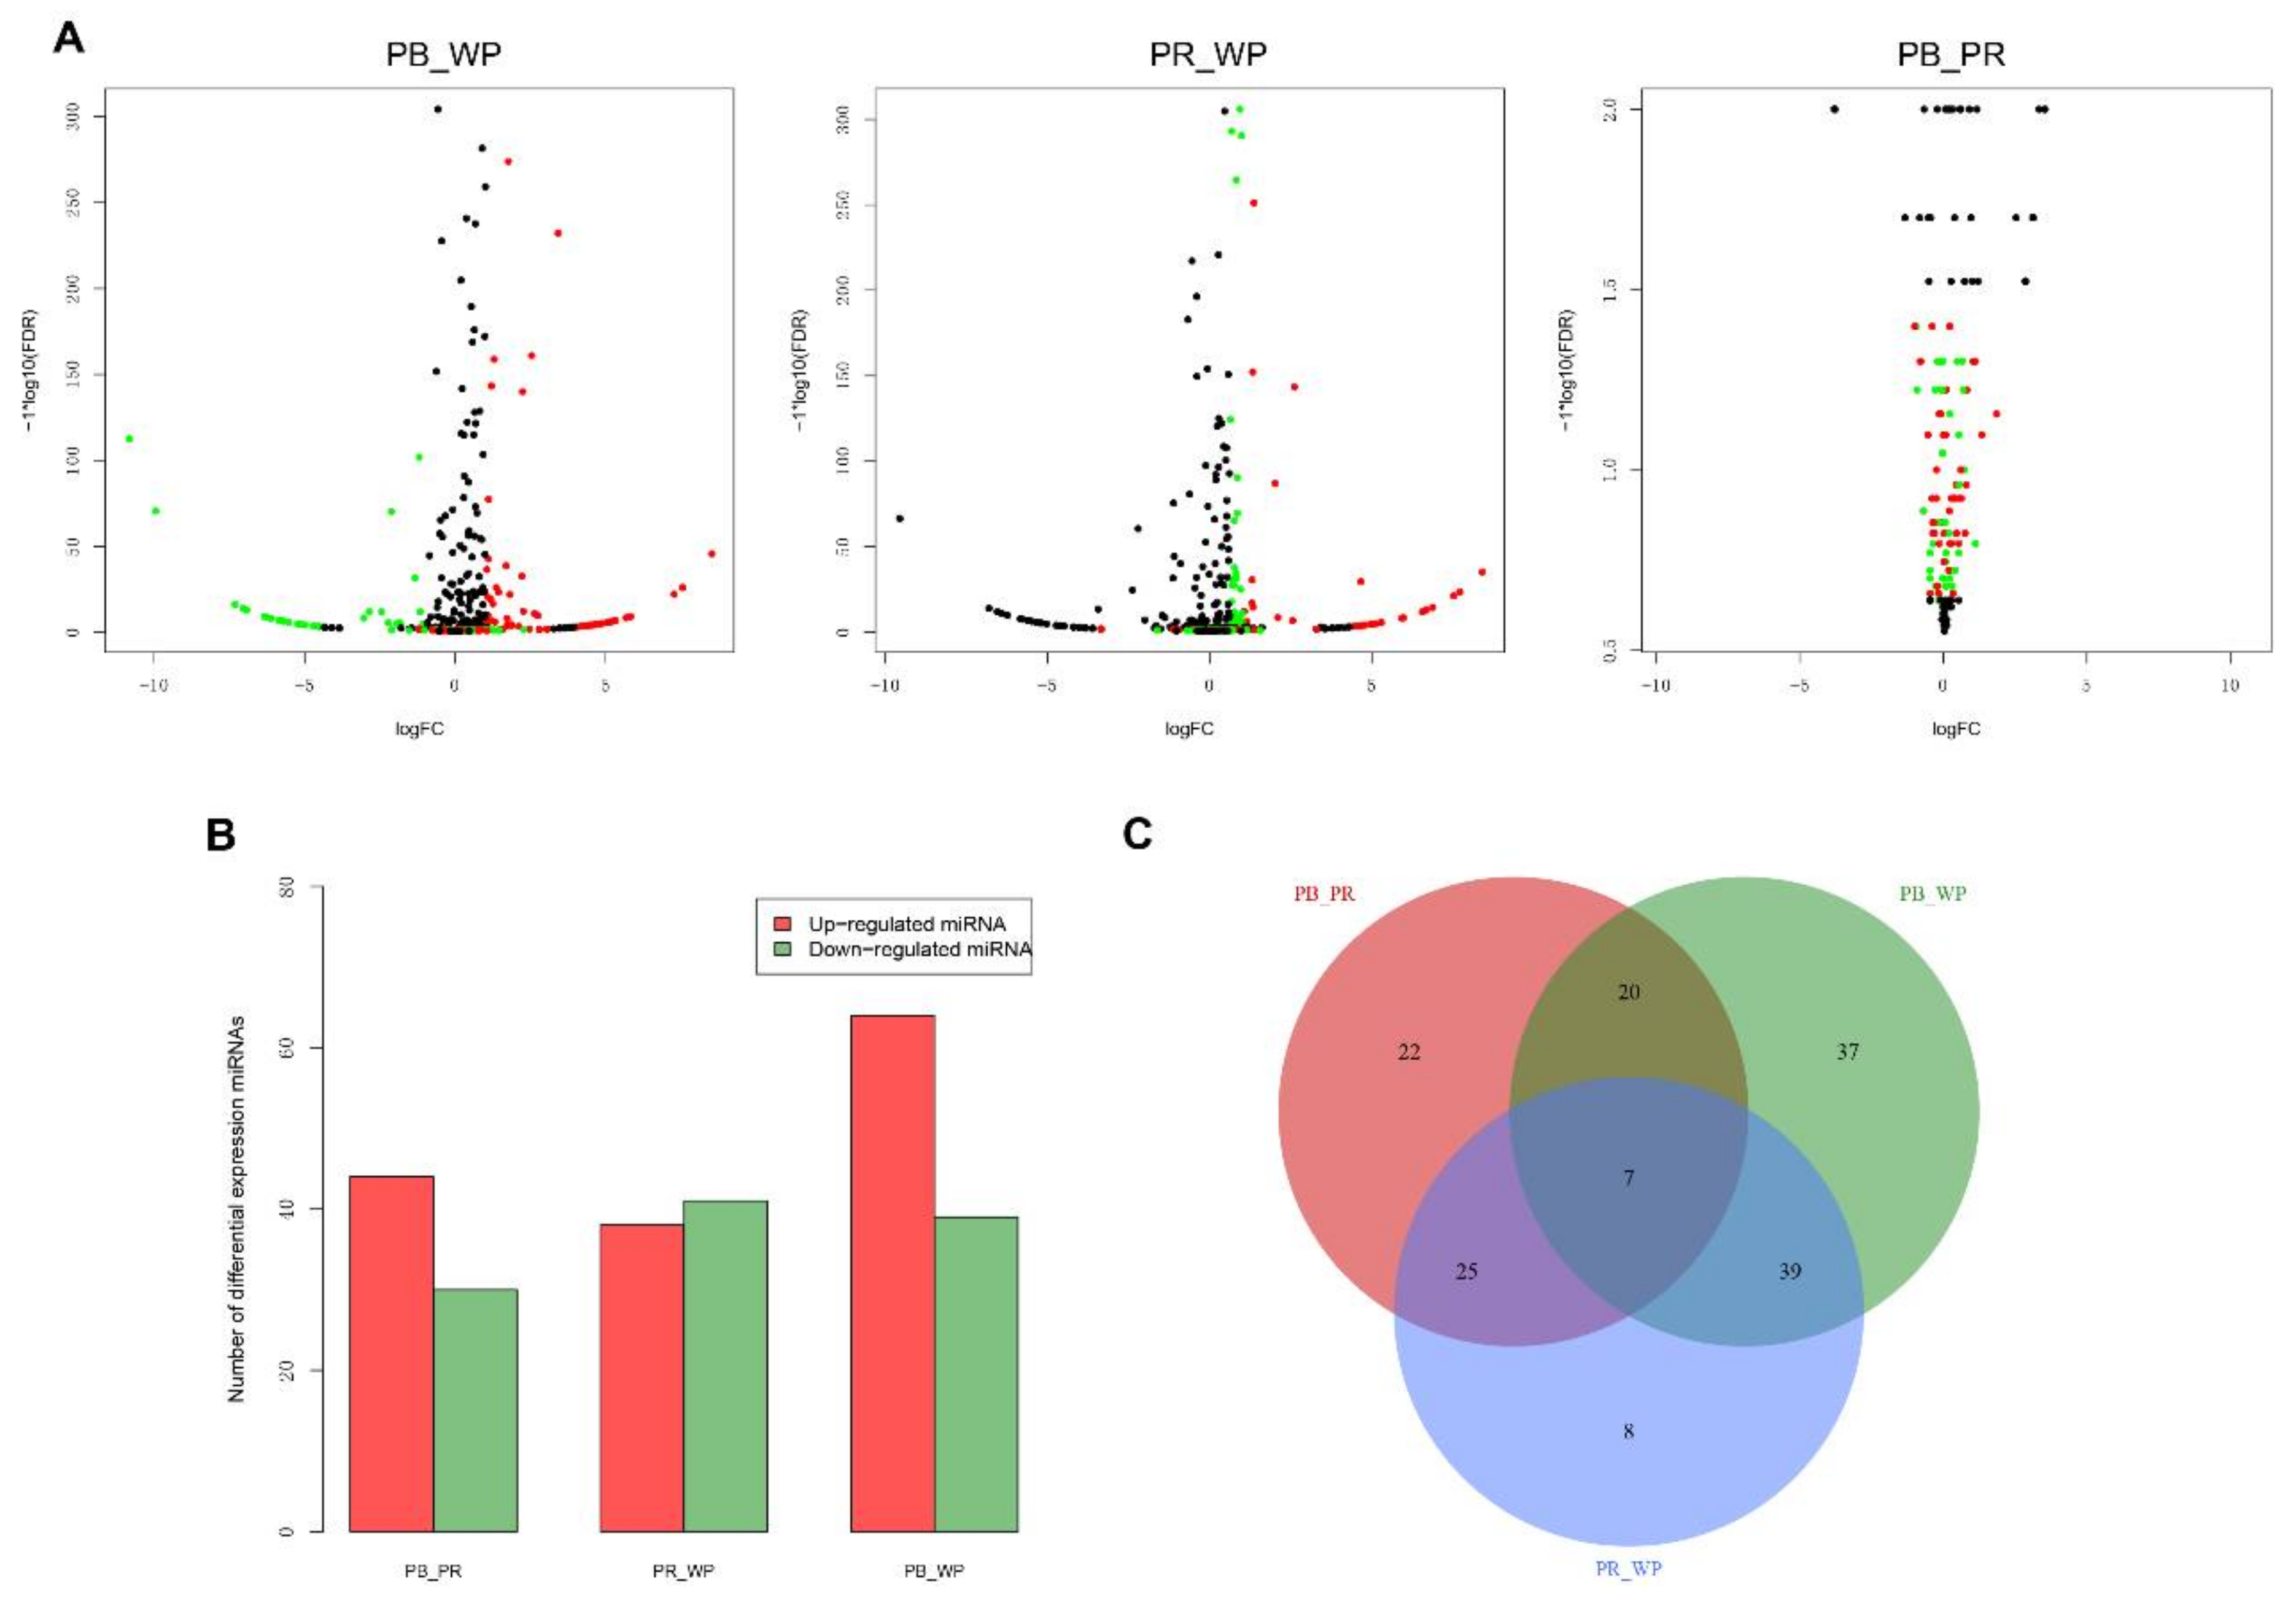
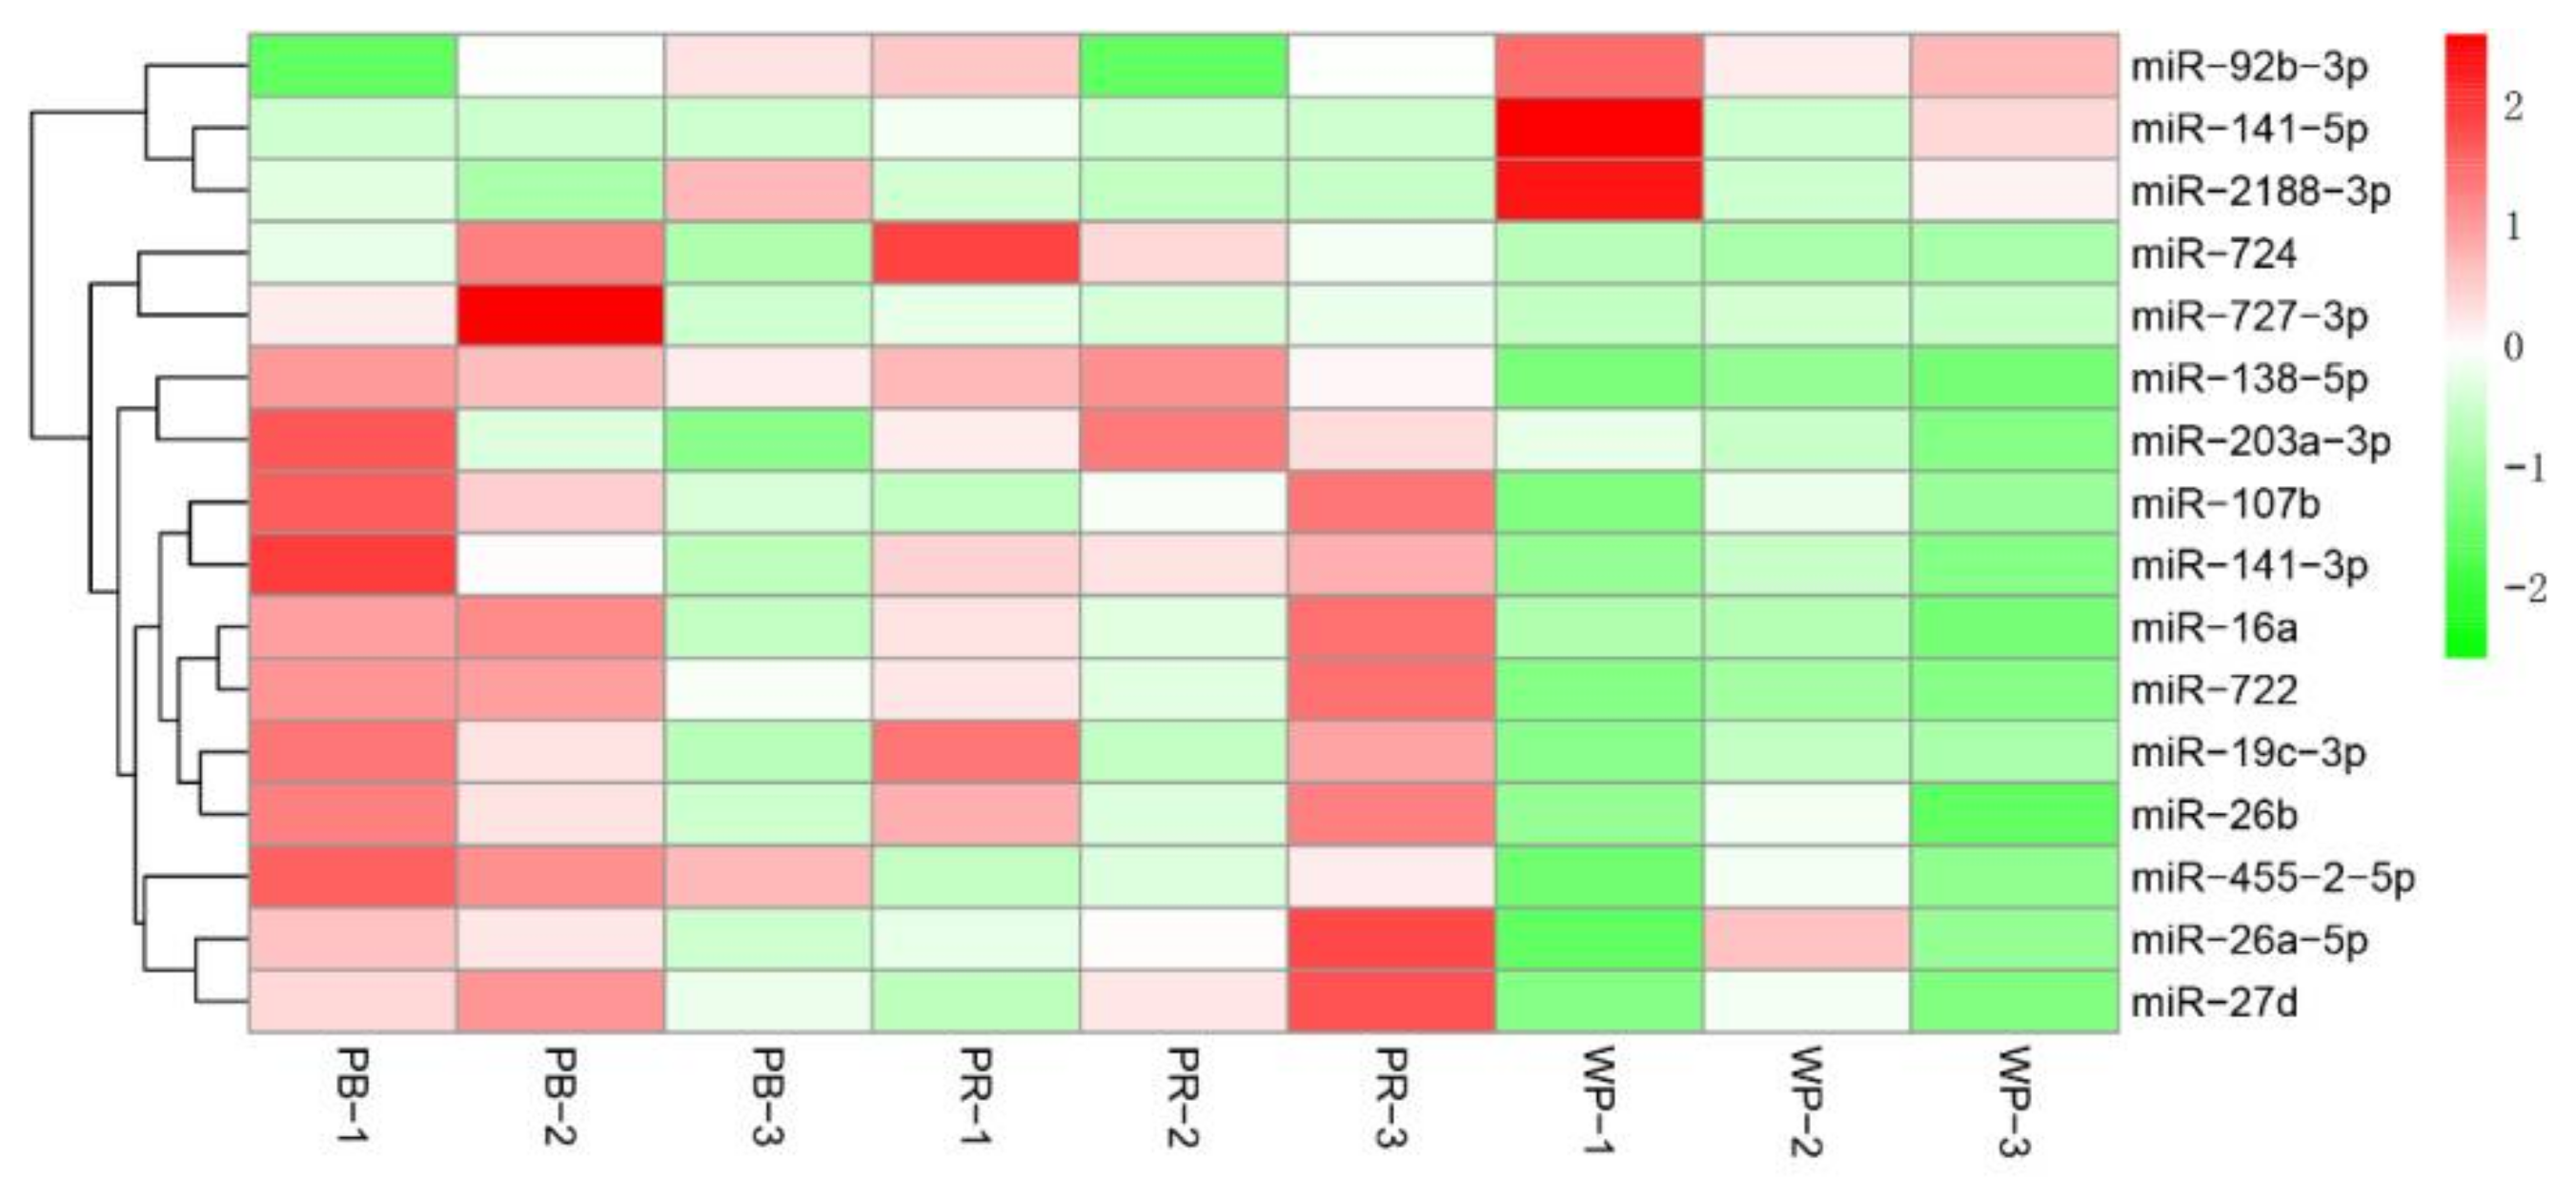
2.2. MicroRNAs (miRNAs) Show Differential Expression in Tilapia with Different Skin Colors
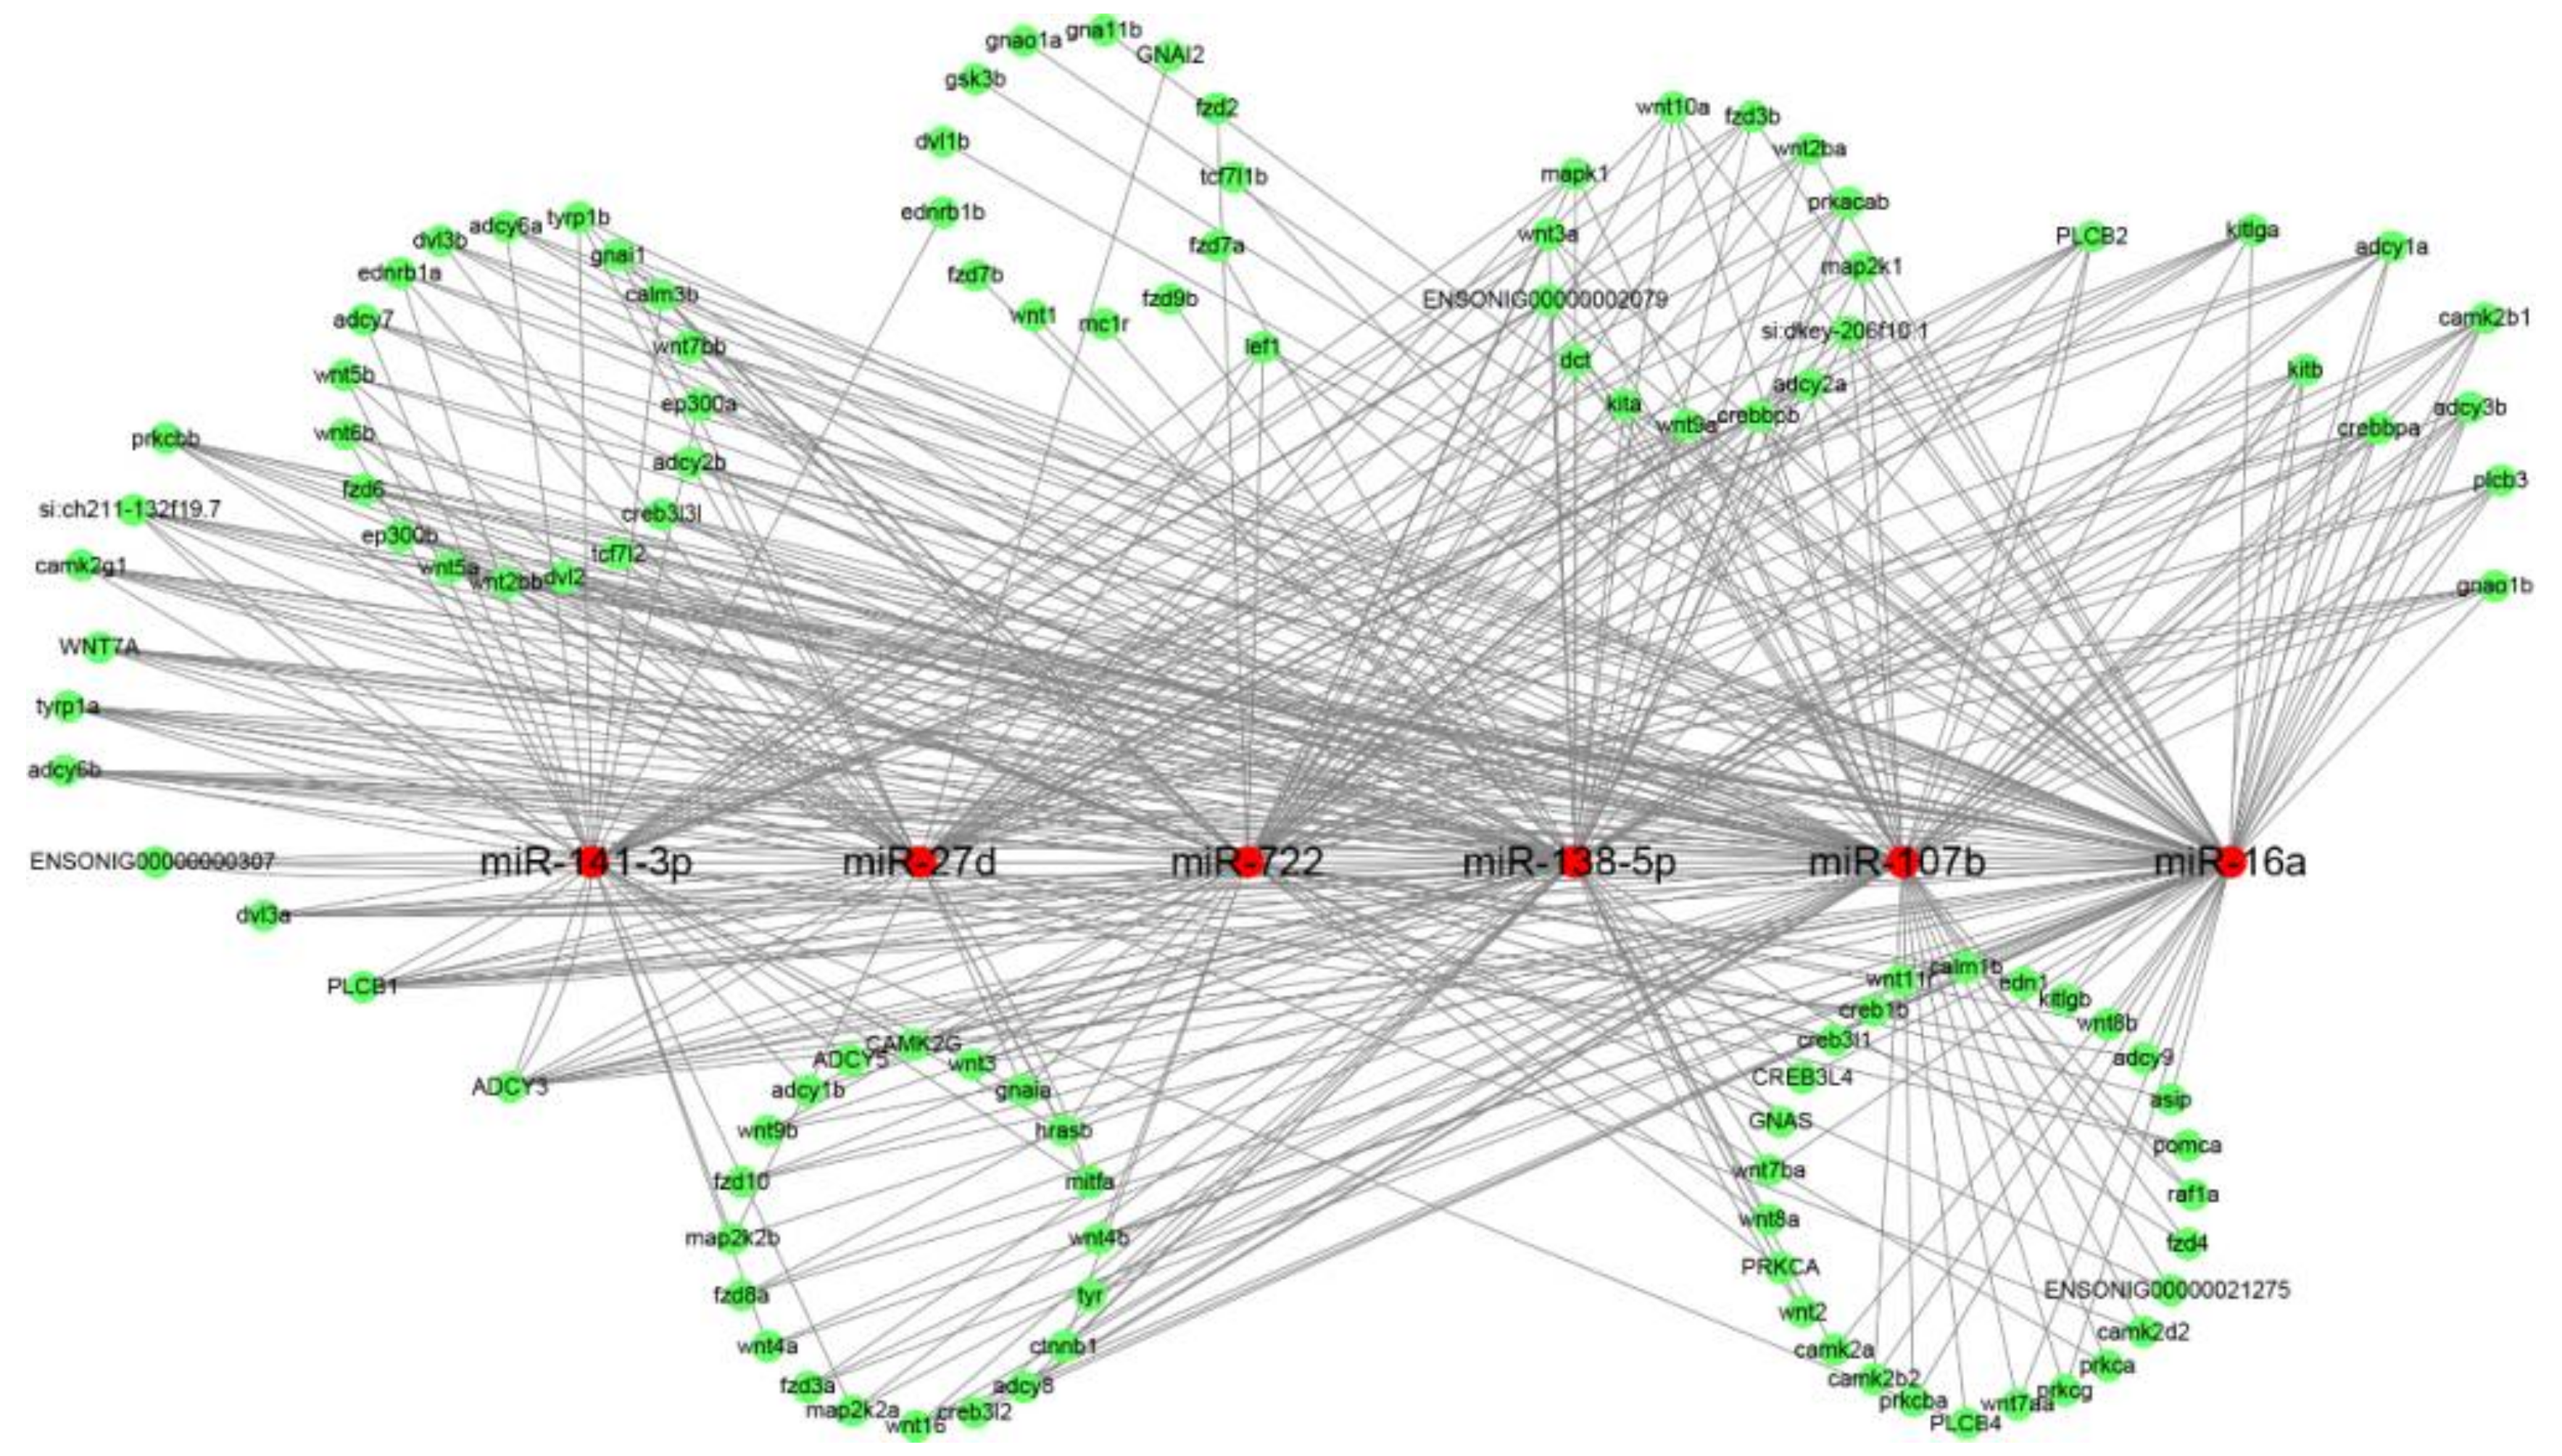
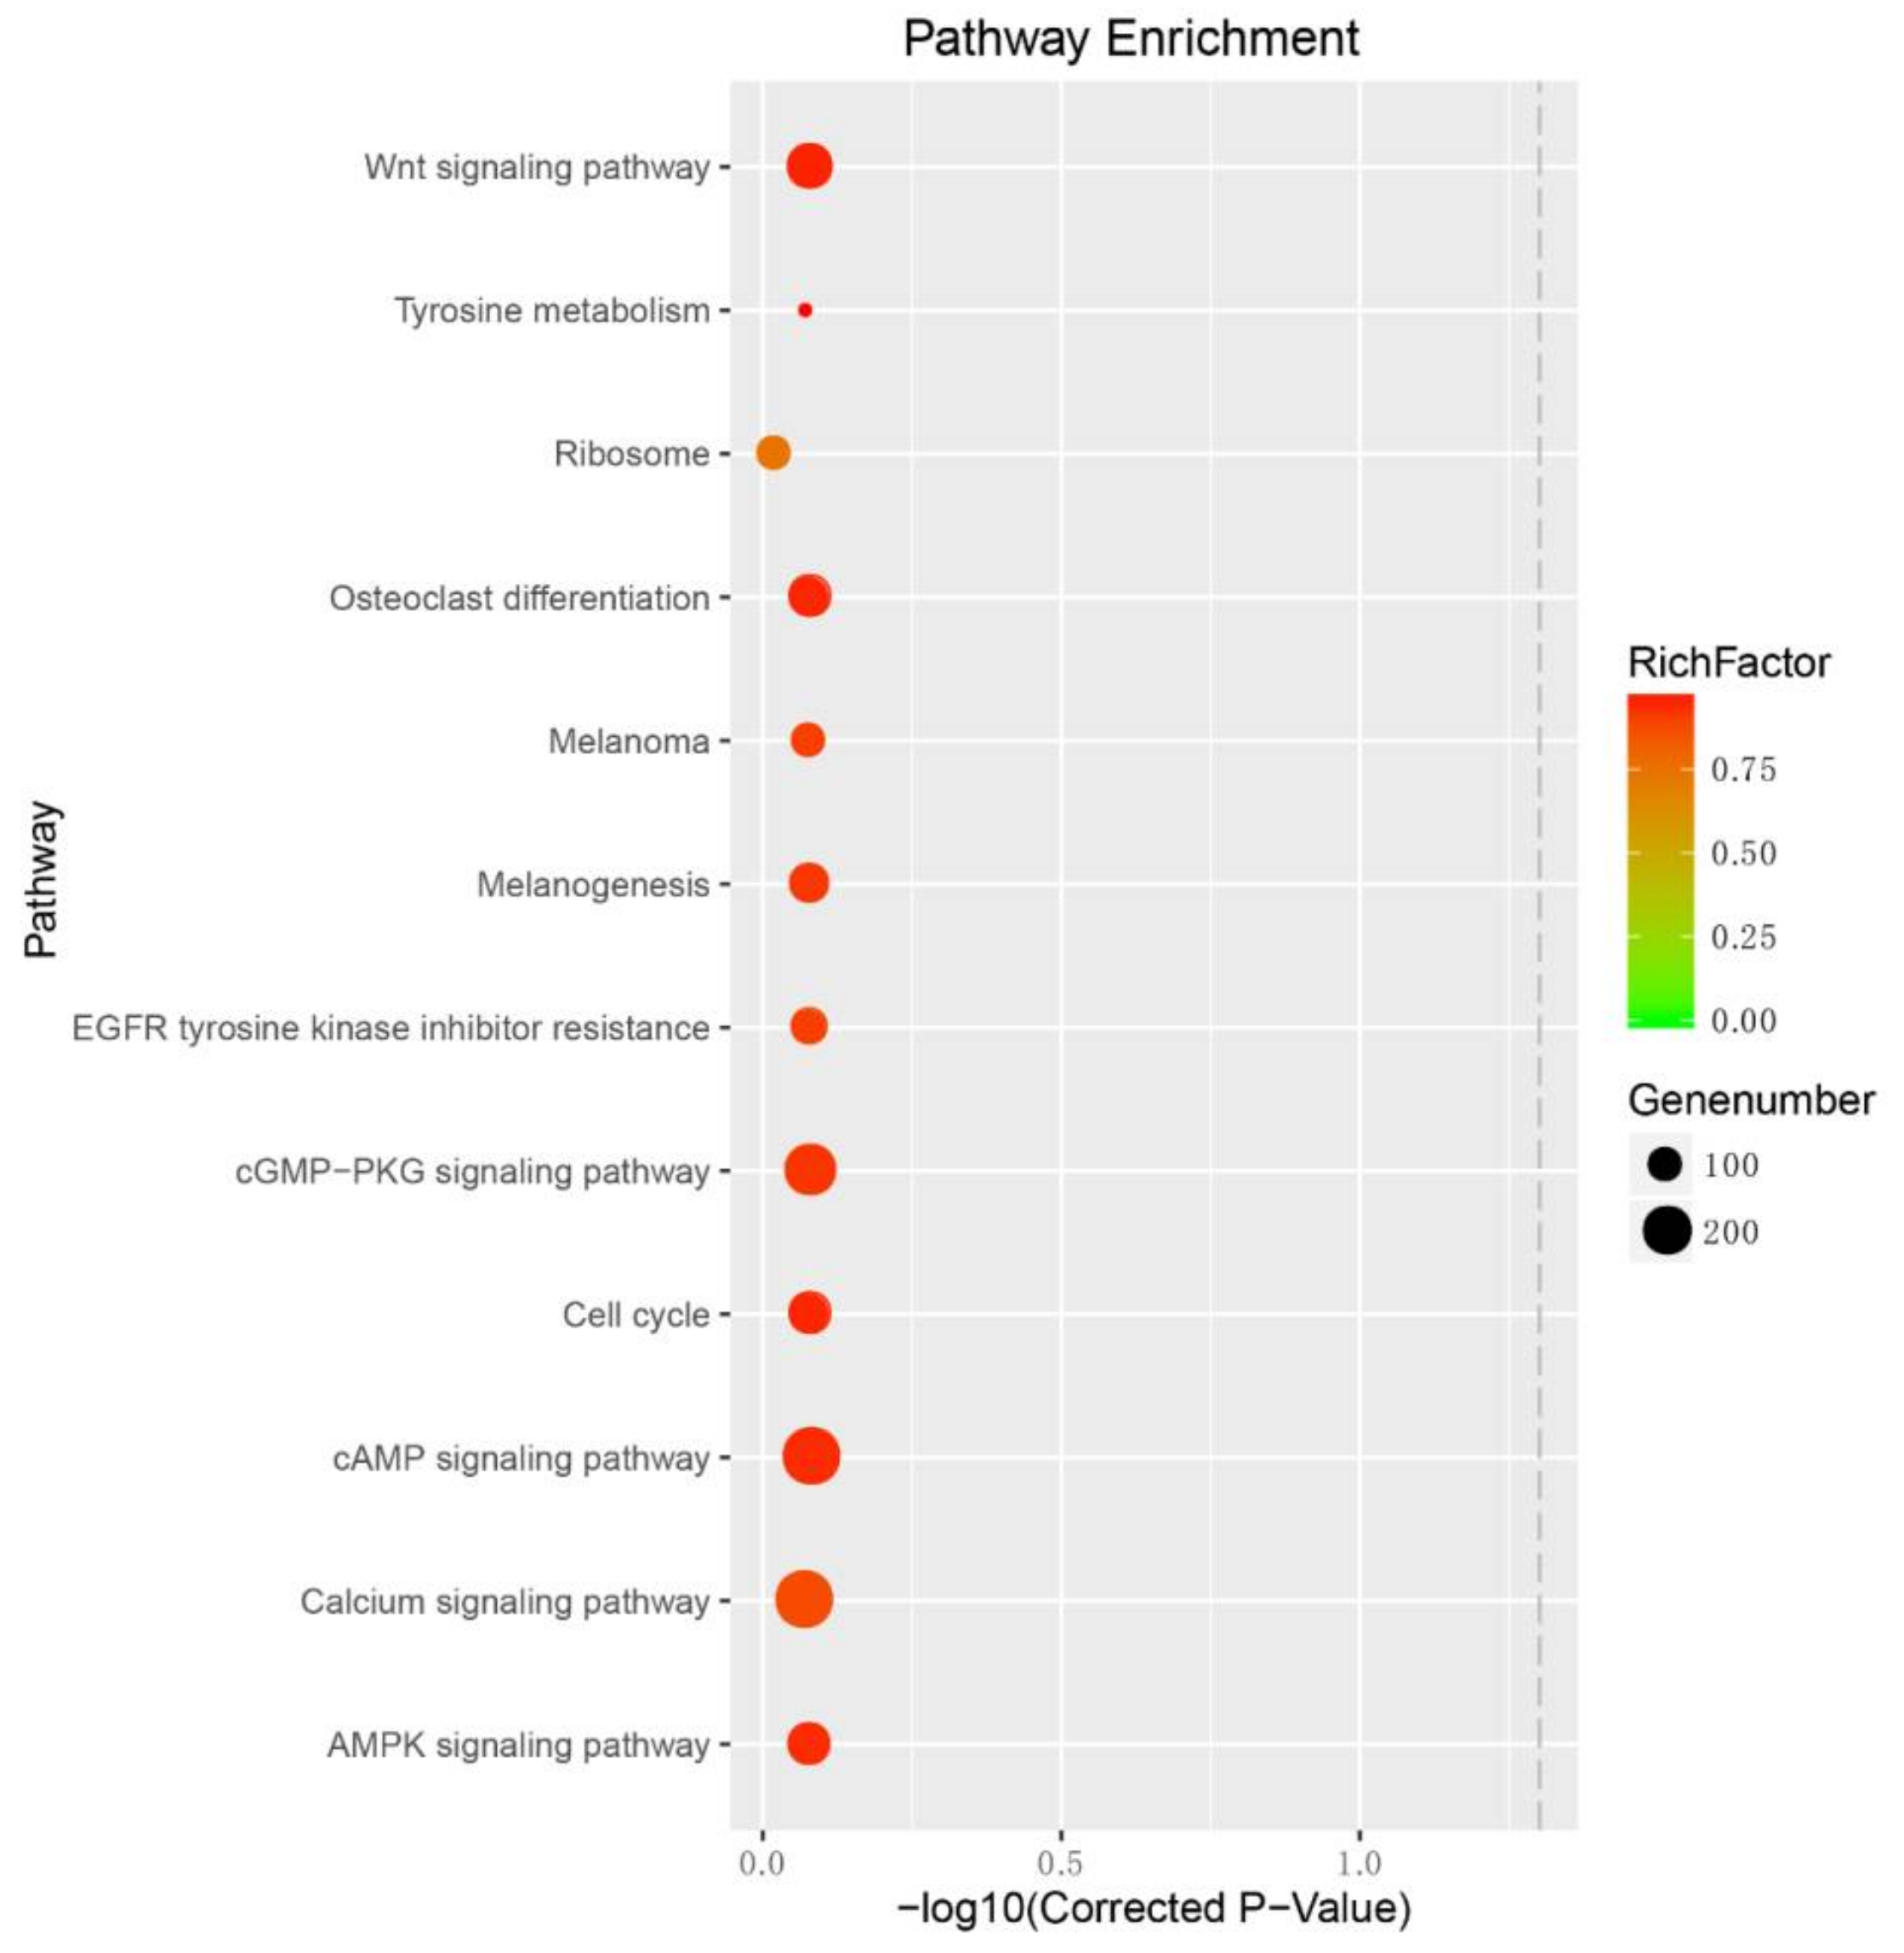
2.3. Target Prediction for Differentially Expressed miRNAs (DEMs)
3. Methods and Materials
3.1. Ethics Statement
3.2. Sample Collection
3.3. Small RNA Library Preparation and Sequencing
3.4. Sequencing Analysis for miRNA Profiling
3.5. Data Normalization, Processing and Identification of DEMs
3.6. Target Prediction for DEMs
3.7. Enrichment Analysis for DEM Targets
3.8. MiRNA-mRNA Regulatory Network Analysis
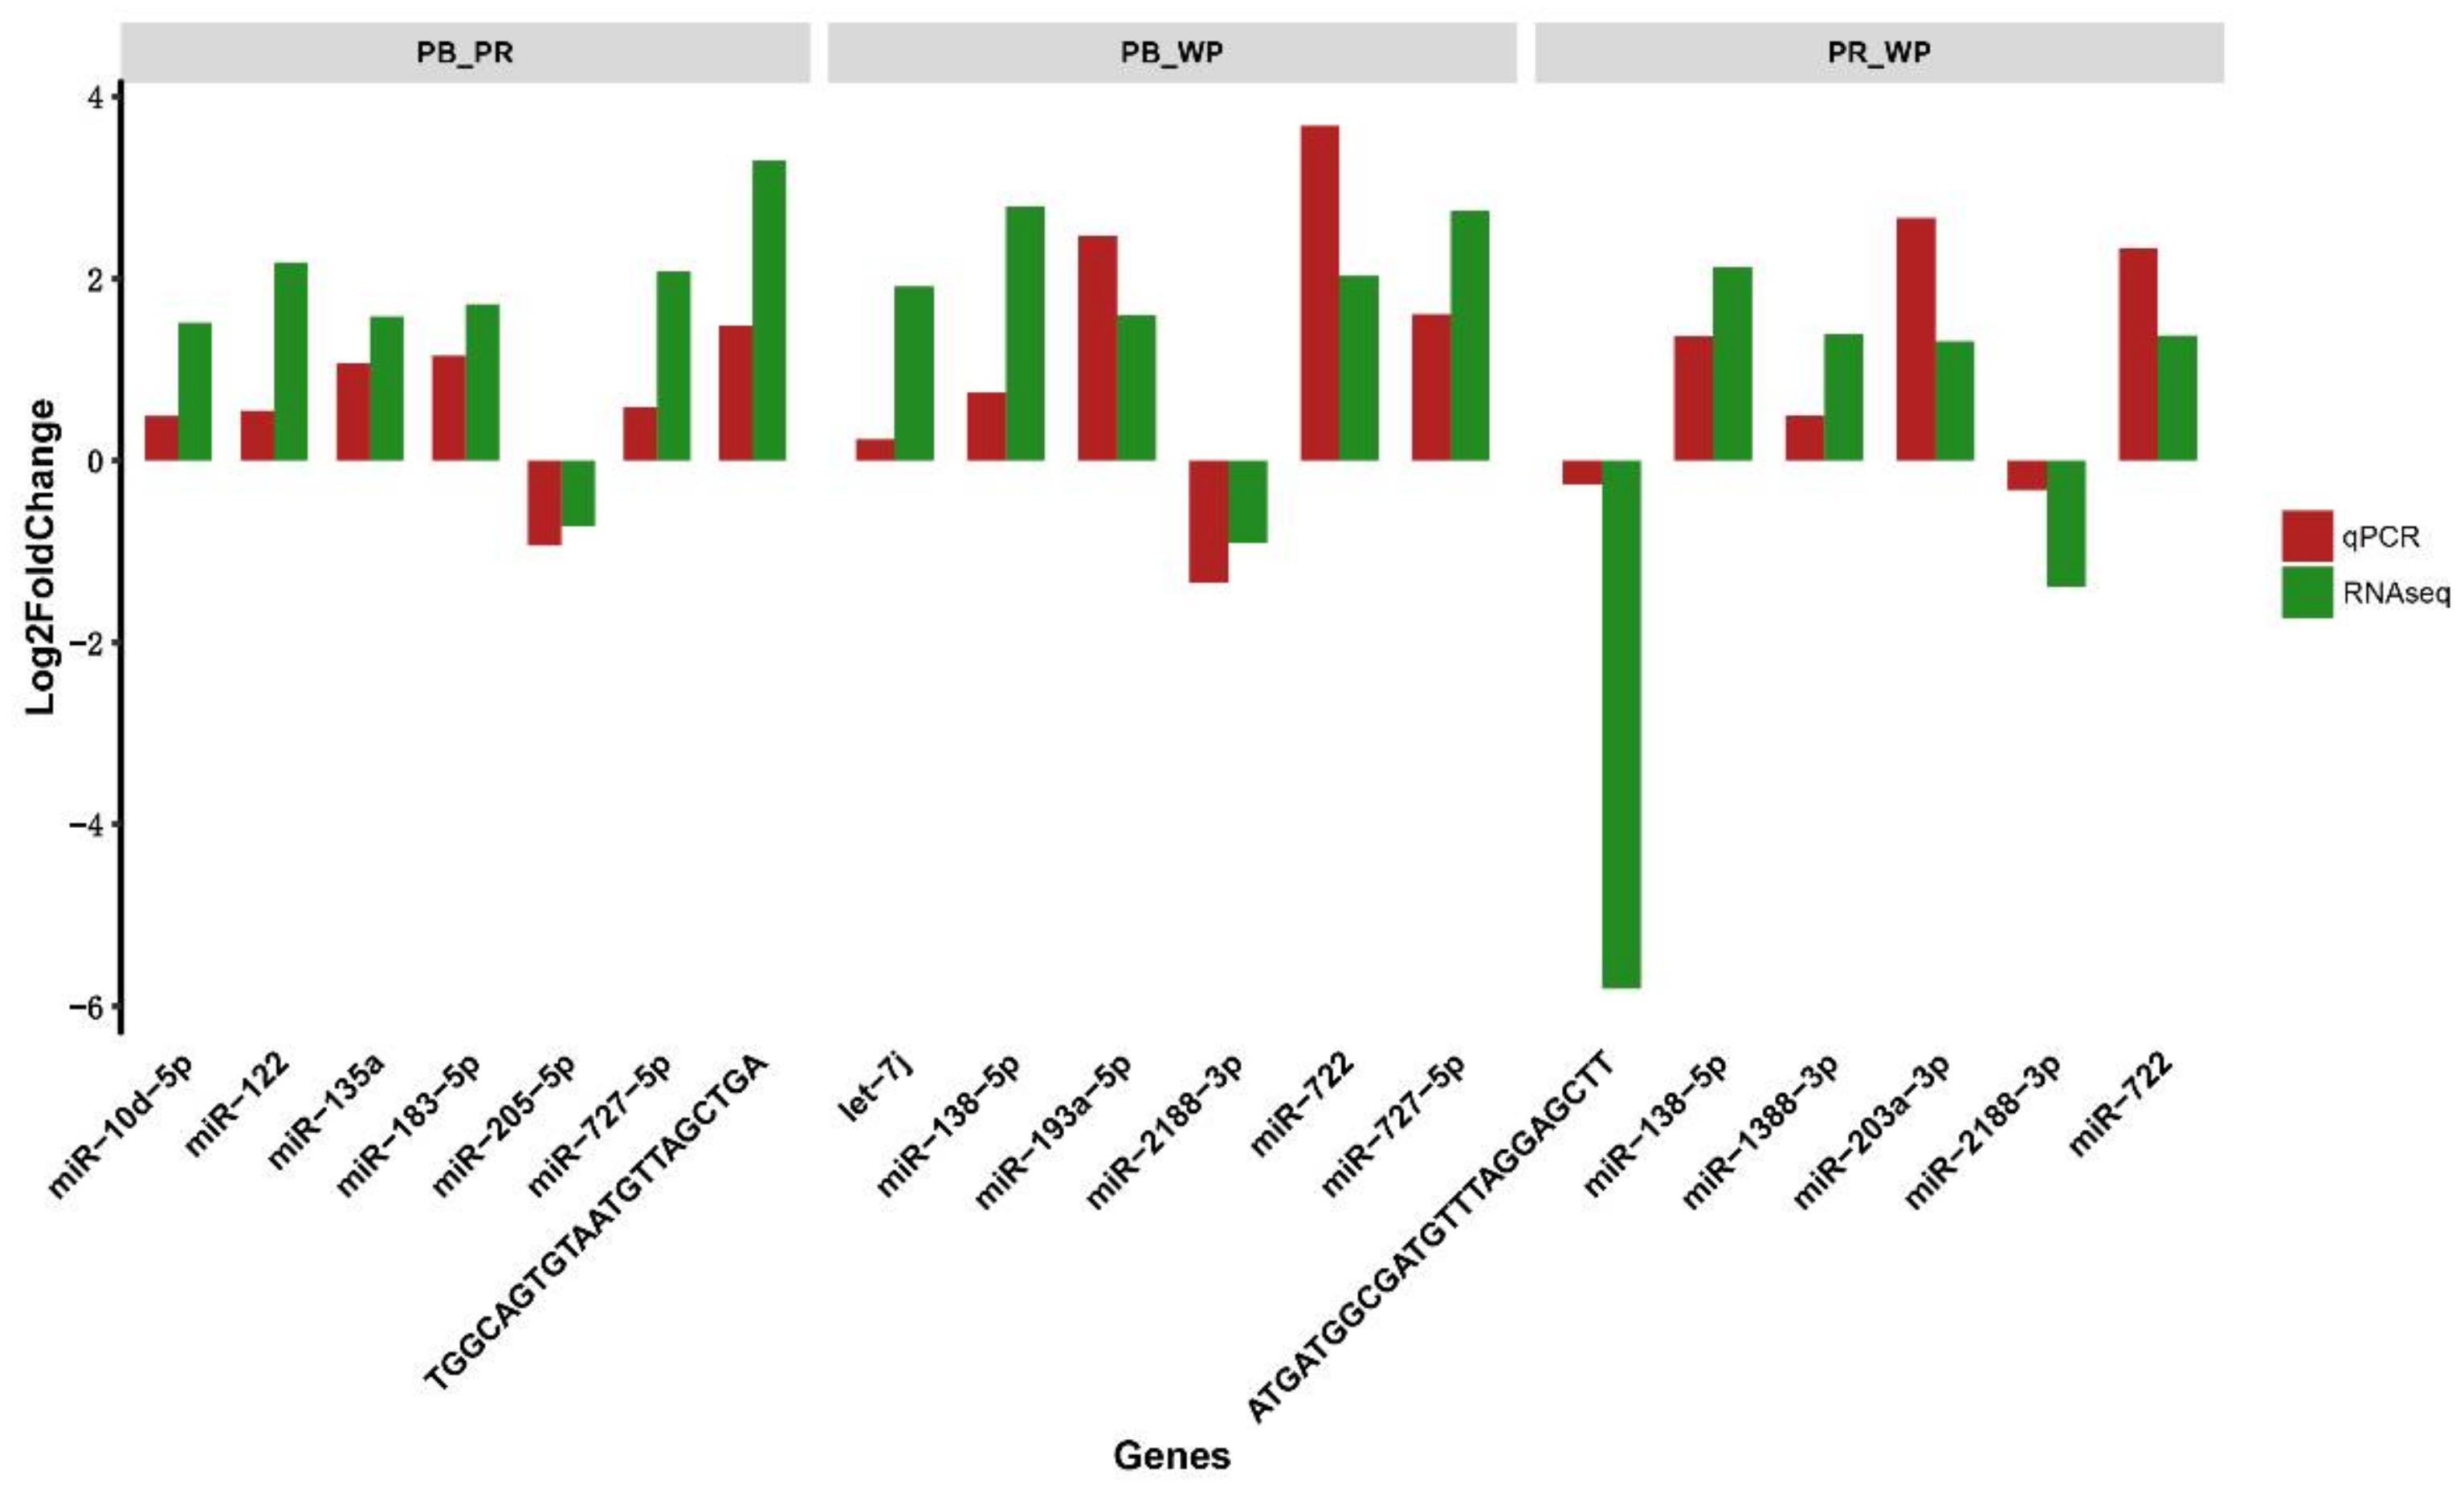
3.9. QRT-PCR Analysis
4. Conclusions
Supplementary Materials
Acknowledgments
Author Contributions
Conflicts of Interest
References
- Pradeep, P.J.; Hassan, A.; Chatterji, A.K.; Withyachumnarnkul, B.; Jeffs, A. Optimal conditions for cold-shock induction of triploidy in red tilapia. Aquac. Int. 2014, 22, 1163–1174. [Google Scholar] [CrossRef]
- FAOSTAT, Food and Agriculture Organization. Food and Agricultural Commodities Production; Food and Agriculture Organization: Rome, Italy, 2014. [Google Scholar]
- Kelsh, R.N. Genetics and Evolution of Pigment Patterns in Fish. Pigment Cell Res. 2004, 17, 326–336. [Google Scholar] [CrossRef] [PubMed]
- Protas, M.E.; Patel, N.H. Evolution of Coloration Patterns. Annu. Rev. Cell Dev. Biol. 2008, 24, 425–446. [Google Scholar] [CrossRef] [PubMed]
- Zhu, W.; Wang, L.; Dong, Z.; Chen, X.; Song, F.; Liu, N.; Hui, Y.; Fu, J. Comparative Transcriptome Analysis Identifies Candidate Genes Related to Skin Color Differentiation in Red Tilapia. Sci. Rep. 2016, 6, 31347. [Google Scholar] [CrossRef] [PubMed]
- Aly, H.A.; Abdel-Rahim, M.M.; Lotfy, A.M.; Abdelaty, B.S. Impact of Different Colors of Artificial Light on Pigmentation and Growth Performance of Hybrid Red Tilapia (Oreochromis mosambicus × O. hornorum) Reared in Saline Well Water. J. Marine Sci. Res. Dev. 2017, 7, 229. [Google Scholar] [CrossRef]
- Wang, L.-M.; Zhu, W.-B.; Yang, J.; Miao, L.-H.; Dong, J.-J.; Song, F.-B.; Dong, Z.-J. Effects of dietary cystine and tyrosine on melanogenesis pathways involved in skin color differentiation of Malaysian red tilapia. Aquaculture 2018. [Google Scholar] [CrossRef]
- Aspengren, S.; Sköld, H.N.; Wallin, M. Different strategies for color change. Cell. Mol. Life Sci. 2009, 66, 187–191. [Google Scholar] [CrossRef] [PubMed]
- Eskova, A.; Chauvigné, F.; Maischein, H.M.; Ammelburg, M.; Cerdà, J.; Nüssleinvolhard, C.; Irion, U. Gain-of-function mutations in Aqp3a influence zebrafish pigment pattern formation through the tissue environment. Development 2017, 144, 2059–2069. [Google Scholar] [CrossRef] [PubMed]
- Kelsh, R.N.; Brand, M.; Jiang, Y.J.; Heisenberg, C.P.; Lin, S.; Haffter, P.; Odenthal, J.; Mullins, M.C.; van Eeden, F.J.; Furutaniseiki, M. Zebrafish pigmentation mutations and the processes of neural crest development. Development 1996, 123, 369–389. [Google Scholar] [PubMed]
- Hamada, H.; Watanabe, M.; Lau, H.E.; Nishida, T.; Hasegawa, T.; Parichy, D.M.; Kondo, S. Involvement of Delta/Notch signaling in zebrafish adult pigment stripe patterning. Development 2014, 141, 318–324. [Google Scholar] [CrossRef] [PubMed]
- Jiang, Y.; Zhang, S.; Jian, X.; Feng, J.; Shahid, M.; Al-Ghanim, K.A.; Sun, X.; Peng, X. Comparative Transcriptome Analysis Reveals the Genetic Basis of Skin Color Variation in Common Carp. PLoS ONE 2014, 9, e108200. [Google Scholar] [CrossRef] [PubMed]
- Wang, C.; Wachholtz, M.; Wang, J.; Liao, X.; Lu, G. Analysis of the skin transcriptome in two Oujiang color varieties of common carp. PLoS ONE 2014, 9, e90074. [Google Scholar] [CrossRef] [PubMed]
- Dong, C.; Wang, H.; Xue, L.; Dong, Y.; Yang, L.; Fan, R.; Yu, X.; Tian, X.; Ma, S.; Smith, G.W. Coat color determination by miR-137 mediated down-regulation of microphthalmia-associated transcription factor in a mouse model. RNA 2012, 18, 1679–1686. [Google Scholar] [CrossRef] [PubMed]
- Kennell, J.A.; Cadigan, K.M.; Shakhmantsir, I.; Waldron, E.J. The MicroRNA miR-8 is a positive regulator of pigmentation and eclosion in Drosophila. Dev. Dyn. 2012, 241, 161–168. [Google Scholar] [CrossRef] [PubMed] [Green Version]
- Huang, Y.; Yang, Y.B.; Gao, X.C.; Ren, H.T.; Xiong, J.L.; Sun, X.H. Genome-wide identification and characterization of microRNAs and target prediction by computational approaches in common carp. Gene Rep. 2017, 8, 30–36. [Google Scholar] [CrossRef]
- Yan, B.; Liu, B.; Zhu, C.D.; Li, K.L.; Yue, L.J.; Zhao, J.L.; Gong, X.L.; Wang, C.H. microRNA regulation of skin pigmentation in fish. J. Cell Sci. 2013, 126, 3401–3408. [Google Scholar] [CrossRef] [PubMed]
- Denecker, G.; Vandamme, N.; Akay, Ö.; Koludrovic, D.; Taminau, J.; Lemeire, K.; Gheldof, A.; Craene, B.D.; Gele, M.V.; Brochez, L. Identification of a ZEB2-MITF-ZEB1 transcriptional network that controls melanogenesis and melanoma progression. Cell Death Differ. 2014, 21, 1250. [Google Scholar] [CrossRef] [PubMed]
- Widlund, H.R.; Horstmann, M.A.; Price, E.R.; Cui, J.; Lessnick, S.L.; Wu, M.; He, X.; Fisher, D.E. Beta-catenin-induced melanoma growth requires the downstream target Microphthalmia-associated transcription factor. J. Cell Biol. 2002, 158, 1079–1087. [Google Scholar] [CrossRef] [PubMed]
- Farlora, R.; Valenzuela-Miranda, D.; Alarcón-Matus, P.; Gallardo-Escárate, C. Identification of microRNAs associated with sexual maturity in rainbow trout brain and testis through small RNA deep sequencing. Mol. Reprod. Dev. 2015, 82, 651–662. [Google Scholar] [CrossRef] [PubMed]
- Stolt, C.C.; Lommes, P.; Hillgärtner, S.; Wegner, M. The transcription factor Sox5 modulates Sox10 function during melanocyte development. Nucl. Acids Res. 2008, 36, 5427–5440. [Google Scholar] [CrossRef] [PubMed]
- Cal, L.; Suarezbregua, P.; Cerdáreverter, J.M.; Braasch, I.; Rotllant, J. Fish pigmentation and the melanocortin system. Comp. Biochem. Physiol. Part A Mol. Integr. Physiol. 2017, 211, 26–33. [Google Scholar] [CrossRef] [PubMed]
- Gao, Y.; Fan, X.W.; Li, W.N.; Ping, W.; Deng, Y.; Fu, X.N. miR-138-5p reverses gefitinib resistance in non-small cell lung cancer cells via negatively regulating G protein-coupled receptor 124. Biochem. Biophys. Res. Commun. 2014, 446, 179–186. [Google Scholar] [CrossRef] [PubMed]
- Wu, J.; Xiong, S.; Jing, J.; Chen, X.; Wang, W.; Gui, J.F.; Mei, J. Comparative Transcriptome Analysis of Differentially Expressed Genes and Signaling Pathways between XY and YY Testis in Yellow Catfish. PLoS ONE 2015, 10, e0134626. [Google Scholar] [CrossRef] [PubMed]
- Tao, W.; Sun, L.; Shi, H.; Cheng, Y.; Jiang, D.; Fu, B.; Conte, M.A.; Gammerdinger, W.J.; Kocher, T.D.; Wang, D. Integrated analysis of miRNA and mRNA expression profiles in tilapia gonads at an early stage of sex differentiation. BMC Genom. 2016, 17, 328. [Google Scholar] [CrossRef] [PubMed]
- Brzuzan, P.; Woźny, M.; Wolińska, L.; Piasecka, A. Expression profiling in vivo demonstrates rapid changes in liver microRNA levels of whitefish (Coregonus lavaretus) following microcystin-LR exposure. Aquat. Toxicol. 2012, 122–123, 188–196. [Google Scholar] [CrossRef] [PubMed]
- Tong, C.; Tian, F.; Zhang, C.; Zhao, K. The microRNA repertoire of Tibetan naked carp Gymnocypris przewalskii: A case study in Schizothoracinae fish on the Tibetan Plateau. PLoS ONE 2017, 12, e0174534. [Google Scholar] [CrossRef] [PubMed]
- Li, G.; Zhao, Y.; Wen, L.; Liu, Z.; Yan, F.; Gao, C. Identification and characterization of microRNAs in the spleen of common carp immune organ. J. Cell. Biochem. 2014, 115, 1768–1778. [Google Scholar] [CrossRef] [PubMed]
- Chiang, H.M.; Chien, Y.C.; Wu, C.H.; Kuo, Y.H.; Wu, W.C.; Pan, Y.Y.; Su, Y.H.; Wen, K.C. Hydroalcoholic extract of Rhodiola rosea L. (Crassulaceae) and its hydrolysate inhibit melanogenesis in B16F0 cells by regulating the CREB/MITF/tyrosinase pathway. Food Chem. Toxicol. 2014, 65, 129–139. [Google Scholar] [CrossRef] [PubMed]
- Alhussaini, H.; Kilarkaje, N.; Shahabi, G.; Almulla, F. Proliferation and Migration of Peripheral Retinal Pigment Epithelial Cells Are Associated with the Upregulation of Wingless-Related Integration and Bone Morphogenetic Protein Signaling in Dark Agouti Rats. Med. Princ. Pract. 2016, 25, 408–416. [Google Scholar] [CrossRef] [PubMed]
- Hayashi, E.; Hachiya, K.; Kojo, S.; Baghdadi, M.; Takeuchi, S.; Yamanaka, H.; Abe, H.; Wada, H.; Seino, K.I. α-MSH stimulation contributes to TGF-β1 production via MC1R-MITF signaling pathway in melanoma cell. Inflamm. Regen. 2015, 35, 244–254. [Google Scholar] [CrossRef]
- Michael, H.T.; Merlino, G. A Topical Solution to the Sunless Tanning Problem. Trends Mol. Med. 2017, 23, 771–773. [Google Scholar] [CrossRef] [PubMed]
- Baek, S.H.; Lee, S.H. Sesamol decreases melanin biosynthesis in melanocyte cells and zebrafish: Possible involvement of MITF via the intracellular cAMP and p38/JNK signalling pathways. Exp. Dermatol. 2015, 24, 761–766. [Google Scholar] [CrossRef] [PubMed]
- Martina, P.; Nayden, C.; Oliver, R.; Jörn, K.; Alexander, G.; Sorenson, M.D.; Oliver, K.; Ivan, H.J. De novoassembly of the dual transcriptomes of a polymorphic raptor species and its malarial parasite. BMC Genom. 2015, 16, 1038. [Google Scholar]
- Su, T.R.; Lin, J.J.; Tsai, C.C.; Huang, T.K.; Yang, Z.Y.; Wu, M.O.; Zheng, Y.Q.; Su, C.C.; Wu, Y.J. Inhibition of melanogenesis by gallic acid: Possible involvement of the PI3K/Akt, MEK/ERK and Wnt/β-catenin signaling pathways in B16F10 cells. Int. J. Mol. Sci. 2013, 14, 20443–20458. [Google Scholar] [CrossRef] [PubMed]
- Guyon, R.; Rakotomanga, M.; Azzouzi, N.; Coutanceau, J.P.; Bonillo, C.; D’Cotta, H.; Pepey, E.; Soler, L.; Rodier-Goud, M.; D’Hont, A. A high-resolution map of the Nile tilapia genome: A resource for studying cichlids and other percomorphs. BMC Genom. 2012, 13, 222. [Google Scholar] [CrossRef] [PubMed] [Green Version]
- Li, R.; Yu, C.; Li, Y.; Lam, T.W.; Yiu, S.M.; Kristiansen, K.; Wang, J. SOAP2: An improved ultrafast tool for short read alignment. Bioinformatics 2009, 25, 1966–1967. [Google Scholar] [CrossRef] [PubMed]
- Kozomara, A.; Griffithsjones, S. miRBase: Integrating microRNA annotation and deep-sequencing data. Nucl. Acids Res. 2011, 39, D152–D157. [Google Scholar] [CrossRef] [PubMed]
- Wang, L.; Feng, Z.; Wang, X.; Wang, X.; Zhang, X. DEGseq: An R package for identifying differentially expressed genes from RNA-seq data. Bioinformatics 2010, 26, 136–138. [Google Scholar] [CrossRef] [PubMed]
- Krüger, J.; Rehmsmeier, M. RNAhybrid: MicroRNA target prediction easy, fast and flexible. Nucl. Acids Res. 2006, 34, W451–W454. [Google Scholar] [CrossRef] [PubMed]
- Betel, D.; Koppal, A.; Agius, P.; Sander, C.; Leslie, C. Comprehensive modeling of microRNA targets predicts functional non-conserved and non-canonical sites. Genome Biol. 2010, 11, R90. [Google Scholar] [CrossRef] [PubMed]
- Agarwal, V.; Bell, G.W.; Nam, J.W.; Bartel, D.P. Predicting effective microRNA target sites in mammalian mRNAs. Elife Sci. 2015, 4, e05005. [Google Scholar] [CrossRef] [PubMed]
- Kanehisa, M.; Goto, S. KEGG: Kyoto encyclopedia of genes and genomes. Nucl. Acids Res. 2000, 28, 27–30. [Google Scholar] [CrossRef] [PubMed]
- Xie, C.; Mao, X.; Huang, J.; Ding, Y.; Wu, J.; Dong, S.; Kong, L.; Gao, G.; Li, C.Y.; Wei, L. KOBAS 2.0: A web server for annotation and identification of enriched pathways and diseases. Nucl. Acids Res. 2011, 39, 316–322. [Google Scholar] [CrossRef] [PubMed]
- Shannon, P.; Markiel, A.; Ozier, O.; Baliga, N.S.; Wang, J.T.; Ramage, D.; Amin, N.; Schwikowski, B.; Ideker, T. Cytoscape: A Software Environment for Integrated Models of Biomolecular Interaction Networks. Genome Res. 2003, 13, 2498–2504. [Google Scholar] [CrossRef] [PubMed]


| Item | Reads Count (Percent) | ||||||||
|---|---|---|---|---|---|---|---|---|---|
| PB-1 * | PB-2 | PB-3 | PR-1 * | PR-2 | PR-3 | WP-1 * | WP-2 | WP-3 | |
| Total reads | 9745021 | 10172163 | 9597796 | 9138122 | 9086032 | 8568364 | 9696144 | 10741698 | 12108798 |
| High-quality | 9712465 | 10139260 | 9567374 | 9110612 | 9061737 | 8542050 | 9664568 | 10707005 | 12069765 |
| (100%) | (100%) | (100%) | (100%) | (100%) | (100%) | (100%) | (100%) | (100%) | |
| 3′adapter_null | 48695 | 34324 | 47557 | 100967 | 39684 | 45828 | 19254 | 44297 | 139902 |
| (0.50%) | (0.34%) | (0.50%) | (1.11%) | (0.44%) | (0.54%) | (0.20%) | (0.41%) | (1.16%) | |
| Insert null | 2723 | 7882 | 2208 | 5979 | 11028 | 6166 | 11419 | 3320 | 11089 |
| (0.03%) | (0.08%) | (0.02%) | (0.07%) | (0.12%) | (0.07%) | (0.12%) | (0.03%) | (0.09%) | |
| 5′adapter_contaminants | 24540 | 37898 | 24172 | 20256 | 22141 | 36854 | 14270 | 11819 | 9483 |
| (0.25%) | (0.37%) | (0.25%) | (0.22%) | (0.24%) | (0.43%) | (0.15%) | (0.11%) | (0.08%) | |
| Smaller_than_18nt | 245041 | 685335 | 1303589 | 587330 | 1111375 | 811448 | 683397 | 413050 | 555142 |
| (2.52%) | (6.76%) | (13.63%) | (6.45%) | (12.26%) | (9.50%) | (7.07%) | (3.86%) | (4.60%) | |
| Poly A | 82 | 87 | 52 | 153 | 64 | 118 | 71 | 127 | 129 |
| (<0.01%) | (<0.01%) | (<0.01%) | (<0.01%) | (<0.01%) | (<0.01%) | (<0.01%) | (<0.01%) | (<0.01%) | |
| Clean reads | 9391384 | 9373734 | 8189796 | 8395927 | 7877445 | 7641636 | 8936157 | 10234392 | 11354020 |
| (96.69%) | (92.45%) | (85.60%) | (92.16%) | (86.93%) | (89.46%) | (92.46%) | (95.59%) | (94.07%) | |
© 2018 by the authors. Licensee MDPI, Basel, Switzerland. This article is an open access article distributed under the terms and conditions of the Creative Commons Attribution (CC BY) license (http://creativecommons.org/licenses/by/4.0/).
Share and Cite
Wang, L.; Zhu, W.; Dong, Z.; Song, F.; Dong, J.; Fu, J. Comparative microRNA-seq Analysis Depicts Candidate miRNAs Involved in Skin Color Differentiation in Red Tilapia. Int. J. Mol. Sci. 2018, 19, 1209. https://doi.org/10.3390/ijms19041209
Wang L, Zhu W, Dong Z, Song F, Dong J, Fu J. Comparative microRNA-seq Analysis Depicts Candidate miRNAs Involved in Skin Color Differentiation in Red Tilapia. International Journal of Molecular Sciences. 2018; 19(4):1209. https://doi.org/10.3390/ijms19041209
Chicago/Turabian StyleWang, Lanmei, Wenbin Zhu, Zaijie Dong, Feibiao Song, Juanjuan Dong, and Jianjun Fu. 2018. "Comparative microRNA-seq Analysis Depicts Candidate miRNAs Involved in Skin Color Differentiation in Red Tilapia" International Journal of Molecular Sciences 19, no. 4: 1209. https://doi.org/10.3390/ijms19041209