Circulating Tumour DNA Analysis for Tumour Genome Characterisation and Monitoring Disease Burden in Extramedullary Multiple Myeloma

 , ,
, ,
Abstract
: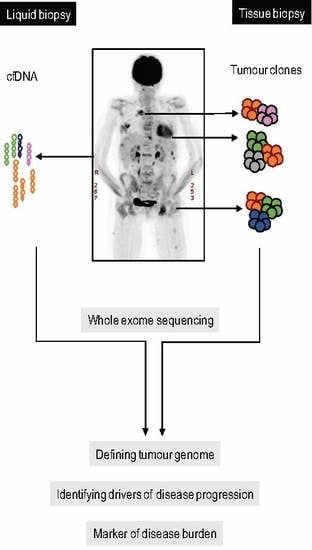
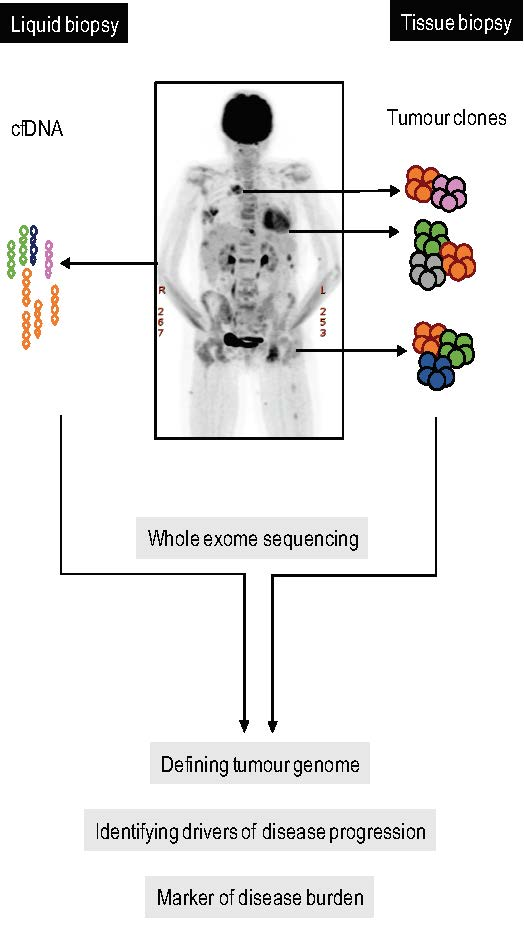
1. Introduction
2. Results
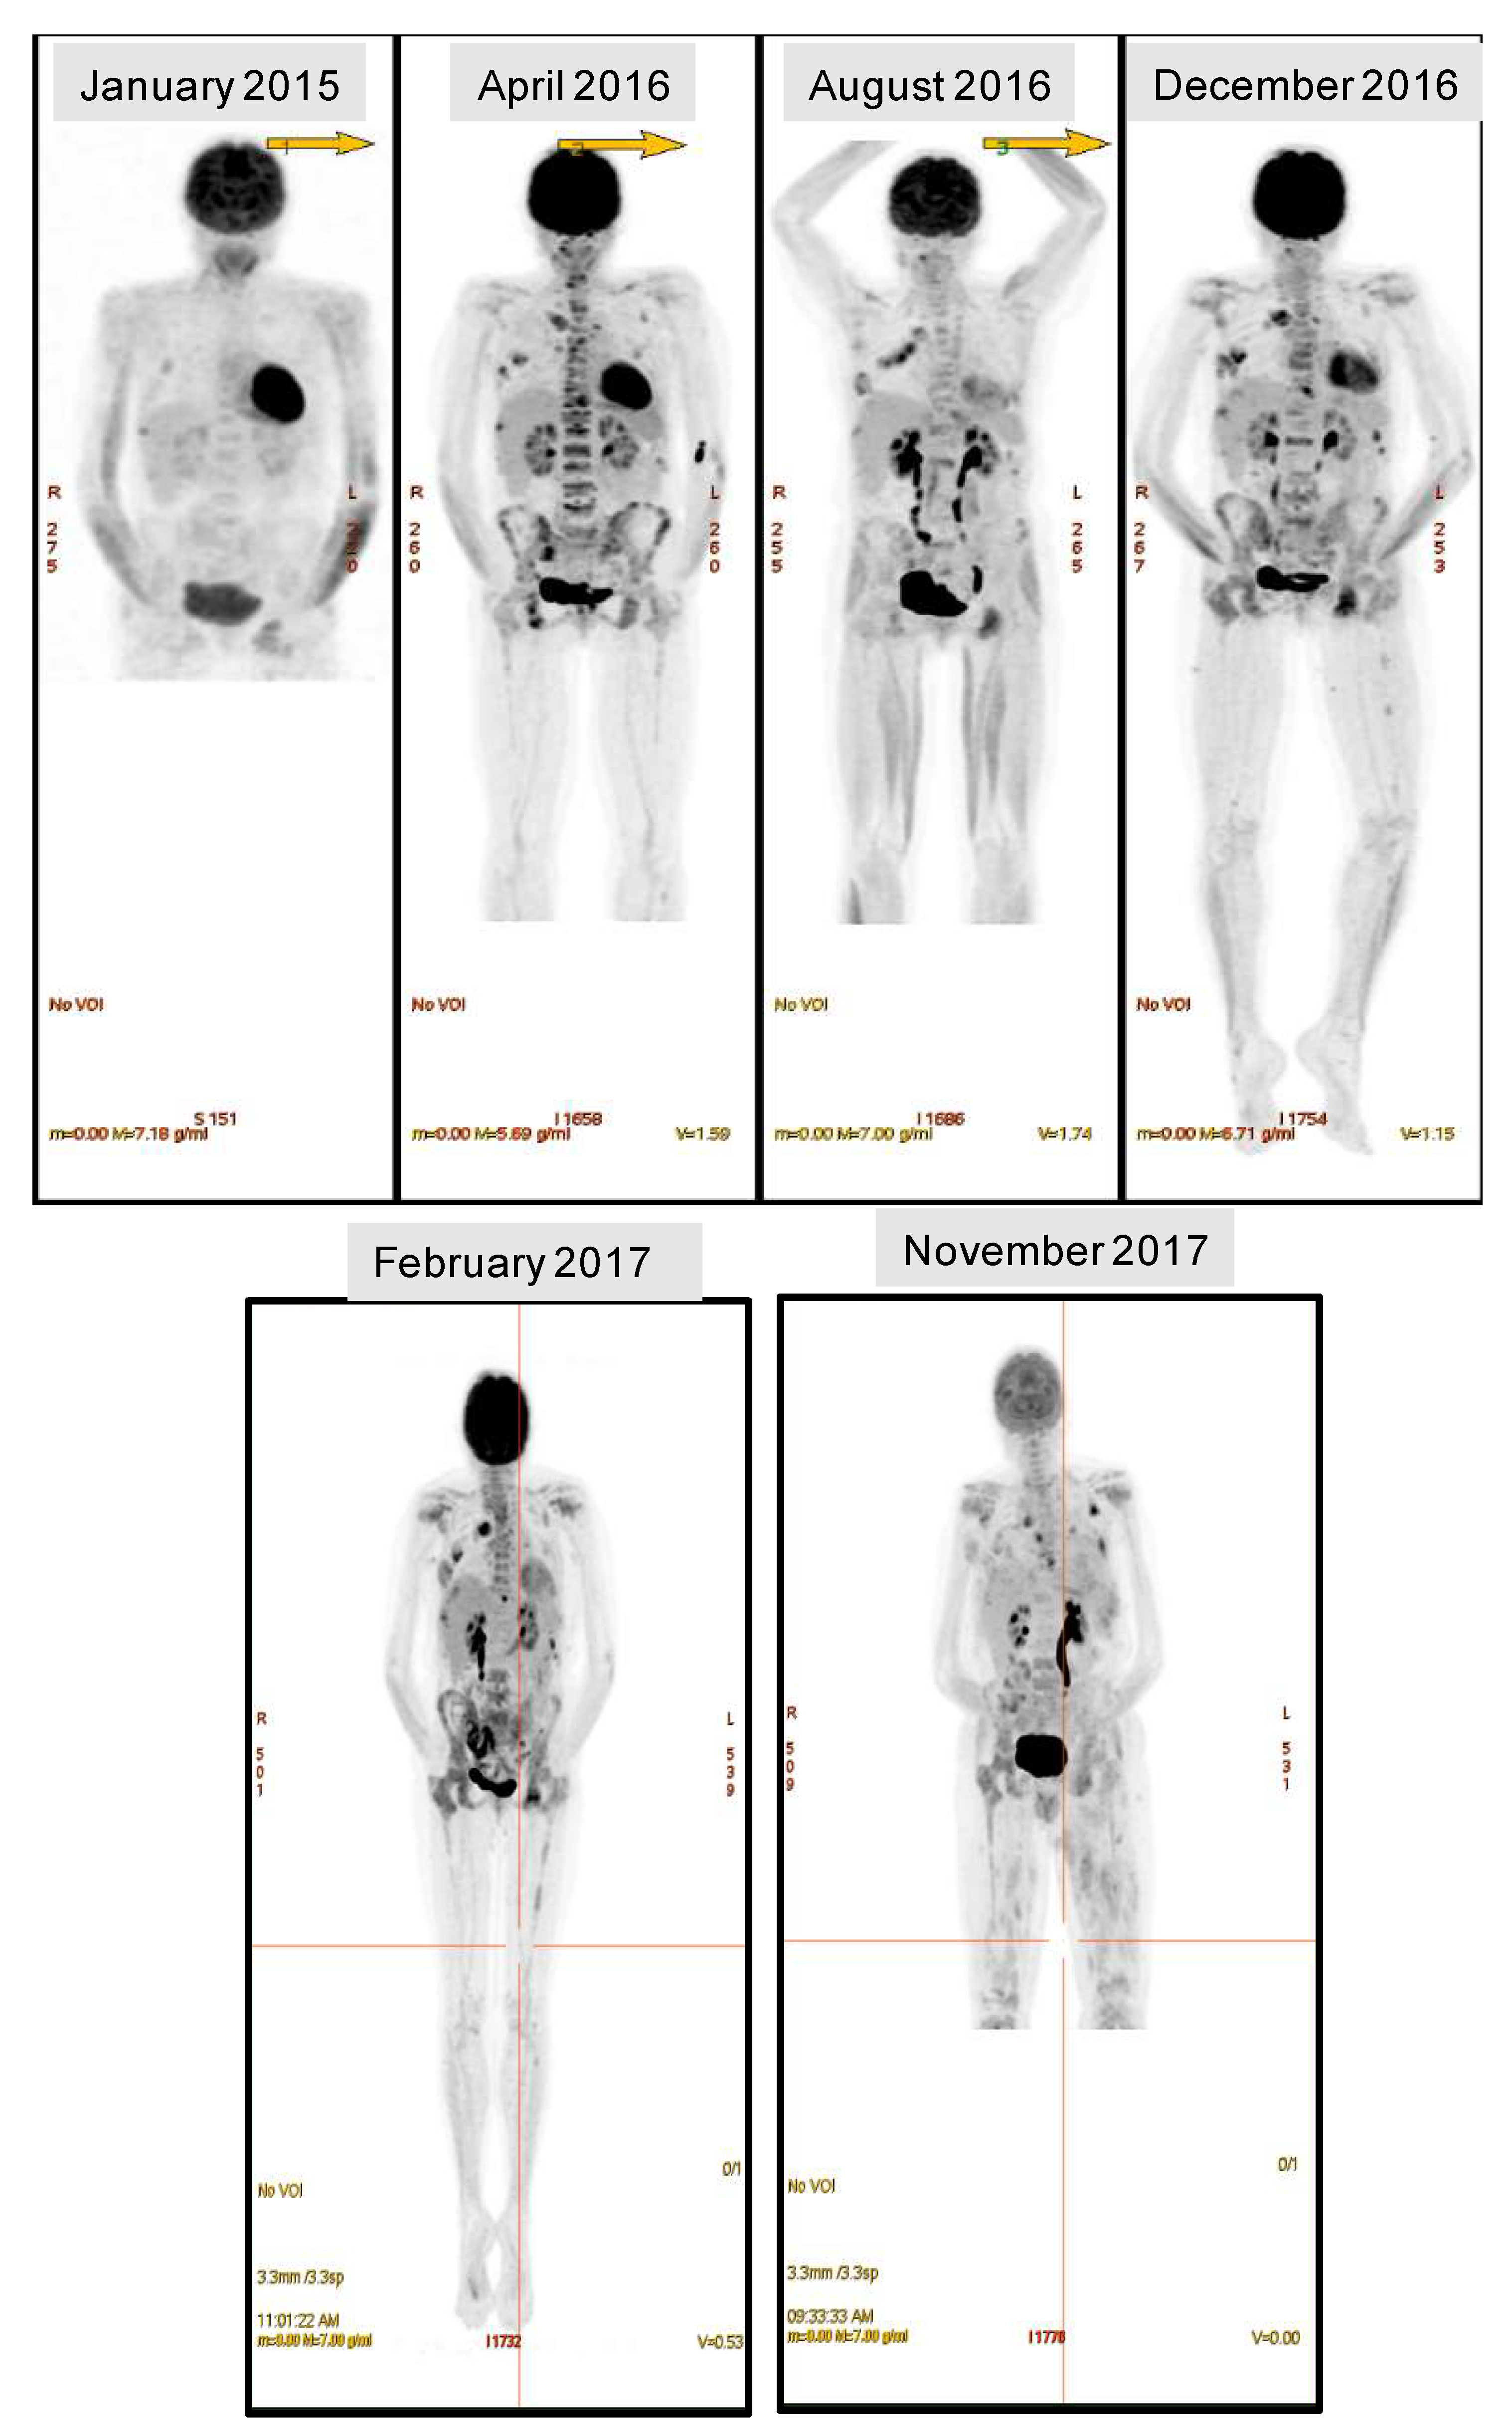
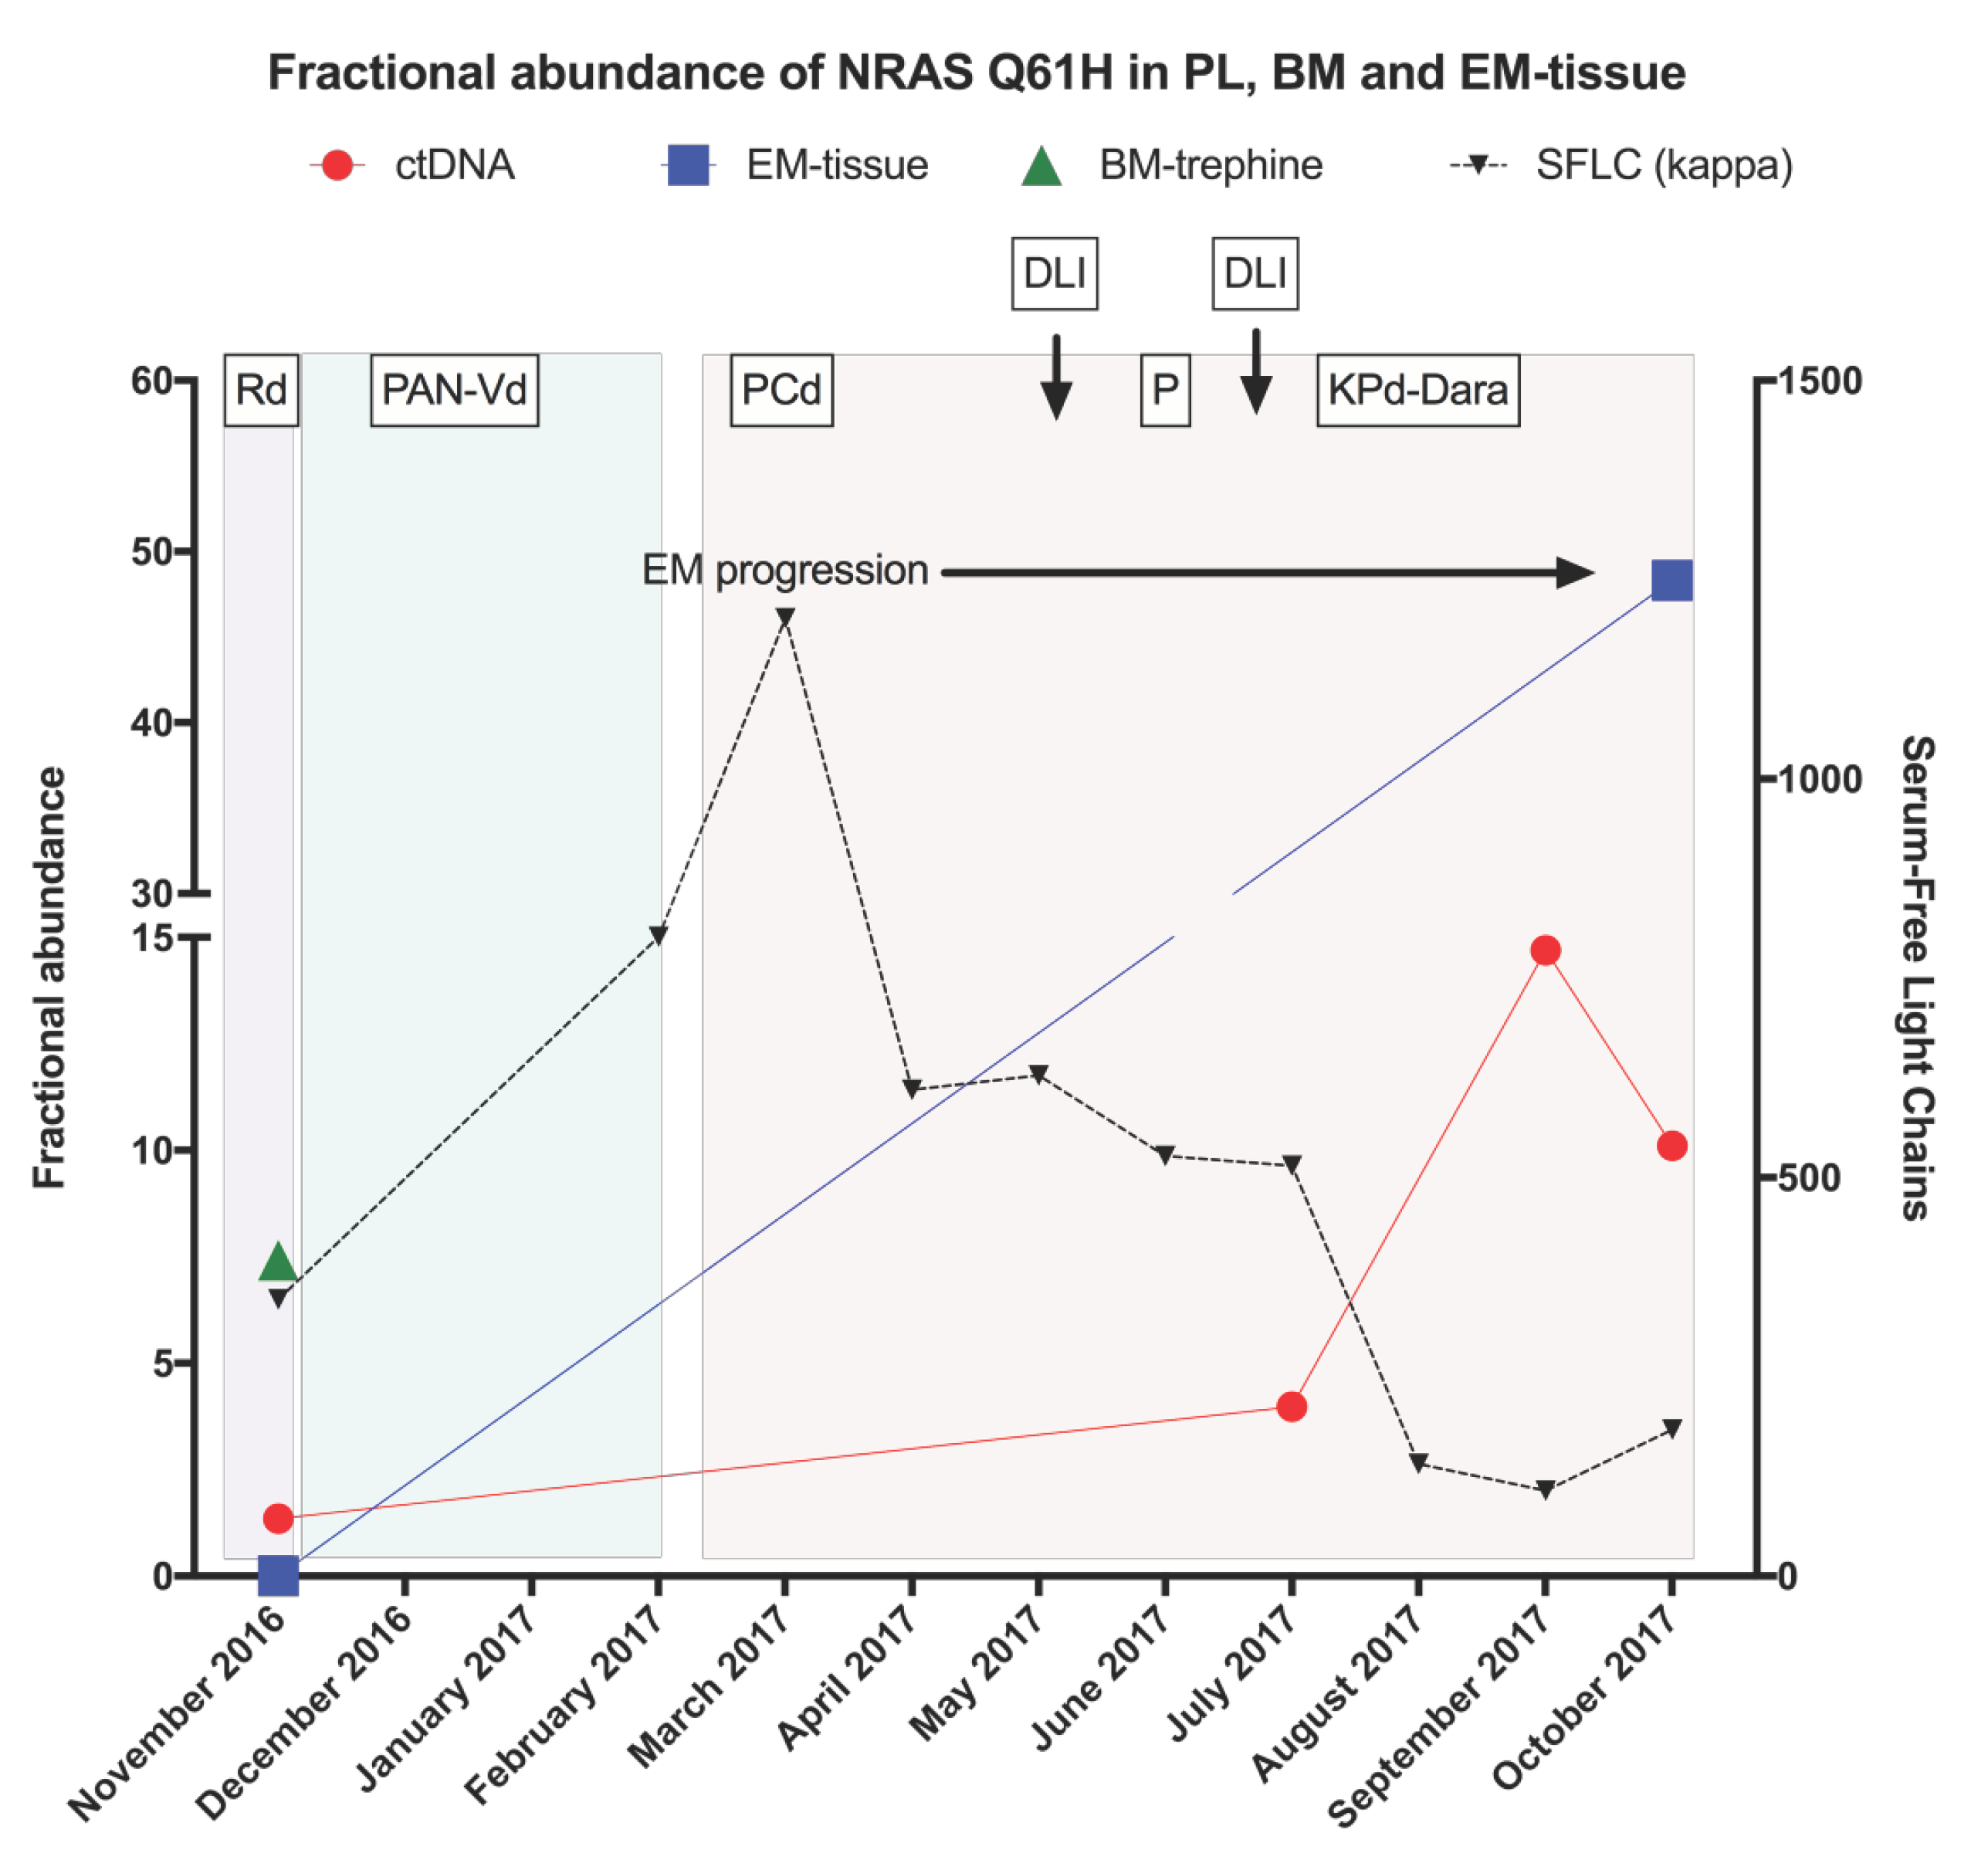
2.1. Case Description
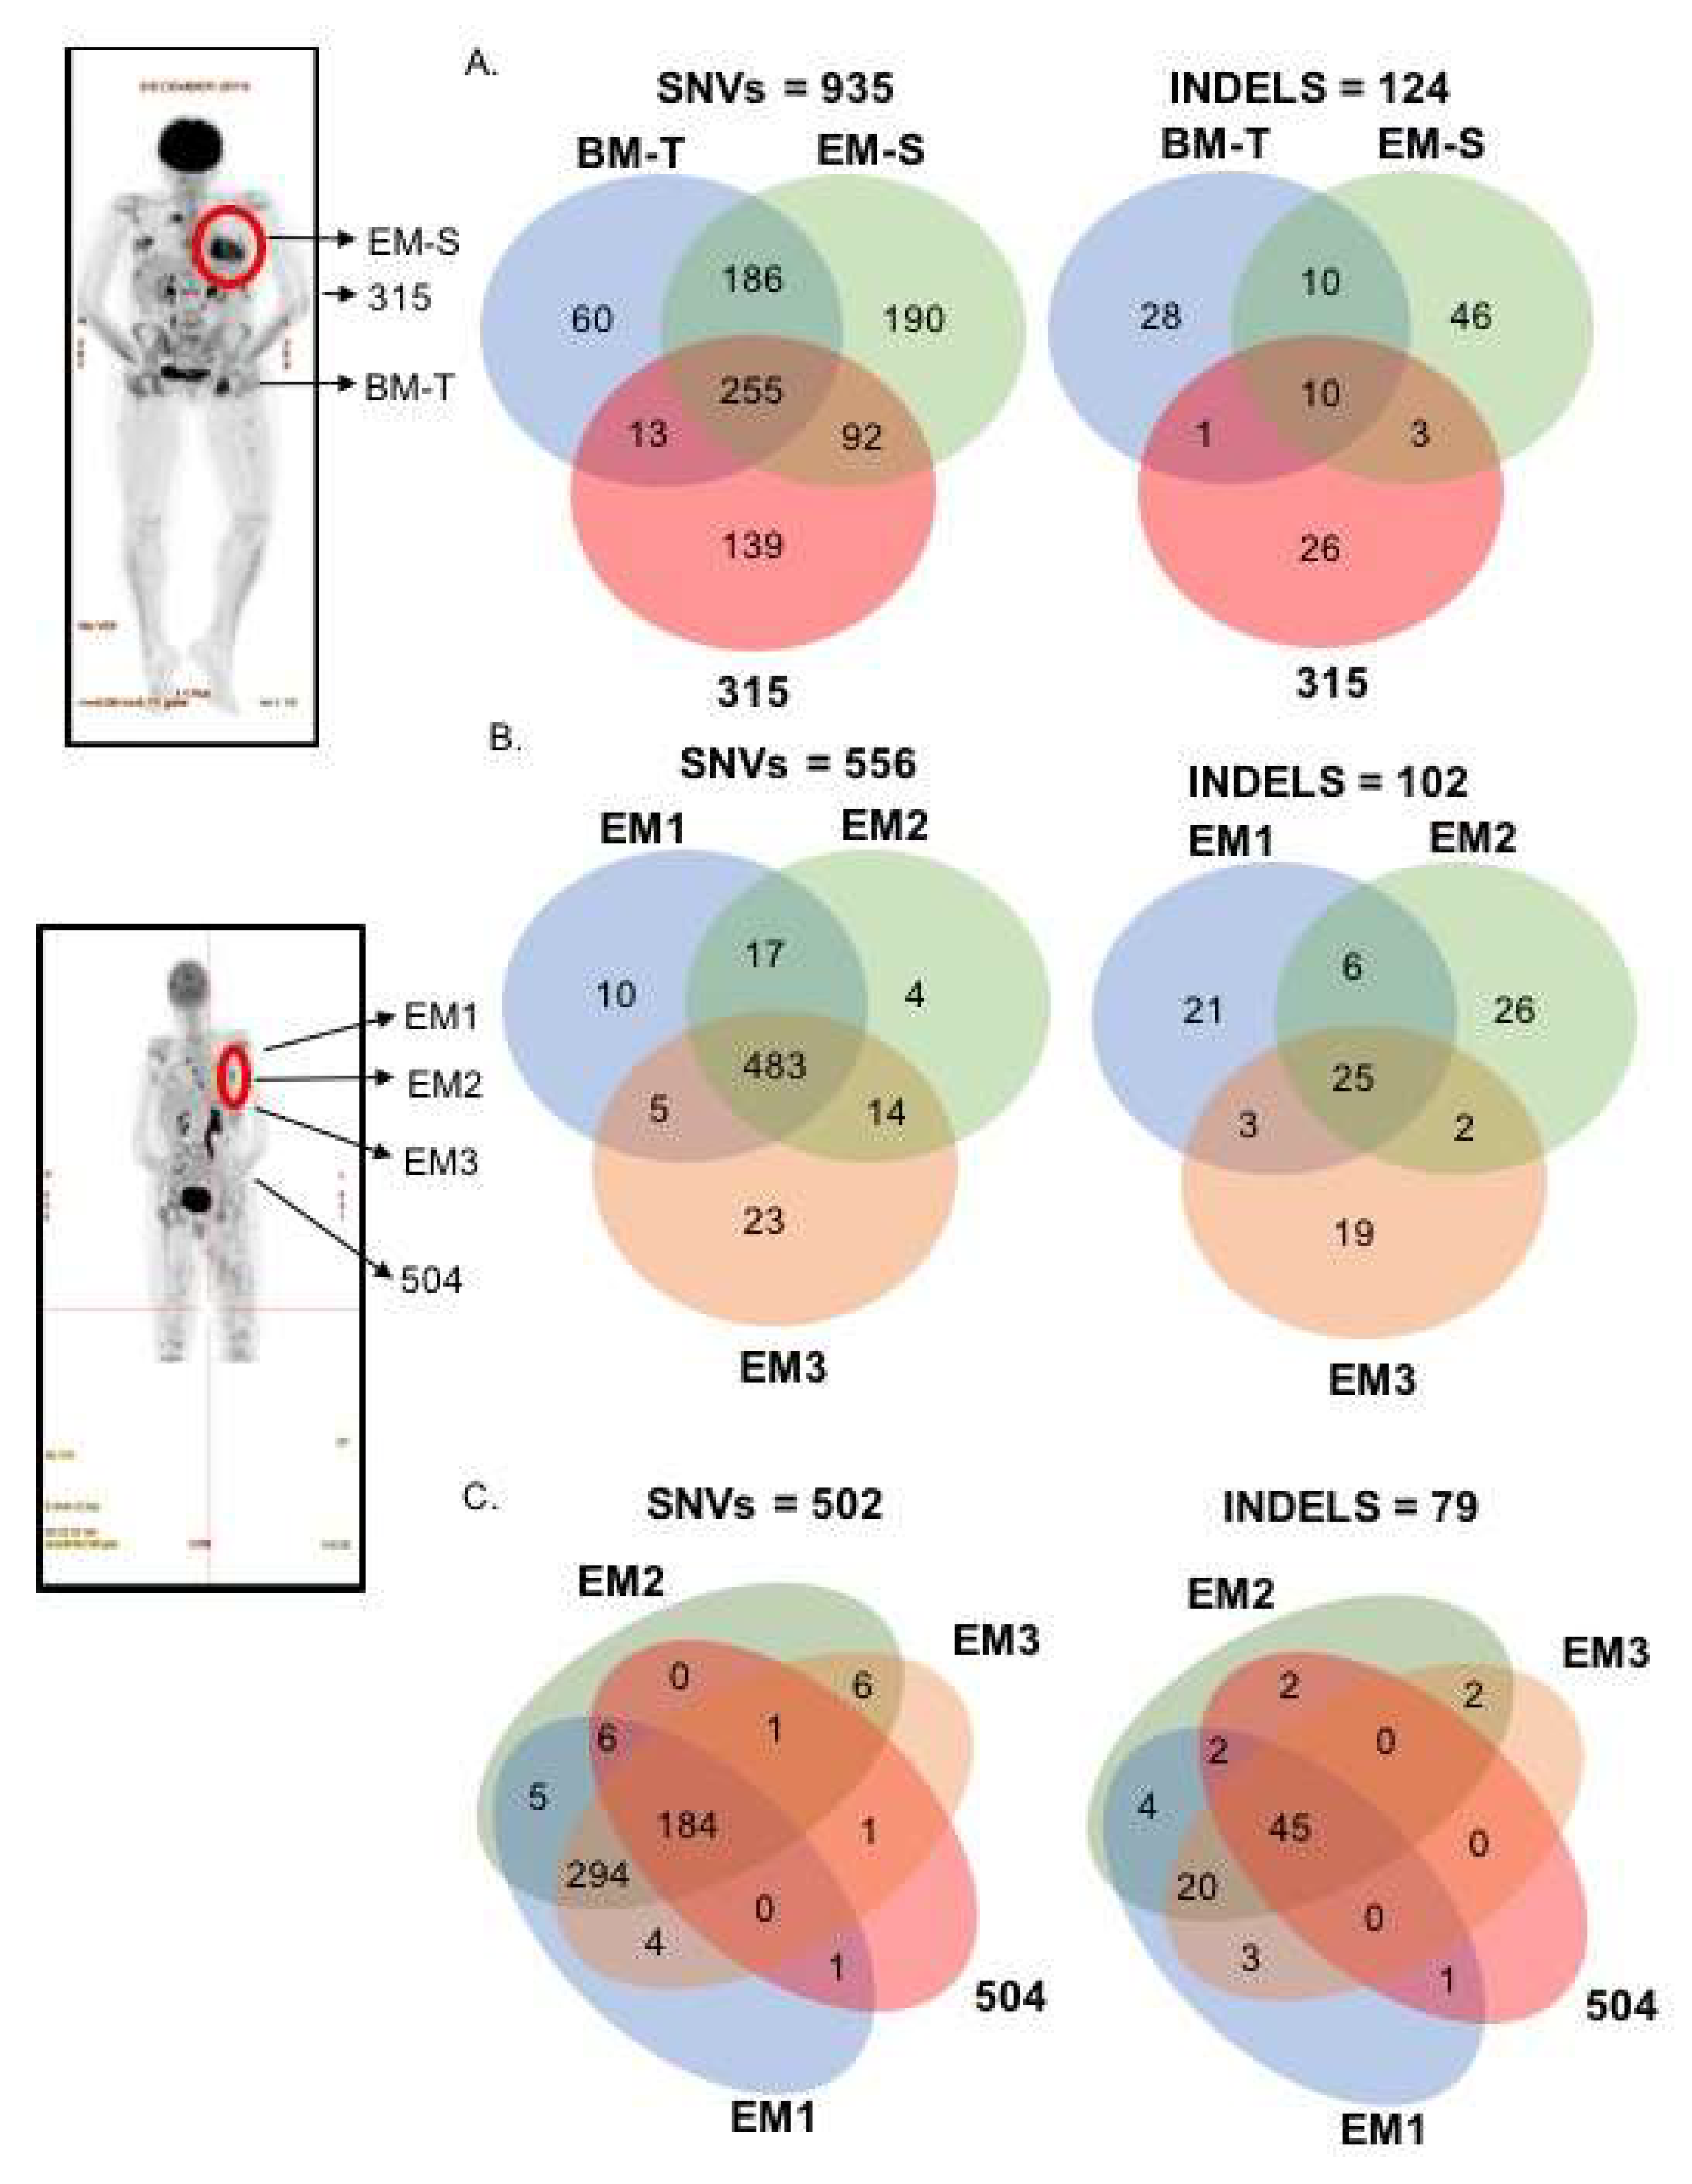
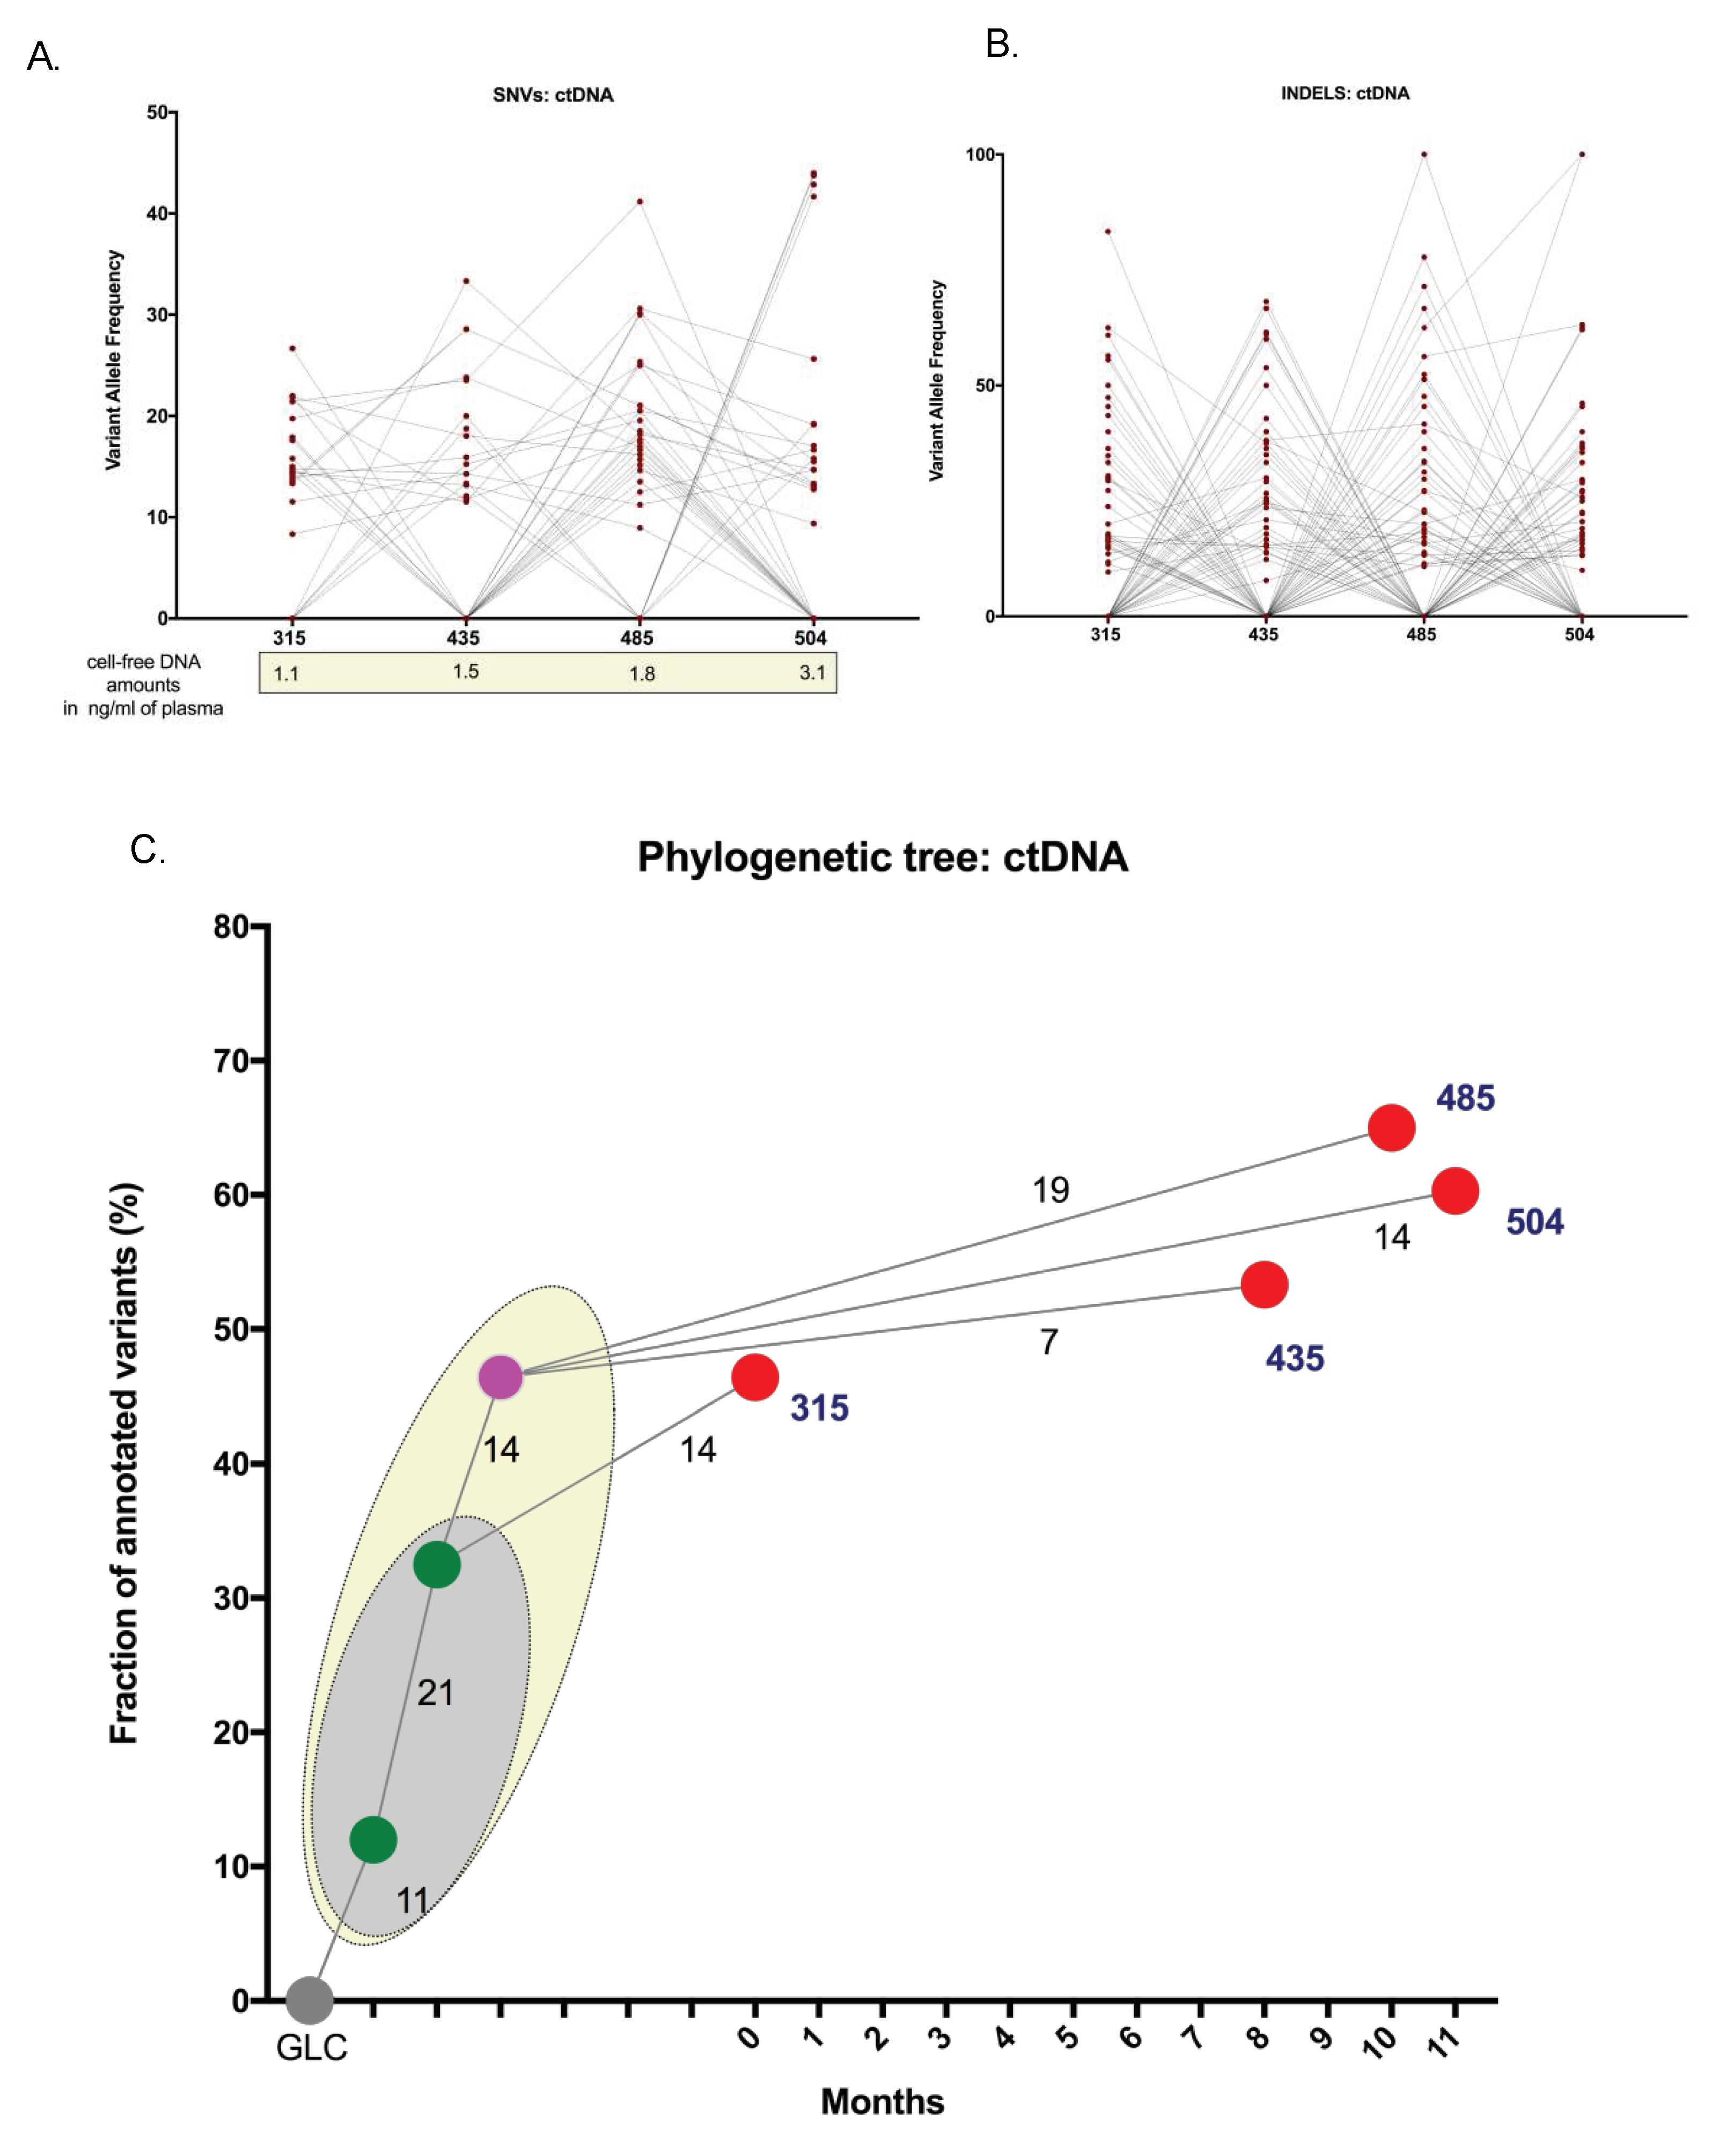
2.2. Spatial Genomic Heterogeneity in EM-MM
2.3. Temporal Heterogeneity and Biology of Disease Progression
2.4. ctDNA Analysis for Disease Progression
3. Discussion
4. Materials and Methods
4.1. Peripheral Blood (PB) Collection and Processing
4.2. Cell-Free DNA Extraction
4.3. Genomic DNA Extraction from PBMC/EM Tissue Biopsy/Trephine
4.4. Whole Exome Sequencing and Identification of Somatic Variants
4.5. Droplet Digital PCR
Supplementary Materials
Author Contributions
Funding
Acknowledgments
Conflicts of Interest
References
- Kalff, A.; Khong, T.; Wall, M.; Gorniak, M.; Mithraprabhu, S.; Campbell, L.J.; Spencer, A. A rare case of igh/myc and igh/bcl2 double hit primary plasma cell leukemia. Haematologica 2015, 100, e60–e62. [Google Scholar] [CrossRef] [PubMed]
- Bolli, N.; Avet-Loiseau, H.; Wedge, D.C.; Van Loo, P.; Alexandrov, L.B.; Martincorena, I.; Dawson, K.J.; Iorio, F.; Nik-Zainal, S.; Bignell, G.R.; et al. Heterogeneity of genomic evolution and mutational profiles in multiple myeloma. Nat. Commun. 2014, 5, 2997. [Google Scholar] [CrossRef] [PubMed] [Green Version]
- de Haart, S.J.; Willems, S.M.; Mutis, T.; Koudijs, M.J.; van Blokland, M.T.; Lokhorst, H.M.; de Weger, R.A.; Minnema, M.C. Comparison of intramedullary myeloma and corresponding extramedullary soft tissue plasmacytomas using genetic mutational panel analyses. Blood Cancer J. 2016, 6, e426. [Google Scholar] [CrossRef] [PubMed]
- Melchor, L.; Jones, J.R.; Lenive, O.; Peterson, E.A.; Brioli, A.; Murison, A.; Wardell, C.P.; Kaiser, M.F.; Proszek, P.; Boyle, E.M.; et al. Spatiotemporal analysis of intraclonal heterogeneity in multiple myeloma: Unravelling the impact of treatment and the propagating capacity of subclones using whole exome sequencing. Blood 2015, 126. [Google Scholar]
- Egan, J.B.; Kortuem, K.M.; Kurdoglu, A.; Izatt, T.; Aldrich, J.; Reiman, R.; Phillips, L.; Baker, A.; Shi, C.X.; Schmidt, J.; et al. Extramedullary myeloma whole genome sequencing reveals novel mutations in cereblon, proteasome subunit g2 and the glucocorticoid receptor in multi drug resistant disease. Br. J. Haematol. 2013, 161, 748–751. [Google Scholar] [CrossRef] [PubMed]
- Egan, J.B.; Shi, C.X.; Tembe, W.; Christoforides, A.; Kurdoglu, A.; Sinari, S.; Middha, S.; Asmann, Y.; Schmidt, J.; Braggio, E.; et al. Whole-genome sequencing of multiple myeloma from diagnosis to plasma cell leukemia reveals genomic initiating events, evolution, and clonal tides. Blood 2012, 120, 1060–1066. [Google Scholar] [CrossRef] [PubMed] [Green Version]
- Blade, J.; Fernandez de Larrea, C.; Rosinol, L.; Cibeira, M.T.; Jimenez, R.; Powles, R. Soft-tissue plasmacytomas in multiple myeloma: Incidence, mechanisms of extramedullary spread, and treatment approach. J. Clin. Oncol. 2011, 29, 3805–3812. [Google Scholar] [CrossRef] [PubMed]
- Pour, L.; Sevcikova, S.; Greslikova, H.; Kupska, R.; Majkova, P.; Zahradova, L.; Sandecka, V.; Adam, Z.; Krejci, M.; Kuglik, P.; et al. Soft-tissue extramedullary multiple myeloma prognosis is significantly worse in comparison to bone-related extramedullary relapse. Haematologica 2014, 99, 360–364. [Google Scholar] [CrossRef] [PubMed]
- Usmani, S.Z.; Heuck, C.; Mitchell, A.; Szymonifka, J.; Nair, B.; Hoering, A.; Alsayed, Y.; Waheed, S.; Haider, S.; Restrepo, A.; et al. Extramedullary disease portends poor prognosis in multiple myeloma and is over-represented in high-risk disease even in the era of novel agents. Haematologica 2012, 97, 1761–1767. [Google Scholar] [CrossRef] [PubMed] [Green Version]
- Varettoni, M.; Corso, A.; Pica, G.; Mangiacavalli, S.; Pascutto, C.; Lazzarino, M. Incidence, presenting features and outcome of extramedullary disease in multiple myeloma: A longitudinal study on 1003 consecutive patients. Ann. Oncol. 2010, 21, 325–330. [Google Scholar] [CrossRef] [PubMed]
- Touzeau, C.; Moreau, P. How i treat extramedullary myeloma. Blood 2016, 127, 971–976. [Google Scholar] [CrossRef] [PubMed]
- Rasche, L.; Chavan, S.S.; Stephens, O.W.; Patel, P.H.; Tytarenko, R.; Ashby, C.; Bauer, M.; Stein, C.; Deshpande, S.; Wardell, C.; et al. Spatial genomic heterogeneity in multiple myeloma revealed by multi-region sequencing. Nat. Commun. 2017, 8, 268. [Google Scholar] [CrossRef] [PubMed] [Green Version]
- Kis, O.; Kaedbey, R.; Chow, S.; Danesh, A.; Dowar, M.; Li, T.; Li, Z.; Liu, J.; Mansour, M.; Masih-Khan, E.; et al. Circulating tumour DNA sequence analysis as an alternative to multiple myeloma bone marrow aspirates. Nat. Commun. 2017, 8, 15086. [Google Scholar] [CrossRef] [PubMed] [Green Version]
- Mithraprabhu, S.; Khong, T.; Ramachandran, M.; Chow, A.; Klarica, D.; Mai, L.; Walsh, S.; Broemeling, D.; Marziali, A.; Wiggin, M.; et al. Circulating tumour DNA analysis demonstrates spatial mutational heterogeneity that coincides with disease relapse in myeloma. Leukemia 2017, 31, 1695–1705. [Google Scholar] [CrossRef] [PubMed]
- Oberle, A.; Brandt, A.; Voigtlaender, M.; Thiele, B.; Radloff, J.; Schulenkorf, A.; Alawi, M.; Akyuz, N.; Marz, M.; Ford, C.T.; et al. Monitoring multiple myeloma by next-generation sequencing of v(d)j rearrangements from circulating myeloma cells and cell-free myeloma DNA. Haematologica 2017, 102, 1105–1111. [Google Scholar] [CrossRef] [PubMed]
- Rustad, E.H.; Coward, E.; Skytoen, E.R.; Misund, K.; Holien, T.; Standal, T.; Borset, M.; Beisvag, V.; Myklebost, O.; Meza-Zepeda, L.A.; et al. Monitoring multiple myeloma by quantification of recurrent mutations in serum. Haematologica 2017, 102, 1266–1272. [Google Scholar] [CrossRef] [PubMed] [Green Version]
- Butler, T.M.; Johnson-Camacho, K.; Peto, M.; Wang, N.J.; Macey, T.A.; Korkola, J.E.; Koppie, T.M.; Corless, C.L.; Gray, J.W.; Spellman, P.T. Exome sequencing of cell-free DNA from metastatic cancer patients identifies clinically actionable mutations distinct from primary disease. PLoS ONE 2015, 10, e0136407. [Google Scholar] [CrossRef] [PubMed]
- Dietz, S.; Schirmer, U.; Merce, C.; von Bubnoff, N.; Dahl, E.; Meister, M.; Muley, T.; Thomas, M.; Sultmann, H. Low input whole-exome sequencing to determine the representation of the tumor exome in circulating DNA of non-small cell lung cancer patients. PLoS ONE 2016, 11, e0161012. [Google Scholar] [CrossRef] [PubMed]
- Murtaza, M.; Dawson, S.J.; Tsui, D.W.; Gale, D.; Forshew, T.; Piskorz, A.M.; Parkinson, C.; Chin, S.F.; Kingsbury, Z.; Wong, A.S.; et al. Non-invasive analysis of acquired resistance to cancer therapy by sequencing of plasma DNA. Nature 2013, 497, 108–112. [Google Scholar] [CrossRef] [PubMed]
- Chicard, M.; Colmet-Daage, L.; Clement, N.; Danzon, A.; Bohec, M.; Bernard, V.; Baulande, S.; Bellini, A.; Deveau, P.; Pierron, G.; et al. Whole-exome sequencing of cell-free DNA reveals temporo-spatial heterogeneity and identifies treatment-resistant clones in neuroblastoma. Clin. Cancer Res. 2018, 24, 939–949. [Google Scholar] [CrossRef] [PubMed]
- Okosun, J.; Bodor, C.; Wang, J.; Araf, S.; Yang, C.Y.; Pan, C.; Boller, S.; Cittaro, D.; Bozek, M.; Iqbal, S.; et al. Integrated genomic analysis identifies recurrent mutations and evolution patterns driving the initiation and progression of follicular lymphoma. Nat. Genet. 2014, 46, 176–181. [Google Scholar] [CrossRef] [PubMed]
- Scherer, F.; Kurtz, D.M.; Newman, A.M.; Stehr, H.; Craig, A.F.; Esfahani, M.S.; Lovejoy, A.F.; Chabon, J.J.; Klass, D.M.; Liu, C.L.; et al. Distinct biological subtypes and patterns of genome evolution in lymphoma revealed by circulating tumor DNA. Sci. Transl. Med. 2016, 8, 364ra155. [Google Scholar] [CrossRef] [PubMed]
- Spina, V.; Bruscaggin, A.; Cuccaro, A.; Martini, M.; Di Trani, M.; Forestieri, G.; Manzoni, M.; Condoluci, A.; Arribas, A.; Terzi-Di-Bergamo, L.; et al. Circulating tumor DNA reveals genetics, clonal evolution, and residual disease in classical hodgkin lymphoma. Blood 2018, 131, 2413–2425. [Google Scholar] [CrossRef] [PubMed]
- Savvidou, I.; Khong, T.; Cuddihy, A.; McLean, C.; Horrigan, S.; Spencer, A. Beta-catenin inhibitor bc2059 is efficacious as monotherapy or in combination with proteasome inhibitor bortezomib in multiple myeloma. Mol. Cancer Ther. 2017, 16, 1765–1778. [Google Scholar] [CrossRef] [PubMed]


| 315 | 435 | 485 | 504 |
|---|---|---|---|
| Protein Ubiquitination Pathway | Glutamate Receptor Signalling | Protein Ubiquitination Pathway | Protein Kinase A Signalling |
| Aldosterone Signalling in Epithelial Cells | Protein Ubiquitination Pathway | Epithelial Adherens Junction Signalling | Protein Ubiquitination Pathway |
| Unfolded protein response | Estrogen Receptor Signalling | Th1 and Th2 Activation Pathway | Huntington’s Disease Signalling |
| Huntington’s Disease Signalling | Interferon Signalling | Germ Cell-Sertoli Cell Junction Signalling | nNOS Signalling in Neurons |
| Role of Macrophages, Fibroblasts and Endothelial Cells in Rheumatoid Arthritis | Corticotropin Releasing Hormone Signalling | Th1 Pathway | Wnt/β-catenin Signalling |
© 2018 by the authors. Licensee MDPI, Basel, Switzerland. This article is an open access article distributed under the terms and conditions of the Creative Commons Attribution (CC BY) license (http://creativecommons.org/licenses/by/4.0/).
Share and Cite
Mithraprabhu, S.; Sirdesai, S.; Chen, M.; Khong, T.; Spencer, A. Circulating Tumour DNA Analysis for Tumour Genome Characterisation and Monitoring Disease Burden in Extramedullary Multiple Myeloma. Int. J. Mol. Sci. 2018, 19, 1858. https://doi.org/10.3390/ijms19071858
Mithraprabhu S, Sirdesai S, Chen M, Khong T, Spencer A. Circulating Tumour DNA Analysis for Tumour Genome Characterisation and Monitoring Disease Burden in Extramedullary Multiple Myeloma. International Journal of Molecular Sciences. 2018; 19(7):1858. https://doi.org/10.3390/ijms19071858
Chicago/Turabian StyleMithraprabhu, Sridurga, Shreerang Sirdesai, Maoshan Chen, Tiffany Khong, and Andrew Spencer. 2018. "Circulating Tumour DNA Analysis for Tumour Genome Characterisation and Monitoring Disease Burden in Extramedullary Multiple Myeloma" International Journal of Molecular Sciences 19, no. 7: 1858. https://doi.org/10.3390/ijms19071858