Using Spectral Representation to Classify Proteins’ Conformational States


1
Department of Physics, Faculty of Science, Ferdowsi University of Mashhad, Mashhad 9177948974, Iran
2
Department of Oncology, University of Alberta, Edmonton, AB T6G 1Z2, Canada
3
Department of Physics, University of Alberta, Edmonton, AB T6G 2E1, Canada
4
Department of Mechanical and Aerospace Engineering, Politecnico di Torino, 10129 Torino, Italy
*
Author to whom correspondence should be addressed.
Int. J. Mol. Sci. 2018, 19(7), 2089; https://doi.org/10.3390/ijms19072089
Submission received: 7 June 2018
/
Revised: 27 June 2018
/
Accepted: 28 June 2018
/
Published: 18 July 2018
(This article belongs to the Special Issue Drug-Protein Interactions and Mechanisms of Action by Structural Modifications Driving Protein Function)
Abstract
:Numerous proteins are molecular targets for drug action and hence are important in drug discovery. Structure-based computational drug discovery relies on detailed information regarding protein conformations for subsequent drug screening in silico. There are two key issues in analyzing protein conformations in virtual screening. The first considers the protein’s conformational change in response to physical and chemical conditions. The second is the protein’s atomic resolution reconstruction from X-ray crystallography or nuclear magnetic resonance (NMR) data. In this latter problem, information is needed regarding the sample’s position relative to the source of X-rays. Here, we introduce a new measure for classifying protein conformational states using spectral representation and Wigner’s D-functions. Predictions based on the new measure are in good agreement with conformational states of proteins. These results could also be applied to improve conformational alignment of the snapshots given by protein crystallography.
1. Introduction
Proteins are flexible biomolecules whose conformations change in response to physical and chemical conditions. However, protein functions depend on their specific conformation. A protein’s 3D conformation is determined by the primary sequence of amino acids [1]. Knowing the relation between protein fluctuational motion and its sequence can be used to design de novo dynamics of proteins and provide putative conformations for drug targets by accessing information about transition states [1]. Predicting protein motion is a computational challenge. Some conformational search algorithms use a coarse graining representation of the protein molecule [2,3,4] and employ search methods such as elastic network modeling [5,6,7,8,9,10], morphing [11,12], or Normal Mode Analysis [13,14]. Other methods apply motion planning algorithms used in robotics to find a pathway to protein conformations [15,16,17]. Other methods combine coarse graining and motion planning [18]. Finding a quantitative measure that can be reliably used to classify conformational states of a protein is important for both virtual screening in general and structure-based drug design (SBDD) in particular [19]. The most frequently used experimental method to determine protein conformation is X-ray crystallography [20], which is only applicable when the given protein can be crystallized. The pattern of diffraction of an X-ray is used to determine the protein’s atomistic structure. One of the important factors in protein-protein and protein-ligand binding is geometry matching.
In this paper, we introduce a simple mathematical measure to classify protein conformations, which is defined in reciprocal space and uses the corresponding structure factors of the given protein. Reciprocal space has advantages over real space since we can compare two proteins with different numbers of atoms using the same dimensions in reciprocal space, i.e., reciprocal space is independent of protein sizes [21]. This can allow for the classification of different conformations from the data obtained, e.g., by X-ray free electron laser (XFEL), of a protein with unknown structure before reconstructing it. One of the issues with XFEL is known as the diffract-and-destroy problem [22,23,24] in which X-rays irradiate during a few femtoseconds a sample before it is destroyed, so that different samples are needed to have a sufficient number of snapshots to reconstruct a protein as a single nanoparticle. On the other hand, each protein sample could have different orientations, conformations, or configurations in other samples. Thus, information about the conformation of snapshots is necessary for a proper reconstruction of the protein data from its images [25].
2. Results and Discussion
To prove the reliability of our method based on MED we examine below three different synthetic datasets. The first dataset is a simple shape-simulated dataset of non-structured 12-mer peptides, the second is a simulated protein dataset and the third dataset is a simulated X-ray diffraction dataset of ADK.
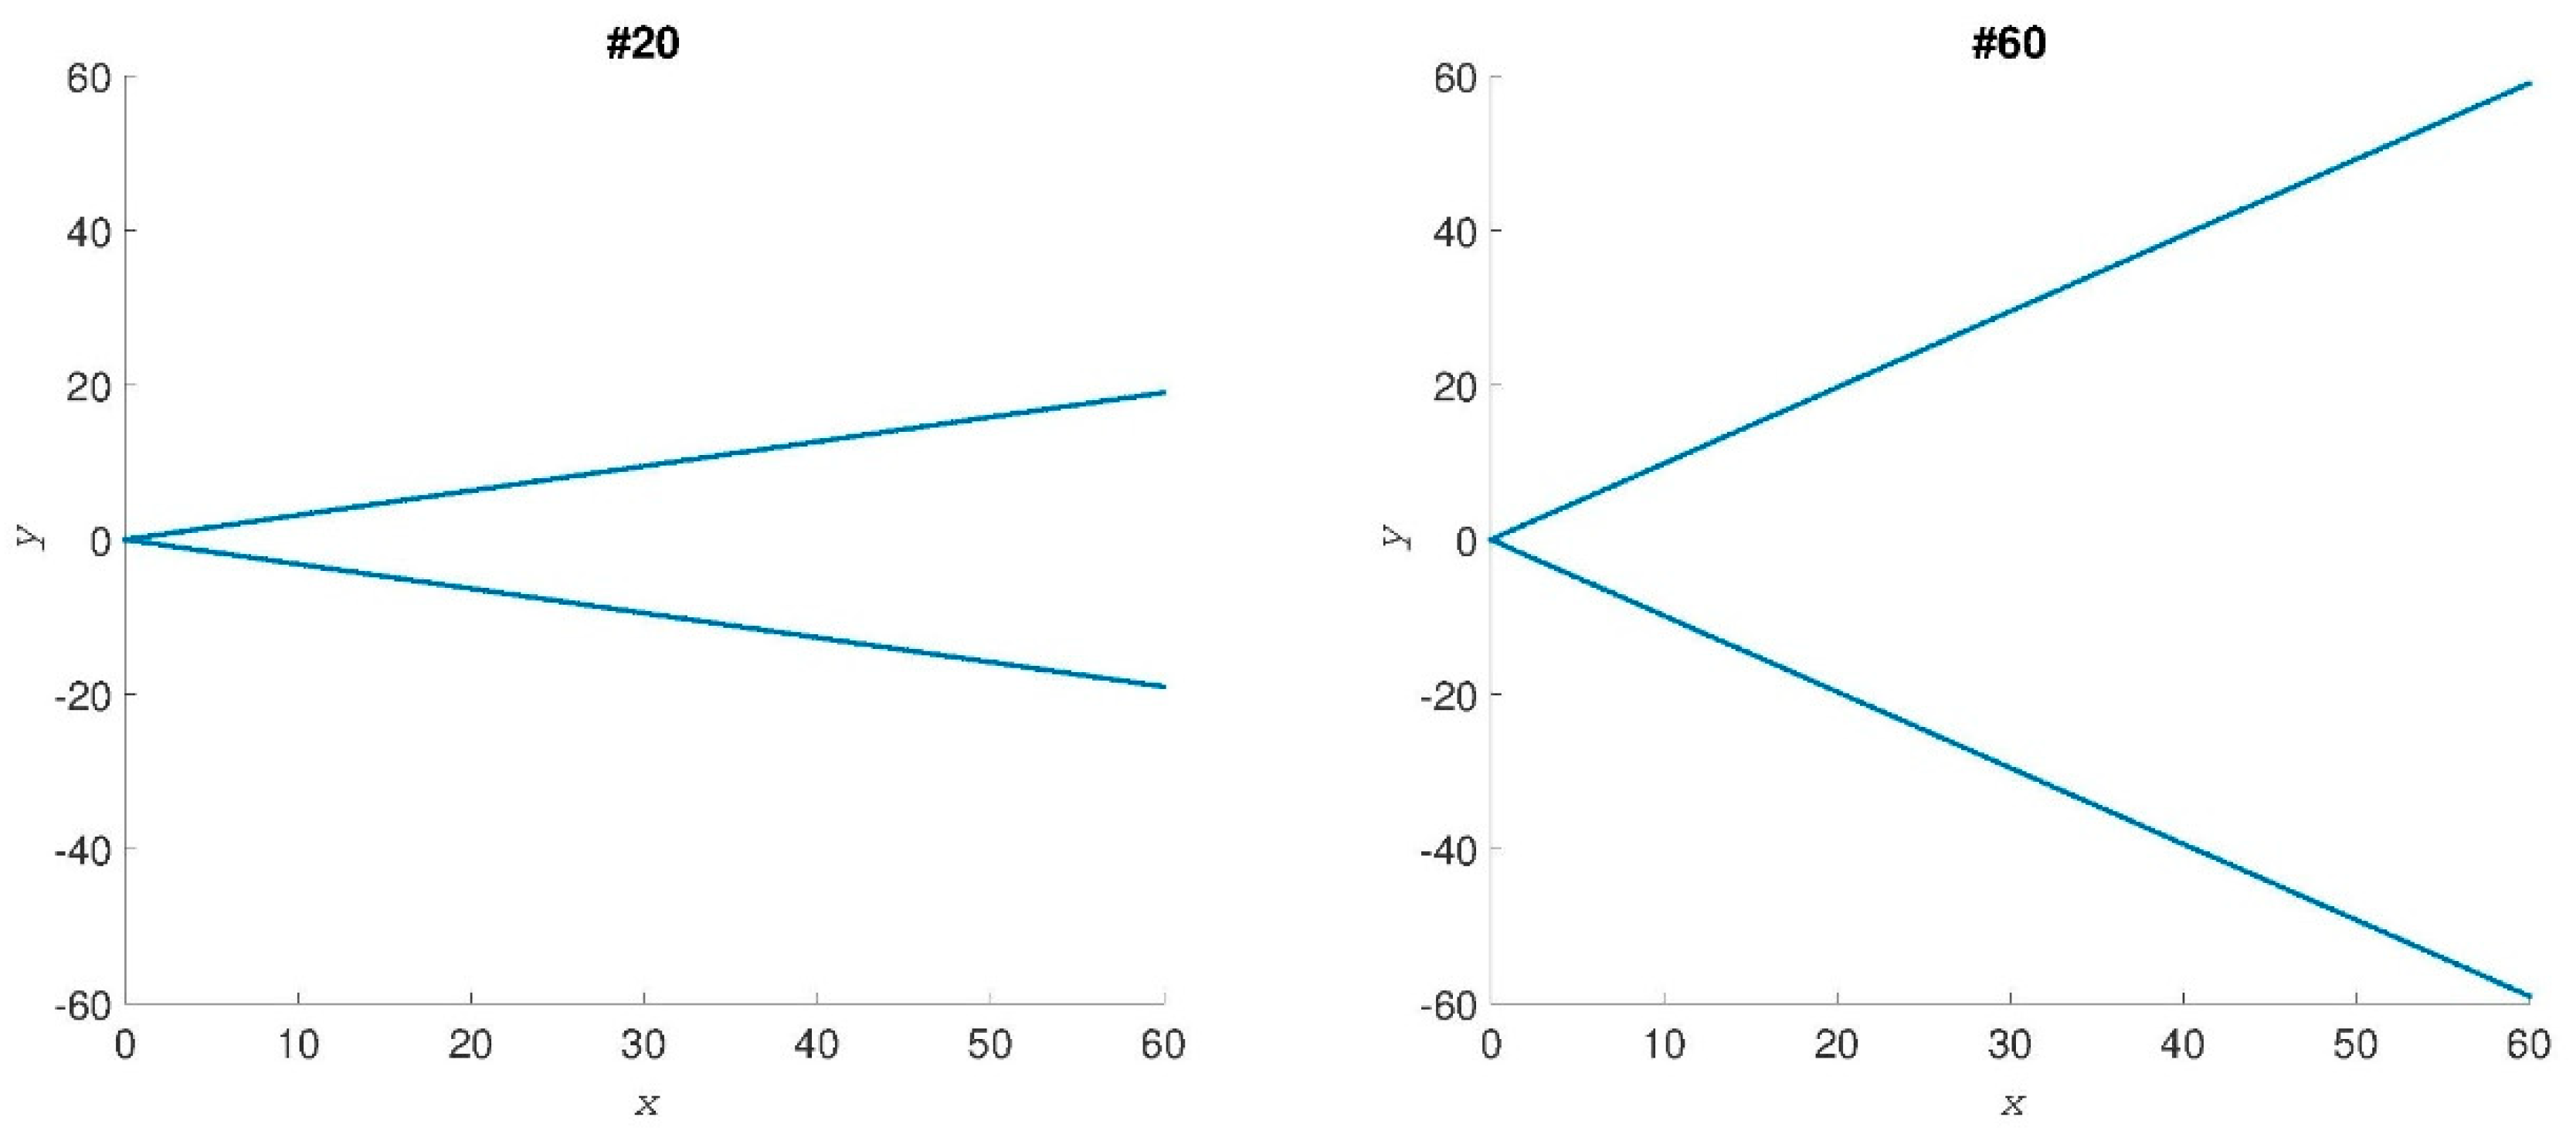
Simple shape dataset. To show the robustness and reliability of MED we first use a simulated conformational dataset for shapes ranging from an open to a closed conformation, and two examples out of 61 cases analyzed are shown in Figure 1. Formula (1) gives the set of for each of these conformations. We can compute MED by selecting the largest eigenvalue of the “” matrix from Formula (3) for each shape. The MED values are shown in Figure 2, where the abscissa gives the number of shapes. Shape #1 is totally closed and shape #61 is the most opened shape. MED values decrease when the conformations of shapes vary from close to open.
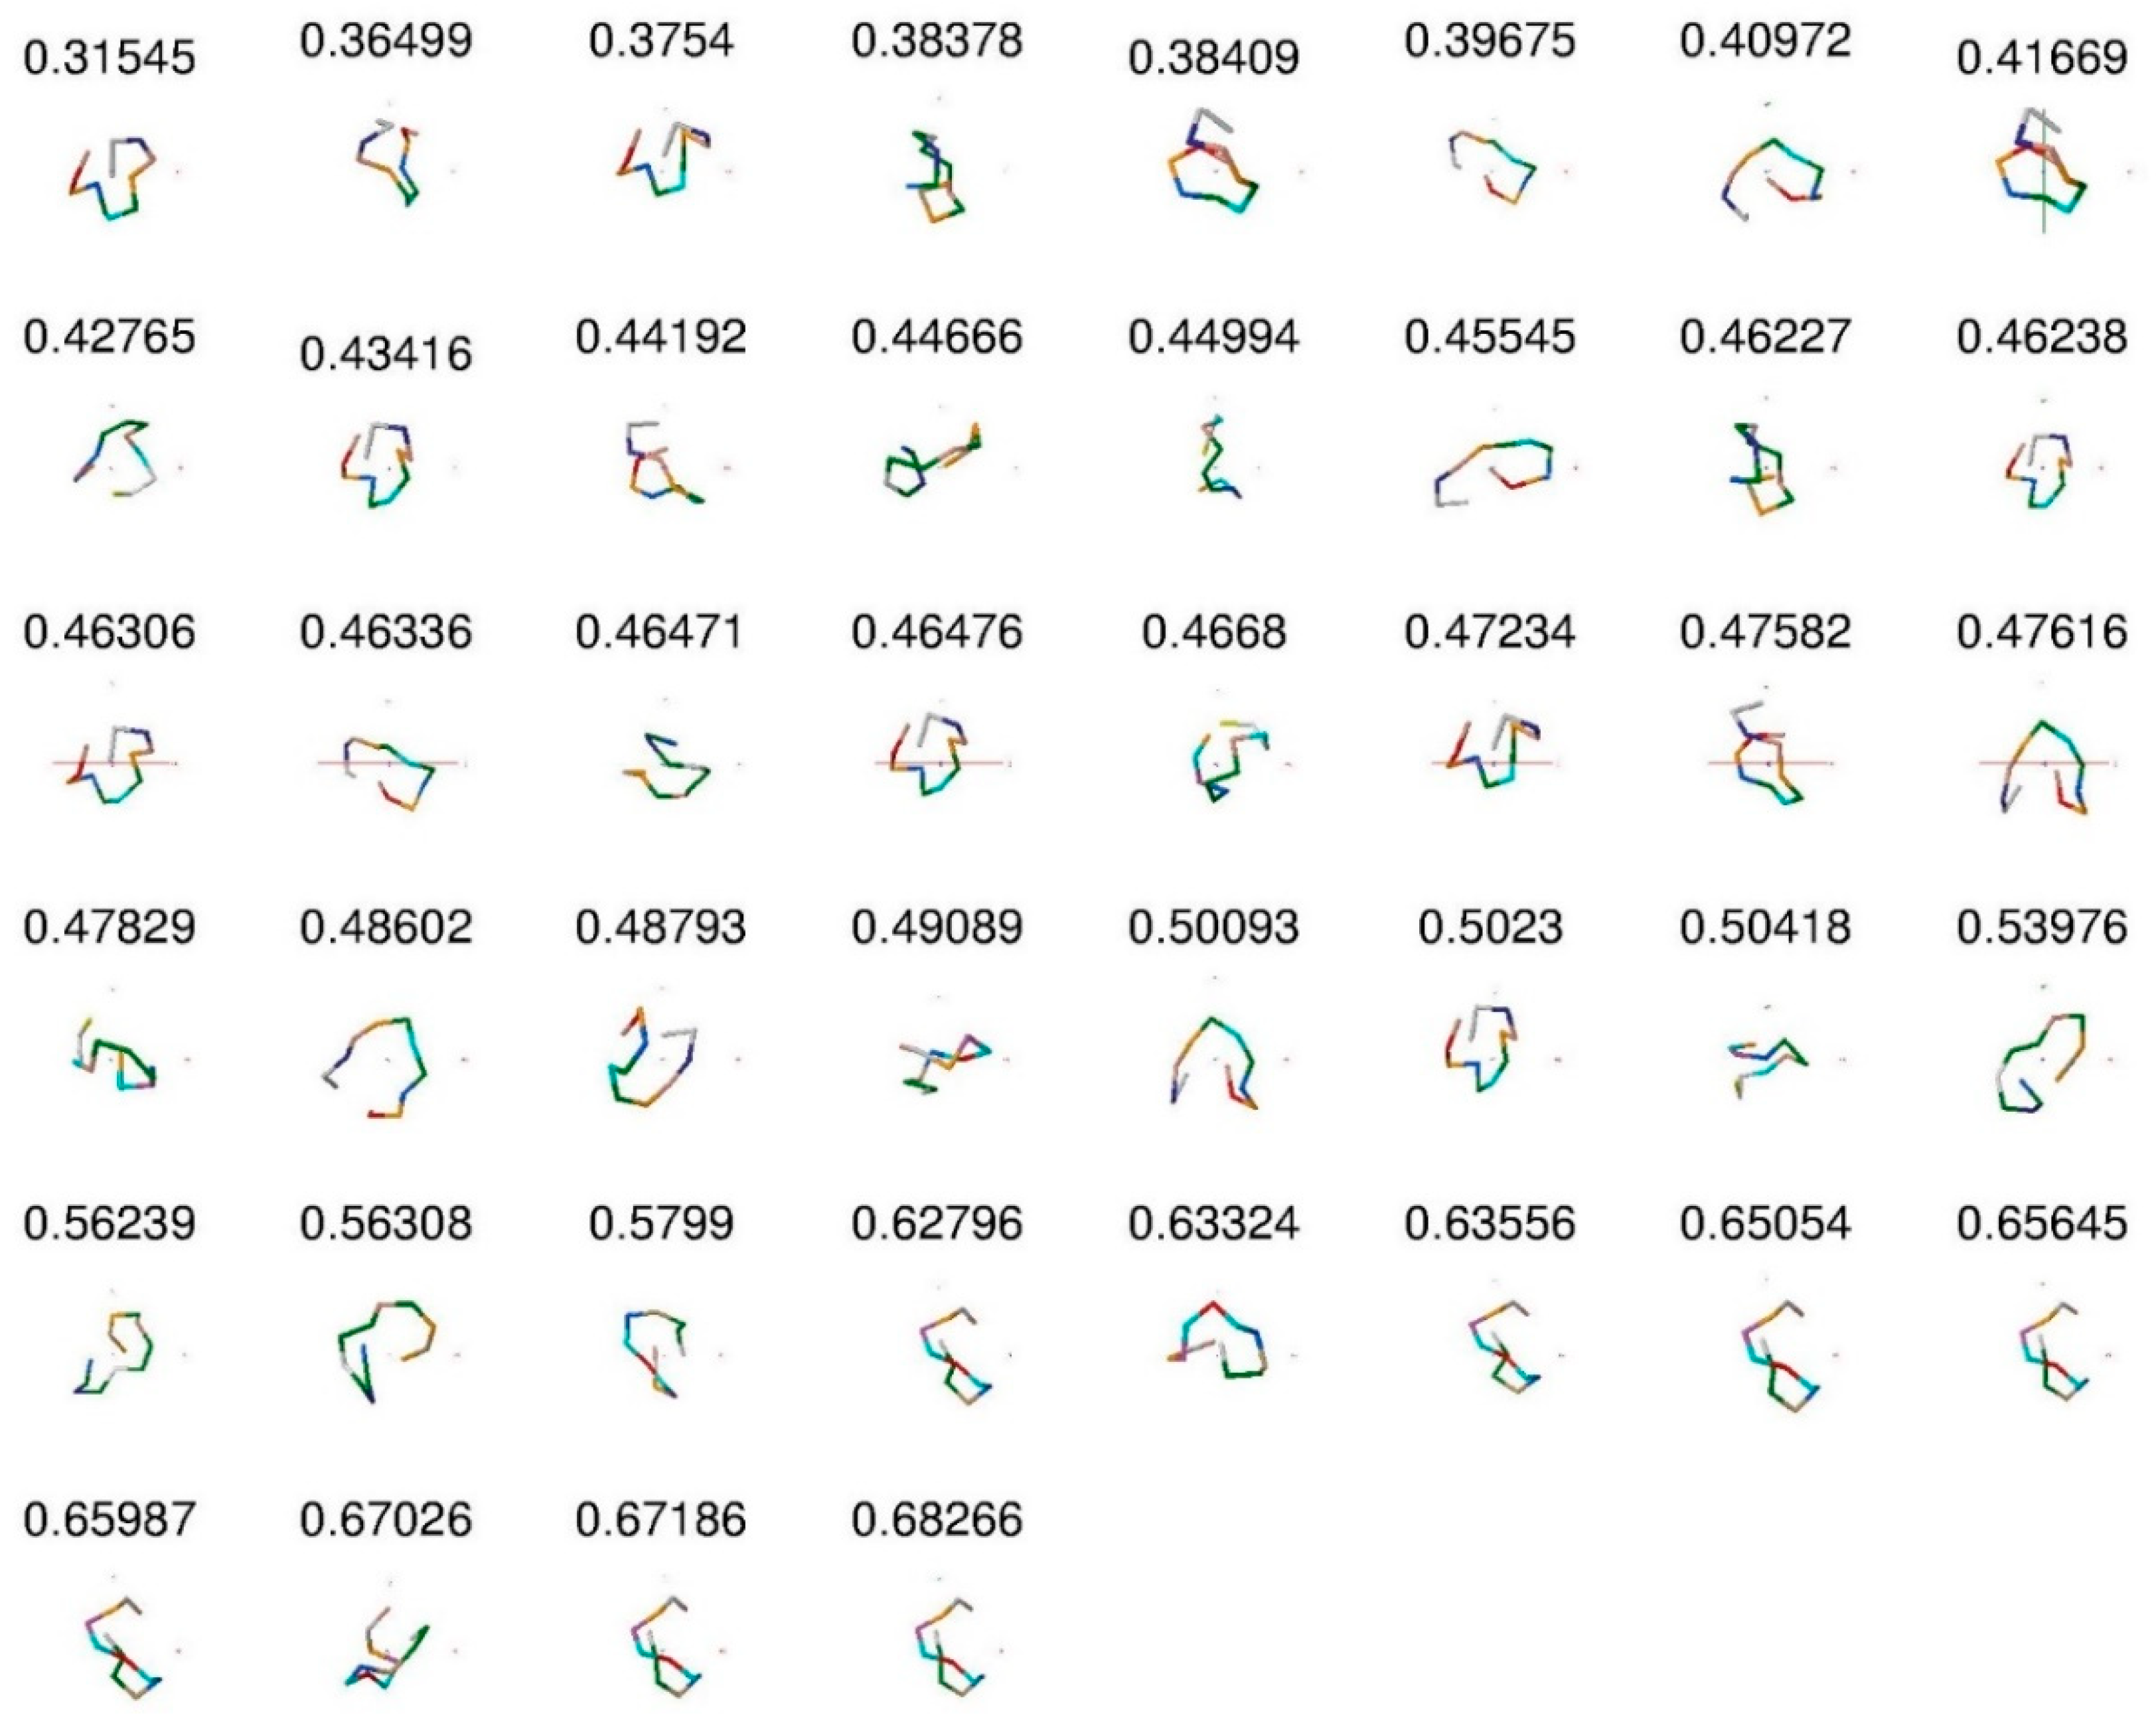
Protein dataset. The MED values obtained confirm the prediction regarding the corresponding conformations. We now perform the second test by examining conformations between quasi-real data to the protein structures, and use the data generated by MOE software of Chemical Computing Group Inc. (available online: http://www.chemcomp.com/). We have created a library of 4-mer peptides for surfaces with different characterization, which is the starting point for finding longer (more closed) peptides, which can recognize and bind to a given surface with high affinity and specificity. These data have been obtained by molecular dynamics (MD) simulations for 4-mer peptide sequences. We have first computed structure factors and then produced the distance matrix in order to find the MED for all 44 conformations of non-structured 12-mer peptides (called s1, s14, s16 and s31). For example, we see that the MED for s14-3 is and it is closed, while for s1-4 peptide MED is and it is open. In Table 1, we present the MED values for all 44 conformations of non-structured 12-mer peptides (which are called s1, s14, s16, and s31).
Figure 3 shows the 44-peptide backbone images with their MED values sorted from small to large values. The larger MED corresponds to the more closed (longer) peptides. This figure is consistent with closed and open conformation assignments.
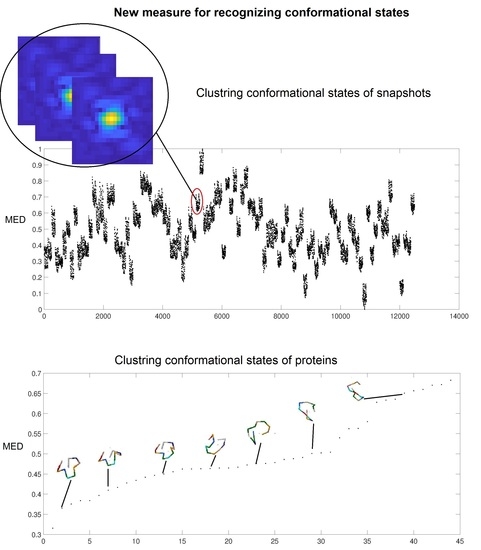
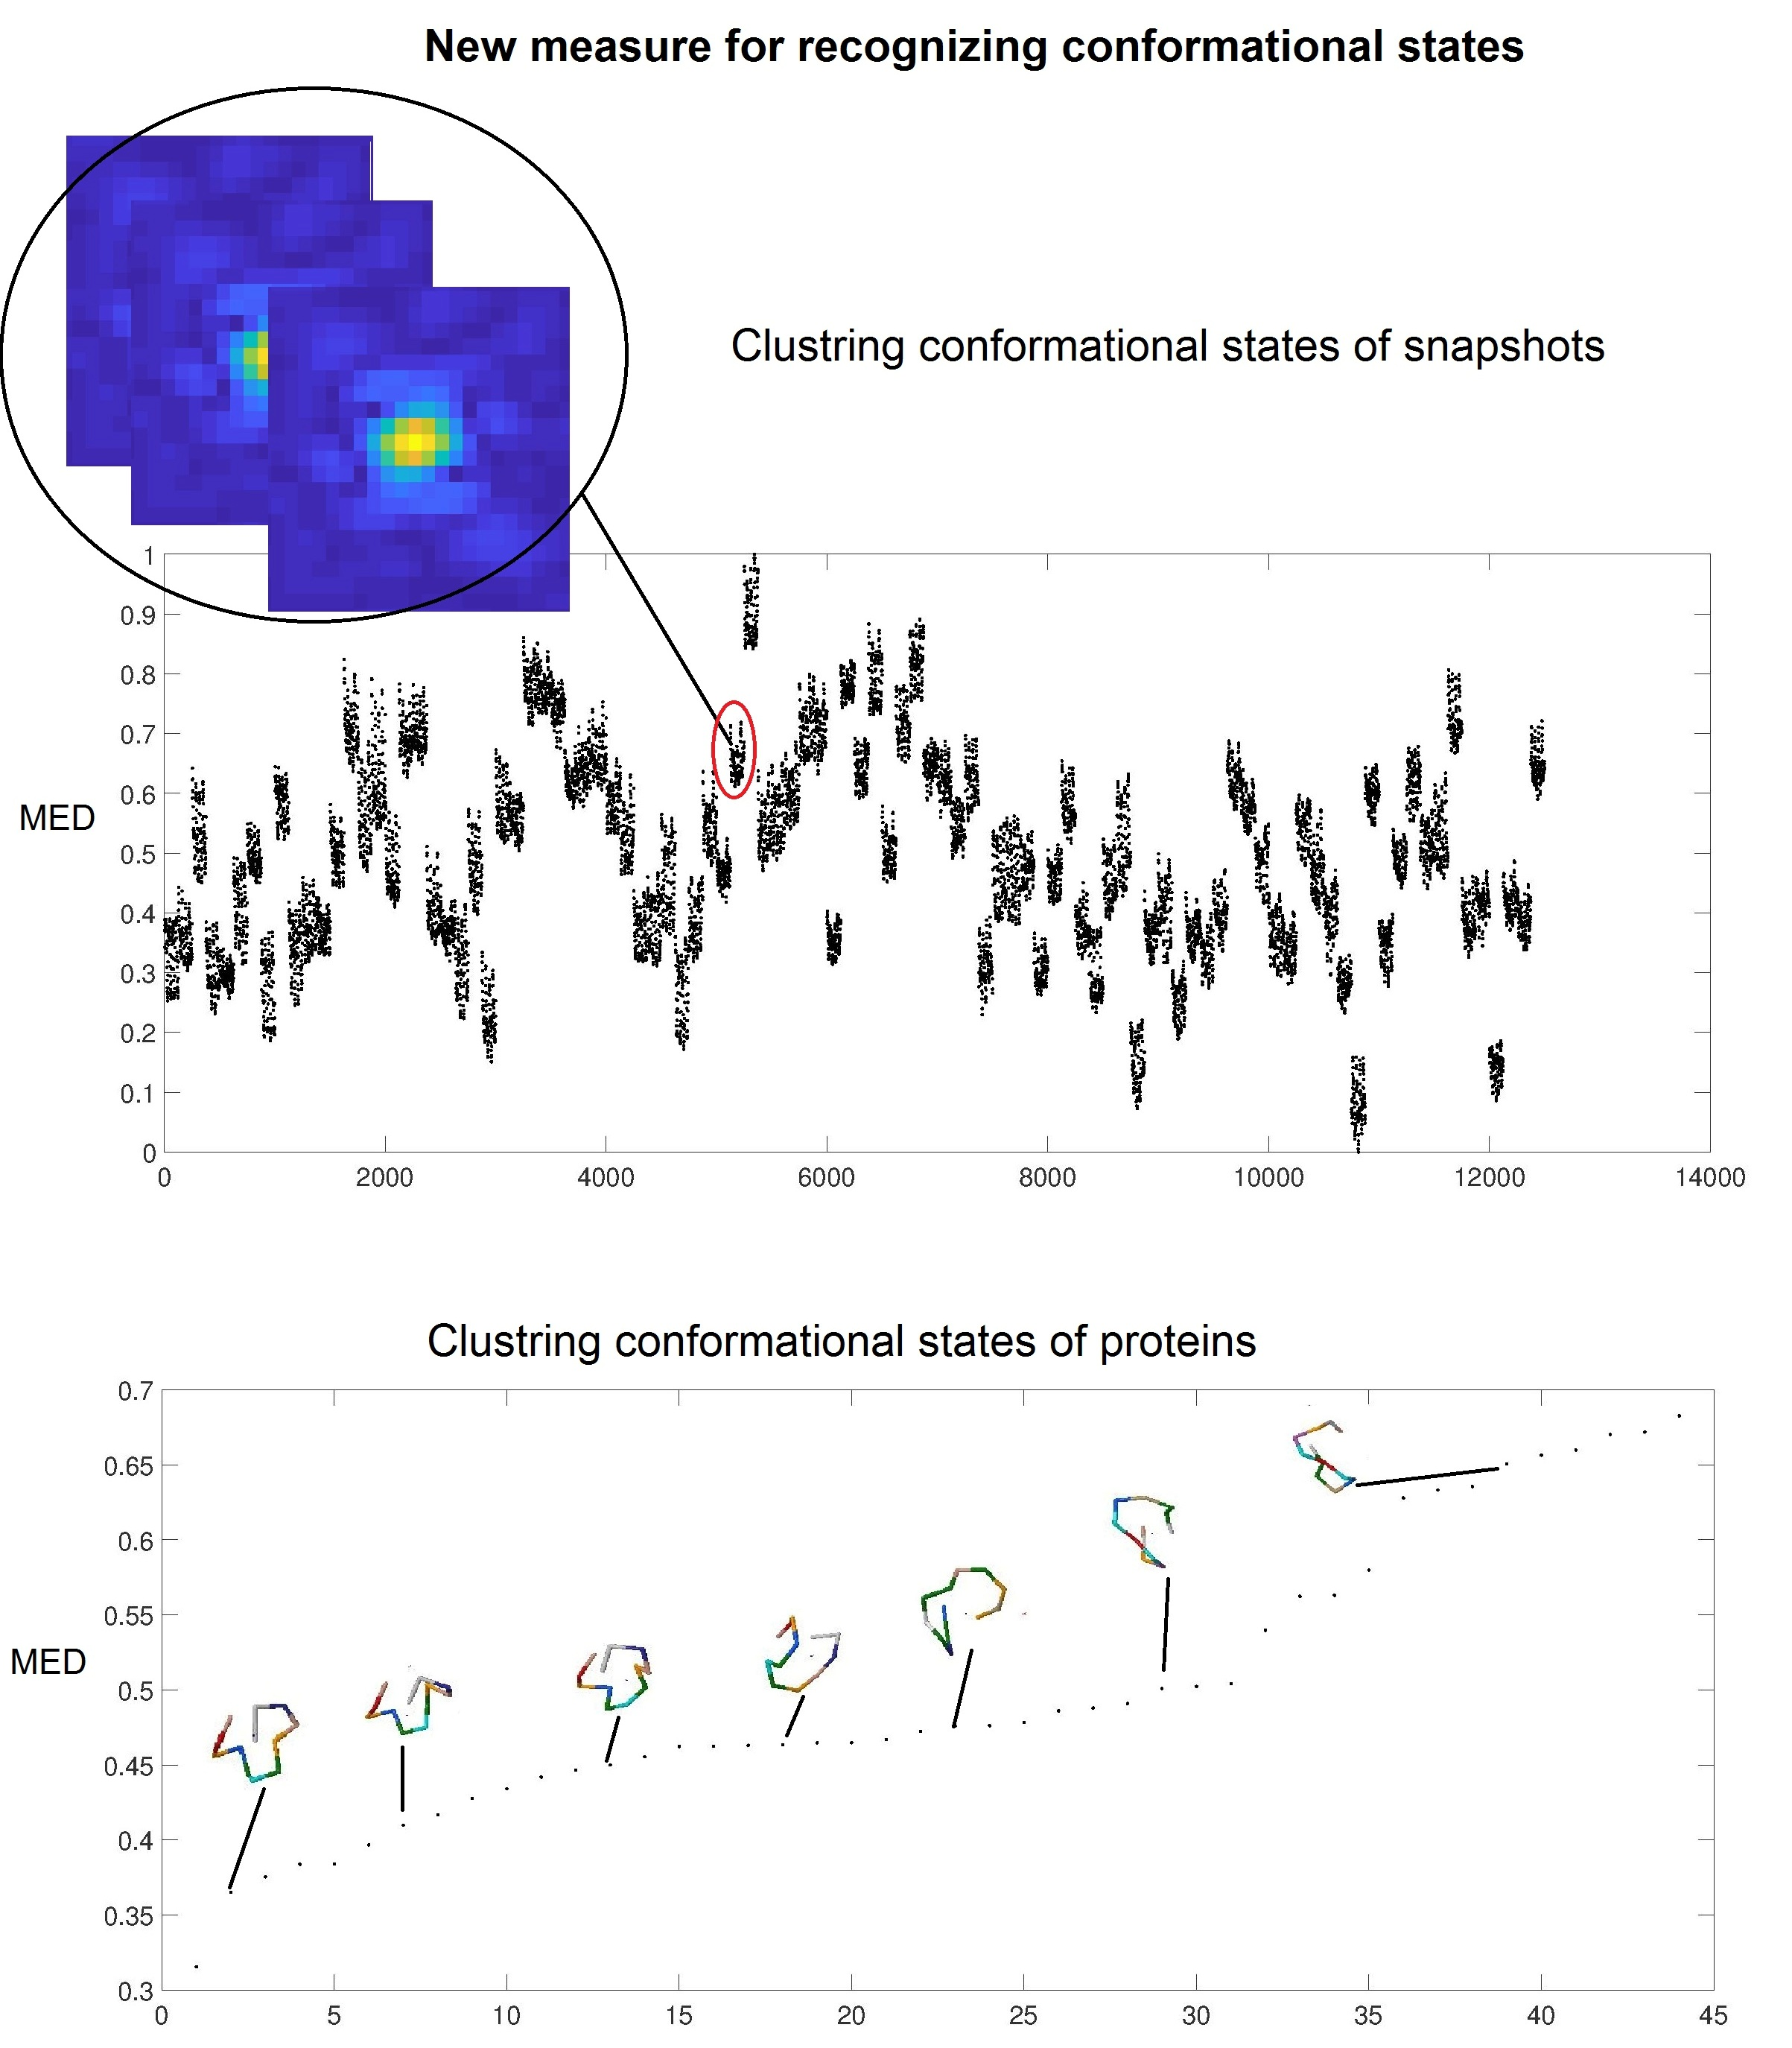
Diffraction snapshots dataset. One of the main issues in the reconstruction of the biological systems from X-ray scattering snapshots is that some information, which is known in crystallography, is unknown to the biological system, e.g., the structure’s orientation. Conversely, information exists in the biological system’s reconstruction, e.g., conformation, which does not exist in crystallography, since only one sample may be used in crystallographic measurements while a biological system such a protein may involve many samples in a statistical ensemble. Hence, a large number of XFEL snapshots are combined with different conformations and unknown orientations. Thus, before reconstruction, we should cluster these data and then use the reconstruction methods that use X-ray diffraction patterns such as crystallography.
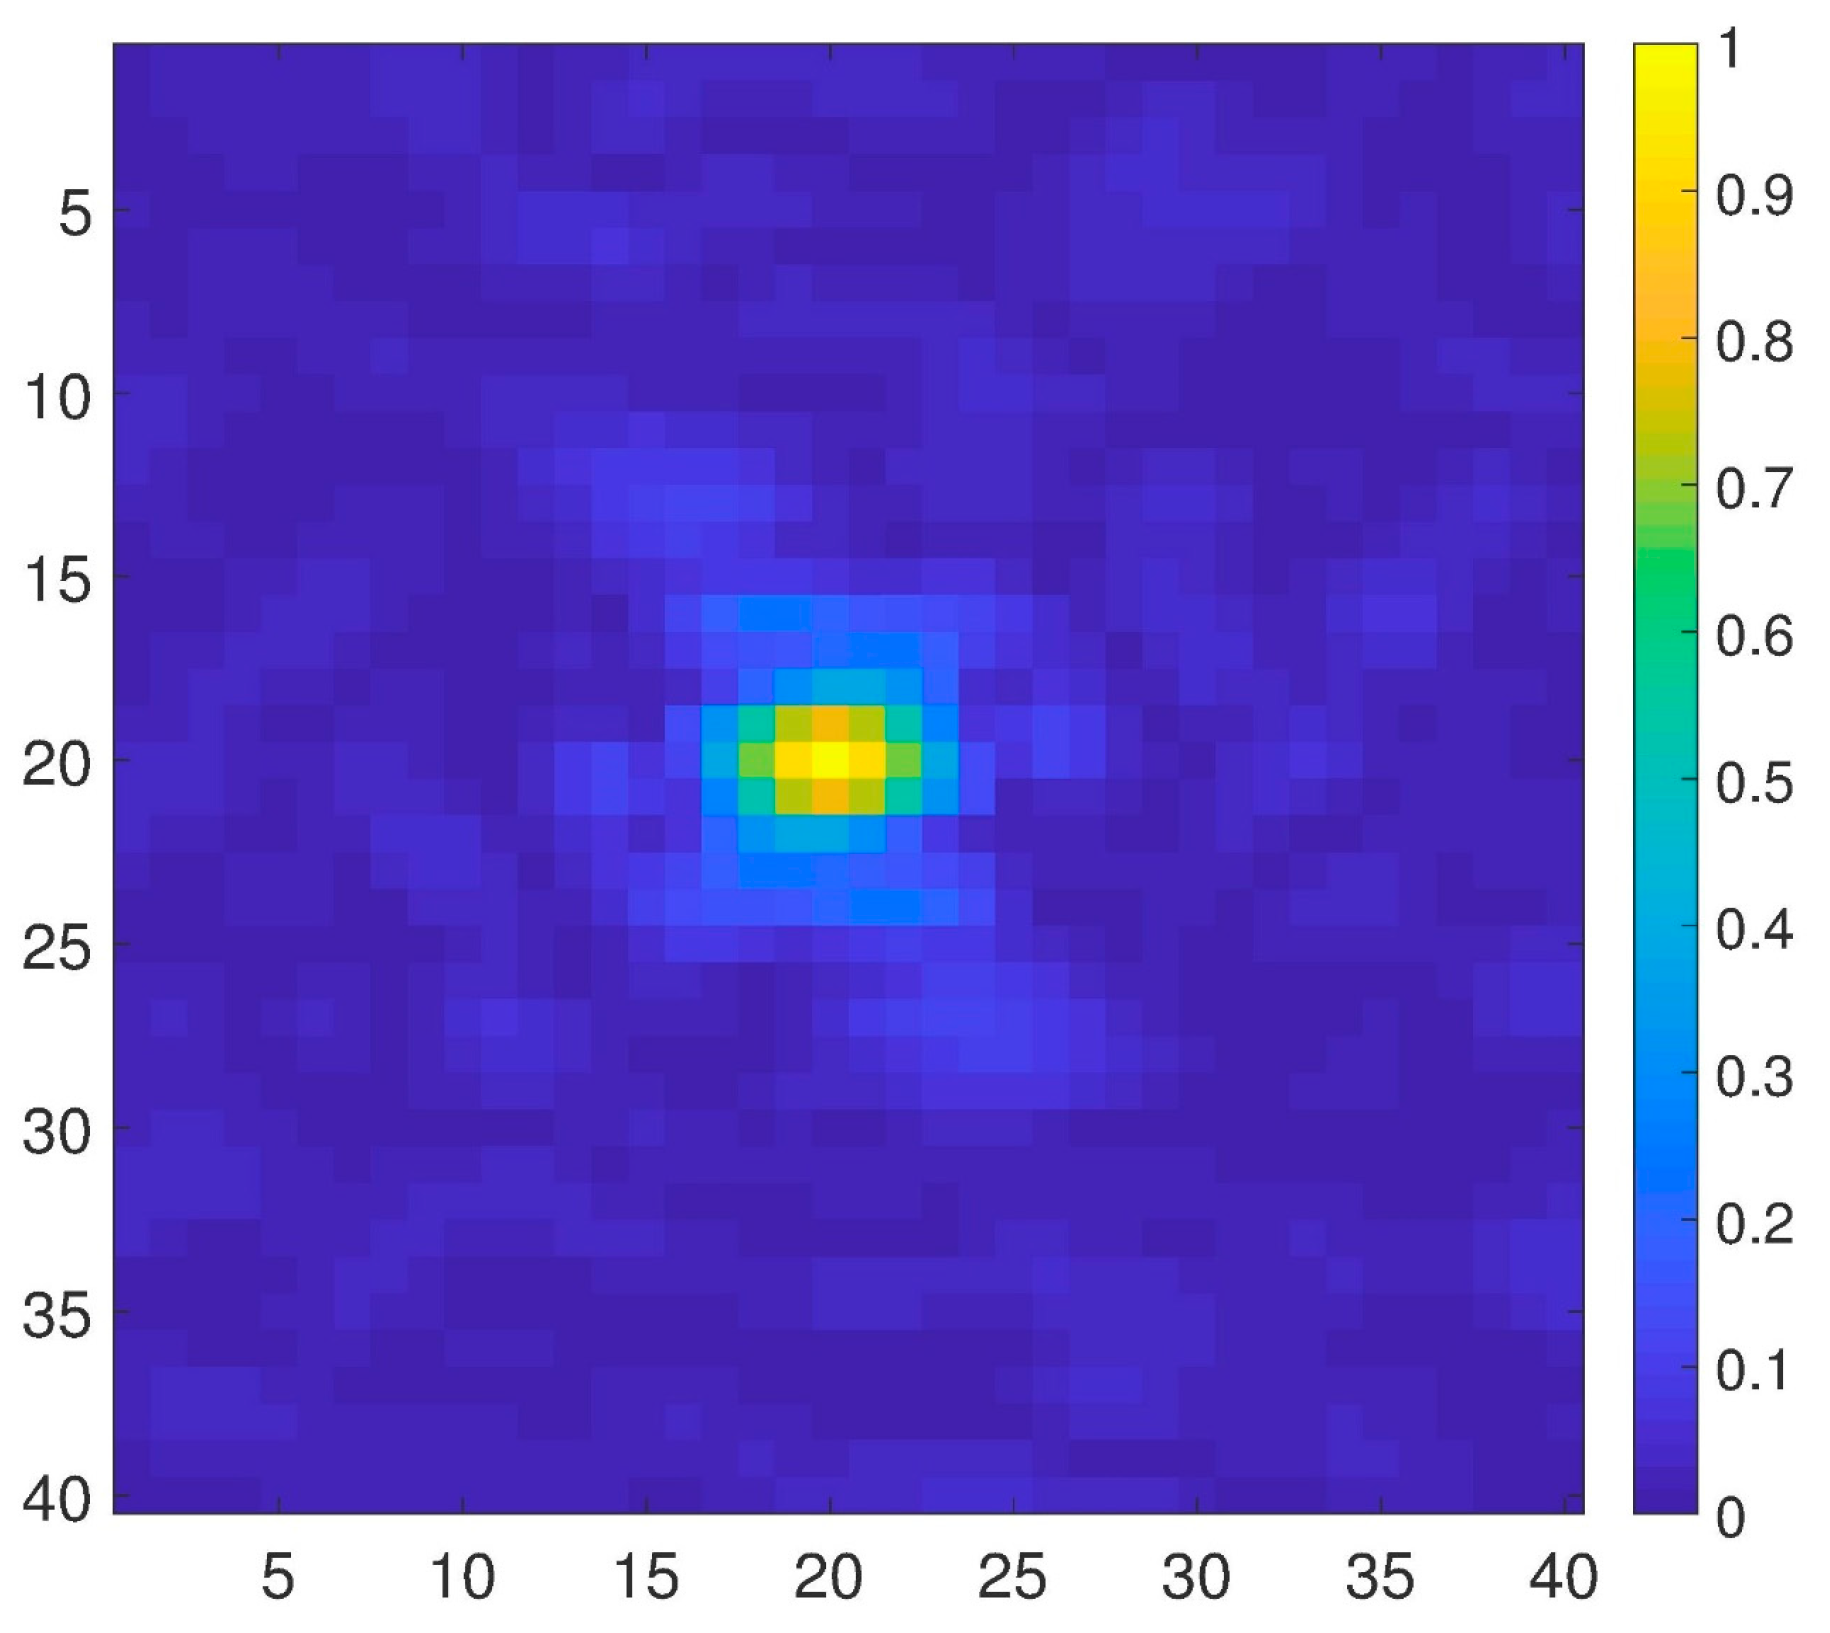
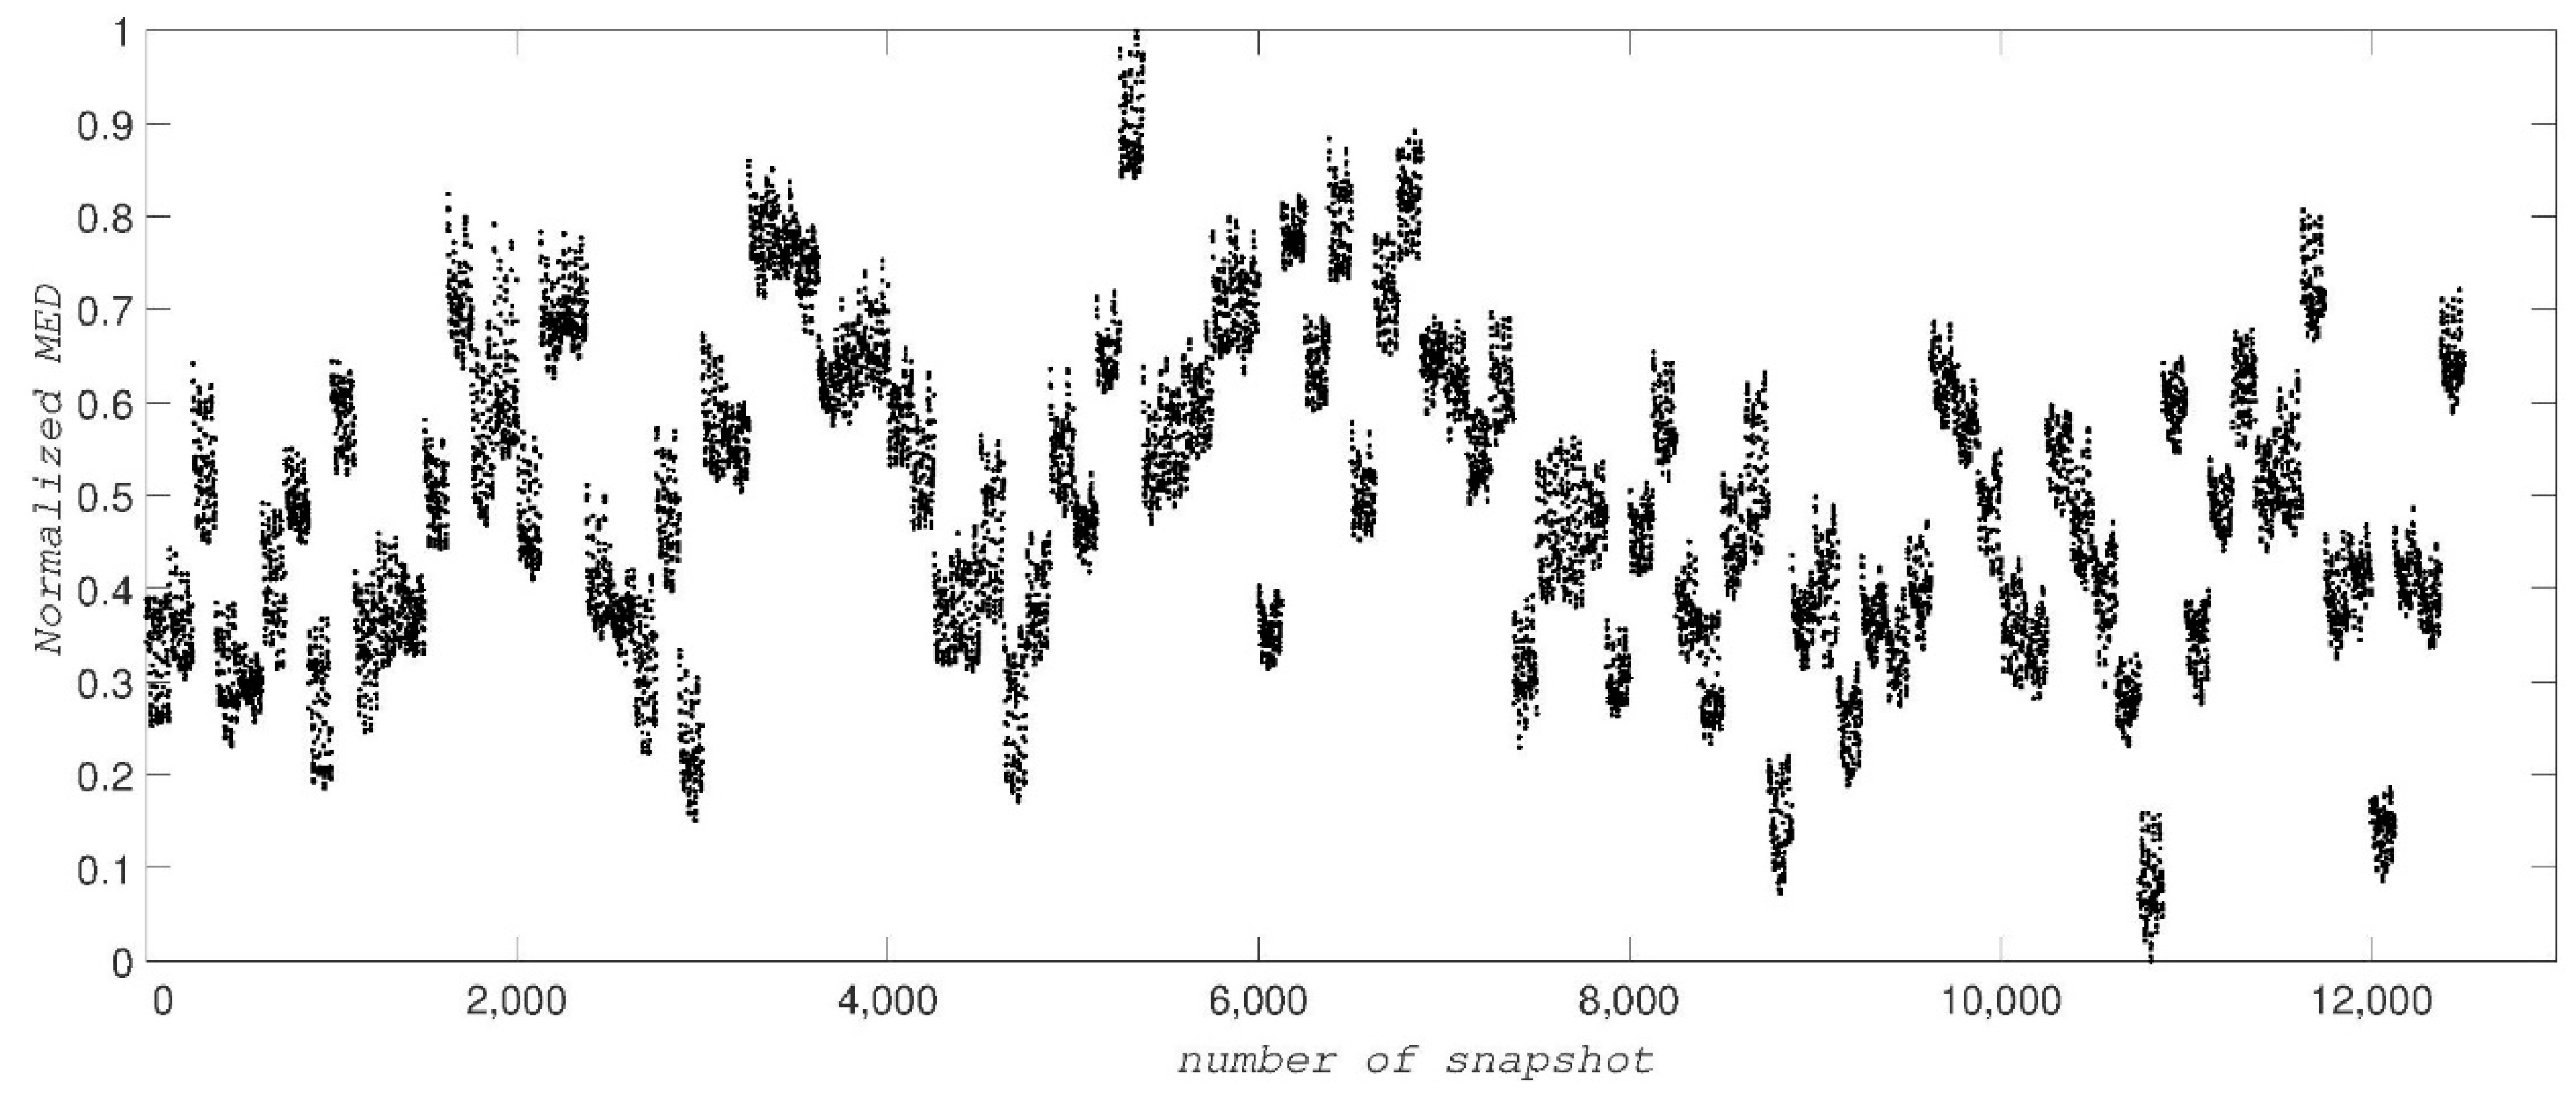
In the third test of our method, we use the dataset simulated by MD of the unfolding of ADK [26], which contains 12,500 diffraction snapshots simulated from 100 conformations, with each conformation assuming 125 orientations about one axis. The coordinates of ADK [27] from E. coli in the open state (Protein Data Bank entry: 4AKE) were placed in a spherical droplet of water and simulated using NAMD software [27]. Figure 4 shows a typical diffraction snapshot of this dataset. We should first complexify this dataset by taking successively the inverse Fourier and then its Fourier transform for each snapshot. Having the complex form of a snapshot, we then obtain a distance matrix and its largest eigenvalue, MED. Figure 5 illustrates the MED for these 12,500 snapshots. These values are separated among a hundred islands (conformations) so that each island with 125 snapshots represents a conformation.
To perform the required computations, one needs several hundred megabytes of memory and a computation time of about 950 s for all of 12,500 snapshots of this dataset by using a CPU-i3 with 4GB RAM. The three tests show that MED is a reliable and low-computational cost measure for the prediction of conformational states of proteins. It is especially useful to cluster these patterns before having the protein’s structure obtained from X-ray diffraction in the dataset.
In the time-resolved X-ray crystallography methods, for structure reconstruction we need to have the crystal’s orientation in crystallographic measurements. In the corresponding biological assays, due to significant effects of radiation damage one needs to use replicate samples [28]. Hence, we need more information on the protein system, such as its conformational states. Hence, we must classify snapshots in conformational states, orientations, etc., in order to solve the problem. There exist some methods to modify diffraction experiments such as probe-pump-probe, etc. [29,30,31,32]. MED can classify conformational states using snapshots obtained from X-ray diffraction from biological samples and it does not require the numbers of atoms to be the same in all cases.
Working in reciprocal space with structure factors has substantial advantages such as dependence on the topology and geometry of proteins and independence of the protein’s size [21]. Using the spectral representation for classifying protein shapes has led to the introduction of a new measure, MED. Here, MED has been used on three different sets. MED-based prediction has been shown in good agreement with simulated data. MED can be used to study protein dynamics as a spectral representation of time evaluation, and protein conformational state classification in the drug discovery, reconstruction of protein structure from X-ray data, and also biological applications.
3. Method
The weighted similarity value (WSV) is an alternative to root-mean-squared deviation (RMSD) that allows a similarity comparison between two proteins [21,33]. WSV has been defined as an illustration of the Wigner-D function [34] by expanding the protein’s shape functions. Any compact supported function can be expanded in terms of Wigner-D functions, , such as the protein’s shape function, , with and as the Euler angles. Here, is defined as the molar mass of an atom located on the coordinate set and if there is no atom there, it is assumed to be zero [33]. The expansion coefficients, s, are unique for a given function, , and are obtained by:
It has been shown [35,36] that correspond to elements of the 3D Fourier transform of . In crystallography, the coefficient of the Fourier transform of a crystal shape function is called a structure factor [37], hence represent the protein structure factors. Note that two shapes of different sizes in real space have the same dimensions in reciprocal space in spite of having different numbers of atoms [21].
In this paper, we use another advantage of working in reciprocal space, i.e., replacing a time series by spectral representation in reciprocal space as a set of eigenvectors. This is a result of the Fourier transform of the time derivative of a function, which is equal to the spectral of the Fourier transform of the function:
where the hat -symbol over a function indicates a Fourier transform. The set: represents a spectral representation corresponding to the time series set . In fact, one set of temporally connected conformations would give a single set of eigenvectors, i.e., one spectral representation. Therefore, to observe change in conformation, such as during an unfolding of a protein, one can divide the total event into shorter time-spans, each representing a time-average conformation.
s belong to the complex space and can be embedded in the -dimensional Euclidean space as the following: = , where is the number of s defined by choosing , i.e., maximum in . Note that each conformation has one corresponding structure factor. Then, we define distance matrices, , as the distance matrix between elements of structure factor related to a conformational state. By obtaining the set eigenvalues of matrix, i.e., , we introduce a new measure to compare the different conformations of a given protein by computing the largest eigenvalue:
Here is the maximum eigenvalues of the distance matrix related to the ith protein’s conformational state. If is larger than , it signifies a more closed conformation of the protein, since length in real space is proportional to in reciprocal space, where as a vector (column matrix) with an -element for -conformational states and we call it the “maximum eigenvalue of distance matrix” (MED). The MED value depends on the protein’s structure and it is unbounded. Thus, if two protein structures are not temporally connected, the differences between the corresponding MED-values are not significant. To compute MED for X-ray scattering from a single nanoparticle we find the distance matrix by complexifying snapshots, which implies taking its inverse Fourier and then Fourier transforming it.
The maximum eigenvalue plays an important role in data analysis [38,39,40,41], because the eigenvectors define a basis for a vector and the corresponding eigenvalues are vector projection magnitudes in this basis set. Thus, it implies the most effective base (eigenvector). In the dimensional reduction process the largest eigenvalue indicates the most effective change occurring in its corresponding eigenvector. This change could represent conformation, rotation, translation, dilation, etc. [26,42,43,44,45]. For protein shapes, conformation is the most effective parameter in the snapshots, which is obtained by X-ray diffraction, because a diffraction pattern depends on the distance between two atoms, thus, the largest eigenvalue should best describe this change. Here, we use the reciprocal distance matrix between two different conformations and find the largest eigenvalues, which describe the important conformational change between the two shapes.
Author Contributions
Conceptualization, S.M.S.F.; Formal analysis, S.M.S.F.; Methodology, S.M.S.F.; Software, S.M.S.F.; Visualization, J.A.T.; Writing—original draft, S.M.S.F.; Writing—review & editing, S.M.S.F. and J.A.T.
Funding
This research received no external funding.
Acknowledgments
SMSF acknowledges the help of Niloofar Nayebi (University of Alberta) for generating (s1, s14, s16 and s31) data sets and Professor Peter Schwander (University of Wisconsin-Milwaukee) in providing the ADK dataset.
Conflicts of Interest
The authors declare no conflict of interest.
Abbreviations
| MED | Maximum Eigenvalue Of Distance Matrix |
References
- Raveh, B.; Enosh, A.; Schueler-Furman, O.; Halperin, D. Rapid Sampling of Molecular Motions with Prior Information Constraints. PLoS Comput. Biol. 2009, 5, e1000295. [Google Scholar] [CrossRef] [PubMed]
- Head-Gordon, T.; Brown, S. Minimalist models for protein folding and design. Curr. Opin. Struct. Biol. 2003, 13, 160–167. [Google Scholar] [CrossRef]
- Whitford, P.C.; Miyashita, O.; Levy, Y.; Onucic, J.N. Conformational Transitions of Adenylate Kinase: Switching by Cracking. J. Mol. Biol. 2007, 366, 1661–1671. [Google Scholar] [CrossRef] [PubMed] [Green Version]
- Miyashita, O.; Wolynes, P.G.; Onucic, J.N. Simple Energy Landscape Model for the Kinetics of Functional Transitions in Proteins. J. Phys. Chem. B 2005, 109, 1959–1969. [Google Scholar] [CrossRef] [PubMed] [Green Version]
- Keskin, O.; Bahar, I.; Flatow, D.; Covell, D.; Jernigan, R. Molecular mechanisms of chaperonin GroEL-GroES function. Biochemistry 2002, 41, 491–501. [Google Scholar] [CrossRef] [PubMed]
- Temiz, N.; Meirovitch, E.; Bahar, I. Escherichia coli adenylate kinase dynamics: Comparison of elastic network model modes with mode-coupling 15NNMR relaxation data. Proteins 2004, 57, 468–480. [Google Scholar] [CrossRef] [PubMed]
- Wang, Y.; Rader, A.; Bahar, I.; Jernigan, R. Global ribosome motions revealed with elastic network model. J. Struct. Biol. 2004, 147, 302–314. [Google Scholar] [CrossRef] [PubMed]
- Thorpe, M. Comment on Elastic Network Models and Proteins. Phys. Biol. 2007, 4, 60–63. [Google Scholar] [CrossRef] [PubMed]
- Zheng, W.; Brooks, B. Identification of dynamical correlations within the myosin motor domain by the normal mode analysis of an elastic network model. J. Mol. Biol. 2005, 346, 745–759. [Google Scholar] [CrossRef] [PubMed]
- Gohlke, H.; Thorpe, M. A Natural Coarse Graining for Simulating Large Biomolecular Motion. Biophys. J. 2006, 91, 2115–2120. [Google Scholar] [CrossRef] [PubMed]
- Jónsson, H.; Mills, G.; Jacobsen, K.W. Nudged Elastic Band Method for Finding Minimum Energy Paths of Transitions. In Classical and Quantum Dynamics in Condensed Phase Simulations; Berne, B.J., Ciccoti, G., Coker, D.F., Eds.; World Scientific: Singapore, 1998; pp. 385–404. [Google Scholar]
- Weiss, D.; Levitt, M. Can morphing methods predict intermediate structures? J. Mol. Biol. 2009, 385, 665–674. [Google Scholar] [CrossRef] [PubMed]
- Schuyler, A.; Jernigan, R.; Qasba, P.; Ramakrishnan, B.; Chirikjian, G. Iterative cluster-NMA: A tool for generating conformational transitions in proteins. Proteins 2009, 74, 760–776. [Google Scholar] [CrossRef] [PubMed] [Green Version]
- Schroeder, G.; Brunger, A.T.; Levitt, M. Combining Efficient Conformational Sampling with a Deformable Elastic Network Model Facilitates Structure Refinement at Low Resolution. Structure 2007, 15, 1630–1641. [Google Scholar] [CrossRef] [PubMed]
- Choset, H.; Lynch, K.M.; Hutchinson, S.; Kantor, G.; Burgard, W.; Kavraki, L.E.; Thrun, S. Principles of Robot Motion: Theory, Algorithms, and Implementations; MIT Press: Cambridge, MA, USA, 2005. [Google Scholar]
- Kavraki, L.E.; Švestka, P.; Latombe, J.C.; Overmars, M.H. Probabilistic roadmaps for path planning in high-dimensional configuration spaces. IEEE Trans. Robot. Autom. 1996, 12, 566–580. [Google Scholar] [CrossRef] [Green Version]
- LaValle, S.M.; Kuffner, J.J. Randomized Kinodynamic Planning. Int. J. Robot. Res. 2001, 20, 378–400. [Google Scholar] [CrossRef]
- Haspel, N.; Moll, M.; Baker, M.L.; Chiu, W.; Kavraki, L.E. Tracing conformational changes in proteins. BMC Struct. Biol. 2010, 10 (Suppl. 1), S1. [Google Scholar] [CrossRef] [PubMed]
- Siegfried, H.; Reich, S.E.W. Structure-based drug design (SBDD): Every structure tells a story…. Perspect. Drug Discov. Design 1993, 1, 371–390. [Google Scholar]
- Cammarata, M.; Levantino, M.; Schotte, F.; Anfinrud, P.A.; Ewald, F.; Choi, J.; Cupane, A.; Wulff, M.; Ihee, H. Tracking the structural dynamics of proteins in solution using time-resolved wide-angle X-ray scattering. Nat. Methods 2008, 5, 881–886. [Google Scholar] [CrossRef] [PubMed] [Green Version]
- Saberi Fathi, S.M.; White, D.T.; Tuszynski, J.A. Geometrical comparison of two protein structures using Wigner-D functions. Proteins 2014, 82, 2756–2769. [Google Scholar] [CrossRef] [PubMed]
- Howells, M.R.; Beetz, T.; Chapman, C.; Cui, C.; Holton, J.M.; Jacobsen, C.J.; Kirz, J.; Lima, E.; Marchesini, S.; Miao, H.; et al. An assessment of the resolution limitation due to radiation-damage in X-ray diffraction microscopy. J. Electron Spectrosc. Relat. Phenom. 2009, 170, 4–12. [Google Scholar] [CrossRef] [PubMed] [Green Version]
- Ravelli, R.B.G.; Garman, E.F. Radiation damage in macromolecular cryocrystallography. Curr. Opin. Struct. Biol. 2006, 16, 624–629. [Google Scholar] [CrossRef] [PubMed]
- Frank, J. Single-particle reconstruction of biological macromolecules in electron microscopy—30 Years. Q. Rev. Biophys. 2009, 42, 139–158. [Google Scholar] [CrossRef] [PubMed]
- Fung, R.; Shneerson, V.; Saldin, D.K.; Ourmazd, A. Structure from Fleeting Illumination of Faint Spinning Objects in Flight? Nat. Phys. 2009, 5, 64–67. [Google Scholar] [CrossRef]
- Schwander, P.; Fung, R.; Phillips, G.N., Jr.; Ourmazd, A. Mapping the conformations of biological assemblies. New J. Phys. 2010, 12, 035007. [Google Scholar] [CrossRef] [Green Version]
- Phillips, J.C.; Braun, R.; Wang, W.; Gumbart, J.; Tajkhorshid, E.; Villa, E.; Chipot, C.; Skeel, R.D.; Kalé, L.; Schulten, K. Scalable molecular dynamics with NAMD. J. Comput. Chem. 2005, 26, 1781–1802. [Google Scholar] [CrossRef] [PubMed] [Green Version]
- Levantino, M.; Yorke, B.A.; Monteiro, D.C.F.; Cammarata, M.; Pearson, A.R. Time-resolved experiments at XFELs and synchrotrons. Curr. Opin. Struct. Biol. 2015, 35, 41–48. [Google Scholar] [CrossRef] [PubMed] [Green Version]
- Coppens, P.; Pitak, M.; Gembicky, M.; Messerschmidt, M.; Scheins, S.; Benedict, J.; Adachi, S.I.; Sato, T.; Nozawa, S.; Ichiyanagi, K.; et al. The RATIO method for time-resolved Laue crystallography. J. Synchrotron. Radiat. 2009, 16, 226–230. [Google Scholar] [CrossRef] [PubMed] [Green Version]
- Coppens, P.; Fournier, B. New methods in time-resolved Laue pump-probe crystallography at synchrotron sources. J. Synchrotron Radiat. 2015, 22, 280–287. [Google Scholar] [CrossRef] [PubMed]
- Schotte, F.; Cho, H.S.; Kaila, V.R.; Kamikubo, H.; Dashdorj, N.; Henry, E.R.; Graber, T.J.; Henning, R.; Wulff, M.; Hummer, G.; et al. Watching a signaling protein function in real time via 100-ps time-resolved Laue crystallography. Proc. Natl. Acad. Sci. USA 2012, 109, 19256–19261. [Google Scholar] [CrossRef] [PubMed]
- Yorke, B.A.; Beddard, G.S.; Owen, R.L.; Pearson, A.R. Time-resolved crystallography using the Hadamard transform. Nat. Methods 2014, 11, 1131–1134. [Google Scholar] [CrossRef] [PubMed] [Green Version]
- Saberi Fathi, S.M. A new definition and properties of the similarity value between two protein structures. J. Biol. Phys. 2016, 42, 1–16. [Google Scholar] [CrossRef] [PubMed]
- Wigner, E.P. Gruppentheorie und Ihre Anwendungen auf die Quantenmechanik der Atomspektren; Vieweg Verlag: Braunschweig, Germany, 1931. [Google Scholar]
- Potts, D.; Prestin, J.; Vollrath, A. A fast algorithm for nonequispaced Fourier transforms on the rotation group. Number. Algorithms 2009, 52, 355–384. [Google Scholar] [CrossRef] [Green Version]
- Hielscher, R.; Potts, D.; Prestin, J.; Schaeben, H.; Schmalz, M. The Radon transform on SO3: A Fourier slice theorem and numerical inversion. Inverse Probl. 2008, 24, 025011. [Google Scholar] [CrossRef]
- Lipson, H.; Taylor, C.A. Fourier Transforms and X-ray Diffraction; Bell: London, UK, 1958. [Google Scholar]
- Tenenbaum, J.B.; de Silva, V.; Langford, J.C. A Global Geometric Framework for Nonlinear Dimensionality Reduction. Science 2000, 290, 2319–2323. [Google Scholar] [CrossRef] [PubMed]
- Bishop, C.M.; Svensén, M.; Williams, C.K.I. GTM: The Generative Topographic Mapping. Neural Comput. 1998, 10, 215–234. [Google Scholar] [CrossRef] [Green Version]
- Coifman, R.R.; Lafon, S.; Lee, A.B.; Maggioni, M.; Nadler, B.; Warner, F.; Zucker, S.W. Geometric diffusions as a tool for harmonic analysis and structure definition of data: Diffusion maps. Proc. Nat. Acad. Sci. USA 2005, 102, 7426–7431. [Google Scholar] [CrossRef] [PubMed] [Green Version]
- Coifman, R.R.; Kevrekidis, I.G.; Lafon, S.; Maggioni, M.; Nadler, B. Diffusion maps, reduction coordinates, and low dimensional representation of stochastic systems. Multiscale Model. Simul. 2008, 7, 842–864. [Google Scholar] [CrossRef]
- Jones, P.W.; Maggioni, M.; Schul, R. Manifold parametrizations by eigenfunctions of the Laplacian and heat kernels. Proc. Nat. Acad. Sci. USA 2008, 105, 1803–1808. [Google Scholar] [CrossRef] [PubMed]
- Lerman, G.; Shakhnovich, B.E. Defining functional distance using manifold embeddings of gene ontology annotations. Proc. Nat. Acad. Sci. USA 2007, 104, 11334–11339. [Google Scholar] [CrossRef] [PubMed] [Green Version]
- Rajan, A.; Freddolino, P.L.; Schulten, K. Going beyond Clustering in MD Trajectory Analysis: An Application to Villin Headpiece Folding. PLoS ONE 2010, 5, e9890. [Google Scholar] [CrossRef] [PubMed]
- Putnam, D.K.; Lowe, E.W., Jr.; Meiler, J. Reconstruction of SAXS Profiles from Protein Structures. Comput. Struct. Biotechnol. J. 2013, 8, e201308006. [Google Scholar] [CrossRef] [PubMed]
Figure 1.
Two samples of test conformational shapes. The axes are x and y positions of the points.

Figure 2.
The MED values for the simple shape dataset. The abscissa gives the number of test shapes.
Figure 2.
The MED values for the simple shape dataset. The abscissa gives the number of test shapes.

Figure 3.
The 44 peptides and their MED values. We see that peptides are more closed when MED increased.
Figure 3.
The 44 peptides and their MED values. We see that peptides are more closed when MED increased.

Figure 4.
An X-ray diffraction pattern of ADK [26].
Figure 4.
An X-ray diffraction pattern of ADK [26].

Figure 5.
The normalized MED values for 12,500 snapshots of ADK showing 100 islands for the 100 different conformational states.
Figure 5.
The normalized MED values for 12,500 snapshots of ADK showing 100 islands for the 100 different conformational states.


Table 1.
The names of the different conformations of peptides generated by MOE software and the corresponding values of their MED. Larger numbers correspond to a more closed (longer) peptide conformation.
Table 1.
The names of the different conformations of peptides generated by MOE software and the corresponding values of their MED. Larger numbers correspond to a more closed (longer) peptide conformation.
| Peptide Name | MED |
|---|---|
| s1-17 | 0.41669 |
| s1-18 | 0.44192 |
| s1-21 | 0.3754 |
| s1-1 | 0.46476 |
| s1-10 | 0.46306 |
| s1-11 | 0.46238 |
| s1-12 | 0.5023 |
| s1-13 | 0.39675 |
| s1-14 | 0.47616 |
| s1-15 | 0.48602 |
| s1-16 | 0.43416 |
| s1-19 | 0.45545 |
| s1-2 | 0.40972 |
| s1-20 | 0.48793 |
| s1-3 | 0.50093 |
| s1-4 | 0.31545 |
| s1-5 | 0.47582 |
| s1-6 | 0.46336 |
| s1-7 | 0.38409 |
| s1-8 | 0.36499 |
| s1-9 | 0.47234 |
| s14-1 | 0.65987 |
| s14-10 | 0.63324 |
| s14-11 | 0.62796 |
| s14-2 | 0.49089 |
| s14-3 | 0.68266 |
| s14-4 | 0.67186 |
| s14-5 | 0.63556 |
| s14-6 | 0.67026 |
| s14-7 | 0.5799 |
| s14-8 | 0.65054 |
| s14-9 | 0.65645 |
| s16-1 | 0.46471 |
| s16-2 | 0.56308 |
| s16-3 | 0.46227 |
| s16-4 | 0.53976 |
| s16-5 | 0.44666 |
| s16-6 | 0.38378 |
| s16-7 | 0.56239 |
| s31-1 | 0.47829 |
| s31-2 | 0.50418 |
| s31-3 | 0.4668 |
| s31-4 | 0.44994 |
| s31-5 | 0.42765 |
© 2018 by the authors. Licensee MDPI, Basel, Switzerland. This article is an open access article distributed under the terms and conditions of the Creative Commons Attribution (CC BY) license (http://creativecommons.org/licenses/by/4.0/).
Share and Cite
MDPI and ACS Style
Saberi Fathi, S.M.; Tuszynski, J.A. Using Spectral Representation to Classify Proteins’ Conformational States. Int. J. Mol. Sci. 2018, 19, 2089. https://doi.org/10.3390/ijms19072089
AMA Style
Saberi Fathi SM, Tuszynski JA. Using Spectral Representation to Classify Proteins’ Conformational States. International Journal of Molecular Sciences. 2018; 19(7):2089. https://doi.org/10.3390/ijms19072089
Chicago/Turabian StyleSaberi Fathi, Seyed Majid, and Jack A. Tuszynski. 2018. "Using Spectral Representation to Classify Proteins’ Conformational States" International Journal of Molecular Sciences 19, no. 7: 2089. https://doi.org/10.3390/ijms19072089
Note that from the first issue of 2016, this journal uses article numbers instead of page numbers. See further details here.