I - Introduction
The relationship between molecules and graphs can be considered as a sort of isomorphism. In fact, if vertices are viewed as atoms and edges as bonds, then graphs represent models of chemical structures /1,2/. Conversely, if atoms in a molecule are interpreted as vertices and bonds as edges, then molecules are but illustrations of graphs /3/. That is to say, molecules have all those properties that the corresponding graphs have, but it is evident that molecules possess many additional properties that go beyond the mere consequences of the simple connectivity features that graphs encode. Therefore, the use of graphs as molecular models gives way to a basic problem within the realm of QSAR/QSPR (Quantitative Structure Activity Relationships/Quantitative Structure Property Relationships) theory and we can pose it asking how to select those graphs invariants (molecular descriptors) that can be reliable enough to establish a suitable relationship between biological activities/physicochemical properties and structure?
The aim of this paper is to deal with this pivotal issue in relation to the calculation of boiling points (bp) for a selected set of alkyl alcohols. We take as a reference study a recent paper on optimal molecular descriptors based on weighted path numbers /4/. The main idea is to resort to the construction of suitable descriptors for optimization through the introduction of an intrinsic flexibility degree involving a variable part that can be improved in different applications. This feature allows one to gain a freedom degree which hopefully should lead us to have better molecular descriptors and, consequently, more satisfactory mathematical relationships between structure and property.
This paper in organized as follows: next section deals with the definition and illustration of the chosen molecular descriptors based on the optimization of correlation weights of local graph invariants. Then we show the numerical results obtained via first, second and third order polynomial relationships for a selected set of alkyl alcohols and comparing them with previous results derived on the basis of a similar set of molecular descriptors.
Section 4 is devoted to discuss the results, analyzing the similarities and significative differences with regard to other equivalent approaches. The final section is devoted to present the main conclusions derived from this study and finally several possible future extensions are pointed out.
II - Correlation Weights of Local Graph Invariants
The last three decades witnessed a meaningful upsurge of interest in applications of graph theory in chemistry. As pointed out before, constitutional formulae of molecules are chemical graphs where vertices represent the set of atoms and edges stand for chemical bonds. The pattern of connectedness of atoms in a molecule is preserved by constitutional graphs. Chemists have since long relied on visual perception to relate various aspects by constitutional graphs to observable phenomena. However, a clear and quantitative understanding of the structural basis of chemistry demands the use of precise mathematical techniques. The applications of matrix theory, graph theory, group theory and information theory to chemical graphs have produced results which are important in chemistry /5-13/.
Most molecular descriptors in QSAR/QSPR theory are rather "rigid" in the sense the algorithm for their construction is fixed so that once the molecule is selected, the invariant under consideration can be computed exactly. There are a large number of this sort of molecular descriptors and they have shown to be rather suitable /4/. However, there exists another separate class of molecular descriptors having an intrinsic flexibility involving a variable part that can be adjusted and optimized for different applications. Thus, the employment of weighted paths for alkyl alcohols have shown to extend enormously the approach of variable descriptors to molecules of different chemical composition /4/.
An alternative proposal for this kind of molecular descriptors is the Correlation Weights of the Local Invariants of Molecular Graphs (CWLIMG) introduced originally by one of us (AAT) /14-16/ and soon afterwards it was applied to study some physical chemistry properties /17,18/. Results were encouraging enough to promote new efforts to apply this new descriptor for studying other physical chemistry properties.
The CWLIMG approach is based upon the following scheme. The primary units of analysis are the atoms with their corresponding vertex degrees. Then, graphs invariants are formulated in the general form
where
aij is an element of the adjacency matrix A,
ν
i is the vertex degree value of the i-th vertex, defined as
CW(a(i)) and CW(νi) are the correlation weights corresponding to atom i.
Correlation weights are calculated by means of an optimization procedure,
i.e. they are determined in such a way to yield the best correlation coefficient for the relationship
where P stands for the physical chemistry property or biological activity.
There is complete freedom to choose the explicit algebraic form of the f and F functions. The most general polynomial form of the F function is
while there are several possibilities to choose f. Some of the most simple equations for D are
After computing the optimal CW's values, one resorts to relationship (4) to calculate the final correlation formula through a least squares procedure (i.e. to determine the optimum coefficients {Ak / k = 0, 1, ....., n}) for a molecular training set. Then, the predictive capability of the whole method is tested with a different set of molecules (test set).
Previous results obtained from this method have shown to be suitable enough to predict several physical chemistry properties /14-18/.
III - Results and Discussion
In order to be able to apply a meaningful test, we choose the same molecular set as that employed by Randic and Basak /4/ to compute boiling points of 58 alkyl alcohols. Since they used optimal molecular descriptors based on weighted path numbers, we deem it suitable enough to compare with our CWLIMG since both approaches employ indices that possess an inherent flexibility involving a variable part that is optimized for different applications. Besides, the chosen set of 58 alcohols has been employed in several QSPR/QSAR studies /19-26/.
Regarding the specific analytical form of function f in Eq.(1) we employ he simple relation (5) and for the relationship between property
vs descriptor, we apply formula (4) for n = 1, 2 and 3. Furthermore, the whole set was partitioned in two equal subsets: a) a
training set consisting of 29 alkyl alcohols (molecules 1, 2, 3, 4, ,6, 8, 9, 11, 14, 16, 18, 20, 22, 26, 27, 29, 34, 35, 37, 39, 41, 44, 45, 48, 49, 52, 53, 56 and 58 in
Table 2) and b) a
test set including the remaining 29 alcohols (molecules 5, 7, 10, 12, 13 15 17 19 21 23, 24, 25, 28, 30, 31,32, 33, 36, 38, 40, 42, 43,46, 47, 50, 51, 54, 55, and 55 in
Table 2). The choice of the members of each set was made completely at random and the criterion to measure the goodness degree of the results was the average value of the modulus of residuals (
i.e. average deviations).
The most significative results are given in
Table 1,
Table 2 and
Table 3, equations 11-13 and
Figure 1, and we have also included previous results taken from Ref. 4 for comparative purposes. Complete data are available upon request to one of us (EAC).
We give in
Table 1 the correlation weights obtained for this set of alkyl alcohols.
Table 1.
Correlation weights (CW) for atoms and extended connectivity value corresponding to the set of alkyl alcohols.
Table 1.
Correlation weights (CW) for atoms and extended connectivity value corresponding to the set of alkyl alcohols.
| Atom | Correlation weight |
|---|
| C | 0.287 |
| H | 0.462 |
| O | 1.000 |
| νi values |
| 2 | 1.000 |
| 4 | 0.300 |
| 5 | 2.808 |
| 7 | 0.550 |
| 8 | 3.244 |
| 10 | 2.476 |
| 11 | 1.077 |
| 13 | 2.979 |
| 14 | 0.22 |
| 16 | 2.232 |
The regression equations using first, second and third order polynomials are:
The statistical parameters corresponding to regression equations (11-13) are displayed in
Table 2, where we have also included those values reported by Randic and Basak (see Table 7 in ref. 4).
Table 2.
Statistical parameters corresponding to the regression equations.
Table 2.
Statistical parameters corresponding to the regression equations.
| Equation | Set | Regression coefficient (r) | Standard Error (s) | Fischer ratio (F) | Average Deviation |
|---|
| Linear [Eq. (11)] | Training | 0.9953 | 2.903 | 5733 | 2.20 |
| Test | 0.9948 | 3.025 | 2595 | 2.50 |
| Quadratic [Eq. (12)] | Training | 0.9953 | 3.008 | 2764 | 2.20 |
| Test | 0.9948 | 2.833 | 1296 | 2.48 |
| Cubic [Eq. (13)] | Training | 0.9954 | 2.874 | 2018 | 2.03 |
| Test | 0.9949 | 2.871 | 841 | 2.63 |
| Randic and Basak two descriptors /4/ | Complete | 0.9938 | 4.039 | 2193 | 2.90 |
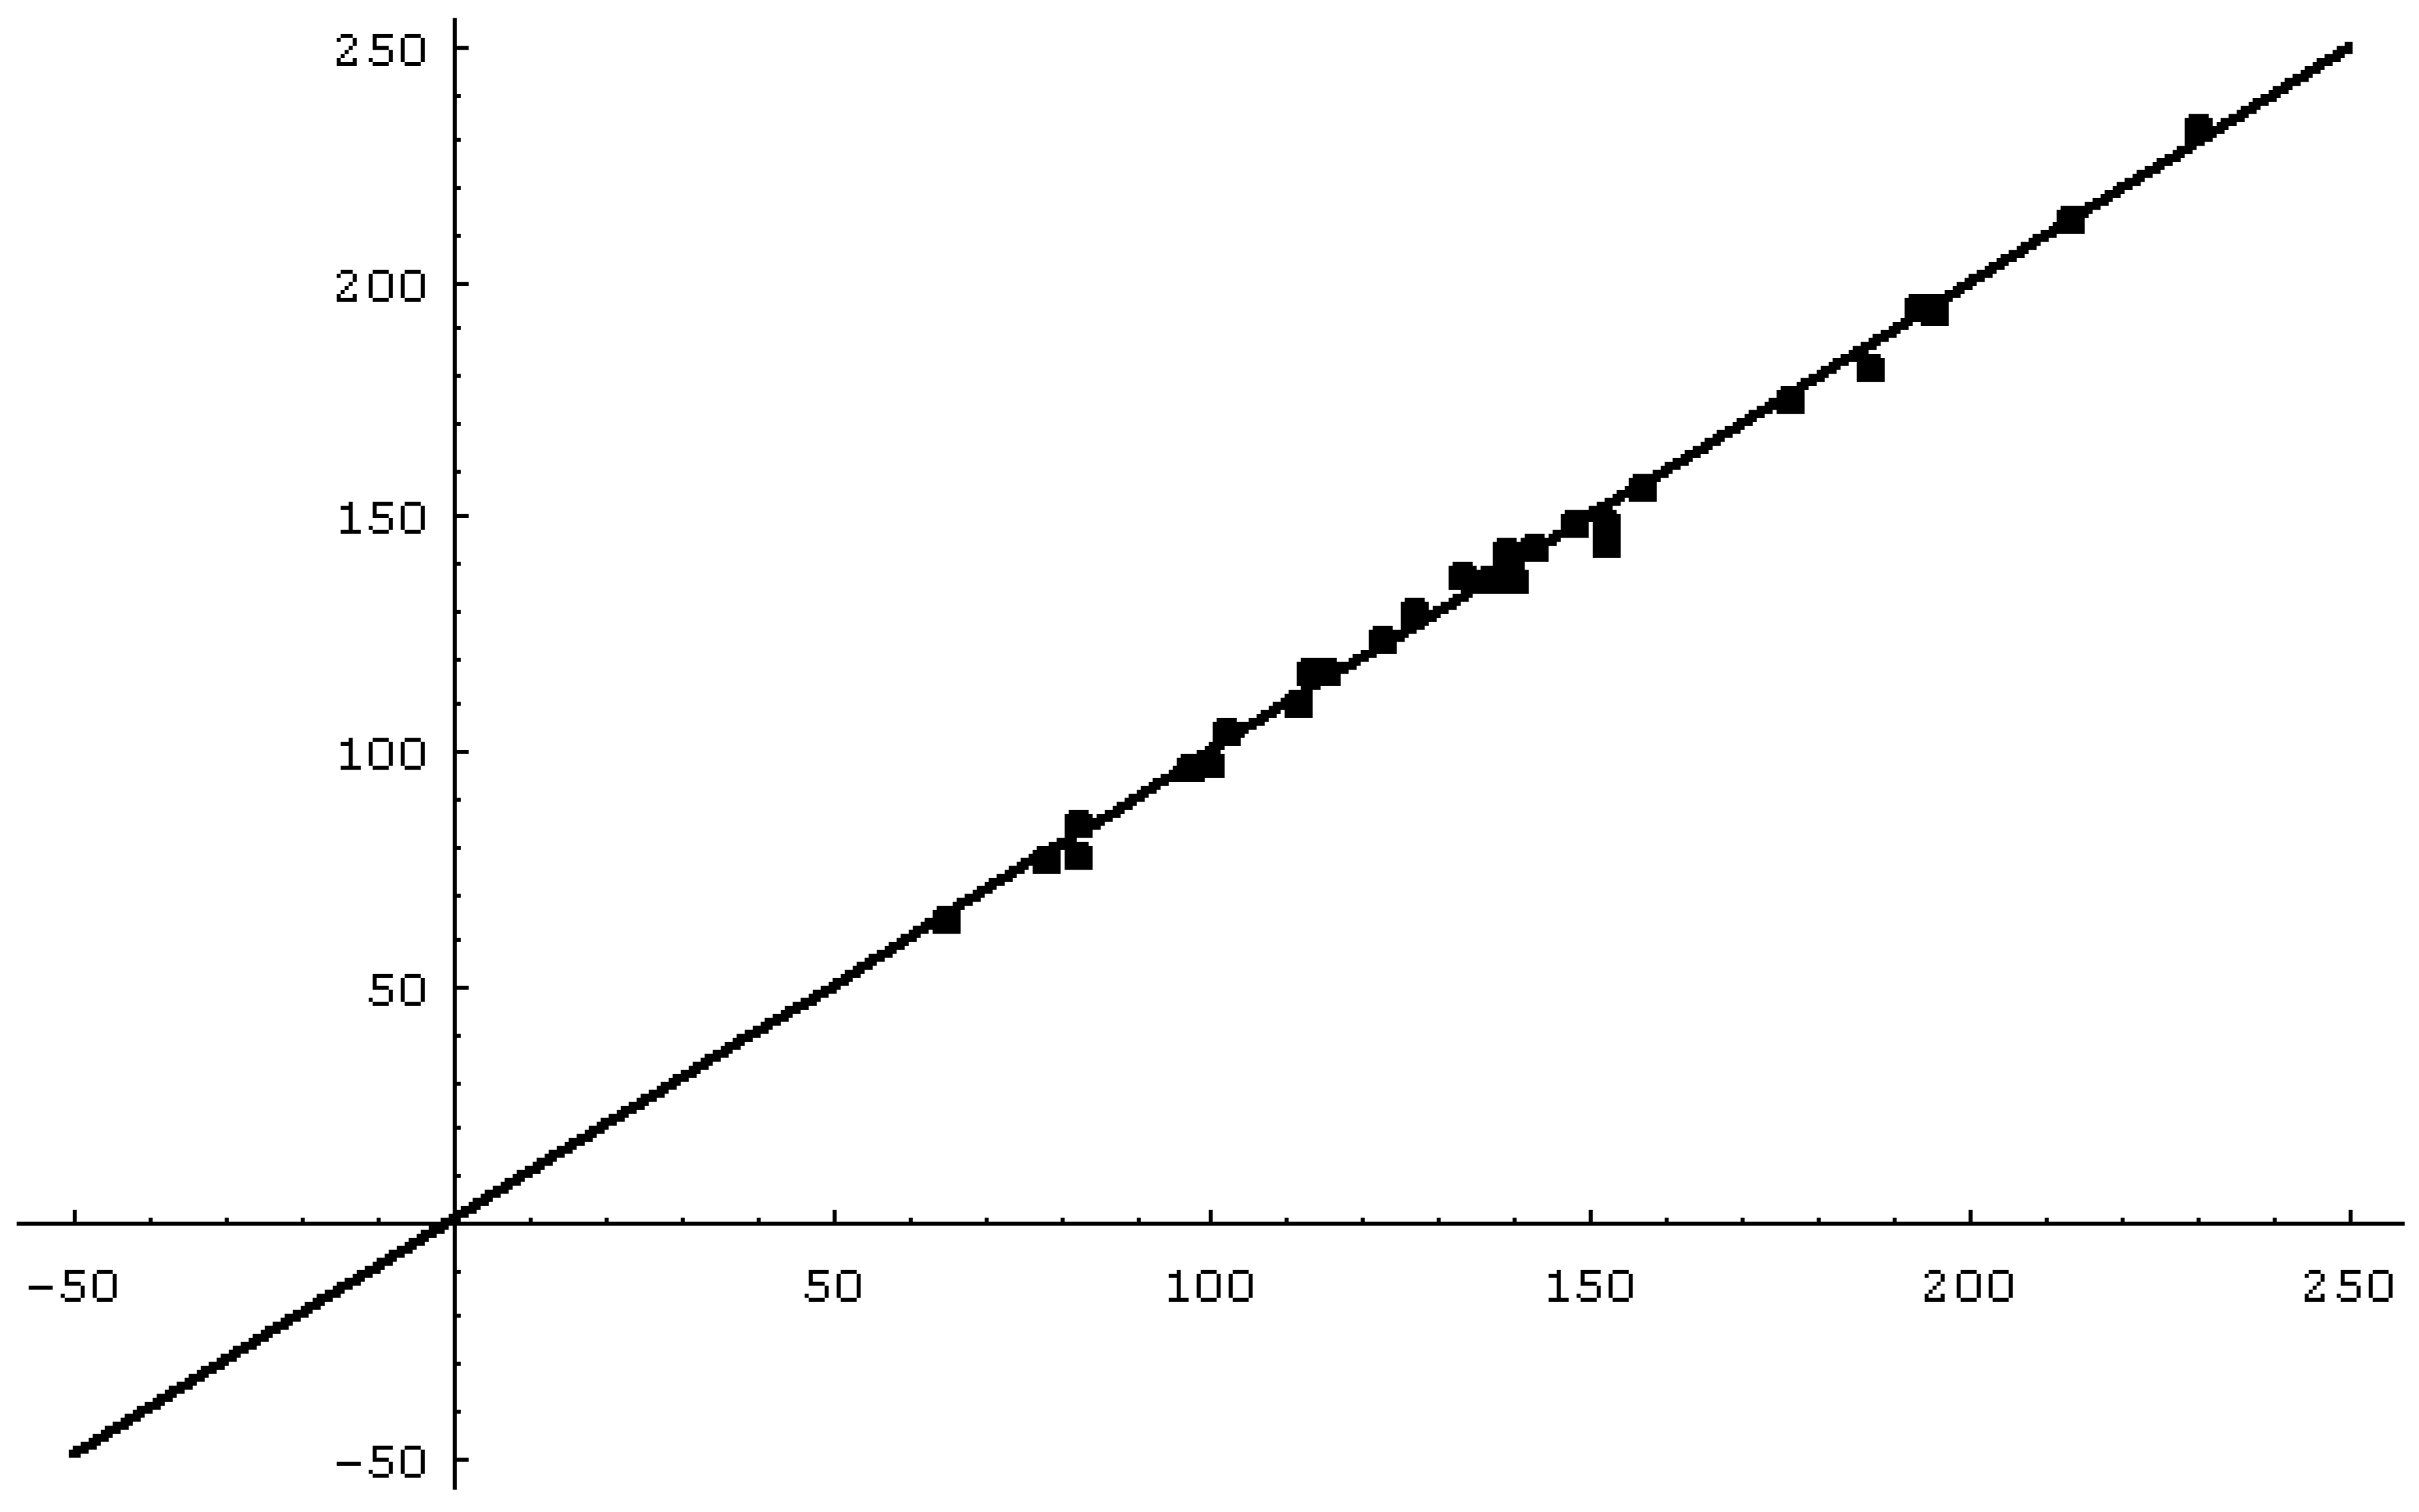
Figure 1 shows the regression of the calculated bp (Eq.(11)) versus the experimental bp and
Table 3 presents the experimental and calculated bp, together with the corresponding residuals.
Figure 1.
Experimental versus theoretical boiling points of alkyl alcohols.
Figure 1.
Experimental versus theoretical boiling points of alkyl alcohols.
Table 3.
Experimental and calculated boiling points (°C) of alkyl alcohols (residuals, defined as {bp[exp.] - bp[calc.]}, are given between parentheses).
Table 3.
Experimental and calculated boiling points (°C) of alkyl alcohols (residuals, defined as {bp[exp.] - bp[calc.]}, are given between parentheses).
| Alkyl alcohol | bp exp. | bp calc. (eq.11) | Bp calc. ref. /4/ |
|---|
| 1. methanol | 64.7 | 64.68 (0.02) | 65.24 (-0.54) |
| 2. ethanol | 78.3 | 77.36 (0.94) | 77.69 (0.61) |
| 3. 1-propanol | 97.2 | 96.80 (0.4) | 96.42 (0.77) |
| 4. 2-propanol | 82.3 | 78.24 (4.06) | 84.11 (-1.81) |
| 5. 1-butanol | 117.7 | 116.25 (1.45) | 115.67 (2.03) |
| 6. 2-butanol | 99.6 | 97.68 (1.92) | 102.43 (-2.83) |
| 7. 2-methyl-1-propanol | 107.9 | 109.79 (-1.89) | 109.15 (-1.25) |
| 8. 2-methyl-2-propanol | 82.4 | 84.97 (-2.57) | 84.52 (-2.12) |
| 9. 1-pentanol | 137.8 | 135.69 (2.11) | 134.92 (2.88) |
| 10. 2-pentanol | 119.0 | 117.13 (1.87) | 121.68 (-2.68) |
| 11. 3-pentanol | 115.3 | 117.13 (-1.83) | 120.75 (-5.45) |
| 12. 2-methyl-1-butanol | 128.7 | 129.34 (-0.64) | 127.97 (0.73) |
| 13. 3-methyl-1-butanol | 131.2 | 129.23 (1.97) | 128.90 (2.30) |
| 14. 2-methyl-2-butanol | 102.0 | 104.41 (-2.41) | 102.41 (-0.41) |
| 15. 3-methyl-2-butanol | 111.5 | 110.67 (0.83) | 114.72 (-3.22) |
| 16. 2,2-dimethyl-1-propanol | 113.1 | 117.11 (4.01) | 115.84 (-2.74) |
| 17. 1-hexanol | 157.0 | 155.13 (1.87) | 154.17 (2.83) |
| 18. 2-hexanol | 139.9 | 136.57 (3.33) | 140.92 (-1.02) |
| 19. 3-hexanol | 135.4 | 136.57 (-1.17) | 139.99 (-4.59) |
| 20. 2-methyl-1-pentanol | 148.0 | 148.68 (-0.68) | 147.22 (0.78) |
| 21. 3-methyl-1-pentanol | 152.4 | 148.68 (3.72) | 147.72 (4.8) |
| 22. 4-methyl-1-pentanol | 151.8 | 148.68 (3.12) | 148.15 (3.65) |
| 23. 2-methyl-2-pentanol | 121.4 | 123.86 (-2.46) | 121.66 (-0.25) |
| 24. 3-methyl-2-pentanol | 134.2 | 130.11 (4.09) | 133.55 (0.65) |
| 25. 4-methyl-2-pentanol | 131.7 | 130.11 (1.59) | 134.90 (-3.20) |
| 26. 2-methyl-3-pentanol | 126.5 | 130.11 (-3.61) | 134.31 (-7.81) |
| 27. 3-mehtyl-3-pentanol | 122.4 | 123.86 (-1.46) | 120.30 (2.10) |
| 28. 2-ethyl-1-butanol | 146.5 | 148.68 (-2.18) | 146.79 (-0.29) |
| 29. 2,2-dimethyl-1-butanol | 136.8 | 136.55 (0.25) | 134.37 (2.43) |
| 30. 2,3-dimethyl-1-butanol | 149.0 | 142.22 (6.78) | 140.77 (8.23) |
| 31. 3,3-dimethyl-1-butanol | 143.0 | 136.55 (6.45) | 136.11 (6.89) |
| 32. 2,3-dimethyl-2-butanol | 118.6 | 117.40 (1.20) | 114.28 (4.32) |
| 33. 3,3-dimethyl-2-butanol | 120.0 | 117.99 (2.01) | 121.00 (-1.00) |
| 34. 1-heptanol | 176.3 | 174.57 (1.73) | 173.41 (2.87) |
| 35. 3-heptanol | 156.8 | 156.01 (0.79) | 159.24 (-2.44) |
| 36. 4-heptanol | 155.0 | 156.01 (-1.01) | 159.24 (-4.24) |
| 37. 2-methyl-2-hexanol | 142.5 | 143.30 (-0.80) | 140.9 (1.60) |
| 38. 3-methyl-3-hexanol | 142.4 | 143.30 (-0.90) | 139.55 (2.85) |
| 39. 3-ethyl-3-pentanol | 142.5 | 143.30 (-0.80) | 138.37 (4.13) |
| 40. 2,3-dimethyl-2-pentanol | 139.7 | 136.84 (2.86) | 133.11 (6.59) |
| 41. 3,3-dimethyl-2-pentanol | 133.0 | 137.43 (-4.43) | 139.67 (-6.57) |
| 42. 2,2-dimethyl-3-pentanol | 136.0 | 137.43 (-1.43) | 139.32 (-3.32) |
| 43. 2,3-dimethyl-3-pentanol | 139.0 | 136.84 (2.16) | 132.18 (6.82) |
| 44. 2,4-dimethyl-3-pentanol | 138.8 | 143.10 (-4.30) | 145.34 (-6.54) |
| 45. 1-octanol | 195.2 | 194.01 (1.19) | 192.58 (2.62) |
| 46. 2-octanol | 179.8 | 175.45 (4.35) | 179.33 (0.47) |
| 47. 2-ethyl-1-hexanol | 184.6 | 187.56 (-2.96) | 185.29 (-0.69) |
| 48. 2,2,3-trimethyl-3-pentanol | 152.2 | 144.16 (8.04) | 152.78 (-0.57) |
| 49. 1-nonanol | 213.1 | 213.45 (-0.35) | 211.91 (1.19) |
| 50. 2-nonanol | 198.5 | 194.89 (3.61) | 198.66 (-0.16) |
| 51. 3-nonanol | 194.7 | 194.89 (-0.19) | 197.73 (-3.03) |
| 52. 4-nonanol | 193.0 | 194.89 (-1.89) | 197.73 (-4.73) |
| 53. 5-nonanol | 195.1 | 194.89 (0.21) | 197.73 (-2.63) |
| 54. 7-methyl-1-octanol | 206.0 | 207.00 (1.00) | 205.46 (0.54) |
| 55. 2,6-dimethyl-4-heptanol | 178.0 | 181.99 (-3.99) | 185.69 (-7.69) |
| 56. 3,5-dimethyl-4-heptanol | 187.0 | 181.99 (5.01) | 183.83 (3.17) |
| 57. 3,5,5-trimethyl-1-hexanol | 193.0 | 188.43 (4.57) | 186.98 (6.02) |
| 58. 1-decanol | 230.2 | 232.86 (-2.66) | 231.15 (-0.95) |
The comparison of the different theoretical results tell us that regressions based on first order equation is good enough and results do no improve in a meaningful way when using higher order relationships. The average deviations for the two molecular sets (i.e. training set and test set) are rather similar, although naturally it is better for the first set. The comparison of our results with those taken as a reference /4/ seems to indicate the higher quality of those computed on the basis of CWLIMG. The main purpose of this work is not just to perform a close contrast with Randic and Basak's paper, but since these authors pointed out that "... the examples given clearly show the high-quality results based on optimal molecular descriptors ...", as it really is, the comparison of both sets of results here is useful to derive some valid conclusions on the present method employing CWLIMG.
The average deviations are lower for our calculations, and it results more meaningful when on takes into account that data taken from ref. 4 is based upon a two variables equation (descriptors p1 and p2, i.e. weighted paths of length one and length two, respectively, Eqs. 7 and 10 in ref.4). Besides, one must take into account that our results for the molecular test set are completely predictive, that is to say, they were no included in the molecular set employed to determine the fitting equation, while the Randic and Basak's results do not make this differentiation (i.e. the whole set of 58 molecules was used to calculate the regression relationships), so that there is not any genuine prediction within their values. In order to justify our claim of having gotten better results, it is instructive to note that, in general, the statistical parameters for the test set are even better than those of Randic and Basak's corresponding values for the whole set of 58 molecules. Another way to recognize the better quality of our predictions is considering the number of predicted bp with a deviation larger than 5°C. In fact, our predicted set of bp registers just 4 cases, while Randic and Basak's data present 10 predictions with a deviation larger than 5°C.
We have tried other alternative ways to choose the members of the training and test sets, but final results are practically the same.
IV - Conclusions
The results presented in this paper clearly show the very good outcomes arising from the use of the CWLIMG which, on one hand uses just only one molecular descriptor and on the other hand give correlations with significative reduced deviations with regard to other similar approaches. It seems to be a very good prospect in resorting to molecular descriptors having an intrinsic flexibility, as it is the case of the present one, because they yield quite satisfactory predictions.
In addition, it is not necessary to employ higher order polynomial relationships in order to improve linear equations or/and to be dependent upon the choice of the training set to get the most suitable fitting equation.
Present results agree with those published before on the use of CWLIMG /14-18/ and they further illuminate the appropriateness of using this molecular descriptor within the realm of QSAR/QSPR theory.
Perhaps, before establishing more definitive conclusions about the goodness degree of this sort of flexible molecular descriptor it should be necessary and convenient to study other molecular sets and/or other physical chemistry properties and biological activities. At present, research along these lines are under development in our laboratories and results will be published elsewhere in the near future.


