The H2/O2 Reaction on a Palladium Model Catalyst Studied with Laser-Induced Fluorescence and Microcalorimetry

Abstract
:Introduction
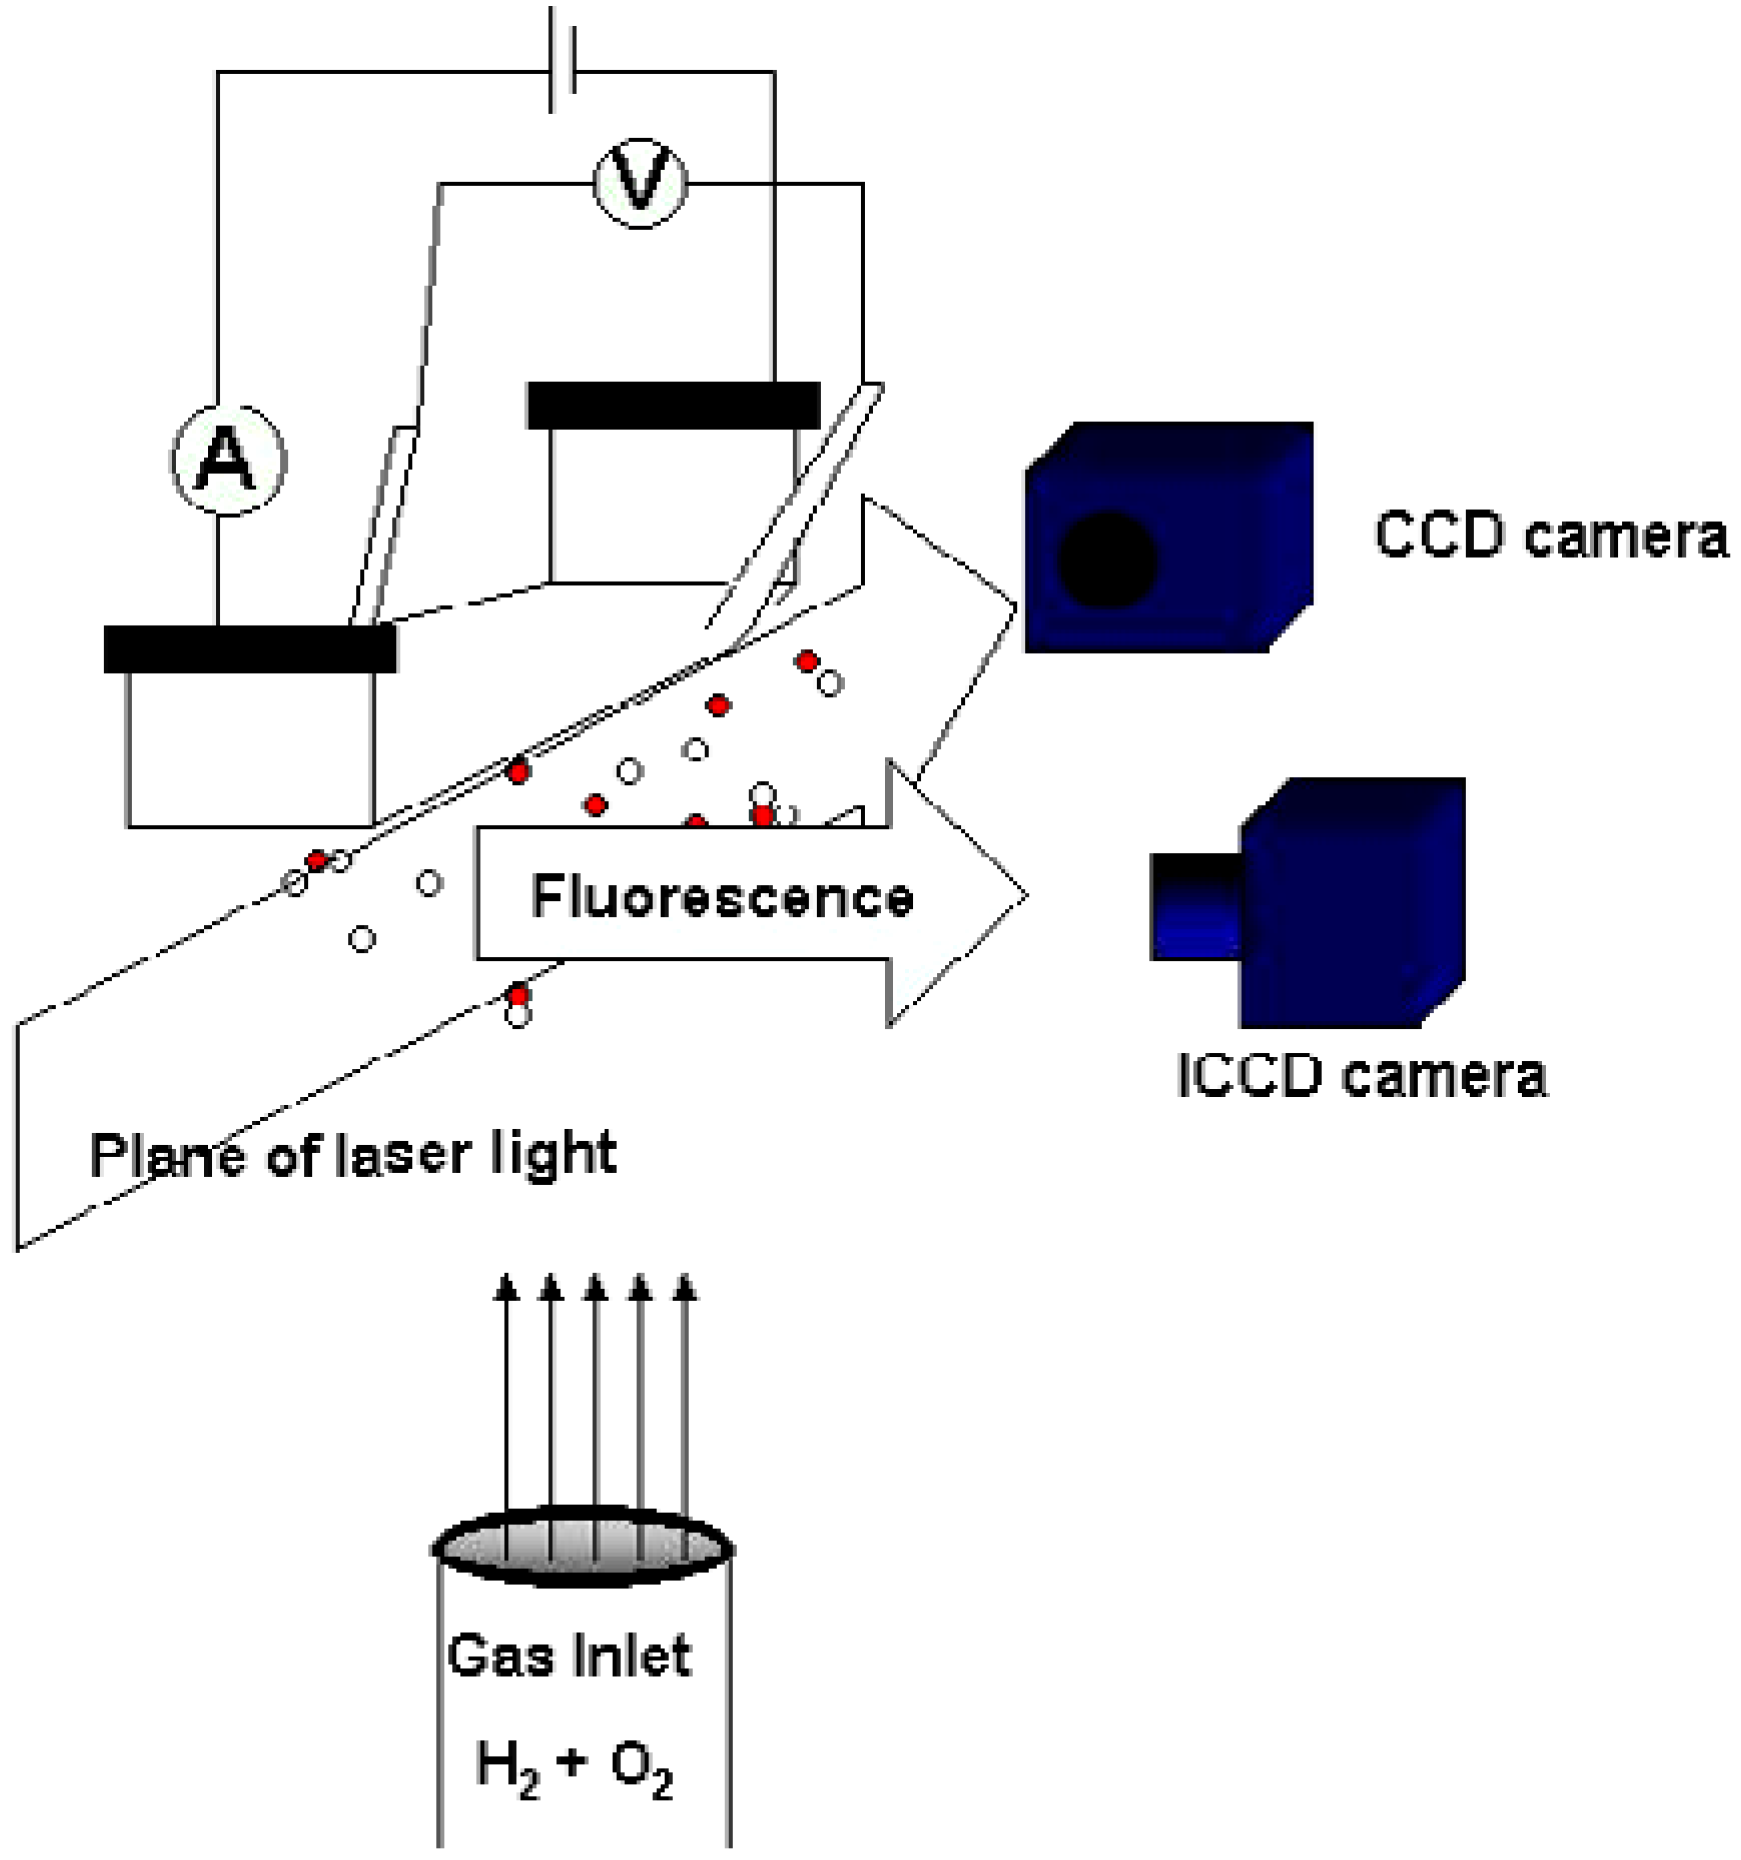
Methods
Results and Discussion
- The quotient SH2(0)/SO2(0) of the initial sticking coefficients for H2 and O2 can be calculated from the relative hydrogen pressure, αH2, where the production of water reaches a maximum: αH2Omax.

Ratio between initial sticking coefficients for H2 and O2

| Reaction Number | Reaction | Preexponential/Sticking Coefficient | Activation Energy (J/Mol) |
|---|---|---|---|
| S1 | H2→2H(s) | 1.0 (sticking) | |
| S2 | 2H(s)→H2 | 4.0*1021 | 41500 |
| S3 | O2→2O(s) | 0.8 (sticking) | |
| S4 | 2O(s)→O2 | 4.0*1021 | (213000) |
| S5 | H(s)+O(s)⇔OH(s) | 4.0*1021 | 79100 |
| S6 | H(s)+OH(s)⇔H2O | 4.0*1021 | 59800 |
| S7 | OH(s)+OH(s)⇔H2O+O(s) | 4.0*1021 | 59800 |
| S8 | OH→OH(s) | 1 (sticking) | |
| S9 | OH(s)→OH | 1.0*1013 | (245000) |
| S10 | O→O(s) | 1 (sticking) | |
| S11 | O(s)→O | 1.0*1013 | (356000) |
| S12 | H→H(s) | 1 (sticking) | |
| S13 | H(s)→H | 1.0*1013 | (249000) |
Discrimination between reaction paths
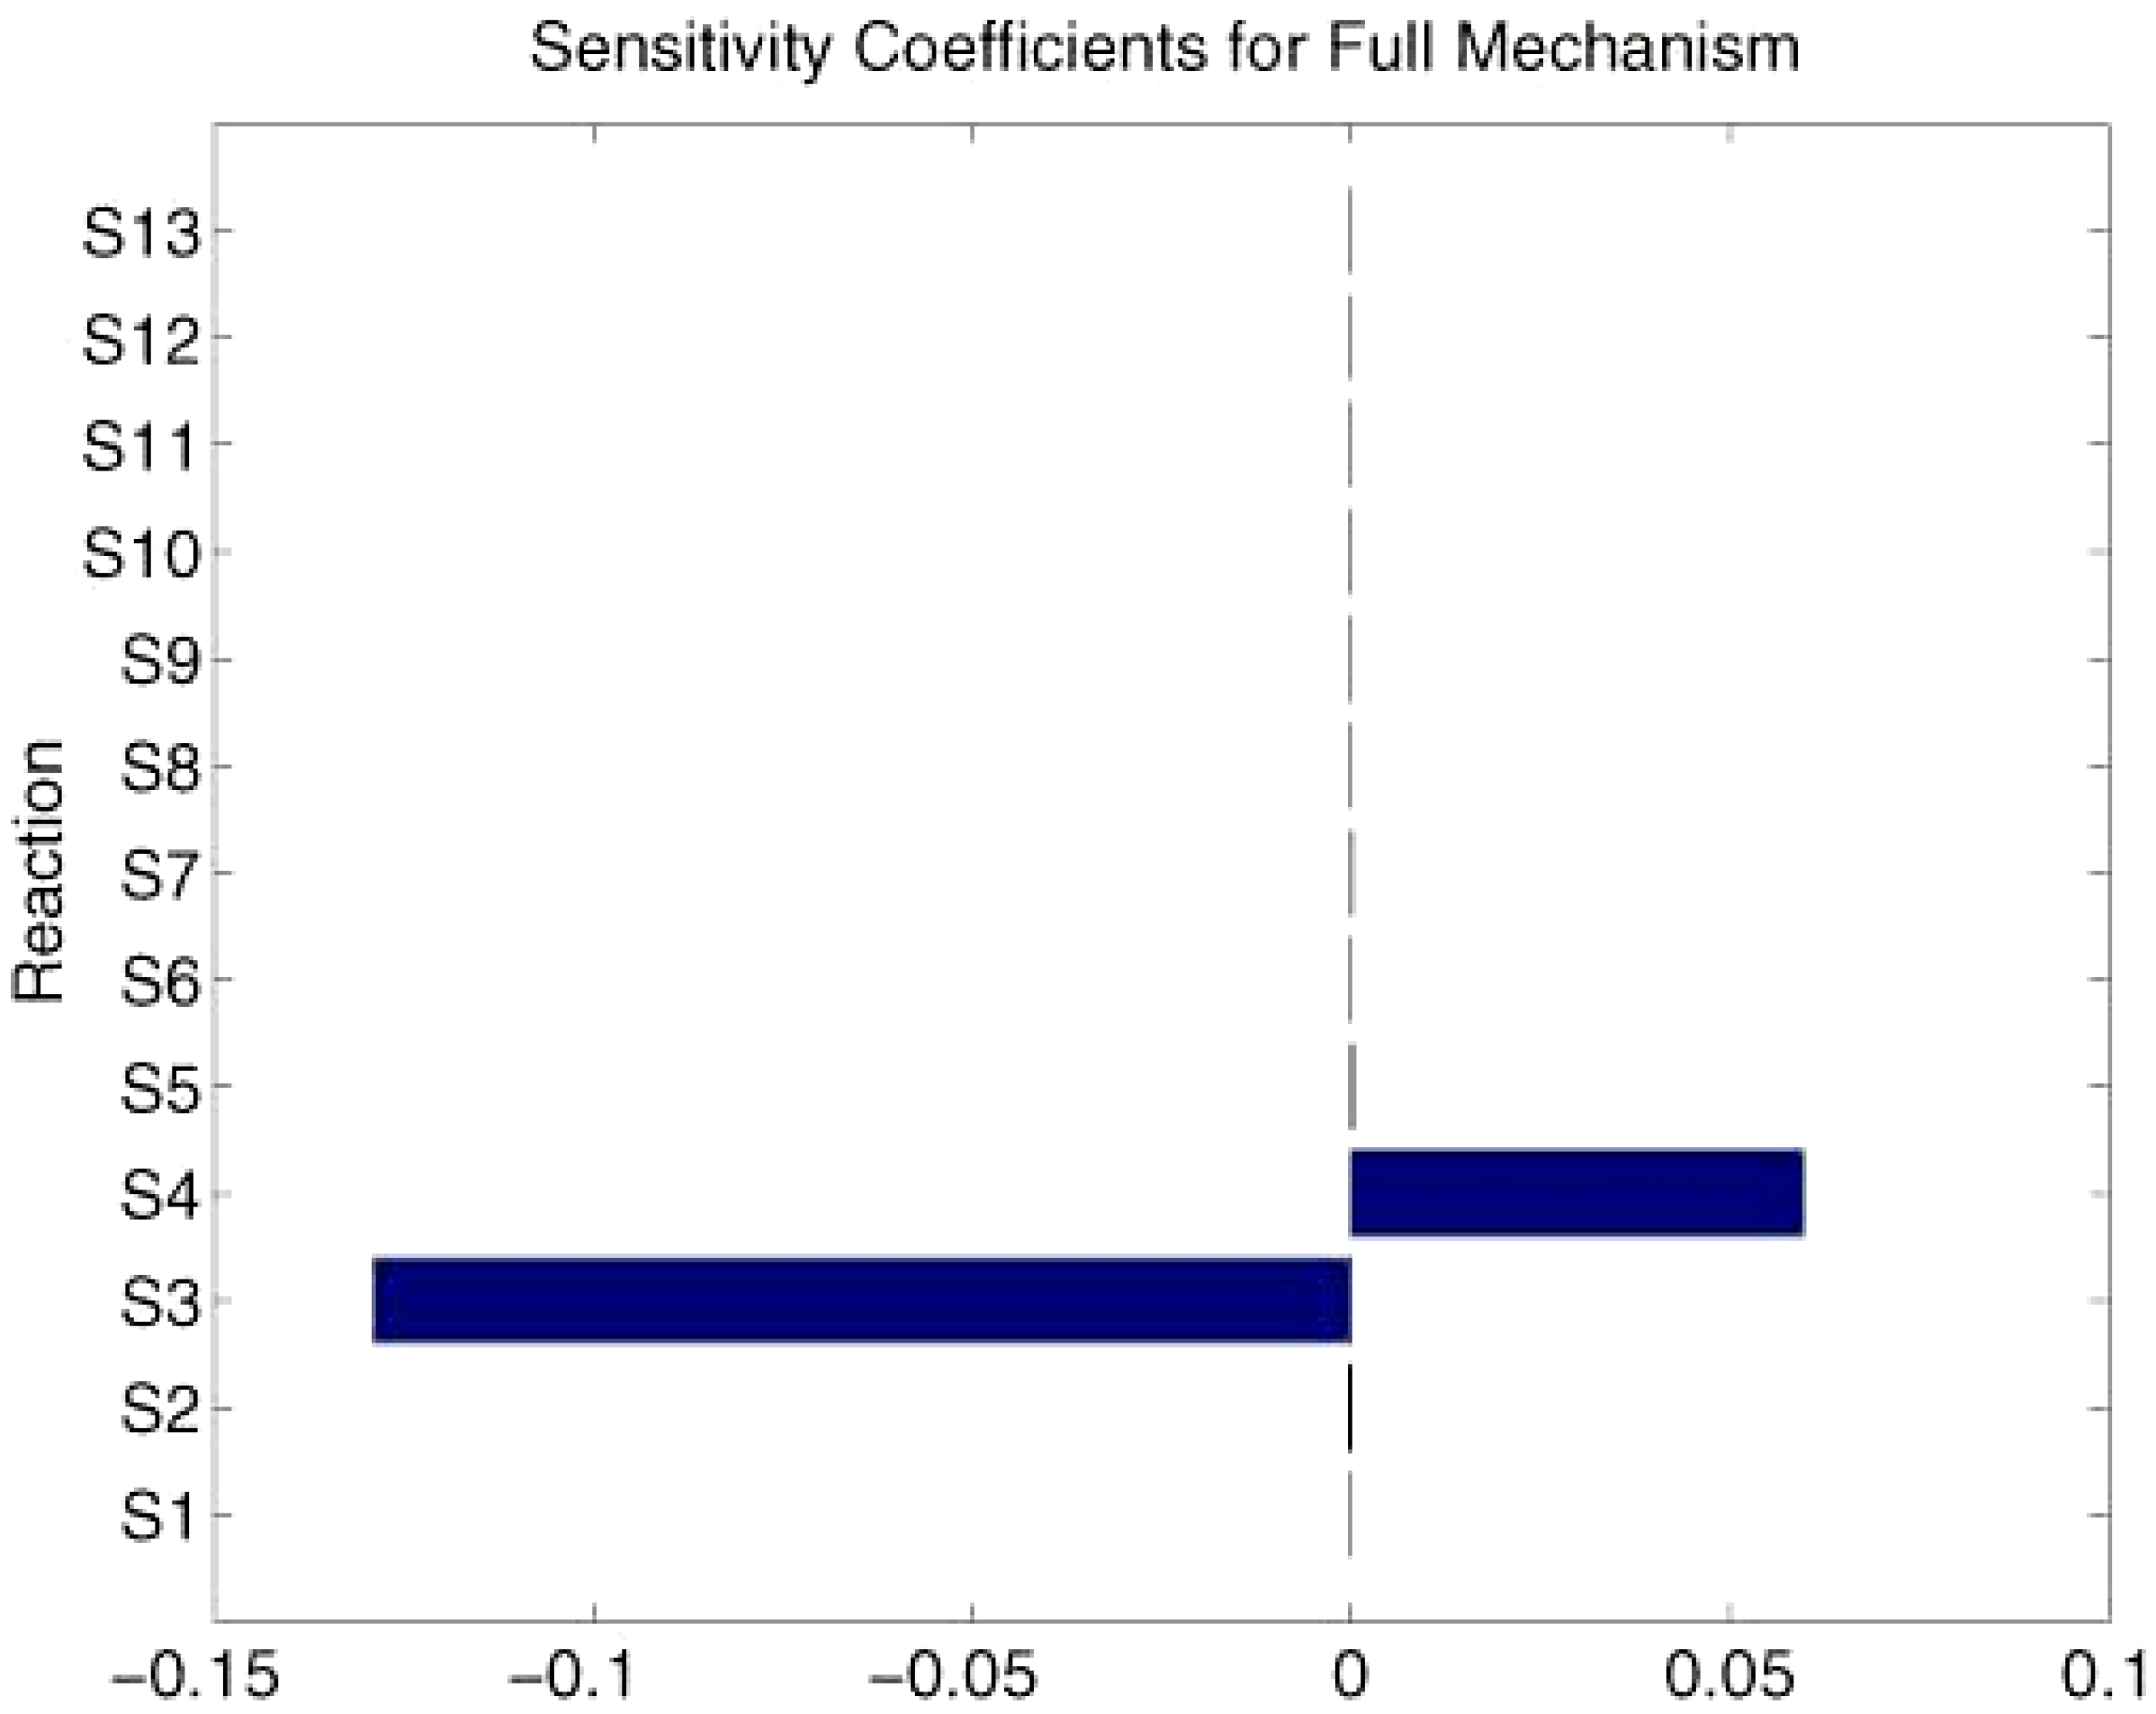
Sensitivity analysis

Conclusions
Acknowledgement
References
- Försth, M.; Gudmundson, F.; Persson, J.; Rosén, A. Combustion and Flame 1999, 119, 144–153.
- Ljungström, S.; Hall, J.; Kasemo, B.; Rosén, A.; Wahnström, T. Journal of Catalysis 1987, 107, 548–556.
- Fogelberg, J.; Petersson, L.-G. Surface Science 1996, 350, 91–102.
- Johansson, M.; Ekedahl, L.-G. Applied Surface Science 2001, 173, 122–133.
- Nyberg, C.; Tengstål, C.G. Journal of Chemical Physics 1984, 80(7), 3463–3468.
- Zheng, G.; Altman, E.I. Surface Science 2000, 462, 151–165.
- Voogt, E.H. Palladium Model Catalysts. 1997, 51, Utrecht University, Utrecht, ISBN 90-393-1752-6.
- Sharpe, A.G. Inorganic Chemistry, 3rd ed.; Longman Scientific & Technical, Harlow, 1992; p. 224. [Google Scholar]
- Försth, M. Laser Diagnostics and Chemical Modeling of Combustion and Catalytic Processes; Department of Experimental Physics, 2001; Chalmers University of Technology and Göteborg University, Göteborg, ISSN 0346-718X. [Google Scholar]
- Coltrin, M.E.; Kee, R.J.; Evans, G.H.; Meeks, E.; Rupley, F.M.; Grcar, J.F. SPIN (Version 3.83): A Fortran Program for Modeling One-dimensional Rotating-Disk/Stagnation-Flow Chemical Vapor Deposition Reactors; 1991; Sandia National Laboratories, SAND91-8003, Albuquerque NM, Livermore CA. [Google Scholar]
- Kee, R.J.; Rupley, F.M.; Miller, J.A. Chemkin-II: A Fortran Chemical Kinetics Package for the Analysis of Gas Phase Chemical Kinetics; 1989; Sandia National Laboratories, SAND89-8009B, Albuquerque NM, Livermore CA. [Google Scholar]
- Coltrin, M.E.; Kee, R.J.; Rupley, F.M. SURFACE CHEMKIN (Version 4.0): A Fortran Package for Analyzing Heterogeneous Chemical Kinetics at a Solid-Surface-Gas-Phase Interface; 1991; Sandia National Laboratories, SAND90-8003C, Albuquerque NM, Livermore CA. [Google Scholar]
- Kee, R.J.; Dixon-Lewis, G.; Warnatz, J.; Coltrin, M.E.; Miller, J.A. A Fortran Computer Code Package for the Evaluation of Gas-Phase Multicomponent Transport Properties; 1986; Sandia National Laboratories, SAND86-8246, Albuquerque NM, Livermore CA. [Google Scholar]
- Kee, R.J.; Rupley, F.M.; Miller, J.A. The Chemkin Thermodynamic Data Base; 1987; Sandia National Laboratories, SAND87-8215B, Albuquerque NM, Livermore CA. [Google Scholar]
- Grcar, J.F. The Twopnt Program for Boundary Value Problems; 1992; Sandia National Laboratories, SAND91-8230, Albuquerque NM, Livermore CA. [Google Scholar]
- Zangwill, A. Physics at Surfaces, 1st ed.; Cambridge University Press, Cambridge UK, 1988. [Google Scholar]
- Chambers, A.; Fitch, R.K.; Halliday, B.S. Basic Vacuum Technology; IOP Publishing Ltd: Bristol, 1989; p. 14. [Google Scholar]
- Ljungström, S.; Kasemo, B.; Rosén, A.; Wahnström, T.; Fridell, E. Surface Science 1989, 216, 63–92.
- Meijere, A.D.; Kolasinski, K.W.; Hasselbrink, E. Faraday Discussions 1993, 96(18), 1–11.
- Elg, A-P.; Rosén, A. Applied Physics B 1997, 64, 573–578.
© 2001 by MDPI (http://www.mdpi.org).
Share and Cite
Johansson, Å.; Försth, M.; Rosén, A. The H2/O2 Reaction on a Palladium Model Catalyst Studied with Laser-Induced Fluorescence and Microcalorimetry. Int. J. Mol. Sci. 2001, 2, 221-229. https://doi.org/10.3390/i2050221
Johansson Å, Försth M, Rosén A. The H2/O2 Reaction on a Palladium Model Catalyst Studied with Laser-Induced Fluorescence and Microcalorimetry. International Journal of Molecular Sciences. 2001; 2(5):221-229. https://doi.org/10.3390/i2050221
Chicago/Turabian StyleJohansson, Åsa, Michael Försth, and Arne Rosén. 2001. "The H2/O2 Reaction on a Palladium Model Catalyst Studied with Laser-Induced Fluorescence and Microcalorimetry" International Journal of Molecular Sciences 2, no. 5: 221-229. https://doi.org/10.3390/i2050221