Article

Electrical Conductivity along Phase Diagram of the Critical Mixture Isobutyric Acid – Water with Added (K+, Cl-) Ions

Laboratoire de Physique de la Matière Molle Département de Physique, Faculté des Sciences de Tunis, 1060 Tunisia
*
Author to whom correspondence should be addressed.
Int. J. Mol. Sci. 2003, 4(6), 326-334; https://doi.org/10.3390/i4060326
Submission received: 16 January 2003 / Accepted: 16 April 2003 / Published: 31 May 2003

Abstract

:
Three systems, isobutyric acid – water (I–W), “(I-W) + 5 10-4 M (KCl)” and “(I-W) + 5 10-3 M (KCl)”, have been studied by measuring the electrical conductivity σ (Ω‑1cm‑1) along the coexistence curve in a single phase, as a function of the variations temperature T and composition X in acid. The coefficient σ is a temperature dependent parameter for ions, increasing as temperature is elevated. Contrary to the visconty, the electrical conductivity does not show any anomaly in the critical region.

Introduction

Much attention has been recently [1,2] focused on the critical behavior of the binary-fluid isobutyric acid-water (I-W) with added ions (K+, Cl-).We have performed the first precise measurements of the coexistence curve of this mixture (I-W) near its consolute point in the presence of various amounts of KCl salt. We have detect a difference in the critical temperature Tc when the salt is added, the shift of Tc is positive and is dependent on the number of the (KCl) mol (M) per kilogram of mixture. The coexistence curve of the electrolyte mixture takes a new shape and is characterized by a new effective critical exponent β* = (0.266-0.293). The value obtained for β* is outside of the field of the Fisher renormalized value. β* = β /(1-α ) ≈ 0.365, where α = 0.11 is the specific heat exponent and β = 0.325 with 3D Ising value [3].
The purpose of this work is to study the electrical conductivity of this electrolyte “(I-W) + (KCl)” in the single phase of its coexistence curve. The temperature was used as the control parameter to approach the transition temperature Tt. The conductivity has been studied in the past in aqueous and poorly conductivity non aqueous critical solutions. This paper is organized as follows: Section 2 shows a rapid survey of the theoretical situation of the coexistence curves. The experimental methods used in this work are discussed in section 3. The data collection and analysis techniques we used are treated in section 4 and conclusion are given in section 5.

The Coexistence Curves and the Transition Temperature

In binary mixtures, the parameter M can be chosen as the difference M u , l = y u , l y c of the composition difference of one component between the upper (u) or lower (l) phases of one component and its critical value β*. The superscripts (u) or (l) refer to the phase above or below the meniscus in the earth’s gravity field .We write the reduced temperature as t = 1-T/TC. The composition y of one component can be written as [4]:
y u , l = y c ± B   t β ( 1 + b 1 t Δ ) + F y t + G y t 1 α + H y t 2 β + ...
The sign ± corresponds to the phases upper (u) or lower (l).
In equation (1), the fraction y c is the critical composition, B is the coexistence curve amplitude, b1 is the first order correction to scaling amplitude .Fy, Gy, Hy are no universal amplitudes.
Generally, the accuracy is not good enough to distinguish between the behaviors t, t 1 α = t 0 . 89 , t 2 β = t 0 . 65 . Therefore, one can introduce an effective exponent ω with amplitude Ey, whose range will be ω = [0.5,1] .The equation (1) can be rewritten,
y u , l = y c ± B t β ( 1 + b 1 t Δ ) + E y t ω
Then, the prediction for the coexistence curve involves a power law near Tc with the exponent β, plus no analytical corrections [5,6] ,far from TC the whole enabling the composition difference of one component between the upper (u) and lower (l) phases to be exposed as:
| y l y u | = B t β ( 1 + b 1 t 0 . 5 + b 2 t + ...... )
The coexistence curve diameter is expected to deviate from the usual linearity governed by the critical exponent α 0.1 of the specific heat, and whose equation is defined as:
y l + y u 2 = y c + a 1 t + a 2 t 1 α + ....
B, b1, b2, yc, a1 and a2 are temperature independent. (3) and (4) can be readily obtained from:
| y y c a 1 t a 2 t 1 α | = B 2 t β ( 1 + b 1 t 0 . 5 + b 2 t + ... )
where y = yl or yu .The method involves the measurements of the phase separation temperature Tt, i.e., the temperature where the meniscus becomes visible, in several samples of different compositions. When the composition is critical, the meniscus appears roughly in the middle of the sample, and is displaced either higher or lower if it is not critical .When Tt is in the neighborhood of the phase transition, the main problem of this method “the visual method “, is that the meniscus takes place in about three hours. Gravity effects [7] can also cause experimental artifacts. Clearly, critical opalescence is not a difficulty in this mixture, where the problem is rather of seeing the meniscus, which is possible only if special care is taken .The electrical conductivity σ ( Ώ-1cm-1 ) is measured in a single phase region for each temperature T above the phase separation temperature Tt and for a composition X of the isobutyric acid, governing the coexistence curve of the mixture.

The transition temperature Tt

In order to determine the transition Tt, we proceeded as follows: The sample was rigorously shaken and heated before being introduced into the bath at temperature T1. If the meniscus was visible, then T1 < Tt, the temperature of the bath was increased to T2, and the same operation was repeated. If the meniscus was not visible, the temperature of the bath was lowered to T3, while shaking the sample. This method allows Tt to be delimited by T+ > Tt and T- < Tt. When T+ – T- ≅ 2 10-3 K, we stopped the operation and verified that after having heated and vigorously shaken.
The sample outside the bath, the meniscus was again visible at T- and not visible at T+. During the course of taking this data, it came to our attention that the critical separation temperature is strongly dependent on the added (KCl) salt.

Experimental Details

The isobutyric acid was provided by Riedel de Haen. The purity was stated to be 99.99 mol %. The main impurity is probably water. The water was obtained from deionized and tridistilled operations, and had a specific conductivity of about 10-6-1 cm-1.These gave a critical separation temperature, which is a good indication of purity, of 26.945C° which compares favourably with 26.948 °C for the data of ref [8].The guaranteed purity of the (KCl) salt (Merck product) is better than 99.5 %.In this mixture, this salt can be dissolved in totality. All electrolytes were prepared from weighed amounts of the pure components. The weight was obtained with a resolution of 0.1mg.We chose the mixture of isobutyric acid and water (I-W) for the following reasons: (i) in this mixture, the (KCl) salt can be dissolved in totality; (ii) since their component densities are very close to each other, this mixture does not have density gradients induced by gravity. Measurements have been performed with a commercial conductivity meter (Knick). The conductivity of fluid is measured between the electrode support and sleeve tube. This apparatus needs to be carefully calibrated with electrolytes of known conductivity. The conductivity measurements are believed to reproducible to 0.01% 10-3 Ώ-1cm-1. The cell containing the solution was immersed in thermally stabilized water bath with thermal regulation of the order of 1 m K over hours. The temperature was measured using a quartz thermometer giving a resolution of ± 2 mK, and which was calibrated on, an absolute scale within 0.01 K.

Electrical conductivity measurement

The electrical conductivity measurements were carried were carried out using a knick conductometer, with a conductivity cell consisting of fixed spacing stainless-steel circular electrodes. The cell had a conductivity constant of 41 cm-1 when filled with 100 ml of the sample. The cell constant changed by no more than 0.1%. The calibration of the cell was made by using liquids of known electrical conductivity of with NaCl solid. The relative measurement of temperature in the cell can verified as the second electrode which detected the numerical value within 0.02°C.The temperature difference between the cell and the bath doesn’t exceeded than 0.03°C. The temperature of the cell was varied from to T-Tt = 0.05°C in steps of 0.20°C and the over all accuracy of the temperature determination was 0.02 °C.

Data Collection and Analysis

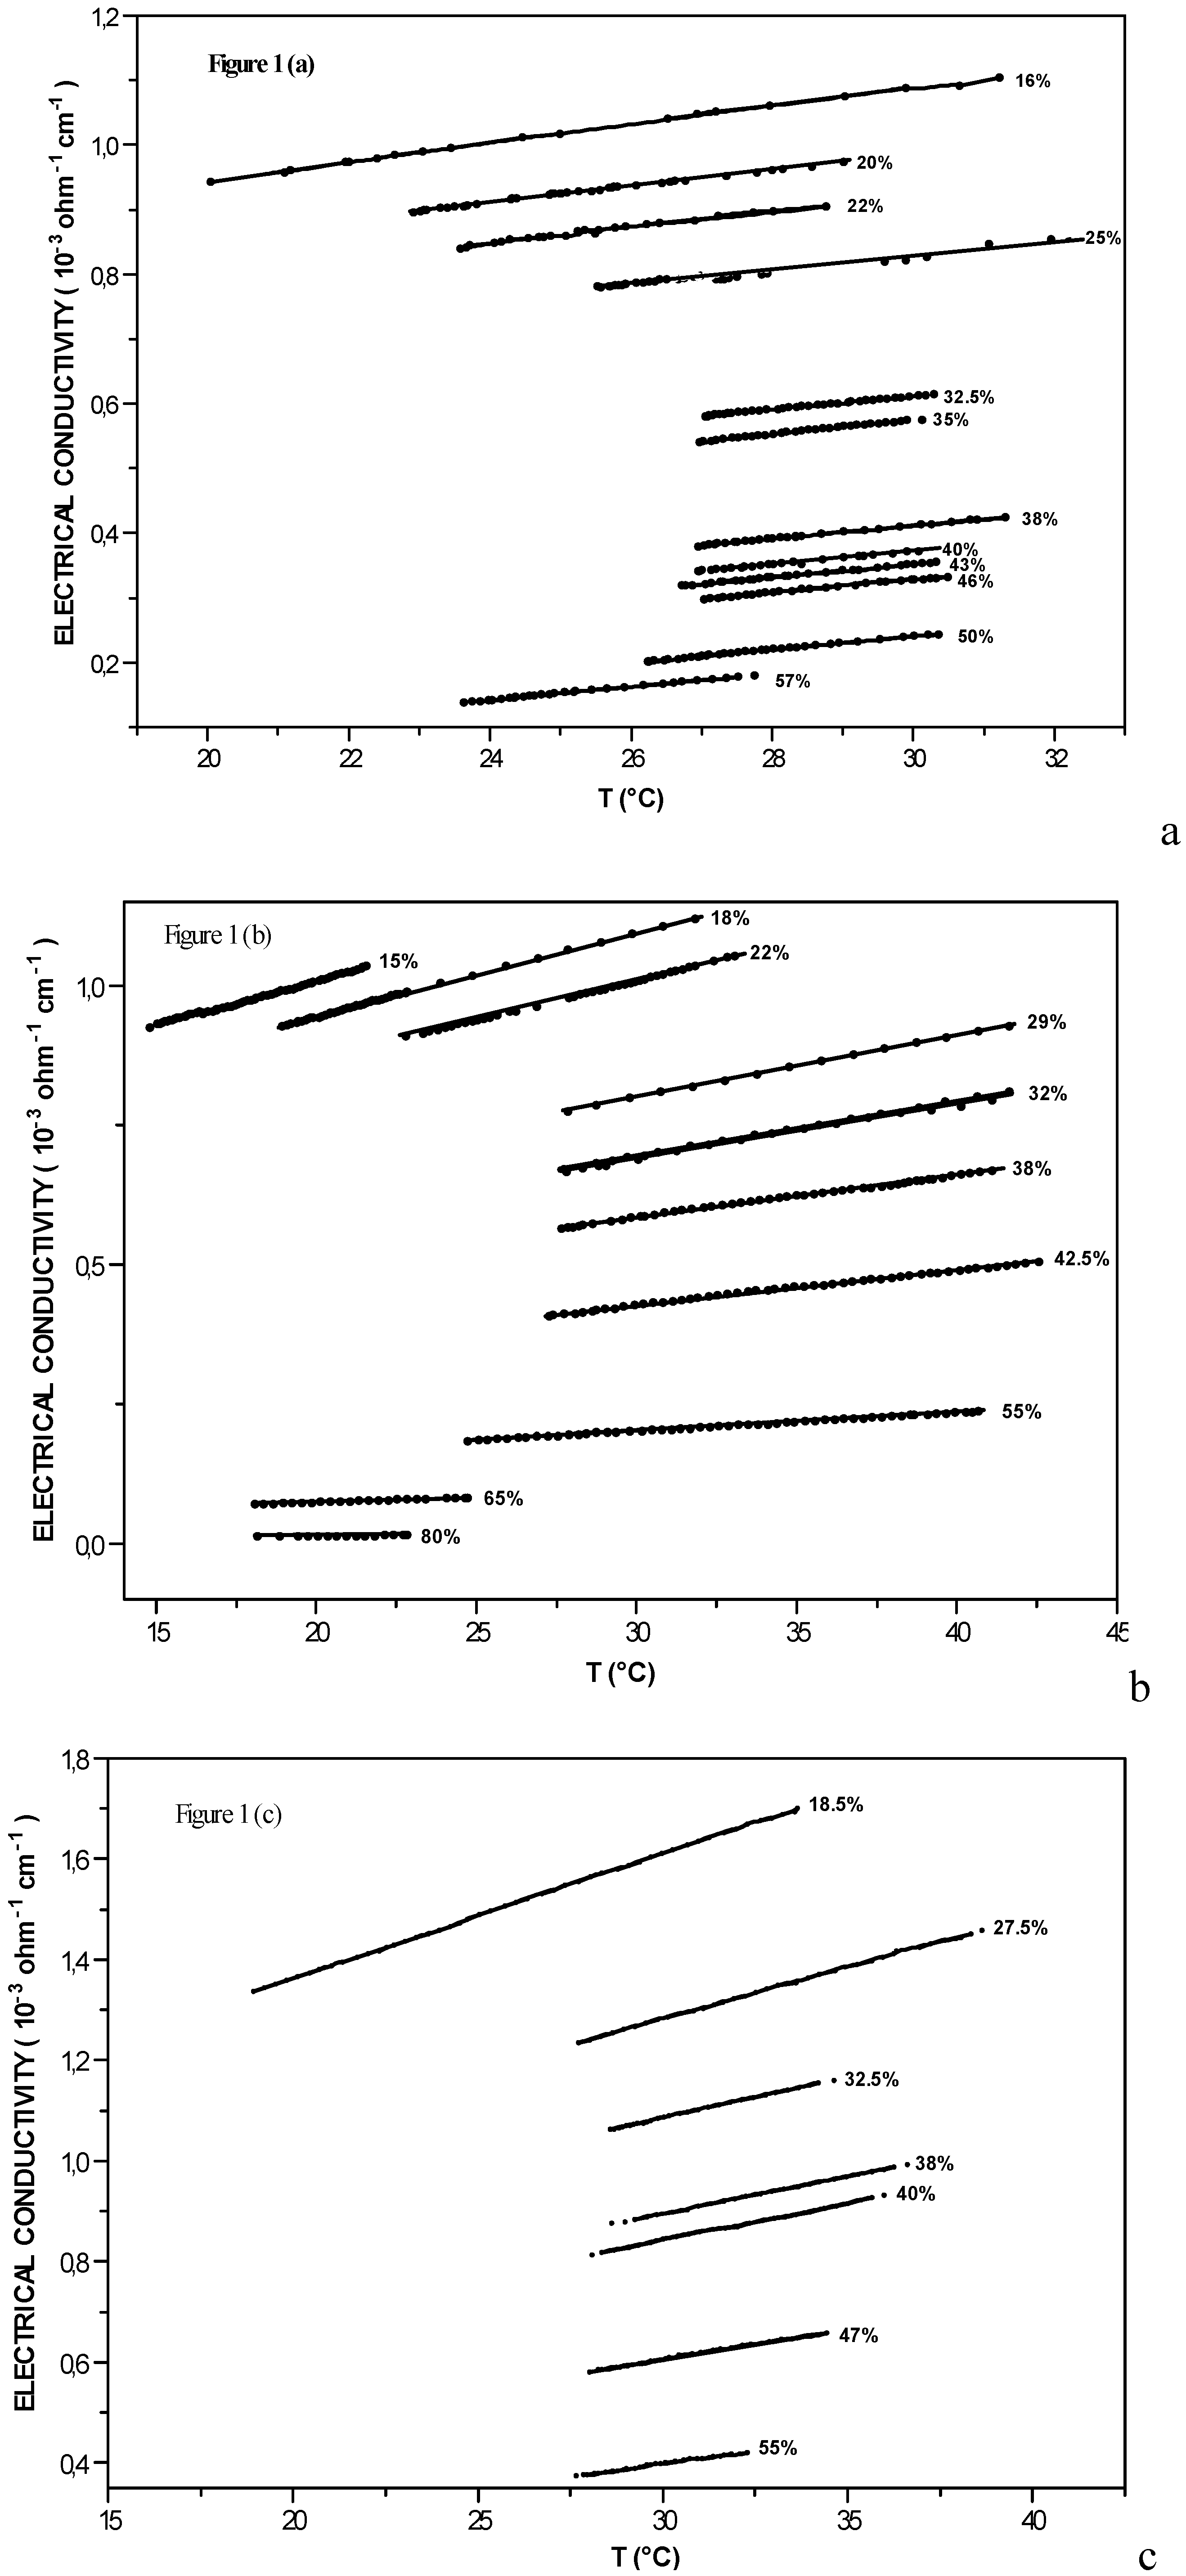
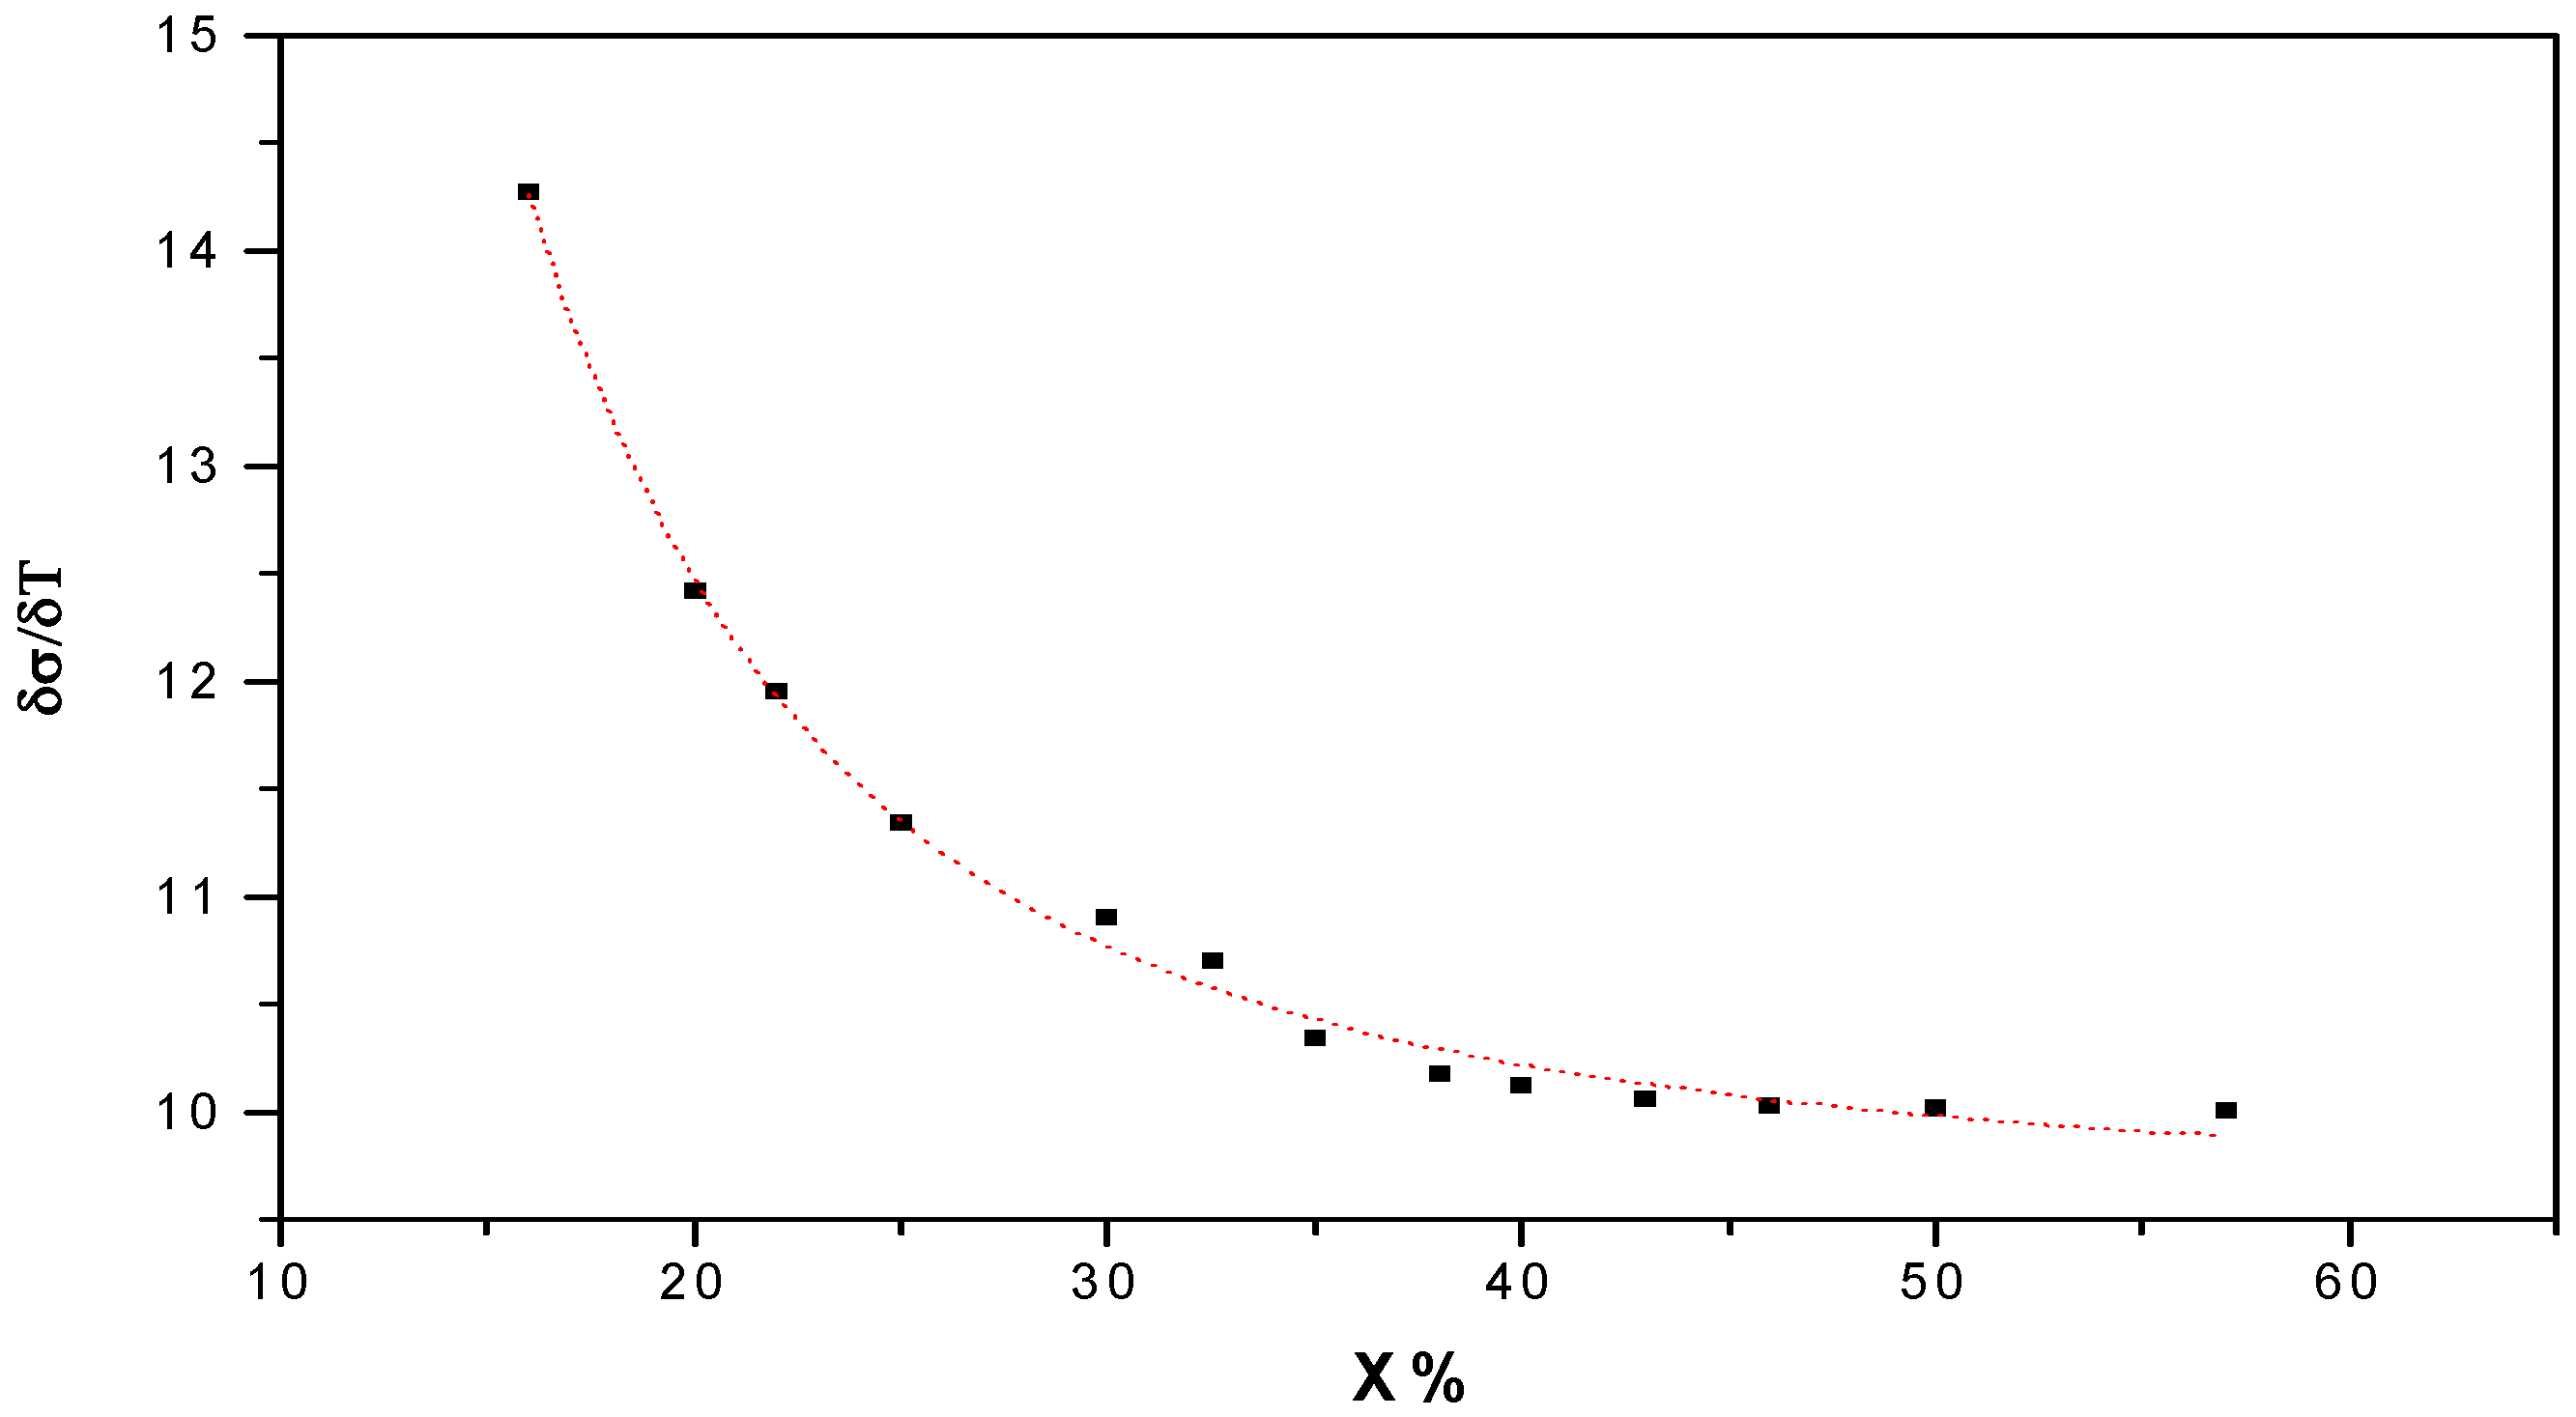
Electrical conductivity along the coexistence curve

We measured the electrical conductivity of three different solutions: (I-W), (I-W)+510-4 M [KCL] and (I-W) +510-3 M [KCL], with versus temperature above the separation temperature Tt at each concentration X of the isobutyric acid along the coexistence curve .The conductivity data for these solution are shown in Fig 1.(a, b, c) . The data cover a good range of temperature above Tt. The lower limit was considered adequate for the main purpose of this study. Data were taken at the higher temperature in order to establish the temperature dependence of these transport properties well away from Tc, the separation temperature for the critical concentration Xc, Tc= Tt (X=Xc). The critical concentration Xc and temperature Tc were taken in weight percent in isobutyric acid to:
Isobutyric acid – water (I-W) : Xc = 38.00 ; Tc = 26.945°C
(I-W) + 5 10-4 M [KCl] : Xc = 39.90 ; Tc = 27.085°C
(I-W) + 5 10-3 M [KCL] : Xc = 42.63 ; Tc = 28.488°C
The critical temperature Tc and the critical composition Xc increased linearly with the salt concentration. The effect of KCl salt on the shift of the critical point of this mixture (I-W), was extensively studied in a previous work [1].
Figure 1. Temperature dependence of electrical conductivity along the coexistence curves in the single phase region of isobutyric acid–water (I-W): a)(I-W); b)(I-W) + 5 10-4 M [KCl]; c) (I-W) + 5 10-3 M [KCl].
Ijms 04 00326 g001
For each composition X of the acid, the plot of electrical conductivity σ (Ω-1cm-1) versus the temperature T should be a straight line of slope Ax (fig.1). Accordingly, the electrical conductivity σ (Ώ-1cm-1 ) is analytically represented by:
σ = Ax T + σx
where Ax and σx are functions of the composition x in isobutyric acid along the coexistence curve. The coefficient σx is the limit of electrical conductivity σ at the phase separation temperature Tt. This result is interesting, showing the linearity of the electrical conductivity with temperature. In this case the electrical conductivity does not exhibit any critical anomaly and it presents a regular behavior. In order to fit the data according to equation (6), we used the program origin 3.5. The results of this fit are given in Table 1.
Table 1. Results of fitting of data from figure 1 using relation (6). The parameter values of Ax and σx are expressed in Ω-1cm-1K-1 and Ω-1cm-1 respectively. Tt is the experimental transition temperature of each composition X % in isobutyric acid.
X% in acid(I-W)(I-W) + 5 10-4 M [KCl](I-W) + 5 10-3 M [KCl]
Tt (°C)σxAx10+3Tt (°C)σxAx10+3Tt (°C)σxAx10+3
15 15.063-3.5815.68
1619.992-3.2314.27
18 18.820-3.4815.09
18.5 17.125-5.9124.82
2022.842-2.7812.42
2223.527-2.8511.9622.710-3.2914.18
2525.547-2.5811.34
27.5 - 26.649-4.9320.51
29 26.353-2.5611.09
3026.930-2.2610.9
32 27.014-2.319.9
32.527.057-2.4610.7 28.021-3.8816.39
3526.962-2.7910.34
3826.945-2.6710.1727.356-1.697.5228.516-3.5814.78
4026.904-2.6610.12 28.091-3.6114.1
42 27.018-1.466.24
4326.841-2.7210.06
4626.750-2.7110.03
47 28.012-3.1412.37
5026.217-2.8810.02
55 24.803-0.8713.5227.645-2.7210.31
5723.520-2.8310.01
62.5 21.984-1.01
65 14.390-0.461.84
Table 1 deserves some comments:
-The results of the work show that in the neighbourhood of the transition temperature Tt, the electrical conductivity σ does not show any anomaly, where as the transport properties of ions in binary liquids exhibit intriguing anomalies near a consolute critical point [9].
-The coefficient Ax of Eq.6 shows two distinct domains for the composition X for the system (I-W). The region 1 with X ≤ 26% has a composition which is poor in acid. the average of Ax is around 13.51 μΩ-1cm-1K-1.The region 2 with X ≥ 26% has a composition which is rich in acid . The coefficient of Ax is around 10.31 μΩ-1cm-1K-1.
-When the KCl salt is added at the concentration 5 10-4 and 5 10-3 mol per kilogram of mixture, Ax is higher in the first region than in the system without ions. This increasing is due to the solvatation of ions by water. For X=22%; we have:
Ax (I-W) =11.96 μΩ-1cm-1K-1 and Ax (I-W +510-4 M [KCl] ) =14.18 μΩ-1cm-1K-1 . It is obvious, the electrical conductivity depends well of solvation phenomenon in binary fluid [10]. However, the coefficient Ax can be determined by the derivation of σ, according to :
Ax=(∂σ/∂T)x
This has given us a possibility to build the two graphs of fig. 2 and fig. 3, presenting the behavior of the derivative ∂σ/∂T with the composition X of the acid isobutyric.
Figure 2 presents our experimental data for the derivation ∂σ/∂T as a function of X(%) in acid of the pure system (I-W) without ions (K+, Cl-). The composition X has a significant effect on ∂σ/∂T. The thermal derivative decreases rapidly as X increases. A very good fit to our experimental results is obtained (dashed line in fig. 2). The derivation ∂σ/∂T can be related to the composition X by the equation:
σ T = ( σ T ) 0 + 2 A B π B 2 + 4 ( X Y ) 2
Figure 2. Thermal derivative ∂σ/∂T vs composition X of acid for the mixture isobutyric acid – water (I-W). Dashed line represents the theoretical behavior, in the poor region of acid, ∂σ/∂T decreases rapidly.
Ijms 04 00326 g002
Figure 3. Thermal derivative ∂σ/∂T as a function of X composition in acid, showing the influence of the concentration of (K+, Cl-) ions.
Ijms 04 00326 g003
Parameters (∂σ/∂T)0, A, B and Y are normalized by the fit as : (∂σ/∂T)0 = 9.603 Ω-1cm-1K-1; A = 357.158 and B = 3.686 ; Y = 5.035.
Figure 3 shows the influence of the KCl salt on the thermal derivative of the electrical conductivity ∂σ/∂T which increases with the concentration of ions (K+, Cl-). For the critical composition Xc, we have the following comparison:
(i)
( ∂σ/∂T )(I-W) + 5 10-4 M [KCl] = 7.52 10-3-1cm-1K-1
(ii)
( ∂σ/∂T )(I-W) + 5 10-3 M [KCl] = 14.78 10-3-1cm-1K-1
However, the dependence of ionic concentration of (K+, Cl-) on the derivative ∂σ/∂T can be seen clearly in figure 3. Also ∂σ/∂T decreases when the composition X of the isobutyric acid is elevated.

Conclusion

This study shows that the electrical conductivity is a temperature dependent parameter for ions, increasing as temperature is elevated. In the temperature range T- Tt ≥ ( 7-8 ) K, the measurements are reproductible by either increasing or decreasing the temperature. Along the phase diagram, in the single phase and near the critical line the electrical conductivity does not exhibit any anomaly, but it depends well of the molecular composition of the medium. The adding of the (K+, Cl-) ions shifts the critical point (Xc ,Tc ) and has an important influence in the increasing of the electrical conductivity. It would be interesting to extend this study to other kinds of ions.

References

  1. Toumi, A.; Bouanz, M. Critical behavior of the binary-fluid isobutyric acid-water with added ions (K+, Cl-). Eur. Phys. J. 2000, E 2, 211–216. [Google Scholar]
  2. Toumi, A.; Bouanz, M.; Gharbi, A. Coexistence curves of the binary mixture isobutyric acid-water with added ions (K+, Cl-). Chem. Phys. Lett. 2002, 362, 567–573. [Google Scholar] [CrossRef]
  3. Leguillou, J. C.; Zinn-Justin, J. Critical exponents from field theory. Phys. Rev. 1981, B21, 3976–3998. [Google Scholar]
  4. Green, M. S.; Ley-Koo, M. Phys. Rev. 1981, A23, 2650.
  5. Wegner, F. J. Corrections to scaling laws. Phys. Rev. 1972, B5, 4529–4536. [Google Scholar] [CrossRef]
  6. Beysens, D.; Bourgou, A.; Calmettes, P. Experimental determination of universal amplitude combinations for binary fluids. I. Static. Phys. Rev. 1982, A29, 3589–3609. [Google Scholar] [CrossRef]
  7. Hohenberg, P. C.; Bartmatz, M. Gravity effects near the gas-liquid critical point. Phys. Rev. 1972, A46, 289–313. [Google Scholar] [CrossRef]
  8. Bouanz, M.; Beysens, D. Effect of ion impurities on a binary mixture of isobutyric acid and water. Chem. Phys. Lett. 1994, 231, 105–110. [Google Scholar] [CrossRef]
  9. Bouanz, M. Critical behavior of the self-diffusion coefficient in a binary fluid. Phys. Rev. 1992, A46, 4888–4893. [Google Scholar] [CrossRef]
  10. Bouanz, M. The solvation phenomenon in a binary fluid. Quimica Analitica 1996, 15. SS (30-33). [Google Scholar]

