Article

Nucleic Acid Quadratic Indices of the “Macromolecular Graph’s Nucleotides Adjacency Matrix”. Modeling of Footprints after the Interaction of Paromomycin with the HIV-1 Ψ-RNA Packaging Region

by
Yovani Marrero Ponce
1,2,*,
Delvin Nodarse
1,
Humberto González Díaz
2,3,
Ronal Ramos De Armas
2,
Vicente Romero Zaldivar
4,
Francisco Torrens
5 and
Eduardo A. Castro
6
1
Department of Pharmacy, Faculty of Chemical-Pharmacy. Central University of Las Villas, Santa Clara, 54830, Villa Clara, Cuba
2
Department of Drug Design, Chemical Bioactive Center. Central University of Las Villas, Santa Clara, 54830, Villa Clara, Cuba
3
Department of Organic Chemistry, Faculty of Pharmacy, University of Santiago de Compostela, 15706, Spain
4
Faculty of Informatics. University of Cienfuegos, Cienfuegos, Cuba
5
Institut Universitari de Ciència Molecular, Universitat de València, Dr. Moliner 50, E-46100 Burjassot (València), Spain
6
INIFTA, División Química Teórica, Suc.4, C.C. 16, La Plata 1900, Buenos Aires, Argentina
*
Author to whom correspondence should be addressed.
Int. J. Mol. Sci. 2004, 5(11), 276-293; https://doi.org/10.3390/i5110276
Submission received: 28 January 2004 / Revised: 9 November 2004 / Accepted: 10 November 2004 / Published: 30 November 2004

Abstract

:
This report describes a new set of macromolecular descriptors of relevance to nucleic acid QSAR/QSPR studies, nucleic acids’ quadratic indices. These descriptors are calculated from the macromolecular graph’s nucleotide adjacency matrix. A study of the interaction of the antibiotic Paromomycin with the packaging region of the RNA present in type-1 HIV illustrates this approach. A linear discriminant function gave rise to excellent discrimination between 90.10% (91/101) and 81.82% (9/11) of interacting/non-interacting sites of nucleotides in training and test set, respectively. The LOO cross-validation procedure was used to assess the stability and predictability of the model. Using this approach, the classification model has shown a LOO global good classification of 91.09%. In addition, the model’s overall predictability oscillates from 89.11% until 87.13%, when n varies from 2 to 3 in leave-n-out jackknife method. This value stabilizes around 88.12% when n was > 3. On the other hand, a linear regression model predicted the local binding affinity constants [log K (10−4M−1)] between a specific nucleotide and the aforementioned antibiotic. The linear model explains almost 92% of the variance of the experimental log K (R = 0.96 and s = 0.07) and LOO press statistics evidenced its predictive ability (q2 = 0.85 and scv = 0.09). These models also permit the interpretation of the driving forces of the interaction process. In this sense, developed equations involve short-reaching (k ≤ 3), middle-reaching (4 < k < 9) and far-reaching (k = 10 or greater) nucleotide’s quadratic indices. This situation points to electronic and topologic nucleotide’s backbone interactions control of the stability profile of Paromomycin-RNA complexes. Consequently, the present approach represents a novel and rather promising way to chem & bioinformatics research.

Introduction

High throughput genome sequencing projects are producing an enormous amount of raw sequence data. All this data begs for methods that are able to synthesize the information into biological knowledge [1]. Public databases such as GenBank are growing in size at an exponential rate [2]. A significant proportion of the data corresponds to genomic sequences containing the structures not only of many genes but also of RNA.
The amount of new genome data has dramatically increased in recent years and it has once again brought to the forefront the question of protein and nucleic acid functions [3]. In this respect, the use of footprint techniques has proven to be an important experimental method for the discovery of significant processes in molecular biology and the field of genomics [4,5,6,7,8]. These experimental techniques permit quantitatively analyze D(R)Nase footprinting data for drugs interacting with D(R)NA obtaining apparent binding constants from the spot intensities appearing on the footprinting autoradiogram [9]. The study of the interactions of drugs with biomolecules is now the hot topic in modern bioinformatics. This kind study constitutes a significant step towards rational drug design.
The interactions between aminoglycosides and the packaging region of type-1 HIV (Human Immunedeficiency Virus) appear to represent a promising route for antiviral discoveries [10]. Aminoglycoside drugs are cationic natural products that interact with RNA [11]. The bactericidal effects inherent in these compounds stem from their ability to block protein synthesis by binding to the A-site on ribosomal RNA [12]. In fact, aminoglycoside analogues can be used to treat certain diseases. For example, the genetic information in human immunodeficiency virus and various tumour viruses is in the form of RNA [13]. Since the genomes of these viruses are likely to have unique structures, it may be possible to design agents that selectively block virus proliferation by targeting a specific site on RNA [14].
One of the present authors has recently introduced the novel computer-aided molecular design scheme TOMOCOMD (acronym of TOpological MOlecular COMputer Design). It calculates several new 2D/3D families of total and local (atom and atom-type) topologic and stochastic molecular descriptors, such as quadratic and linear indices; defined by analogy with the quadratic and linear mathematical maps [15,16]. This point of view was very recently successfully applied to the prediction of physical properties and Caco-2 permeability of organic compounds and drugs, respectively [15,16,17,18]. Interestingly, molecular quadratic indices can be generalized to allow the codification of 3D-structural features [19].
Therefore, describing an extended TOMOCOMD-CANAR approach to account for RNA structure constitutes the main aim of this paper. In the present study, we propose a total and local definition of nucleic acid quadratic indices of the “macromolecular graph’s nucleotides adjacency matrix”. The other objective of the present work focused on deriving quantitative structure property relationships to predict the probability and the affinity with which paromomycin bind to the HIV-1 Ψ-RNA packaging region.

Materials and methods

Computational Methods

A nucleic acid is a long, unbrached polynucleotide – that is, a polymer consisting of nucleotides. Each nucleotide has the three following components: 1) A cyclic five-carbon sugar, 2) a purine o pyrimidine base attached to the 1’-carbon atom of sugar by N-glycoside bond, and 3) A phosphate attached to the 5’-carbon of the sugar by a phosphoester linkage. The nucleotides in nucleic acids are covalently linked by a second phosphoester bond that joins the 5’-phosphate of one nucleotide and the 3’-OH group of the adjacent nucleotides. The purine and pyrimidine bases are not engaged in any covalent bonds to each other. Thus, a polynucleotide consists of an alternating sugar-phosphate backbone and each nucleotide is characterized by the base attached to it, which can be either adenine (A), cytosine (C), guanine (G) or thymine (T) [RNA molecule contains the base uracil (U) instead of T]. Consequently, a RNA molecule is uniquely determined by the sequence of bases along its chain, and it has a definite orientation [20,21,22,23].
In particular, a typical RNA is the single-stranded polyribonucleotide. This macromolecule has a folded 3D conformation that is held together in part by noncovalent base-pairing interactions like those that hold together the two stands of the DNA helix. In the single-stranded RNA molecule, however, the complementary bases pairs form between nucleotides residues in the same chain, which causes the RNA molecule to fold up in a unique way that is important for its biochemical activity. In this sense, the RNA structure contains several sets of unpaired nucleotide residues. Most of the weak interactions (hydrogen bonds) form between Watson-Crick complementary bases (between pairs of non-consecutive bases), i.e., between A and U and between C and G, but a far from negligible amount of bonds also form between other pairs of bases, as for example the G .U wobble pairs [20,21,22,23].
On the other hand, the general principles of the molecular quadratic indices of the “molecular pseudograph`s atom adjacent matrix” for small-to-medium sized organic compounds have been explained in some detail elsewhere [15,16,17,18,19]. However, this work gives an extended overview of this approach.
First, in analogy to the molecular vector X used to represent organic molecules, we introduce here the macromolecular vector (Xm). The components of this vector are numeric values, which represent a certain nucleotide residues (DNA-RNA bases) properties. These properties characterize each kind of nucleotides (purine and pyrimidine bases) within the nucleic acid, because the only uncommon part of these nucleotides is these bases. Such properties can be experimental molar absorption coefficient Є260 at 260 nm and PH = 7.0, first (ΔE1) and second (ΔE2) single excitation energies in eV, and first (f1) and second (f2) oscillator strength values (of the first singlet excitation energies) of the nucleotide DNA-RNA bases, and so on [24]. For instance, the f1(B) property of the DNA-ARN bases B takes the values f1(A) = 0.28 for adenine, f1(G) = 0.20 for guanine, f1(U) = 0.18 for uracil and so on [24]. Table 1 depicts nucleotides (bases) descriptors properties for the DNA-RNA bases.
Table 1. Five properties of DNA-RNA bases using as labels to characterize each nucleotide. Experimental molar absorption coefficient Є260 at 260 nm and pH=7.0, first (ΔE1) and second (ΔE2) single excitation energies in eV, and first (f1) and second (f2) oscillator strength values (of the first singlet excitation energies) of the nucleotide DNA-RNA bases [24].
Purine and pyrimidine bases (RNA/ADN)f1f2Є260/1000ΔE1ΔE2
Adenine   (A)0.280.5415.44.755.99
Guanine   (G)0.200.2711.74.495.03
Uracil     (U)0.180.39.94.816.11
Thymine   (T)0.180.379.24.675.94
Cytosine   (C)0.130.727.54.616.26
Thus, a RNA having 5, 10, 15,..., n nucleotides can be represented by means of vectors, with 5, 10, 15,..., n components, belonging to the spaces ℜ5, ℜ10, ℜ15,...,ℜn, respectively. Where n is the dimension of these real sets (ℜn). This approach allows us encoding RNA sequences such as AGUCACGUA through out the macromolecular vector Xm = [0.28, 0.20, 0.18, 0.13, 0.28, 0.13, 0.20, 0.18, 0.28], in the f1-scale (see Table 1). This vector belongs to the product space ℜ9. The use of other AND-ARN bases properties defines alternative macromolecular vectors.
For a given nucleic acid composed of nucleotides (vector ofn), the “macromolecular vector” (Xm) is constructed and the kth nucleic acid’s total quadratic indices, qk(xm) are calculated as quadratic forms as shown in Eq. 1:
q k ( x m )= i=1 n j=1 n a ij k X i m X j m
where, kaij = kaji (symmetric square matrix), n is the number of nucleotides of the nucleic acid, and mX1,…,mXn are the coordinates or components of the macromolecular vector (Xm) in a system of canonical basis vectors of ℜn. In this case, the canonical (‘natural’) base of ℜn {e1,…,en} is used as the form’s base. Thereafter, the coordinates of any vector Xm coincide with the components of this vector. For that reason, such coordinates can be considered as weights of the vertices (ADN-ARN bases) of the graph of the nucleic acid’s backbone. The coefficients kaij are the elements of the kth power of the macromolecular matrix M(Gm) of the nucleic acid’s graph (Gm). Here, M(Gm) = [aij], where n is the number of bases (nucleotides) in sugar-phosphate’s backbone. The elements aij are defined as follows:
aij = Pij if ij and ek ∈ E(Gm)
= 0 otherwise
Table 2. A close up to the mathematical definition of total (RNA fragment) and local (nucleotide) nucleic acid quadratic indices of the “macromolecular graph’s nucleotide adjacency matrix” of a RNA fragment.
Ijms 05 00276 i001
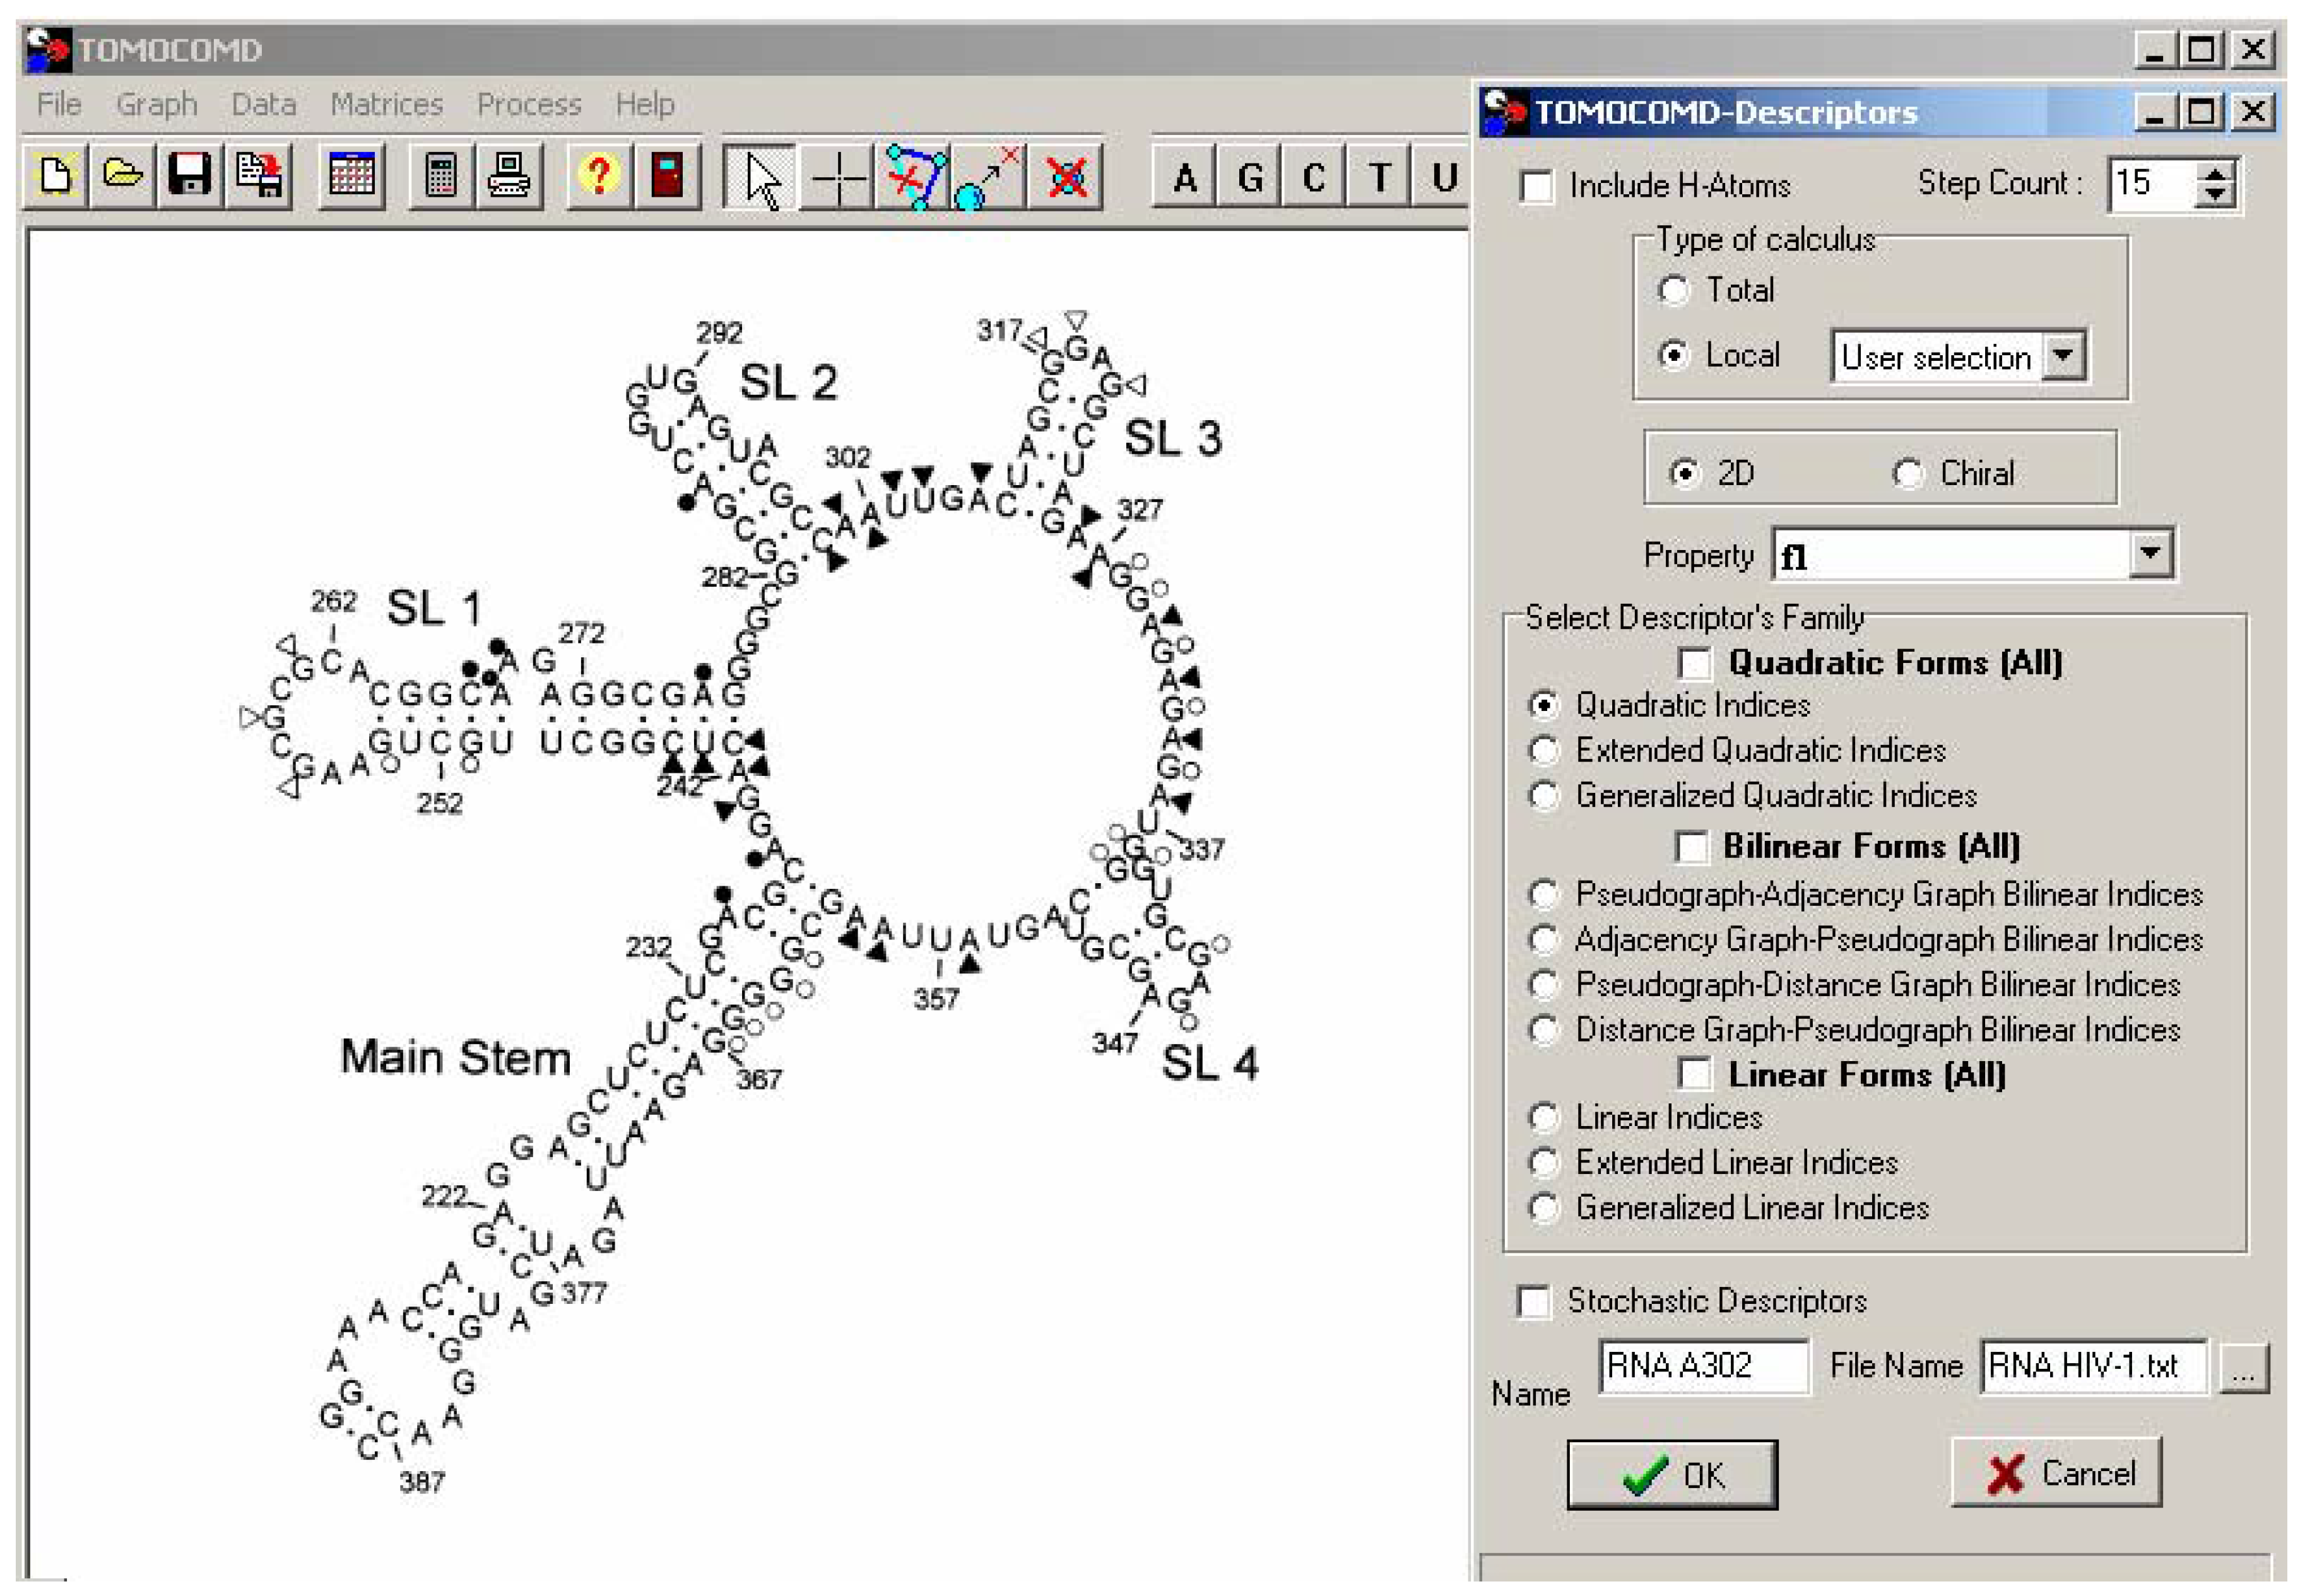
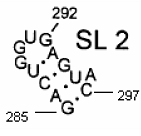
Secondary structure of an RNA fragment of the SL 2 motif (see Figure 1)
Ijms 05 00276 i002Macromolecular graph’s: an undirected graph with multiple edges GmXm = [G A C U G G U G A G U A C]; Xm ∈ℜ13 In the definition of Xm, as macromolecular vector, the symbol of the bases is used to indicate the corresponding AND-RNA bases property, for instance, f1. That is: if we write A it means f1(A), adenine first oscillator strength values or some bases property, which characterizes each nucleotide in the nucleic acid molecule. So, if we use the canonical bases of ℜ13, the coordinates of any macromolecular vector Xm coincide with the components of that macromolecular vector.
[Xm]t = [0.20 0.28 0.13 0.18 0.20 0.20 0.18 0.20 0.28 0.20 0.18 0.28 0.13]
[Xm]t: Transposed of [Xm] and it means the vector of the coordinates of Xm in Canonical base of ℜ13 (a row matrix)
[Xm]: vector of the coordinates of Xm in Canonical base of ℜ13 (a columns matrix)
Ijms 05 00276 i003
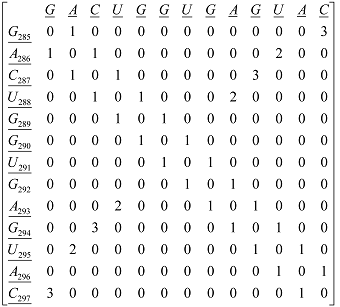
M1(Gm): Macromolecular graph’s nucleotide Adjacency Matrix
q 0 ( x m )= i=1 n j=1 n a ij 0 X i m X j m = [mX]tM0(Gm) [mX]
= 0.5662
q 1 ( x m )= i=1 n j=1 n a ij 1 X i m X j m = [mX]tM1(Gm) [mX]
= 1.7124
q 2 ( x m )= i=1 n j=1 n a ij 2 X i m X j m = [mX]tM2(Gm) [mX]
= 6.7533
q 3 ( x m )= i=1 n j=1 n a ij 3 X i m X j m = [mX]tM3(Gm) [mX]
= 25.3806
q 4 ( x m )= i=1 n j=1 n a ij 4 X i m X j m = [mX]tM4(Gm) [mX]
= 105.5649
Nucleotide (N)q0L(Xm, N)q1L(Xm, N)q2L(Xm, N)q3L(Xm, N)q4L(Xm, N)
G2850.040.1340.6662.1549.654
A2860.07840.19321.06683.511217.2256
C2870.01690.13780.53692.822310.1634
U2880.03240.16020.53282.08448.9226
G2890.040.0760.2540.7482.738
G2900.040.0760.1560.4221.136
U2910.03240.0720.15120.34921.0872
G2920.040.0920.2320.7862.8
A2930.07840.21280.86523.376812.6308
G2940.040.170.9963.60418.342
U2950.03240.18720.45722.61368.6328
A2960.07840.08680.53761.36087.4004
C2970.01690.11440.30161.54834.8321
ARN fragment0.56621.71246.753325.3806105.5649
where, E(Gm) represents the set of edges of Gm and Pij is the number of edges among the vertices (nucleotides) vi and vj. In this adjacency matrix M(Gm) the row i and column i correspond to vertex vi from Gm. The element aij of this matrix represents a bond between a nucleotide i and other j. Here, we consider only covalent interaction (phosphodiester bond) and hydrogen bond interaction (between complementary bases). As a first approximation, we considered both interactions equivalent. The matrix Mk(Gm) provides the number of walks of length k linking the nucleotides i and j.
Equation (1) for qk(xm) can be written as the single matrix equation:
qk(xm) = [mX]t Mk(Gm) [mX]
where [mX] is a column vector (a nx1 matrix), [mX]t the transpose of [mX] (a 1xn matrix) and Mk(Gm) the kth power of the matrix M(Gm) of the macromolecular pseudograph Gm (mathematical quadratic form’s matrix). Table 2 exemplifies the calculation of qk(xm) for a secondary structure RNA fragment.
In addition to total quadratic indices, computed for the whole-macromolecule, local-fragment (nucleotide and nucleotide-type) formalisms can be developed. These descriptors are termed local nucleic acid’s quadratic indices, qkL(xm). The definition of these descriptors is as follows:
q kL ( x m )= i=1 m j=1 m a ijL k X i m X j m
where m is the number of nucleotides of the fragment of interest and kaijL is the element of the file i and column j of the matrix MkL(Gm). This matrix is extracted from Mk(Gm) and contains information referred to the vertices of the specific nucleic acid fragments (FR) and also of the molecular environment. The matrix MkL(Gm) = [kaijL] with elements kaijL is defined as follows:
kaijL = kaij if both vi and vj are vertices (nucleotides) contained within FR
   = 1/2 kaij if vi or vj are contained within FR
   = 0 otherwise
where, the kaij are the elements of the kth power of M(Gm). These local analogues can also be expressed in matrix form by the expression:
qkL(xm) = [mX]t MkL(Gm) [mX]
Note that for any partition of a nucleic acid into Z macromolecular fragments there will be Z local macromolecular-fragment matrices. That is to say, if a nucleic acid is partitioned into Z macromolecular fragments, the matrix Mk(Gm) can be partitioned into Z local matrices MkL(Gm), L = 1,... Z. The kth power of the matrix M(Gm) is exactly the sum of the kth power of the local Z matrices,
M k ( G m )= L=1 Z M L k ( G m )
In the same way, Mk(Gm) = [kaij] where,
a ij k = L=1 Z a ijL k
and the total nucleic acid’s quadratic indices are the sum of the macromolecular quadratic indices of the Z molecular fragments (see Table 2),
q k ( x m )= L=1 Z q kL ( x m )
Any local nucleic acid’s quadratic index has a particular meaning, especially for the first values of k, where the information about the structure of the fragment FR is contained. Higher values of k relate to the environment information of the fragment FR considered within the macromolecular graph (Gm). In any case, a complete series of indices performs a specific characterization of the chemical structure. The generalization of the matrices and descriptors to “superior analogues” is necessary for the evaluation of situations where only one descriptor is unable to bring a good structural characterization [25]. The local macromolecular indices can also be used together with total ones as variables for QSAR/QSPR (Quantitative Structure-Activity/Structure Relationship) modeling for properties or activities that depend more on a region or a fragment than on the macromolecule as a whole.

Footprinting Data

The data set of footprinted and binding nucleotides was extracted from the literature [9]. Figure 1 depicts the secondary structure of the HIV-1 Ψ-RNA packaging region as well as the binding sites of Paromomycin. A representation of the Ψ-RNA appears along with a summary of binding/enhancement information for Paromomycin. The RNA consists of the ‘main stem’, positions 213–238 and 361–388; SL-1, which contains the dimmer initiation site; SL-2, having the 5’ splice donor site; SL-3, and SL-4, the latter contains the start codon (AUG) for the gag gene.

TOMOCOMD-CANAR Software

TOMOCOMD is an interactive program for molecular design and bioinformatics research [26]. The program is composed by four subprograms, each one of them dealing with drawing structures (drawing mode) and calculating 2D and 3D molecular descriptors (calculation mode). The modules are named CARDD (Computed-Aided ‘Rational’ Drug Design), CAMPS (Computed-Aided Modeling in Protein Science), CANAR (Computed-Aided Nucleic Acid Research) and CABPD (Computed-Aided Bio-Polymers Docking).
Figure 1. HIV-1 Ψ-RNA packaging region represented on the TOMOCOMD-CANAR interface. Nucleotides involved in binding and enhancement (structural changes) for RNAse I are shown as filled circles and triangles, respectively (open symbols indicates the use of RNAse T1).
Ijms 05 00276 g001
In this paper we outline salient features concerning with only one of these subprograms: CANAR. This subprogram bases on a user-friendly philosophy without prior knowledge of programming skills. The calculation of total and local macromolecular quadratic indices for any nucleic acids was implemented in the TOMOCOMD-CANAR software [26]. The following list briefly resumes the main steps for the application of this method in QSAR/QSPR:
1. Draw the macromolecular graphs (Gm) for each RNA/ADN of the data set, using the software’s drawing mode. Selection of the active nucleotide symbol carries out this procedure. Here, we consider only covalent interaction (phosphodiester bond) and hydrogen bond interaction (between complementary bases).
2. Use appropriated purine and pyrimidine bases weights in order to differentiate the residues in each nucleotide. This work uses as nucleotide weights five properties of DNA-RNA bases (see Table 1) [24]. This parametrization is done using the properties of U, T, A, G, and C only, because the only uncommon part of these nucleotides are these bases.
3. Compute the nucleic acid quadratic indices of the “macromolecular graph’s nucleotides adjacency matrix”. They can be performed in the software calculation mode, which you can select the DNA-RNA bases properties and the family descriptor previously to calculate the macromolecular indices. This software generates a table in which the rows and columns correspond to the compounds and the qk(xm), respectively.
4. Find a QSPR/QSAR equation by using statistical techniques, such as multilinear regression analysis (MRA), Neural Networks (NN), Linear Discrimination Analysis (LDA), and so on. That is to say, we can find a quantitative relation between a property P and the qk(xm) having, for instance, the following appearance,
P = a0q0(xm) + a1q1(xm) + a2q2(xm) +….+ akqk(xm) + c
Where P is the measurement of the property, qk(xm) [or qkL(xm)] is the kth total [or local] macro-molecular quadratic indices, an the ak’s are the coefficients obtained by the statistical analysis.
5. Test the robustness and predictive power of the QSPR/QSAR equation by using internal and external cross-validation techniques,
6. Develop a structural interpretation of the obtained QSAR/QSPR model using macromolecular quadratic indices as molecular descriptors.

Statistical Analysis

Based on the discussion above, two simple linear models were proposed to either discriminate between footprinted and interacting (binding) nucleotides or to predict drug–nucleotide affinity. Linear Discrimination Analysis (LDA) and Linear Multiple Regression (LMR) were used to obtain quantitative models, respectively. These statistical analyses were carried out with the STATISTICA software package [27]. TOMOCOMD-CANAR model used for both statistical procedures the first 10 qkL(xm) [from q0L(xm) to q9L(xm)] for each nucleotides in RNA.
Forward stepwise was fixed as the strategy for variable selection. The tolerance parameter (proportion of variance that is unique to the respective variable) used was the default value for minimum acceptable tolerance, which is 0.01.
LDA is used in order to generate the classifier function on the basis of the simplicity of the method [28]. To test the quality of the discriminant functions derived we used the Wilks’ λ and the Mahalanobis distance. The Wilks’ λ statistic for overall discrimination can takes values in the range of 0 (perfect discrimination) to 1 (no discrimination). The Mahalanobis distance indicates the separation of the respective groups. It shows whether the model possesses an appropriate discriminatory power for differentiating between the two respective groups. The classification of cases was performed means of the posterior classification probabilities, which is the probability that the respective case belogs to a particular group, i.e., footprinted or interacting (binding) nucleotides (see Figure 1). In developing this classification function the values of -1 and 1 were assigned to these groups, respectively. The quality of the ADL model also was determined by examining the percentage of good classification and the proportion between the cases and variables in the equation. Validation of the discriminant function was corroborated by means of leave-n-out cross validation procedures.
In addition, external prediction (test) sets assess the robustness and predictive power of the found model. This type of model validation is very important, if we take into consideration that the predictive ability of a QSAR model can only be estimated using an external test set of compounds that was not used for building the model [29,30]. The quality of the LMR model was determined examining the statistic parameters of multivariable comparison of regression and cross-validation procedures. In this sense, the quality of models was determined by examining the regression coefficients (R), determination coefficients (R2), Fisher ratio’s p-level [p(F)], standard deviations of the regression (s) and the leave-one-out (LOO) press statistics (q2, scv) [30]. In recent years, the LOO press statistics (e.g., q2) have been used as a means of indicating predictive ability. Many authors consider high q2 values (for instance, q2 > 0.5) as indicator or even as the ultimate proof of the high predictive power of a QSAR model.

Results and Discussion

Development of the Discrimination Function: Local (Nucleotide) quadratic indices and the probability of footprinting after RNA-Paromomycin interaction.

The best equation found to discriminate between footprinted and binding nucleotides was:
Binding = 1.10836 +93.6133f1q0L(xm) –5.4682f1q3L(xm) +0.1356f1q5L(xm)
N = 101 λ = 0.43 D2 = 6.0 F(3.97) = 43.342 ρ = 10.1 p < 0.000
where N is the number of nucleotides, λ is the Wilks’s statistic, D2 is the squared Mahalanobis distance, F is the Fisher ratio and p is the p-level (probability of error). The coefficient ρ was used to control the ratio of the adjustable parameters in the model with respect to the number of variables [31]. These statistics indicate that model (11) is appropriate for the discrimination of footprinted and non-footprinted nucleotides studied here. It classifies correctly 95.52% (61/64) of footprinted nucleotides and 79.41% (20/27) of binding nucleotides in training set, for a global good classification of 90.10% (91/101). In Table 3 we give the classification of nucleotides in training set together with their posterior probabilities calculated from the Mahalanobis distance.
LOO cross-validation procedure assessed the predictability of the model obtained by LDA. This methodology systematically removed one data point at a time from the data set. A QSAR model was then constructed on the basis of this reduced data set and subsequently used to predict the removed data point. This procedure was repeated until a complete set of predicted was obtained. Using this approach, the model (11) has shown a LOO global good classification of 91.09%.
Secondly, to assess the predictability of the classification model (11), a leave-n-out cross-validation was performed. This model shown an 89.11 and 87.13% of global good classification when n varied from 2 to 3 in the leave-n-out cross validation procedures. The model stabilizes around 88.12% when n was > 3 (see Figure 2).
The most important criterion for the acceptance or not of a discriminant model, such model (11), bases on the statistics for the test set. Equation 11 classifies correctly 81.82% (9/11) of both drug-interacting nucleotides and footprinted ones. In Table 4, we give the classification of nucleotides in test set. If we considered the data set and the test set (full set) the percentage of good classification was 88.62% (109/121).

Local (Nucleotide) quadratic indices and modeling of Paromomycin’s affinity constant with HIV-1 Ψ-RNA

A model such as equation (11) may prove to be very useful in predicting the probability of the occurrence of an interaction between a drug and a specific site on the RNA chain.
Table 3. Training Set Classification results.
NucleotideΔP%aP%-cvbNucleotideΔP%aP%-cvbNucleotideΔP%aP%-cvb
Training Set (Nucleotide non-‘footprinted’)
RNA-A23598.4499.22RNA-A30198.4099.15RNA-A33299.6199.80
RNA-G24190.6594.94RNA-A30299.4199.70RNA-G33386.7092.78
RNA-C243-97.92*99.49*RNA-U30386.5992.63RNA-A33499.6298.81
RNA-U244-92.03*97.05*RNA-U30489.2394.06RNA-G33587.7793.36
RNA-G251-96.81*99.17*RNA-A30696.5799.14RNA-G33858.5978.02
RNA-G25793.5696.51RNA-G31784.4791.60RNA-G339-93.85*98.55*
RNA-G25995.1197.35RNA-G32062.4480.17RNA-G34058.6778.19
RNA-G26196.0697.87RNA-A32692.9396.13RNA-G34473.3985.85
RNA-C267-99.24*99.86*RNA-A32799.3599.67RNA-A35699.6099.80
RNA-A268-46.31*79.05*RNA-G32891.6395.46RNA-A35999.4699.73
RNA-A26996.9498.35RNA-G32989.5499.33
RNA-A276-96.63*99.49*RNA-A33099.5797.77
Training Set (Nucleotides ‘footprinted’)
RNA-G214-98.7999.37RNA-G265-44.4271.41RNA-G321-92.2495.90
RNA-C218-97.2198.53RNA-G266-92.8796.14RNA-C322-98.4499.18
RNA-C219-98.9099.42RNA-A271-84.6090.81RNA-U323-96.6198.22
RNA-A220-84.3990.90RNA-G272-98.8395.00RNA-A324-93.4196.24
RNA-G221-99.8599.93RNA-C274-96.6198.20RNA-G325-99.6299.81
RNA-A222-84.1990.35RNA-G275-98.2099.04RNA-G342-93.3496.53
RNA-A225-42.5656.29RNA-G277-98.5199.21RNA-C343-98.2399.06
RNA-C22722.41*66.90RNA-G282-92.6496.01RNA-C349-98.0598.97
RNA-C229-98.2899.09RNA-G283-96.2797.85RNA-C352-97.2698.50
RNA-U230-94.7597.26RNA-C284-98.3399.10RNA-G361-93.7196.70
RNA-C231-97.0098.41RNA-G285-95.5997.58RNA-C362-99.2099.58
RNA-U232-38.3768.06RNA-C287-99.4299.70RNA-A368-95.0997.19
RNA-C233-95.4497.56RNA-U288-88.2393.75RNA-A370-81.0888.79
RNA-C236-97.6098.73RNA-A293-79.9888.22RNA-U372-5.3751.07*
RNA-G237-94.7597.14RNA-G294-99.3599.66RNA-U377-93.7096.61
RNA-G246-90.8095.03RNA-U295-96.6198.21RNA-C378-98.5199.21
RNA-C248-97.0898.45RNA-C297-98.1198.99RNA-U381-92.4596.07
RNA-U249-94.5497.11RNA-G298-85.4289.43RNA-G382-98.7499.34
RNA-C252-97.8098.83RNA-C299-96.2397.91RNA-G383-97.9998.93
RNA-U253-53.6576.07RNA-C307-98.3599.12RNA-C387-97.1898.49
RNA-C25867.07*88.75*RNA-U308-98.1299.00RNA-C388-84.4791.70
RNA-C26259.31*85.25RNA-A309-85.7991.59
RNA-C264-98.0398.94RNA-G310-99.1099.53
*Nucleotides that are misclassified by LDA-QSAR model (Eq. 11). a Nucleotide-Paromomycin interaction predicted by model (11); ΔP% = [P(interaction) - P(non-interaction)]x100; where P is probability with which the nucleotide is predicted as non-footprinted or footprinted in each group. b Percentage of probability with which the nucleotide is predicted as footprinted or non-footprinted in each groups using LOO cross validation procedures.
Figure 2. Behavior of the global or total percentage of good classification in different n-fold cross-validation analysis.
Ijms 05 00276 g002
Table 4. Test set classification results.
nucleotideΔP%anucleotideΔP%anucleotideΔP%a
Test Set (Nucleotides non-‘footprinted’)
RNA-A23998.33RNA-A286-80.84*RNA-A33699.68
RNA-A24297.15RNA-C300-95.83*RNA-G34690.17
RNA-C24598.23RNA-G31890.46RNA-A36094.68
RNA-G25462.44RNA-G33187.67
Test Set (Nucleotides ‘footprinted’)
RNA-G213-85.46RNA-U250-97.07RNA-G348-97.29
RNA-G226-21.29RNA-G27335.31*RNA-G369-99.76
RNA-U228-87.28RNA-C311-97.87RNA-U373-92.40
RNA-C238-98.32RNA-U34147.94*
*Nucleotides that are misclassified by LDA-QSAR model (Eq. 11). a Nucleotide-Paromomycin interaction predicted by model (11); ΔP% = [P(interaction) - P(non-interaction)]x100; where P is probability with which the nucleotide is predicted as non-footprinted or footprinted in each group.
This is very important information for the study of the mechanism of action of potential drugs with RNA as the target.
However, any picture of the drug–RNA interaction is not complete unless the strength of each interaction is also known. With the aim of addressing this issue, a quantitative linear model was developed in order to predict the interaction constants, when they occur. The local affinity constant values [log K(10−4M−1)] were obtained from the same source as the former binding/footprinting data [9].
Log K(10−4M−1) = -1.3747(±0.3882) +0.1136(±0.0189)ΔE1q0L(xm)-7.5608x10⁻⁵(±9.9659x10⁻⁶)∈250q3L(xm) +0.0393(±0.0069).f2q3L(xm)-4.6544(±1.63x10⁻⁹).ΔE1q10L(xm)
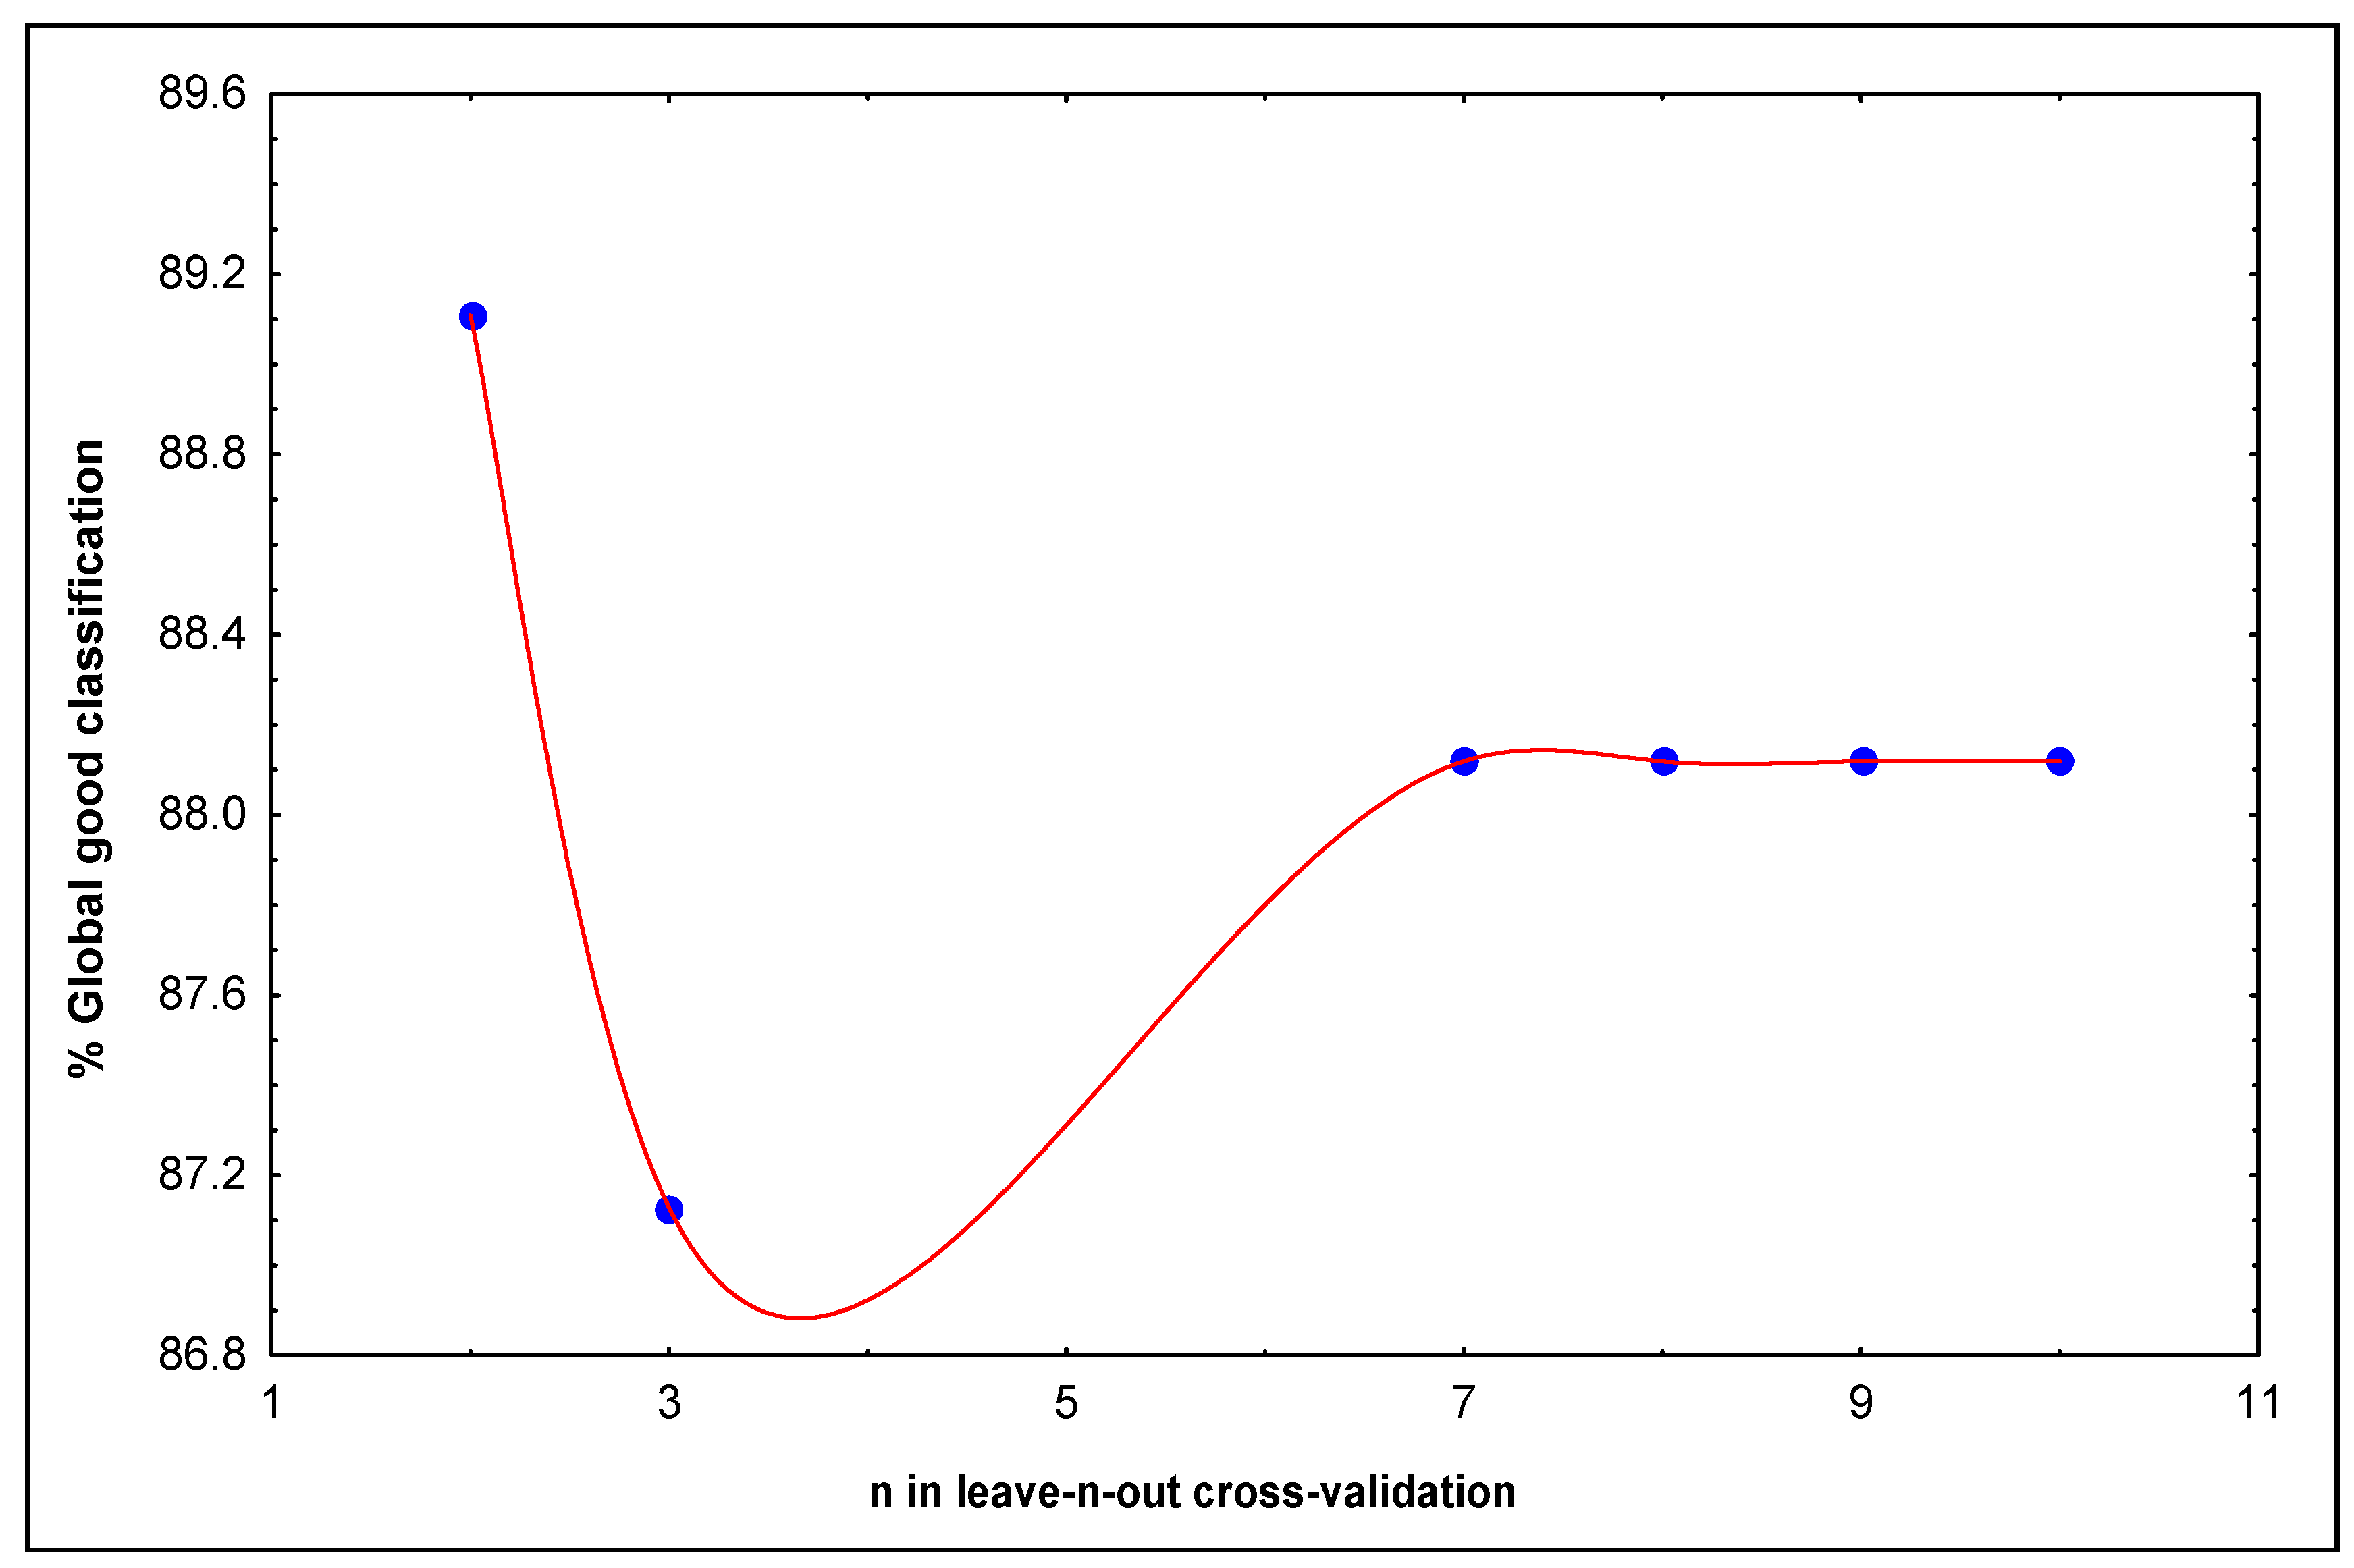
N = 23 R = 0.96 R2 = 0.92 s = 0.07 q2 = 0.85 scv = 0.09 F(4.18) = 54.910 p<0.0000
where N is the number of interactions with a known affinity constant (log K), F is Fisher’s statistics, s is the standard error of estimates, R2 is the squared regression coefficient for training and q2 the same for the LOO jackknife experiments.
In the development of the quantitative model for the Log K description of the calibration data set, one nucleotide (A276) stands outs as a statistical outlier. Outlier detection was performed using the following standard statistical test: residual, standardized residuals, Studentized residual and Cooks distance.
Two of present authors reported a similar equation using MARCH-INSIDE descriptors [32]. They additionally make use of a dummy variable RNAse, which has the values RNAse = 1 for experiments carried out in the presence of RNAse I and RNAse = -1 for RNAse T1 [32]:
Log K (10−4M−1) = 0.693(±0.038) +0.338(±0.068)RNAse -0.102(±0.025)1O10)
+0.083(±0.035) 4O8)
N = 24 R = 0.91 R2 = 0.83 s = 0.115 q2 = 0.825 F(3.20) = 31.48 p<0.0000
Both equations have very similar statistical parameters. Statistical parameters in Eq. 12 suggest a high quality of the found model. The correlation coefficient R is 0.96 and standard deviation is only 0.07x10⁻⁴M−1. The squared correlation coefficient (R2) was 0.92 for Eq. 12, so, this model explained more than 92% of the variance for the experimental Paromomycin affinity constant by HIV-1 RNA.
Predictability and stability of the model (12) to data variation is tested here by means of LOO cross validation. The model shows a cross validation standard error of only 0.09. In Table 5, we depict the observed, predicted and predicted (after LOO cross-validation procedures) values of Log K obtained from Eq. 12 and Eq. 13. One on the main problems concerning the application of TIs to QSPR/QSAR studies is that many descriptors are collinear. Therefore, there will be much redundancy of information. Problems with redundancy of information, and collinearity, have been illustrated with the use of TIs, such as the molecular connectivities [33,34].
For a better statistical interpretation of the QSPR/QSAR models (in order to understand which effects cannot be separated), where inter-related indices are considered (such as topologic or topographic indices based on the same graph-theoretical invariant), the inclusion in the model of strongly interrelated variables should be avoided. It is necessary to consider the above-mentioned criterion because an interrelation among different descriptors produces a highly unstable correlation coefficient and makes it difficult to know the real contribution of each variable included in the model [35]. To solve this problem Randić proposed a procedure of orthogonalization of molecular descriptors that have been applied with much success to QSPR and QSAR studies [36,37].
Table 5. Observed, predicted and predicted (alter LOO cross-validation procedures) values of Log K obtained from Eq. 11 and Eq. 12.
NUCObsaPredbP-cvcPreddP-cvfNUCObsaPredbP-cvcPreddP-cvf
A2351.2041.1321.1111.1660.359G3350.8450.8520.8530.8620.845
A2391.2041.1731.1641.1660.359G3380.7780.7360.7320.6720.778
G2510.4470.3500.3040.5180.032G3390.7780.6470.5660.5450.778
G2540.4470.5520.5780.5180.032G3400.7780.7340.7300.6720.778
C2670.9030.8930.8790.8560.058G3440.8450.8140.8110.7350.845
A2680.9031.0031.0490.8560.125G3460.8450.8550.8560.8620.845
A2690.9030.9841.0260.9870.125G3630.4150.4880.5220.3990.415
A2860.7780.7040.6671.024-0.067G3640.4150.4770.4950.3990.415
G3280.8450.8510.8520.8620.430G3650.4150.5420.5640.3990.415
G3290.8450.8520.8530.8620.430G3660.4150.3940.3860.5940.415
G3310.8450.8520.8530.8620.430G3670.4150.3780.3690.5940.415
G3330.8450.8520.8530.8620.845
NUC: Nucleotide. The values are aObserved, b y dPredicted, and c y fPredicted by LOO procedures for log K (10−4M−1) (affinity constant of Paromomycin for RNA), by Eq. 12 and Eq. 13, respectively.
For the present paper, to alleviate the collinearity between variables in investigated data set, an interrelation study among the nucleic acid quadratic indices was performed, using correlation matrices. The acceptable level of collinearity to avoid is a more subjective issue. In this sense, reports of acceptable correlation coefficients between variables have range from less than 0.4 to 0.9 in the literature. In the view of the Cronin and Schultz [34], the collinearity of the variables should be as low as possible, but must be significantly lower than the statistical fit of the QSPR/QSAR itself. In Table 6, the correlation matrix for this equation shows that there is low collinearity among these variables.
Table 6. The squared correlation matrix showing covariance (r2) among the macromolecular topological descriptors [local (nucleotide) nucleic acid quadratic indices] used in the regression analysis.
f2q3L(xm)ΔE1q0L(xm)ΔE1q10L(xm)250q3L(xm)
f2q3L(xm)1-0.55-0.68-0.41
ΔE1q0L(xm) 10.370.17
ΔE1q10L(xm) 1-0.31
∈250q3L(xm) 1
Both LDA- and LMR-QSAR models (Eq. 11 and Eq. 12, respectively) involves short-reaching (k ≤ 3), middle-reaching (4 < k < 9) and far-reaching indices (k = 10 or greater). The RNA quadratic indices of order cero (k = 0) characterized each kind of RNA bases (nucleotide), but not consider the environmental topology of the nucleotide.
In both model this indices have a positive contribution [.f1q0L(xm) and ΔE1q0L(xm) in models (11) and (12), respectively]. This is a logical result, because this indices have a high values for purine nucleotides, which present more probability of drug interaction than pyrimidine ones. This situation means that the probability of binding increased with the consequently increase of electron density of RNA bases, due to this possibility the hydrogen bond and/or electrostatic interaction of amino groups/protonated amine groups with sites on RNA.
Three RNA-quadratic indices of the third order (k = 3) of involved in the early stages of Paromomycin-nucleotide interaction. Such a behavior may be explained by taking into consideration the fact that the electronic and/or topologic changes in the nucleotide backbone, which are necessary for the drug-nucleotide interaction, the more marked structural changes in the ±3-vicinity of the nucleotide. Consequently, two of these indices had a negative contribution in LDA [f1q3L(xm)] and LMR [∈250q3L(xm)] model. The contribution of the middle-to-high reaching, ±5 and ±10-vicinities of the nucleotide, in both equations show that the interaction between Paromomycin and a nucleotide of RNA depends on the electro-topologic environment of this nucleotide. These results are in relation to the factor that control binding specificity for aminoglycosides’ interaction. In general, the Paromomycin prefers to bind bulged or other non-Watson-Crick secondary RNA elements, in consequence this drug is too large to fit into the grooves of regular A-form RNA structure [9].

Concluding Remarks

This study presents a new set of macromolecular descriptors relevant to nucleic acid QSAR/QSPR studies. These descriptors are calculated from the macromolecular graph’s nucleotide adjacency matrix. Their derivation is straightforward, and it is easy to interpret the QSARs/QSPRs which include them. The local (nucleotide) quadratic indices, LDA, and LMR have been used to predict the probability and the affinity of Paromomycin binding by the packing HIV-1 region. The resulting quantitative models are significant from a statistical point of view. A LOO cross-validation procedure (internal validation) and an external predicting series (external validation) revealed that the QSAR models had a good predictability.
The models found to describe the interaction profile include nucleotide’s quadratic indices accounting for electronic and topologic features of each nucleotide in RNA molecule. These models not only are good enough to predict the interaction parameters, but also permit the interpretation of the driving forces of such interaction processes. In this sense, developed equations involve short-reaching (k ≤ 3), middle- reaching (4 < k ≤ 9) and far-reaching (k = 10 or greater) nucleotide’s quadratic indices. This situation points to that the interaction between Paromomycin and a nucleotide of RNA depends on the electro-topologic environment of the nucleotides.
The approach described here represents a novel and rather promising way to chem & bioinformatics research. We would expect computational nucleic acid science to have a similar effect on the search for new vaccines, receptors, drugs, and so on as molecular modeling and QSAR have had on search for new drugs.

Acknowledgements

Y. Marrero-Ponce would like to express his gratitude to Drs. David Whithey (England), David Livingstone (England), James Devillers (France), Johann Gasteiger (Germany), Klaus L. E. Kaiser (Canada), Lauren Dury (Belgium), Laurence Leherte (Belgium), Ernesto Estrada (Spain), David B. Silverman (USA) and Douglas Klein (USA) for sending him several reprints of their papers on molecular design. Y. M-P is also indebted to the journal’s Managing Editor, Dr. Derek J. McPhee and Editor-in-Chief, Dr. Shu-Kun Lin, for their kind attention. F. T. acknowledges financial support from the Spanish MCT (Plan Nacional I+D+I, Project No. BQU2001-2935-C02-01).

References

  1. Hua, S.; Sun, Z. Support Vector Machine Approach for Protein Subcelular Localization Prediction. Bioinformatics. 2001, 17, 721–728. [Google Scholar]
  2. Benson, D. A.; Karsch-Mizrachi, I.; Lipman, D. J.; Ostell, J.; Rapp, B. A.; Wheeler, D. L. Gen bank. Nucleic Acid Res. 2000, 28, 15–18. [Google Scholar]
  3. Yuan, Z. Prediction of Proteins Subcellular Location Using Markov Chain Models. FEBS Lett. 1999, 451, 23–26. [Google Scholar]
  4. Tullius, T. D. Physical Studies of Protein-DNA Complexes by Footprinting. Ann. Rev. Biophys. Bio. 1989, 18, 213–237. [Google Scholar]
  5. Brenowitz, M.; Senear, D. F.; Shea, M. A.; Ackers, G. K. Quantitative Dnase Footprint Titration: a Method for Studying Protein-DNA Interactions. Methods Enzymol. 1986, 130, 132–181. [Google Scholar]
  6. Henn, A.; Halfon, J.; Kela, I.; Orion, I.; Sagi, I. Nucleic Acid Fragmentation on the Millisecond Timesacale Using a Conventional x-Ray Rotating Anode Source: Application to Protein-DNA Footprinting. Nucleic Acid Res. 2001, 29, e122. [Google Scholar]
  7. Galas, D. J.; Schmithz, A. Dnase Footprinting: a Simple Method for the Detection of Protein-DNA Binding Specificity. Nucleic Acids Res. 1978, 5, 3157–3170. [Google Scholar]
  8. Ozoline, O. N.; Fujita, N.; Ishihama, A. Mode of DNA-protein Interaction between the C-terminal Domain of Escherichia Coli RNA Polymerase α Subunit and T7D Promoter UP Element. Nucleic Acids Res. 2001, 29, 4909–4919. [Google Scholar]
  9. McPike, P. M.; Goodisman, J.; Dabrowiak, C. J. Footprinting and Circular Dichroims Studies on Paromomycin Binding to the Packaging Region of the Human Immunodeficiency Virus Type-1. Bioorg. Med. Chem. 2002, 10, 3663–3672. [Google Scholar]
  10. Sullivan, J. M.; Goodisman, J.; Dabrowiak, C. J. Absorption Studies on Aminoglycosides Binding to the Packaging Region of the Human Immunodeficiency Virus Type-1. Bioorg. Med. Chem. Lett. 2002, 12, 615–618. [Google Scholar]
  11. Gale, E. F.; Gundliff, E.; Reynolds, P. E.; Richmon, M. H.; Waring, M. J. The Molecular Basis of Antibiotic Action; John Wiley & Sons: London, 1981. [Google Scholar]
  12. Lynch, S. R.; Recht, M. I.; Puglisi, J. D. Biochemical and Nuclear Magnetic Resonance Studies of Aminoglycoside-RNA Complexes. Meth. Enzymol. 2000, 317, 240–261. [Google Scholar]
  13. Weiss, R.; Teich, N.; Varmus, H.; Coffin, J., (Eds). RNA Tumor Viruses; Cold Spring Harbor Laboratory: Cold Spring Harbor (N.Y.), 1984. [Google Scholar]
  14. Wilson, W. D.; Li, K. Targeting RNA with Small Molecules. Curr. Med. Chem. 2000, 7, 73–98. [Google Scholar]
  15. Marrero-Ponce, Y. Total and Local Quadratic Indices of the “Molecular Pseudograph`s Atom Adjacency Matrix”: Applications to the Prediction of Physical Properties of Organic Compounds. Molecules 2003, 8, 687–726, http://www.mdpi.org. [Google Scholar]
  16. Marrero-Ponce, Y. Linear Indices of the “Molecular Pseudograph’s Atom Adjacency Matrix”: Definition, Significance-Interpretation and Application to QSAR Analysis of Flavone Derivatives as HIV-1 Integrase Inhibitors. J. Chem. Inf. Comput. Sci. In Press. [CrossRef]
  17. Marrero-Ponce, Y.; Cabrera, M. A.; Romero, V.; Ofori, E.; Montero, L. A. Total and Local Quadratic Indices of the “Molecular Pseudograph’s Atom Adjacency Matrix”. Application to Prediction of Caco-2 Permeability of Drugs. Int. J. Mol. Sci. 2003, 4, 512–536, www.mdpi.org/ijms/. [Google Scholar]
  18. Marrero, Y.; Cabrera, M. A.; Romero, V.; González, D. H.; Torrens, F. A New Topological Descriptors Based Model for Predicting Intestinal Epithelial Transport of Drugs in Caco-2 Cell Culture. J. Pharm. Pharm. Sci. 2004, 7, 186–199. [Google Scholar]
  19. Marrero, Y.; González, H.; Romero, V.; Torrens, F.; Castro, E. A. 3D-Chiral Quadratic Indices of the “Molecular Pseudograph’s Atom Adjacency Matrix” and Their Application to Central Chirality Codification: Classification of ACE Inhibitors and Prediction of σ-Receptor Antagonist Activities. Bioorg. Med. Chem. 2004, 12, 5331–5342. [Google Scholar]
  20. Stryer, L. Biochemistry; W. H. Freeman and Company: New York, 1995. [Google Scholar]
  21. Mathews, C. K.; van Holde, K. E.; Ahern, K. G. Biochemistry; Addison Wesley Longman: San Francisco, 2000. [Google Scholar]
  22. Lehninger, A. L.; Nelson, D. L.; Cox, M. M. Principles of Biochemistry; Worth Publishers: New York, 1993. [Google Scholar]
  23. Alberts, B.; Bray, D.; Lewis, J.; Raff, M.; Roberts, K.; Watson, J. D. Molecular Biology of the Cell; Garland: New York and London, 1994. [Google Scholar]
  24. Pogliani, L. From Molecular Connectivity Indices to Semiempirical Connectivity Terms: Recent Trends in Graph Theoretical Descriptors. Chem. Rev. 2000, 100, 3827–3858. [Google Scholar]
  25. Randić, M. Generalized Molecular Descriptors. J. Math. Chem. 1991, 7, 155–168. [Google Scholar]
  26. Marrero-Ponce, Y.; Romero-Zaldivar, V. TOMO-COMD software; Central University of Las Villas. TOMOCOMD, (TOpological MOlecular COMputer Design) for Windows, version 1.0 is a preliminary experimental version; in future a professional version will be available on request from Y. Marrero: [email protected]; [email protected]; 2002. [Google Scholar]
  27. STATISTICA version. 5.5; Statsoft, Inc., 1999.
  28. McFarland, J. W.; Gans, D. J. Linear Discrminant Analysis and Cluster Significance Analysis. In Comprehesive Medicinal Chemistry; Hansch, C., Sammes, P. G., Taylor, J. B., Eds.; Pergamon Press: Oxford, 1990; vol. 4, pp. 667–689. [Google Scholar]
  29. Golbraikh, A.; Tropsha, A. Beware of q2! J. Mol. Graph. Modell. 2002, 20, 269–276. [Google Scholar]
  30. Wold, S.; Erikson, L. Statistical Validation of QSAR Results. Validation Tools. In Chemometric Methods in Molecular Design; van de Waterbeemd, H., Ed.; VCH Publishers: New York, 1995; pp. 309–318. [Google Scholar]
  31. García-Domenech, R.; de Julián-Ortíz, J. V. Antimicrobial Activity in a Heterogeneous Group of Compounds. J. Chem. Inf. Comput. Sci. 1998, 38, 445–449. [Google Scholar]
  32. González, H.; Ramos, R.; Molina, R. Markovian Negentropies in Bioinformatics. 1. A picture of Footprints after the Interaction of the HIV-1 ψ-RNA Packaging Region with Drugs. Bioinformatics 2003, 16, 2079–2087. [Google Scholar]
  33. Basak, S. C.; Balaban, A. T.; Grunwald, G. D.; Gute, B. D. Topological Indices: Their Nature and Mutual Relatedness. J. Chem. Inf. Comput. Sci. 2000, 40, 891–898. [Google Scholar]
  34. Cronin, M. T. D.; Schultz, T. W. Pitfalls in QSAR. J. Mol. Struct. (Theochem) 2003, 622, 39–51. [Google Scholar]
  35. Alzina, R. B. Introduccion Conceptual al Análisis Multivariable. Un Enfoque Informático con los paquetes SPSS-X, BMDP, LISREL Y SPAD; PPU SA: Barcelona, 1989; Chapter 8; Vol. 1, p. 202. [Google Scholar]
  36. Randić, M. Orthogonal Molecular Descriptors. New J. Chem. 1991, 15, 517–525. [Google Scholar]
  37. Randić, M. Fitting of Nonlinear Regression by Orthogonalized Power Series. J. Comput. Chem. 1993, 14, 363–370. [Google Scholar]

