QSAR of Some N1-Aryl/Heteroarylaminomethyl/ethyl-1,2,4-Triazoles Part II: Antimicrobial Activity Against BacillusSubtilis

Abstract
:1. Introduction
2. Results and Discussion


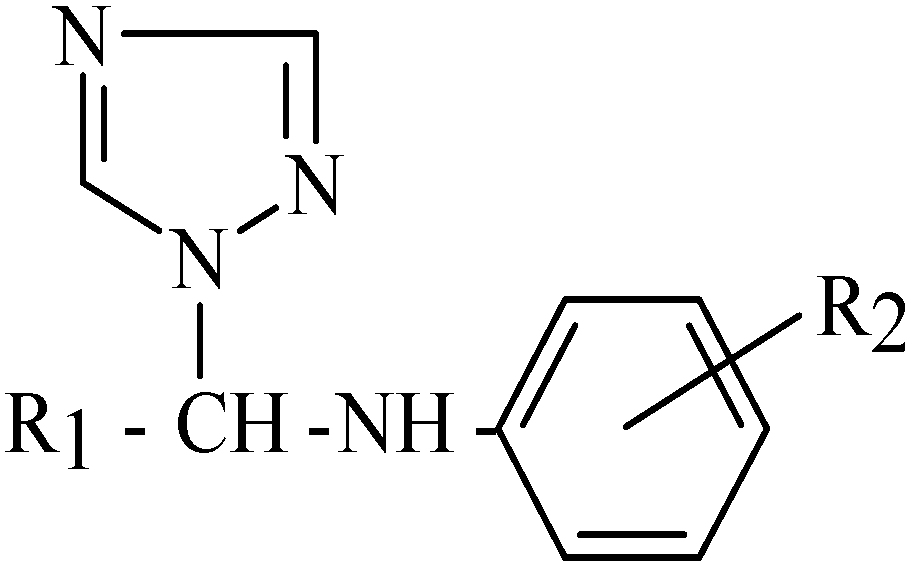
| Comp. No: | R1 | R2 |
|---|---|---|
| 1 | H | p-COOC2H5 |
| 2 | H | p-COOH |
| 3 | H | o-COOH |
| 4 | H | p-Cl |
| 5 | H | p-Br |
| 6 | H | p-CH3 |
| 7 | H | p-C6H5 |
| 8 | H | p-C6H4-CH2-NH-  |
| 9 | CH3 | p-COOC2H5 |
| 10 | CH3 | p-NO2 |

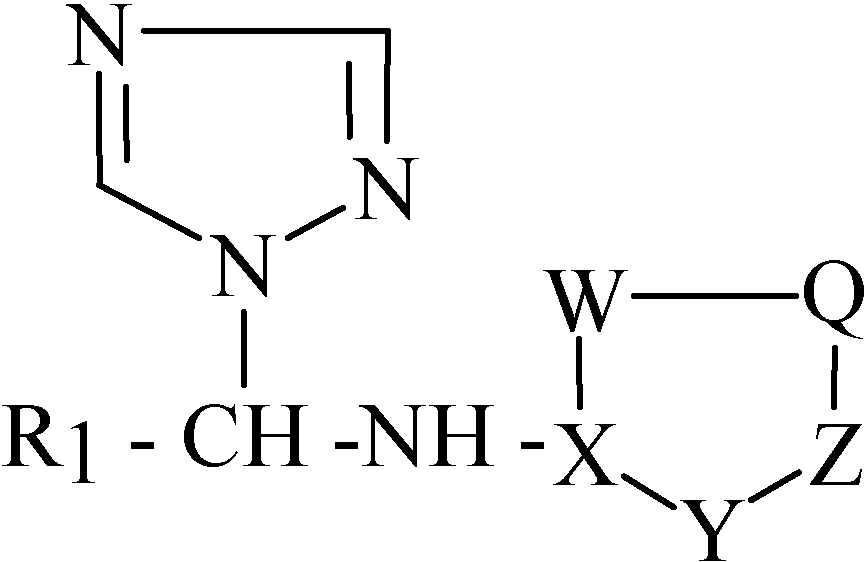
| Comp. No: | R1 | X | Y | Z | Q | W |
|---|---|---|---|---|---|---|
| 11 | H | -C= | =N- | -CH= | =CH- | -CH=CH- |
| 12 | H | -C= | =N- | -CH= | =CH- | -C(CH3)=CH- |
| 13 | H | -C= | =N- | =C(CH3)- | =CH- | -CH=CH- |
| 14 | H | -C= | =N- | -CH= | =C(Cl)- | -CH=CH- |
| 15 | H | -C= | =N- | -CH= | =N- | -CH=CH- |
| 16 | H | -N- | -CH= | =N- | -N= | =CH- |
| 17 | CH3 | -C= | =N- | =C(CH3)- | =CH- | -CH=CH- |
| 18 | CH3 | -C= | =N- | -CH= | =CH- | -S- |
| Compound No: | MICa | log 1/ C | log Pb | MRc |
|---|---|---|---|---|
| 1 | 4.061 x 10⁻⁶ | 5.3914 | 1.2981 | 17.47 |
| 2 | 2.291 x 10⁻⁵ | 4.6399 | 0.4579 | 6.93 |
| 3 | - | - | 1.4690 | 6.93 |
| 4 | 4.793 x 10⁻⁵ | 4.3194 | 1.2210 | 6.03 |
| 5 | 1.975 x 10⁻⁵ | 4.7044 | 1.4665 | 8.88 |
| 6 | 2.656 x 10⁻⁵ | 4.5757 | 1.1238 | 5.65 |
| 7 | 3.995 x 10⁻⁶ | 5.3984 | 2.3405 | 25.36 |
| 8 | - | - | -1.6900 | - |
| 9 | 3.842 x 10⁻⁵ | 4.4154 | 1.7157 | 17.47 |
| 10 | 4.287 x 10⁻⁵ | 4.3678 | 1.3895 | 0.67 |
| 11 | 5.708 x 10⁻⁵ | 4.2435 | 0.0301 | - |
| 12 | - | - | 0.5774 | - |
| 13 | 5.399 x 10⁻⁵ | 4.2676 | 0.5774 | - |
| 16 | 6.055 x 10⁻⁵ | 4.2178 | -2.1800 | - |
| σ | 1.0000 | ||||||
| π | -0.8861 | 1.0000 | |||||
| logP | -0.4792 | 0.8180 | 1.0000 | ||||
| MR | -0.4751 | 0.7235 | 0.7732 | 1.0000 | |||
| F | 0.2547 | -0.1186 | 0.6125 | -0.2499 | 1.0000 | ||
| R | 0.6327 | -0.7356 | 0.0348 | -0.5815 | 0.3997 | 1.0000 | |
- ➢
- applying the general Hansch equation for structurally identical compounds (1-8);
- ➢
- using the Free Wilson approach which included derivatives with some structural changes (aminomethyl unit has been replaced with aminoethyl group), compounds (1-10);
- ➢
- extend the Free Wilson equation, for determination of the influence of heterocyclic ring, substituted on the amino group, compounds (1-18).

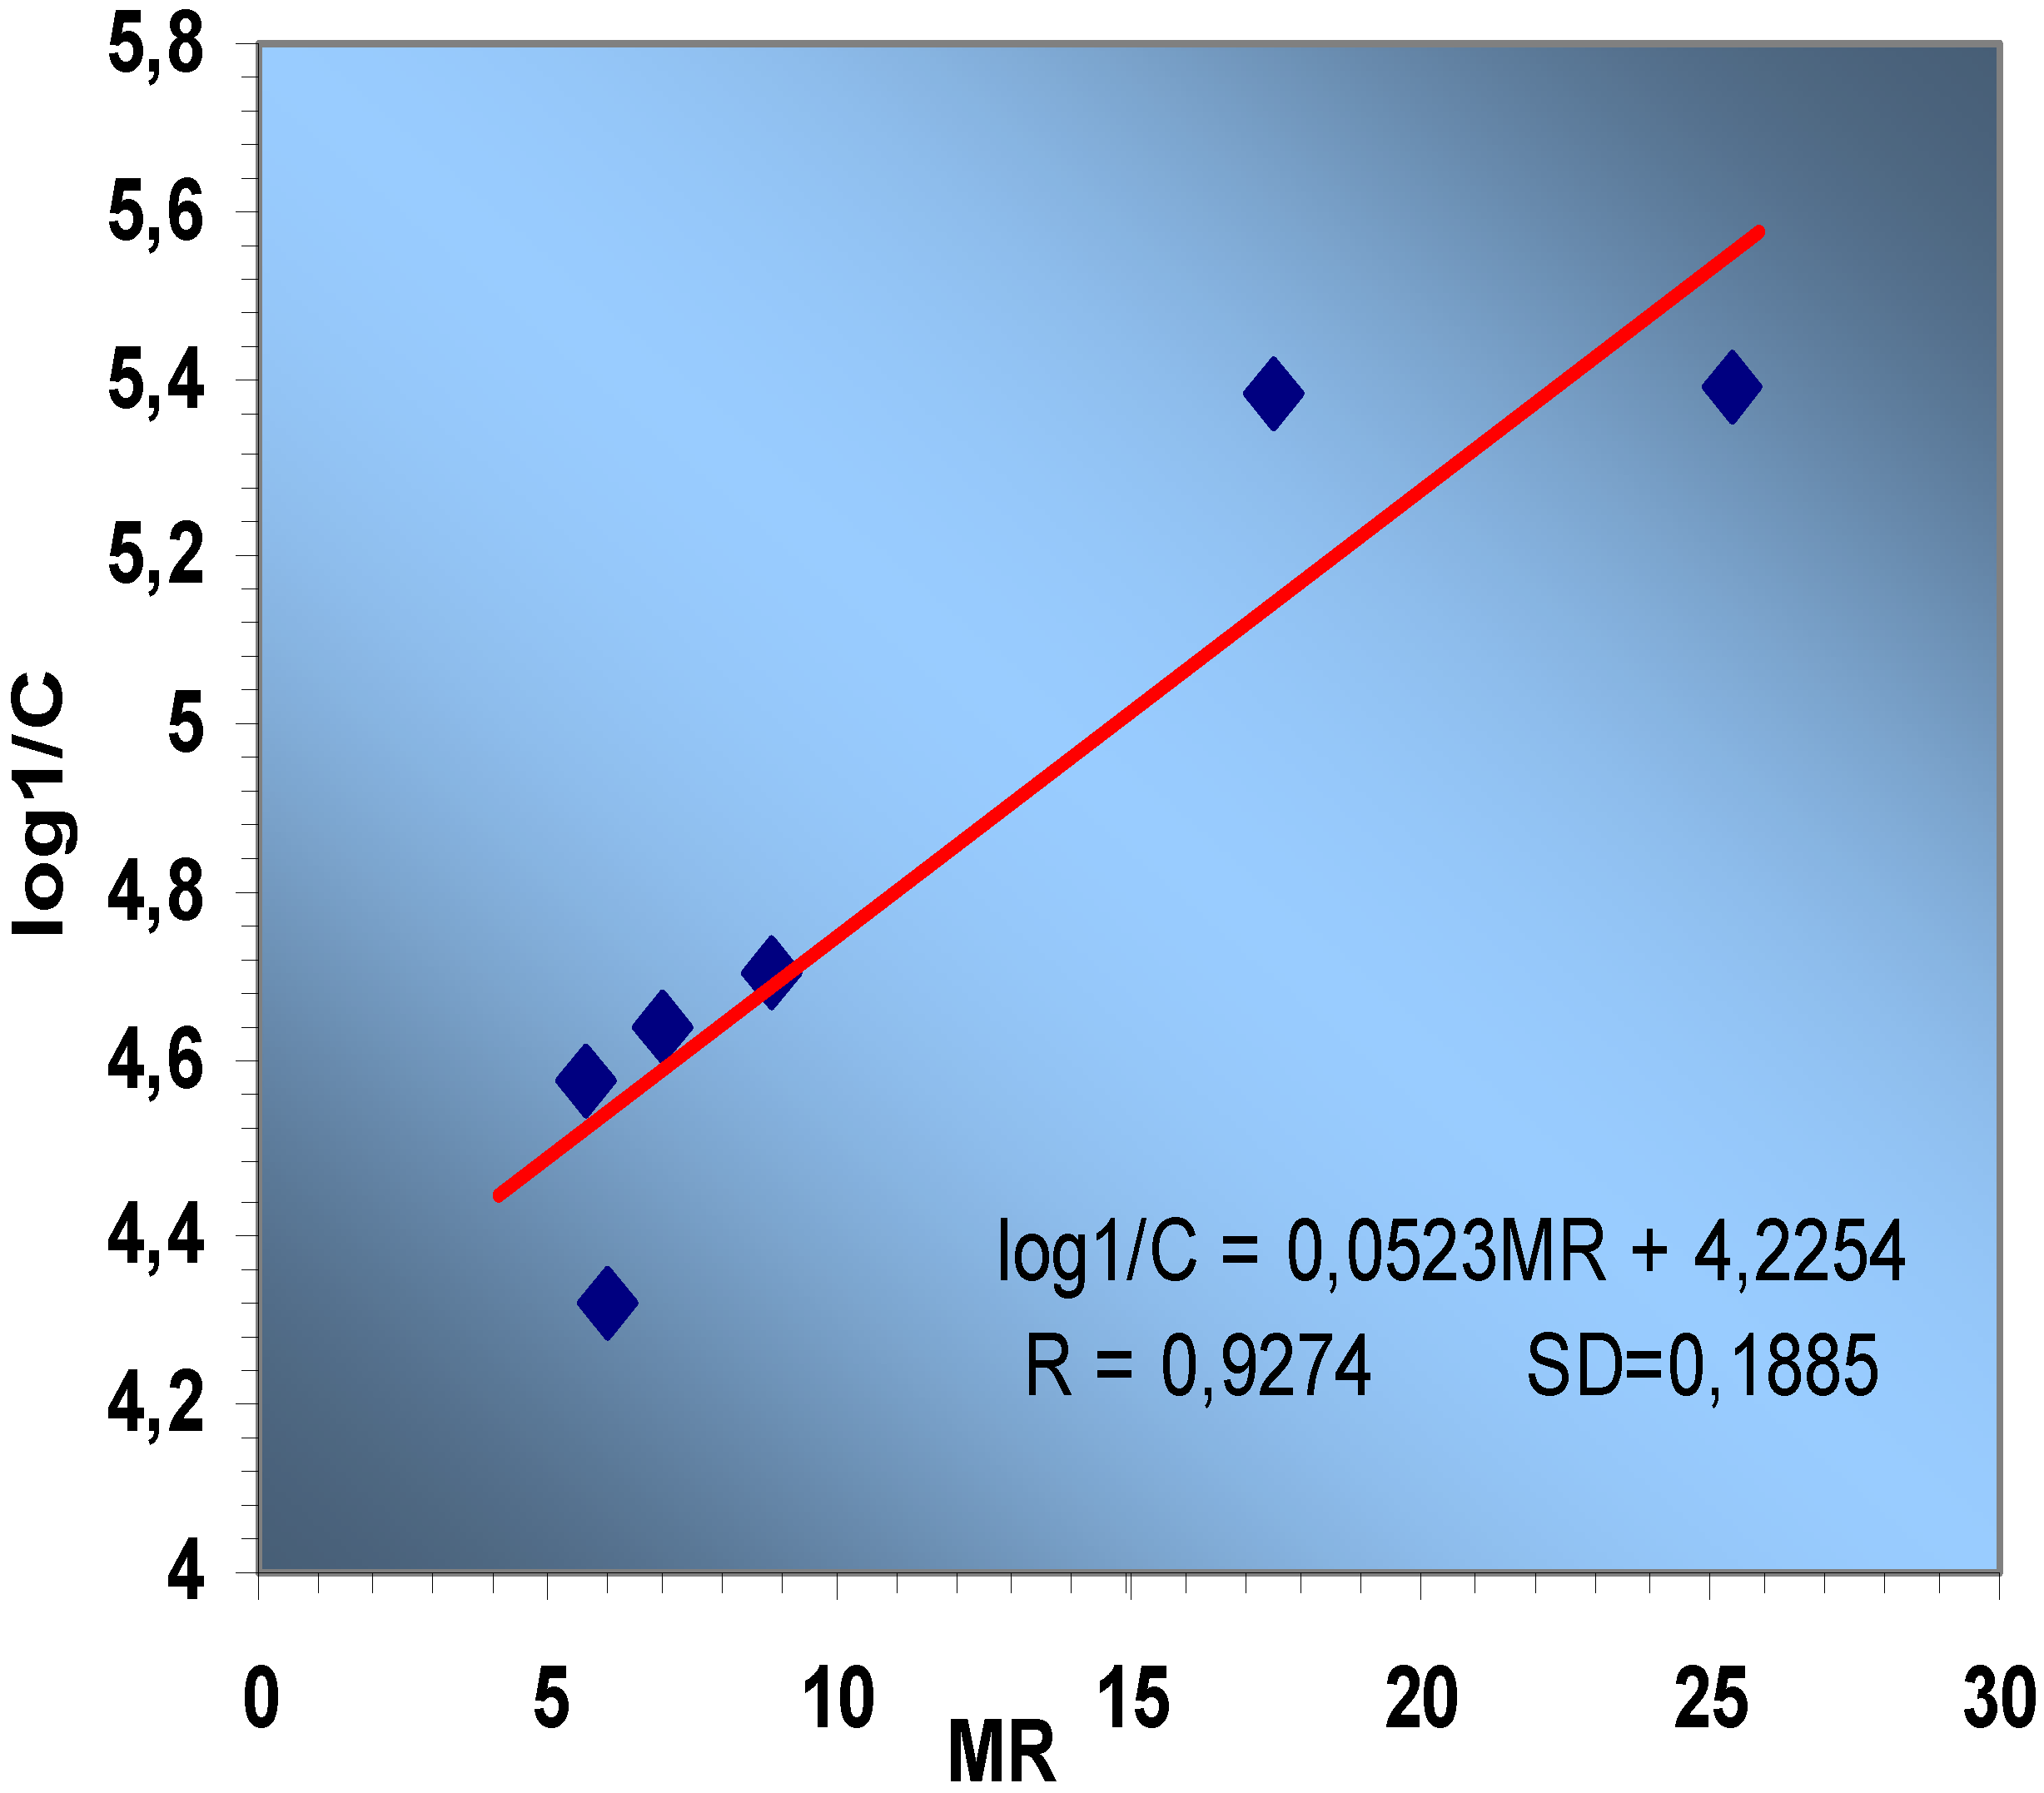
R = 0.9274 SD=0.1885

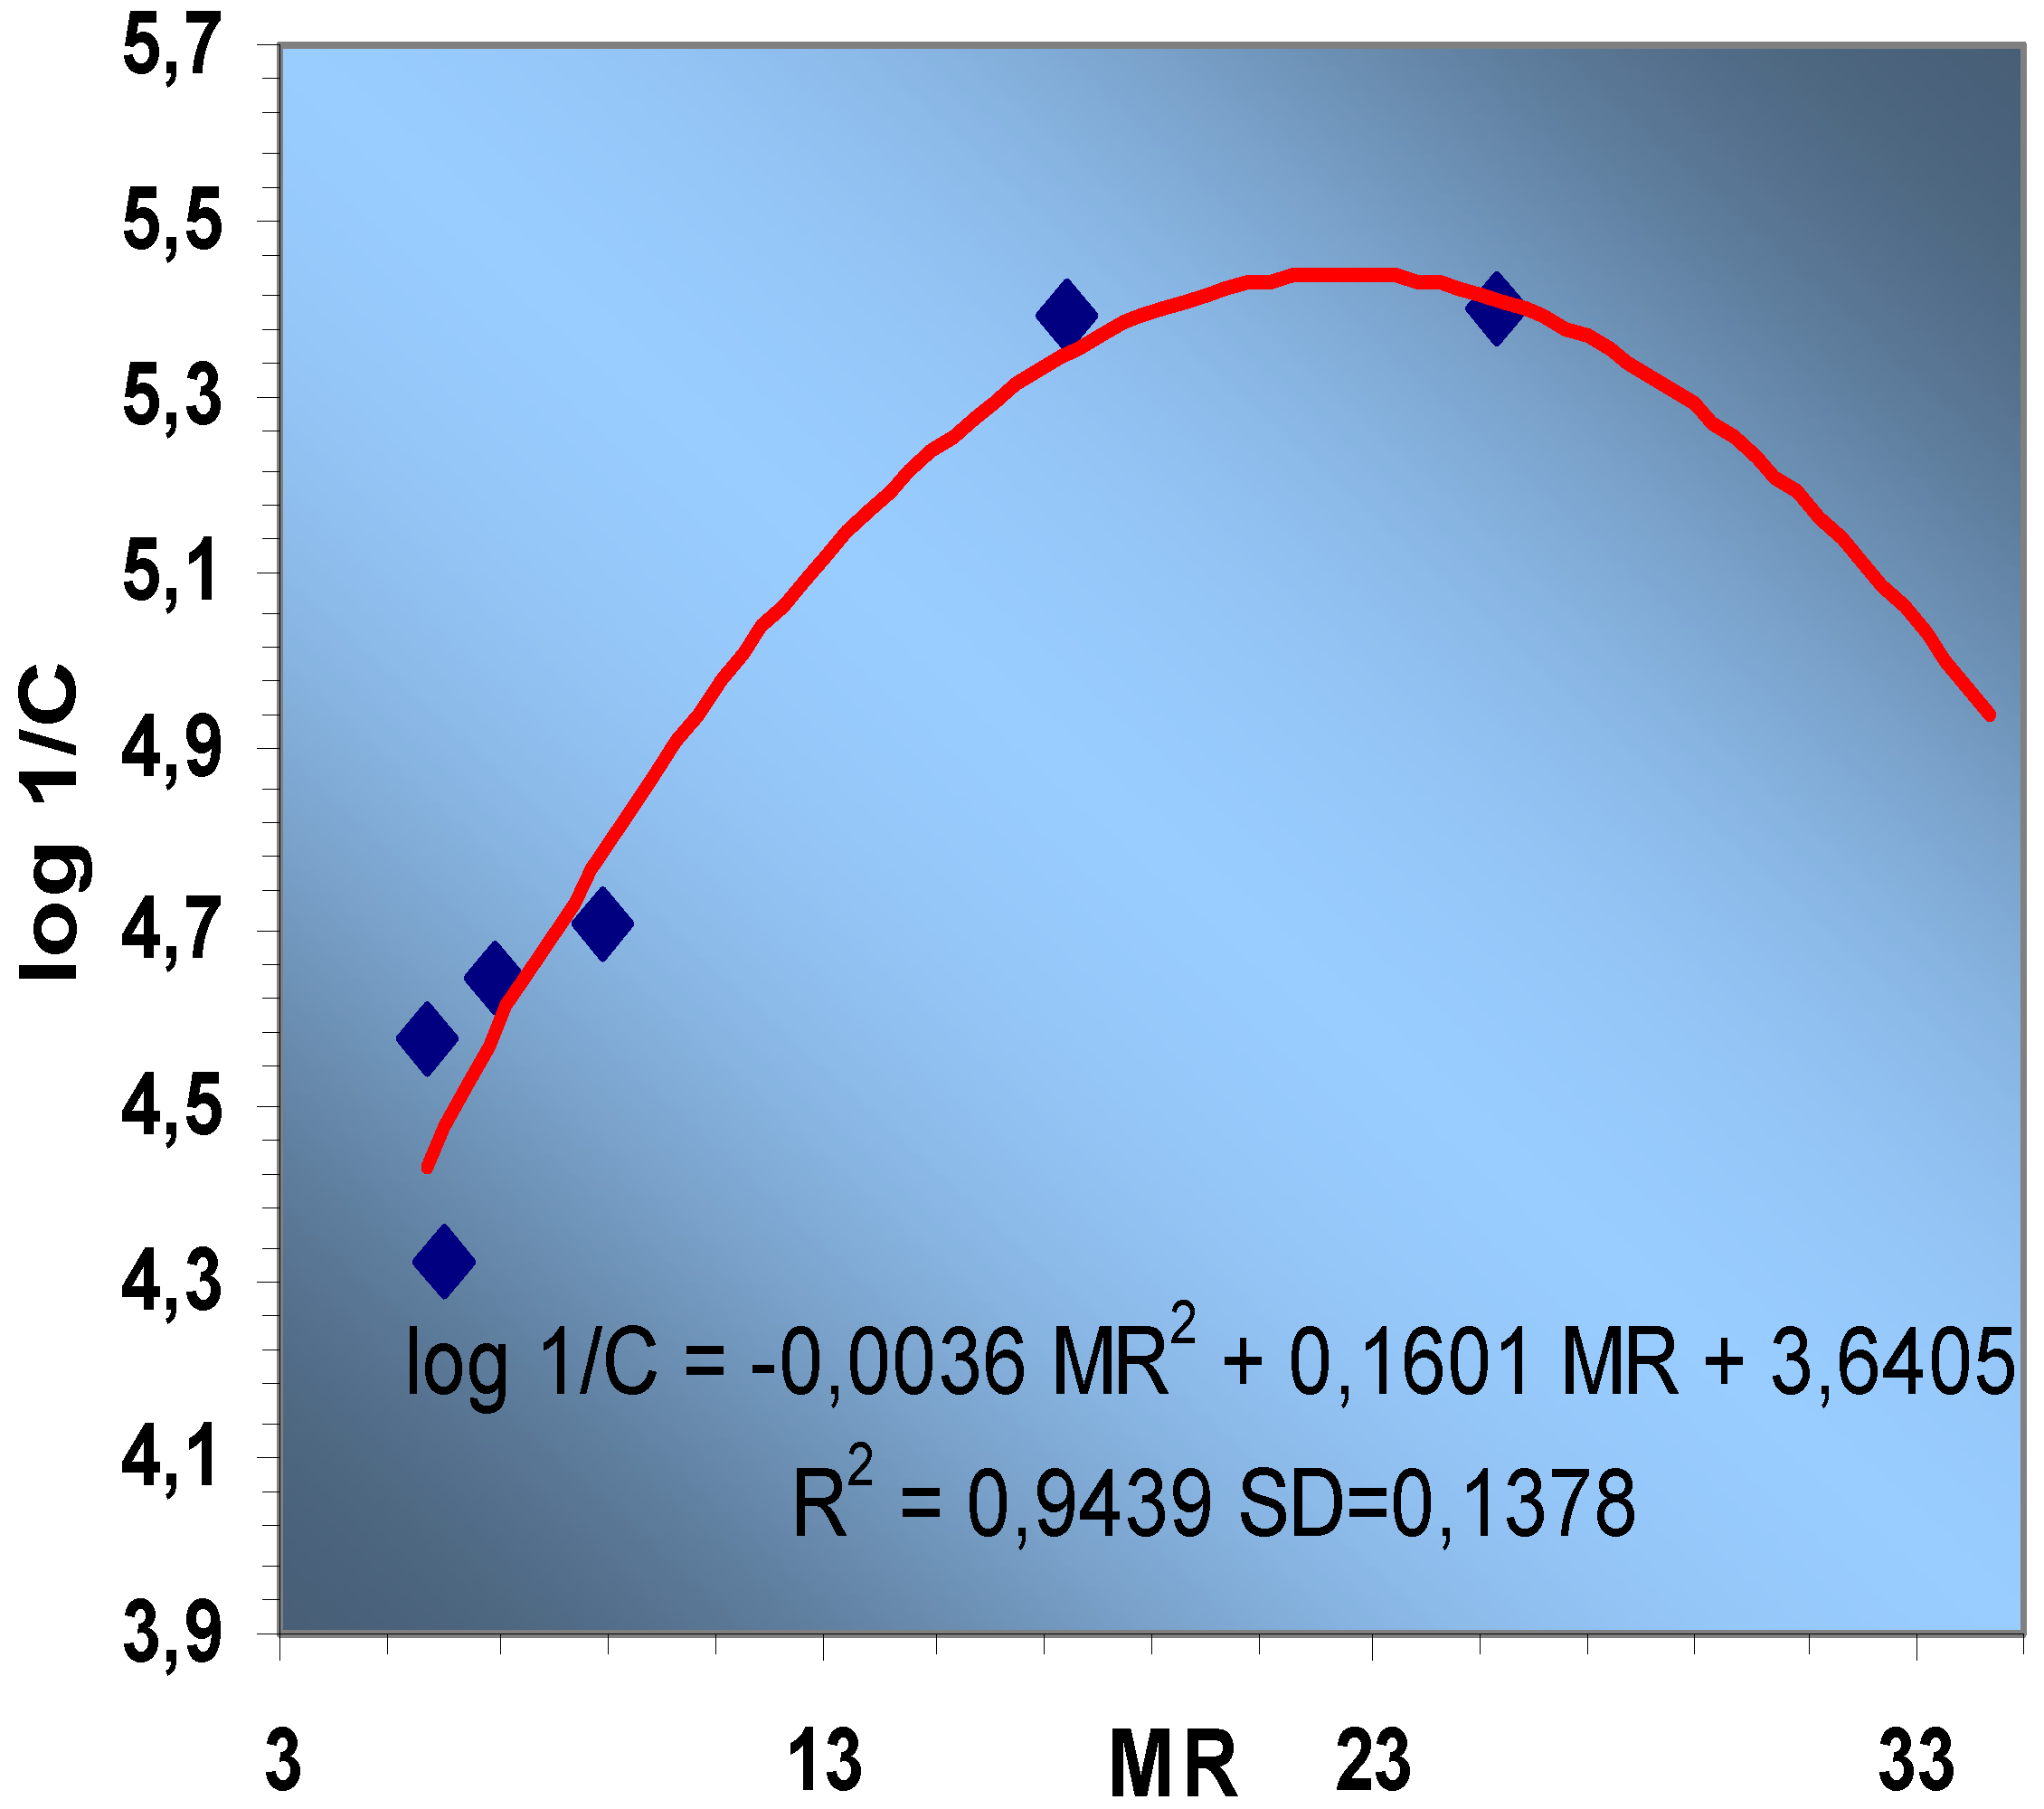
R2 = 0.9439 SD=0.1378
R=0.9679 SD=0.1462
| Correlation No | Correlation parameters used a | Slope Ai i=1-2 | Intercept B | R | SD | |
|---|---|---|---|---|---|---|
| 1 | σ | A1= | 0.2668 | 4.1667 | 0.9389 | 0.2002 |
| MR | A2= | 0.0528 | ||||
| 2 | σ | A1= | -0.2059 | 3.4557 | 0.9565 | 0.1697 |
| L | A2= | 0.3222 | ||||
| 3 | π | A1= | -3.0467 | 1.6286 | 0.9130 | 0.2373 |
| logP | A2= | 4.0843 | ||||
| 4 | π | A1= | -0.2347 | 4.2092 | 0.9647 | 0.1542 |
| MR | A2= | 0.0679 | ||||
| 5 | π | A1= | 0.6084 | 4.5146 | 0.9452 | 0.1899 |
| R | A2= | 2.8805 | ||||
| 6 | π | A1= | -0.0131 | 3.4419 | 0.9502 | 0.1812 |
| L | A2= | 0.3182 | ||||
| 7 | logP | A1= | -0.2789 | 4.3958 | 0.9556 | 0.1714 |
| MR | A2= | 0.0691 | ||||
| 8 | logP | A1= | 0.7156 | 3.9939 | 0.9679 | 0.1462 |
| R | A2= | 2.5765 | ||||
| 9 | logP | A1= | 0.0007 | 3.4492 | 0.9500 | 0.1815 |
| L | A2= | 003143 | ||||
| 10 | MR | A1= | 0.0495 | 4.2878 | 0.9599 | 0.1630 |
| R | A2= | 0.7650 | ||||
| 11 | MR | A1= | 0.0120 | 3.6068 | 0.9519 | 0.1780 |
| L | A2= | 0.2469 | ||||
| 12 | F | A1= | -0.4005 | 3.5676 | 0.9654 | 0.1517 |
| L | A2= | 0.3111 | ||||
| 13 | R | A1= | 0.1041 | 3.4743 | 0.9505 | 0.1807 |
| L | A2= | 0.3097 | ||||
| 14 | σ | A1= | -0.6667 | 3.3456 | 0.9736 | 0.1625 |
| π | A2= | -0.2226 | ||||
| L | A3= | 0.4036 | ||||
| 15 | π | A1= | -1.4854 | 3.0706 | 0.9866 | 0.1165 |
| logP | A2= | 1.7219 | ||||
| MR | A3= | 0.0476 | ||||
| 16 | π | A1= | -1.2182 | 3.0139 | 0.9853 | 0.1217 |
| logP | A2= | 2.0982 | ||||
| R | A3= | 1.8779 | ||||
| 17 | π | A1= | -1.7249 | 3.6820 | 0.9771 | 0.1513 |
| MR | A2= | 0.1866 | ||||
| R | A3= | -5.1995 | ||||
| 18 | logP | A1= | 1.8755 | 3.5299 | 0.9728 | 0.1649 |
| MR | A2= | -0.0812 | ||||
| R | A3= | 5.5237 | ||||
| Correlation No | Correlation parameters useda | Slope Ai i=1-4 | Intercept B | R | SD | |
|---|---|---|---|---|---|---|
| 1. | IH | A1= | 0.4783 | 3.8239 | 0.9034 | 0.2199 |
| MR | A2= | 0.0457 | ||||
| 2. | IH | A1= | 0.6556 | 3.5334 | 0.9289 | 0.2124 |
| σ | A2= | 0.4197 | ||||
| MR | A3= | 0.0483 | ||||
| 3. | IH | A1= | 0.6410 | 3.6390 | 0.9373 | 0.1998 |
| π | A2= | -0.2520 | ||||
| MR | A3= | 0.0629 | ||||
| 4. | IH | A1= | 0.442 | 3.9815 | 0.9138 | 0.2328 |
| logP | A2= | -0.1849 | ||||
| MR | A3= | 0.0562 | ||||
| 5. | IH | A1= | 0.6674 | 3.5784 | 0.9387 | 0.2282 |
| σ | A2 = | 0.1454 | ||||
| π | A3= | -0.1976 | ||||
| MR | A4= | 0.0600 | ||||
| 6. | I H | A1= | 0.6394 | 3.5760 | 0.9290 | 0.2449 |
| σ | A2 = | 0.3951 | ||||
| logP | A3= | -0.0300 | ||||
| MR | A4= | 0.0499 | ||||
| 7. | IH | A1= | 1.5164 | 1.8039 | 0.9885 | 0.0909 |
| π | A2 = | -1.2034 | ||||
| logP | A3= | 1.3356 | ||||
| MR | A4= | 0.0525 | ||||
R = 0.7171 SD = 0.3567
3. Conclusions
4. Experimental
4.1 Microbiology
4.2 QSAR analysis
| R | σa | π a | F a | R a | L a |
|---|---|---|---|---|---|
| p-COOC2H5 | 0.45 | 0.51 | 0.33 | 0.15 | 5.96 |
| p-COOH | 0.45 | -0.32 | 0.33 | 0.15 | 3.91 |
| o-COOH | 1.2 | -0.32 | 0.33 | 0.15 | 3.91 |
| p-Cl | 0.23 | 0.71 | 0.41 | -0.15 | 3.52 |
| p-Br | 0.23 | 0.86 | 0.44 | -0.17 | 3.83 |
| p-CH3 | -0.17 | 0.56 | -0.04 | -0.13 | 3.00 |
| p-C6H5 | -0.01 | 1.96 | 0.08 | -0.08 | 6.28 |
| p-NO2 | 0.78 | -0.28 | 0.67 | 0.16 | 3.44 |
| Compound | 1 | 2 | 3 | 4 | 5 | 6 | 7 | 8 | 9 | 10 | 11 | 12 | 13 | 14 | 15 | 16 |
|---|---|---|---|---|---|---|---|---|---|---|---|---|---|---|---|---|
| IH | 1 | 1 | 1 | 1 | 1 | 1 | 1 | 1 | 0 | 0 | 1 | 1 | 1 | 1 | 1 | 1 |
| I=CH- | 1 | 1 | 1 | 1 | 1 | 1 | 1 | 1 | 1 | 1 | 0 | 0 | 0 | 0 | 0 | 0 |
References
- Available online: http://www.chem.swin.edu.au/modules/mod4/index.html.
- Hansch, C.; Leo, A. Exploring QSAR: Fundamentals and Applications in Chemistry and Biology; American Chemical Society: Washington, DC, 1995. [Google Scholar]
- Karelson, M.; Lobanov, V.; Katritzky, A. Chem. Rev. 1996, 96, 1027–1043. [CrossRef]
- Jones, D.H.; Slack, R.; Squires, S.; Woolridge, K.R.H. J. Med. Chem. 1965, 8, 676–680. [CrossRef]
- Goswami, B.N.; Kataky, J.C.S.; Baruah, J.N. J. Heterocyclic Chem. 1984, 21, 1225–1229. [CrossRef]
- Holla, B.S.; Kalluraya, B.; Sridhar, K.R. Curr. Sci. 1987, 56, 236–239.
- Mishra, R.K.; Tewari, R.K.; Srivastava, S.K.; Bahel, S.C. J. Indian Chem. Soc. 1991, 68, 1.
- Colanceska, K.; Dimova, V.; Kakurinov, V.; Molnar-Gabor, D.; Buzarovska, A. Molecules 2001, 6, 815–824. [CrossRef] [Green Version]
- Perisic-Janjic, N.; Acinski, M.; Janjic, N.; Lazarevic, M.; Dimova, V. J. Planar Chromatogr. 2000, 13, 281–284.
- Lazarevic, M.; Dimova, V.; Molnar Gabor, D.; Kakurinov, V.; Colanceska Ragenovic, K. Heterocycl. Comm. 2001, 7, 577–582.
- Spasovska-Gerasimova, B.; Ilievska, S.; Colanceska Ragenovic, K.; Lazarevic, M.; Dimova, V. Vlákna a textil 2002, 9, 46–49.
- Available online: http://esc.syrres.com/interkow/kowdemo.htm.
- Rollas, S.; Kalyoncuoglu, N.; Sür-Altiner, D.; Yegenoglu, Y. Pharmazie 1993, 48, 308–309.
© 2006 by MDPI (http://www.mdpi.org). Reproduction is permitted for noncommercial purposes.
Share and Cite
Dimova, V.; Ragenovic, K.C.; Kakurinov, V. QSAR of Some N1-Aryl/Heteroarylaminomethyl/ethyl-1,2,4-Triazoles Part II: Antimicrobial Activity Against BacillusSubtilis. Int. J. Mol. Sci. 2006, 7, 119-129. https://doi.org/10.3390/i7040119
Dimova V, Ragenovic KC, Kakurinov V. QSAR of Some N1-Aryl/Heteroarylaminomethyl/ethyl-1,2,4-Triazoles Part II: Antimicrobial Activity Against BacillusSubtilis. International Journal of Molecular Sciences. 2006; 7(4):119-129. https://doi.org/10.3390/i7040119
Chicago/Turabian StyleDimova, Vesna, Katica Colanceska Ragenovic, and Vladimir Kakurinov. 2006. "QSAR of Some N1-Aryl/Heteroarylaminomethyl/ethyl-1,2,4-Triazoles Part II: Antimicrobial Activity Against BacillusSubtilis" International Journal of Molecular Sciences 7, no. 4: 119-129. https://doi.org/10.3390/i7040119