In Silico Design in Homogeneous Catalysis Using Descriptor Modelling

Van ’t Hoff Institute for Molecular Sciences, University of Amsterdam, Nieuwe Achtergracht 166, 1018 WV Amsterdam, The Netherlands.
*
Authors to whom correspondence should be addressed.
Int. J. Mol. Sci. 2006, 7(9), 375-404; https://doi.org/10.3390/i7090375
Submission received: 31 July 2006
/
Revised: 5 September 2006
/
Accepted: 20 September 2006
/
Published: 28 September 2006
(This article belongs to the Special Issue Virtual Combinatorial Synthesis and Drug Design)
Abstract
:This review summarises the state-of-the-art methodologies used for designing homogeneous catalysts and optimising reaction conditions (e.g. choosing the right solvent). We focus on computational techniques that can complement the current advances in high-throughput experimentation, covering the literature in the period 1996-2006. The review assesses the use of molecular modelling tools, from descriptor models based on semiempirical and molecular mechanics calculations, to 2D topological descriptors and graph theory methods. Different techniques are compared based on their computational and time cost, output level, problem relevance and viability. We also review the application of various data mining tools, including artificial neural networks, linear regression, and classification trees. The future of homogeneous catalysis discovery and optimisation is discussed in the light of these developments.
Table of Content
- 1.
- Introduction
- 1.1
- Combinatorial Methods in Homogeneous Catalysis
- 1.2
- Computational Approaches in Catalysis Research
- 2.
- Descriptors and Molecular Modelling in Homogeneous Catalysis
- 2.1
- 3D-Descriptors
- 2.2
- The CoMFA Method
- 2.3
- The Ligand Repulsive Energy Method
- 2.4
- 2D and 1D Descriptors
- 2.5
- Modelling the Chemical and Physical Properties of Solvents
- 2.6
- Using Descriptors: Pros and Cons
- 3.
- Modelling and data analysis
- 3.1
- Partial Least-Squares Models
- 3.2
- Artificial Neural Networks and Classification Analysis
- 3.3
- General Methodology in Data Analysis
- 4.
- Conclusions and Outlook
1. Introduction
1.1 Combinatorial Methods in Homogeneous Catalysis
The chemical industry is under increasing pressure to lower costs, develop environmentally friendly processes and products, and shorten the time to market. This drives research and development groups to generate more ideas, improve success rates, and shorten lead and development times, all while lowering research costs. These issues were first encountered in the pharmaceutical industry, where long development times and high research costs forced the development of new approaches that accelerated the drug discovery process. Companies are embracing new research methods that are changing the basic ways of research. These include combinatorial synthesis and high-throughput screening techniques, often characterized by the use of robotics and specialised software. In homogeneous catalysis, the application of combinatorial methods to catalyst discovery is an iterative process that involves three steps (Scheme 1).
Scheme 1.
Flowchart for iterative optimisation in homogeneous catalysis, using a combination of parallel synthesis, screening and modelling.
Scheme 1.
Flowchart for iterative optimisation in homogeneous catalysis, using a combination of parallel synthesis, screening and modelling.
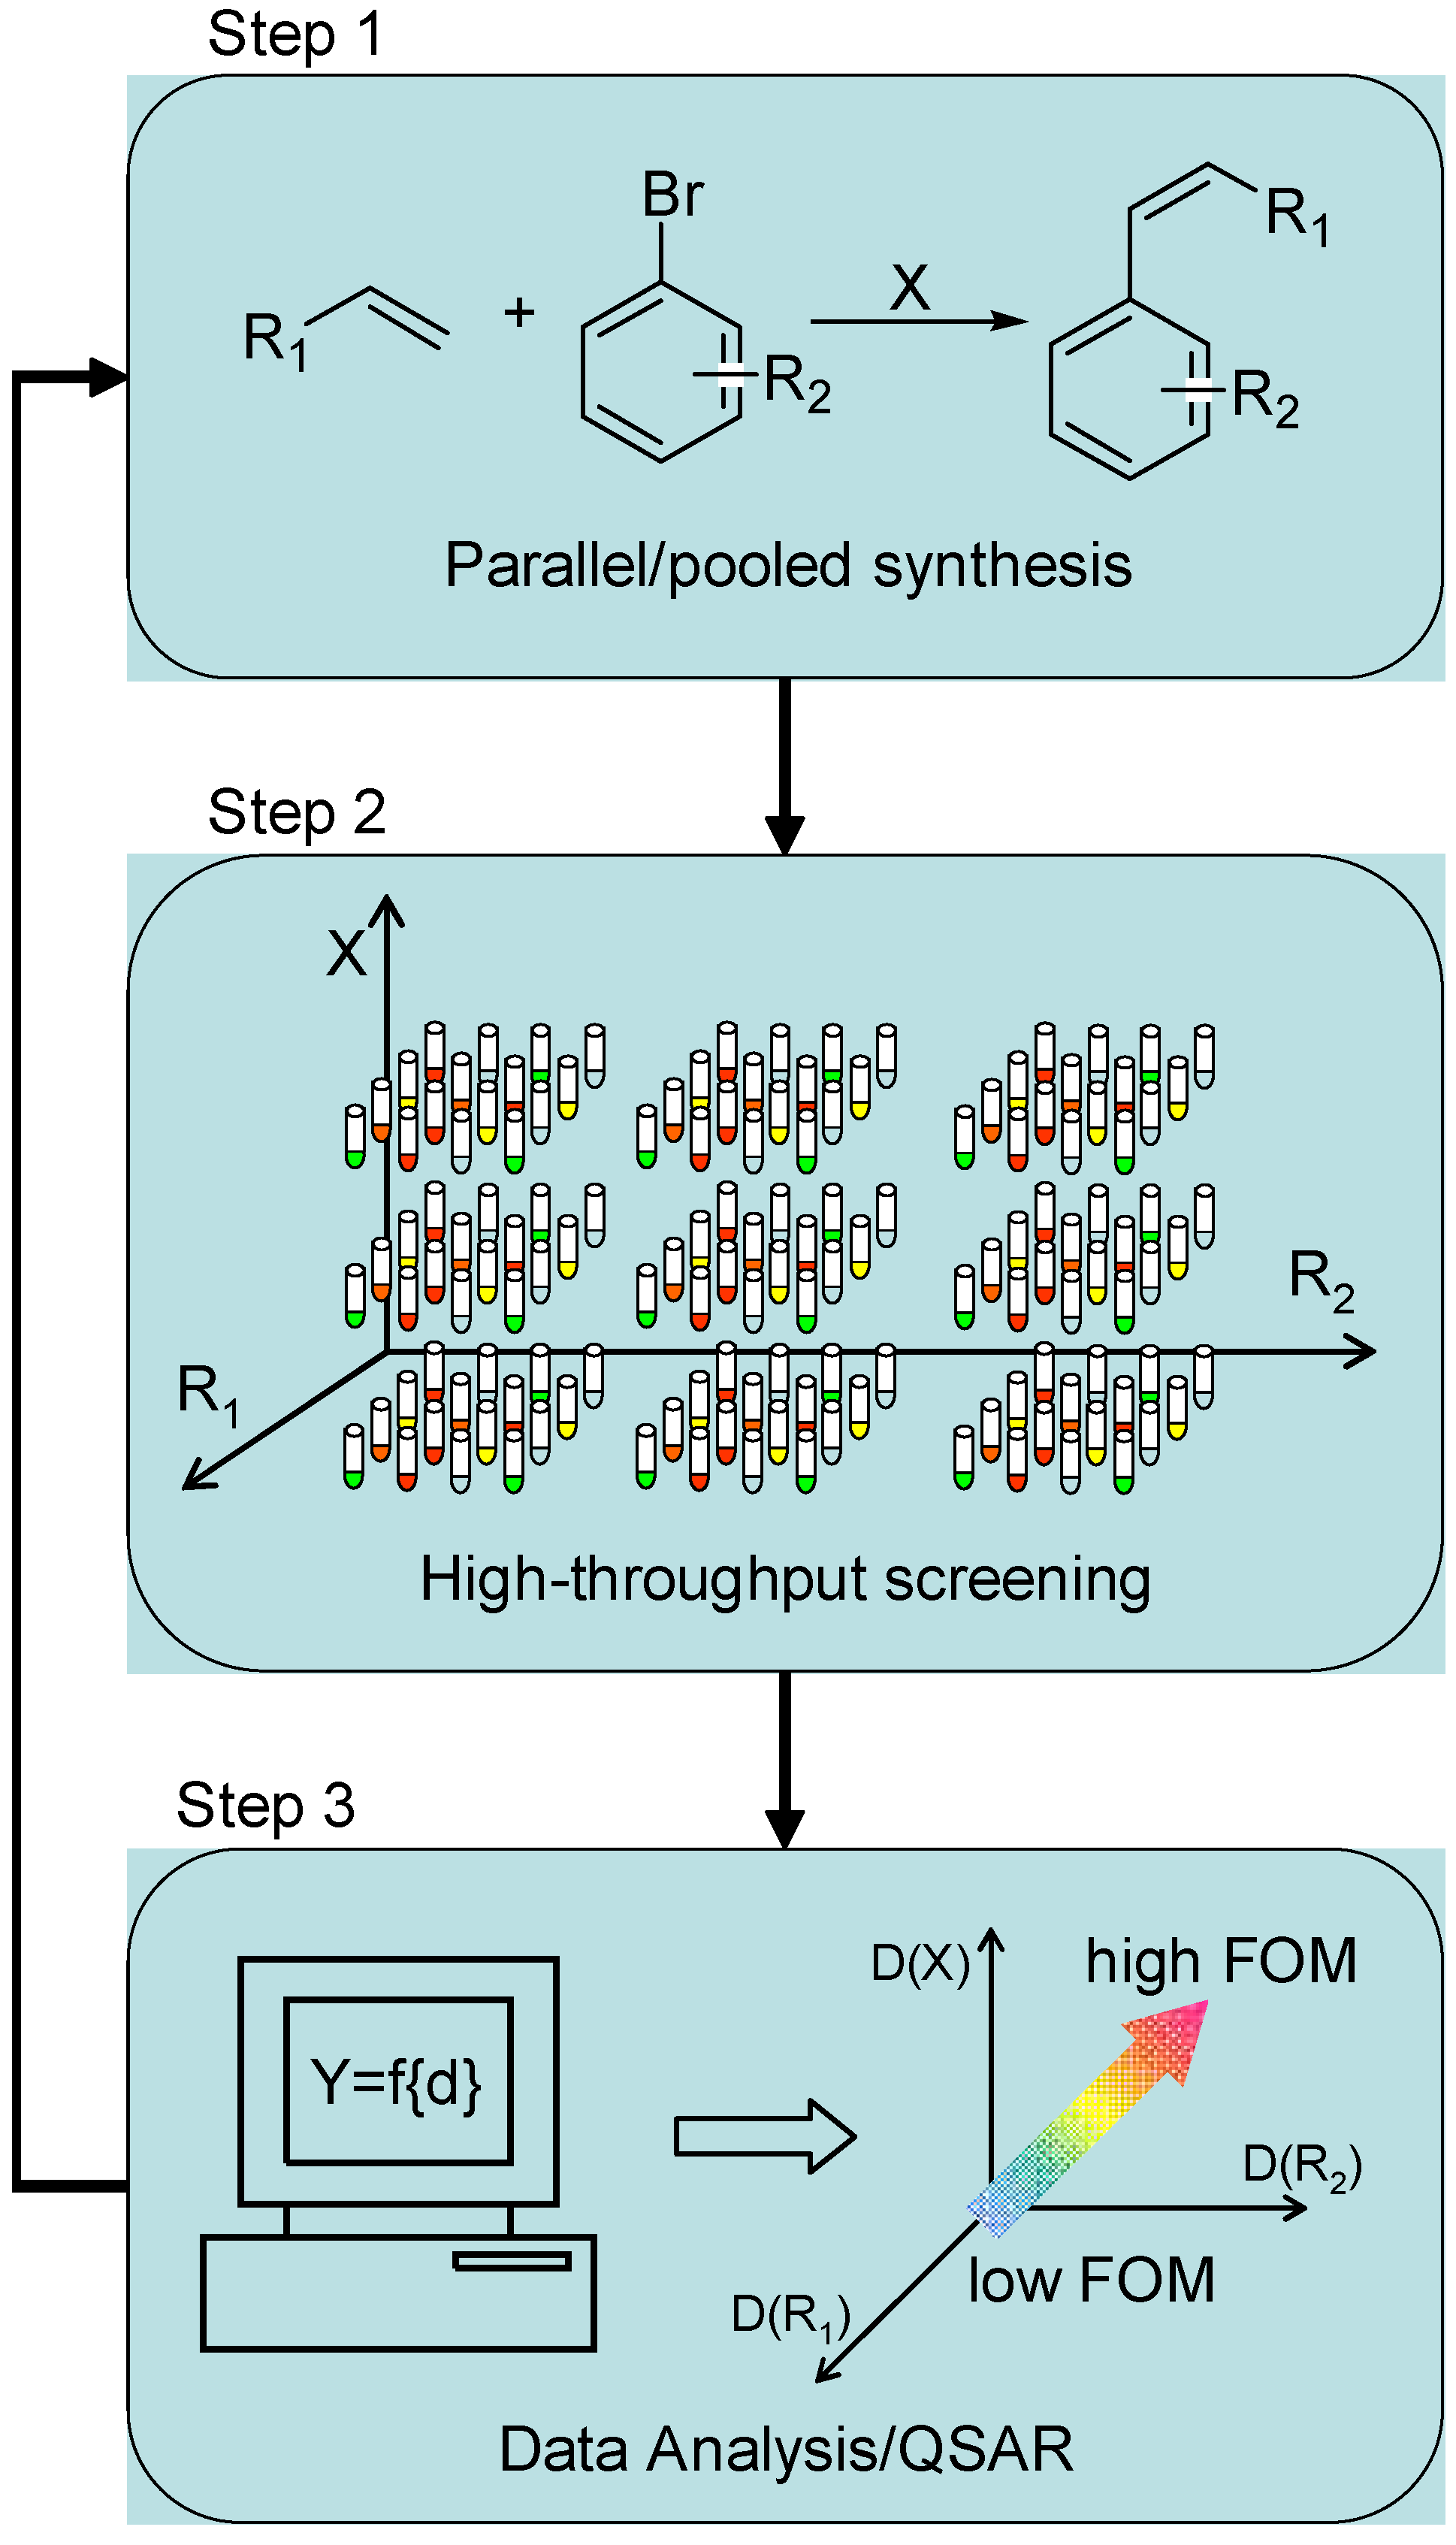
The first step is the rapid synthesis of a library of catalyst candidates with related structures.[1] This is done by finding an appropriate synthetic method with few steps of high product/intermediate conversion that can be implemented on a robot-synthesizer. In the second step, the catalyst candidates are tested in parallel for a desired property. This is the ‘figure of merit’ (FOM). Typical FOMs can be product selectivity, turnover frequency, enantioselectivity and price/activity quotients. The third step is the data analysis, relating the chemical properties of the system to the figure of merit. In this way, the search for a new homogeneous catalyst is similar to searching for an optimal region in a multi-dimensional space. Combinatorial techniques are suited to problems where the parameter space is too large to be addressed efficiently using conventional methods, and where the outcome is the result of an unpredictable interdependence among the variables. Once an initial hit is identified in the first screening, new libraries may be constructed that sample smaller regions of the space around this hit.
In homogeneous catalysis, the active site is most often a metal ion stabilized by an organic ligand. Library synthesis is done using combinatorial organic synthesis followed by metal complexation. This approach can utilize both solid-phase and solution-phase synthetic methods, including parallel synthesis, split-pool techniques, encoding/deconvolution techniques and polymer-supported reagents. Methods such as split-pool are much faster than traditional serial synthesis. They enable the preparation of large numbers of compounds. However, they offer less control over the purity of the compounds entering the screen. To address these limitations, there are intermediate methods which are based on parallel or array synthesis in a spatially addressable format. This type of synthesis is often done in 96-well plates, with one compound per well, and is usually coupled to automated screening.
The catalyst screening (or assay) can be either parallel or sequential: in a parallel assay, all the data are collected at once, whereas in the other case each data point is obtained independently. Continuous assays have the advantage of allowing the monitoring of a reaction in real time; others require some action for gathering the data, such as taking a sample, in which case the method is discontinuous. The experimental methods also vary in their precision, from a qualitative indication to detailed quantitative analysis of all species present. There is a trade-off between quantitative precision and assay time and cost. A full combinatorial workflow will most often have a hierarchy of parallel assays, starting with a qualitative initial screen of many candidates and ending with an in-depth analysis of a few promising ones.
Although high-throughput screening technologies in homogeneous catalysis are fairly recent, they already resulted in a number of important hits. These include catalysts for oxidations reactions,[2] Suzuki,[3, 4] Heck and Sonogashira cross-coupling,[4,5,6] Ullmann ether formation,[7] hydrogenation, [8] and cross-coupling via C-H activation[9, 10]. Table 1 shows some examples of catalysts and reaction conditions that were optimized by high-throughput screening techniques. Sigman and Jacobsen[11] developed a Schiff base ligand for the asymmetric Strecker reaction. The catalyst, in this case, was immobilized into a PEG-grafted polystyrene resin. It included a linker to the resin, an amino acid, a second linker and the metal binding moiety shown in Table 1, entry 1. Burgess et al.[12] discovered a new catalyst for intramolecular C-H insertion reaction by high-throughput catalyst screening. Rh-carbenes derived from α-diazo esters allow for the synthesis of indolyl derivatives (entry 2). Long and co-workers[10] screened several titanium catalysts for asymmetric hetero-Diels-Alder reactions. Diol-type ligands were the most active and selective (entry 3). The Heck coupling reaction was optimized using a fluorence-based high-throughput screening by Shaughnessy et al. (entry 4).[13] A ferrocene based catalyst was found to be the most active. Kagan’s group investigated an alternate screening approach, the ‘one-pot multi-substrate’ screening concept.[14] As a test reaction, the authors chose the reduction of various aromatic ketones to the corresponding alcohols with a chiral oxazaborolodine (entry 5).

| Entry | Test reaction | Discovered/optimized catalyst |
| 1 |  |  |
| 2a |  |  |
| 3 |  |  |
| 4 |  |  |
| 5b |  |  |
a R = L-Menthyl; DDQ = 2,3-dichloro-5,6-dicyano-1,4-benzoquinone.
b R = Ph; R’ = alkyl, aryl.
1.2 Computational Approaches in Catalysis Research
Theoretical calculations of catalyst systems have grown explosively over the past two decades, advancing from questions of academic interest to solving commercial problems. This growth has dealt in large measure with ligand modification in order to achieve the desired activity and selectivity. In some cases, the models have led to the production of excellent catalysts. Some of the new metallocene catalysts, for example, exhibit turnover frequencies that rival those of enzymes.[15]
A major challenge for theoretical modelling of metal-catalyzed reactions is choosing the computational model system. Experimental systems include catalyst precursors, solvents, counterions and substrates. Modelling such a complex system in detail is impractical. Moreover, in most cases, transition metal atoms are involved, requiring models of d-electrons or molecular mechanics forcefields parameterized for that metal. Catalysis deals with kinetics, so identifying transition states is important in determining the activation energy and reaction rates. All these factors cannot be included in a single model. Instead, one must compromise and choose a smaller model system that (hopefully) mimics the real one.
In combinatorial design one seeks the quickest way for calculating molecular descriptors, the properties that represent uniquely each structure involved in the reaction. These parameters are then used to predict the experimental catalyst activities via a Quantitative Structure-Activity Relationship (QSAR) equation. QSAR relates the descriptors to the figure of merit (FOM). Ab initio calculations are too costly for screening large libraries of catalysts. Therefore, one must rely on soft computational methods. Using these methods, one can calculate many properties for each separate structure (ligand, metal atom, or substrate) rather than modelling all parts together as in QM studies. This yields a large number of parameters that must be ranked and correlated to the figure of merit. A disadvantage of this approach is that there is no guarantee that the model includes all the important parameters. One way to solve this is simply to calculate as many descriptors as possible and then use selection algorithms and ‘chemical intuition’ to find the most relevant ones. In contrast to QM calculations, where the results are obtained by comparing differences in energies, these structure-activity relationships are purely empirical correlations. However, they have a chemical meaning and can be used to explain reaction mechanisms and predict catalytic properties of virtual candidates.
Another key point is the proper treatment of catalyst diversity.[16,17,18] QSAR methods need experimental values for creating a model. Therefore, an initial set of reactions must be selected from the catalyst space. This step, which involves the selection of a suitable synthetic method and proper building blocks, should also deal with the concept of molecular diversity. It is not clear what “catalyst diversity” actually is or how one should define it. The catalyst space is both large and multi-dimensional, and sampling it is a complex problem. The concept of a search in the ‘diversity space’ is mirrored by that of searching for energy minima within the conformational space of molecules. Thus, there are strong parallels between stochastic methods and parallel combinatorial search methods. Equivalents to the random search methods, such as Monte Carlo, simulated annealing and genetic algorithms must be used in such situations. In highly complex systems, it is easy to be biased by conventional wisdom. To study such problems, it is therefore essential to generate new information covering as wide a range of the space as possible. This could involve an initial low resolution search for preliminary solutions, with subsequent in-depth study of promising regions. Additionally, one can cross-breed divergent hits that may seem unconnected at first sight. This last approach uses genetic algorithms and allows predictive models to be computationally generated, using artificial neural networks.
2. Descriptors and Molecular Modelling for Homogeneous Catalysis
2.1 3D-Descriptors
The first set of stereo-electronic descriptors designed for catalysis was proposed by Tolman in the 70’s.[19,20,21,22] He studied the σ-basicity and π-acidity of phosphorous ligands by looking at the stretching frequencies of the co-ordinated carbon monoxide ligands in complexes such as NiL(CO)3 or CrL(CO)5, where L is the phosphorous ligand. Tolman characterized the steric bulk of a monophosphine ligand by measuring its cone angle (θ). For symmetrical ligands (those carrying the same substituents), θ is defined as the apex angle of a cylindrical cone, with an origin 2.28 Ǻ from the center of the phosphorous atom. The cone sides are tangent to the van der Waals surfaces of the outermost atoms of the ligand substituents. For asymmetrical phosphines, Tolman suggested that the ‘effective cone angle’ is the average the three semicone angles (i.e., the angles formed by the Metal–P axis and the three P–S axis, where P–S is tangent to the vdW surface of the outermost atom in each of the substituents).
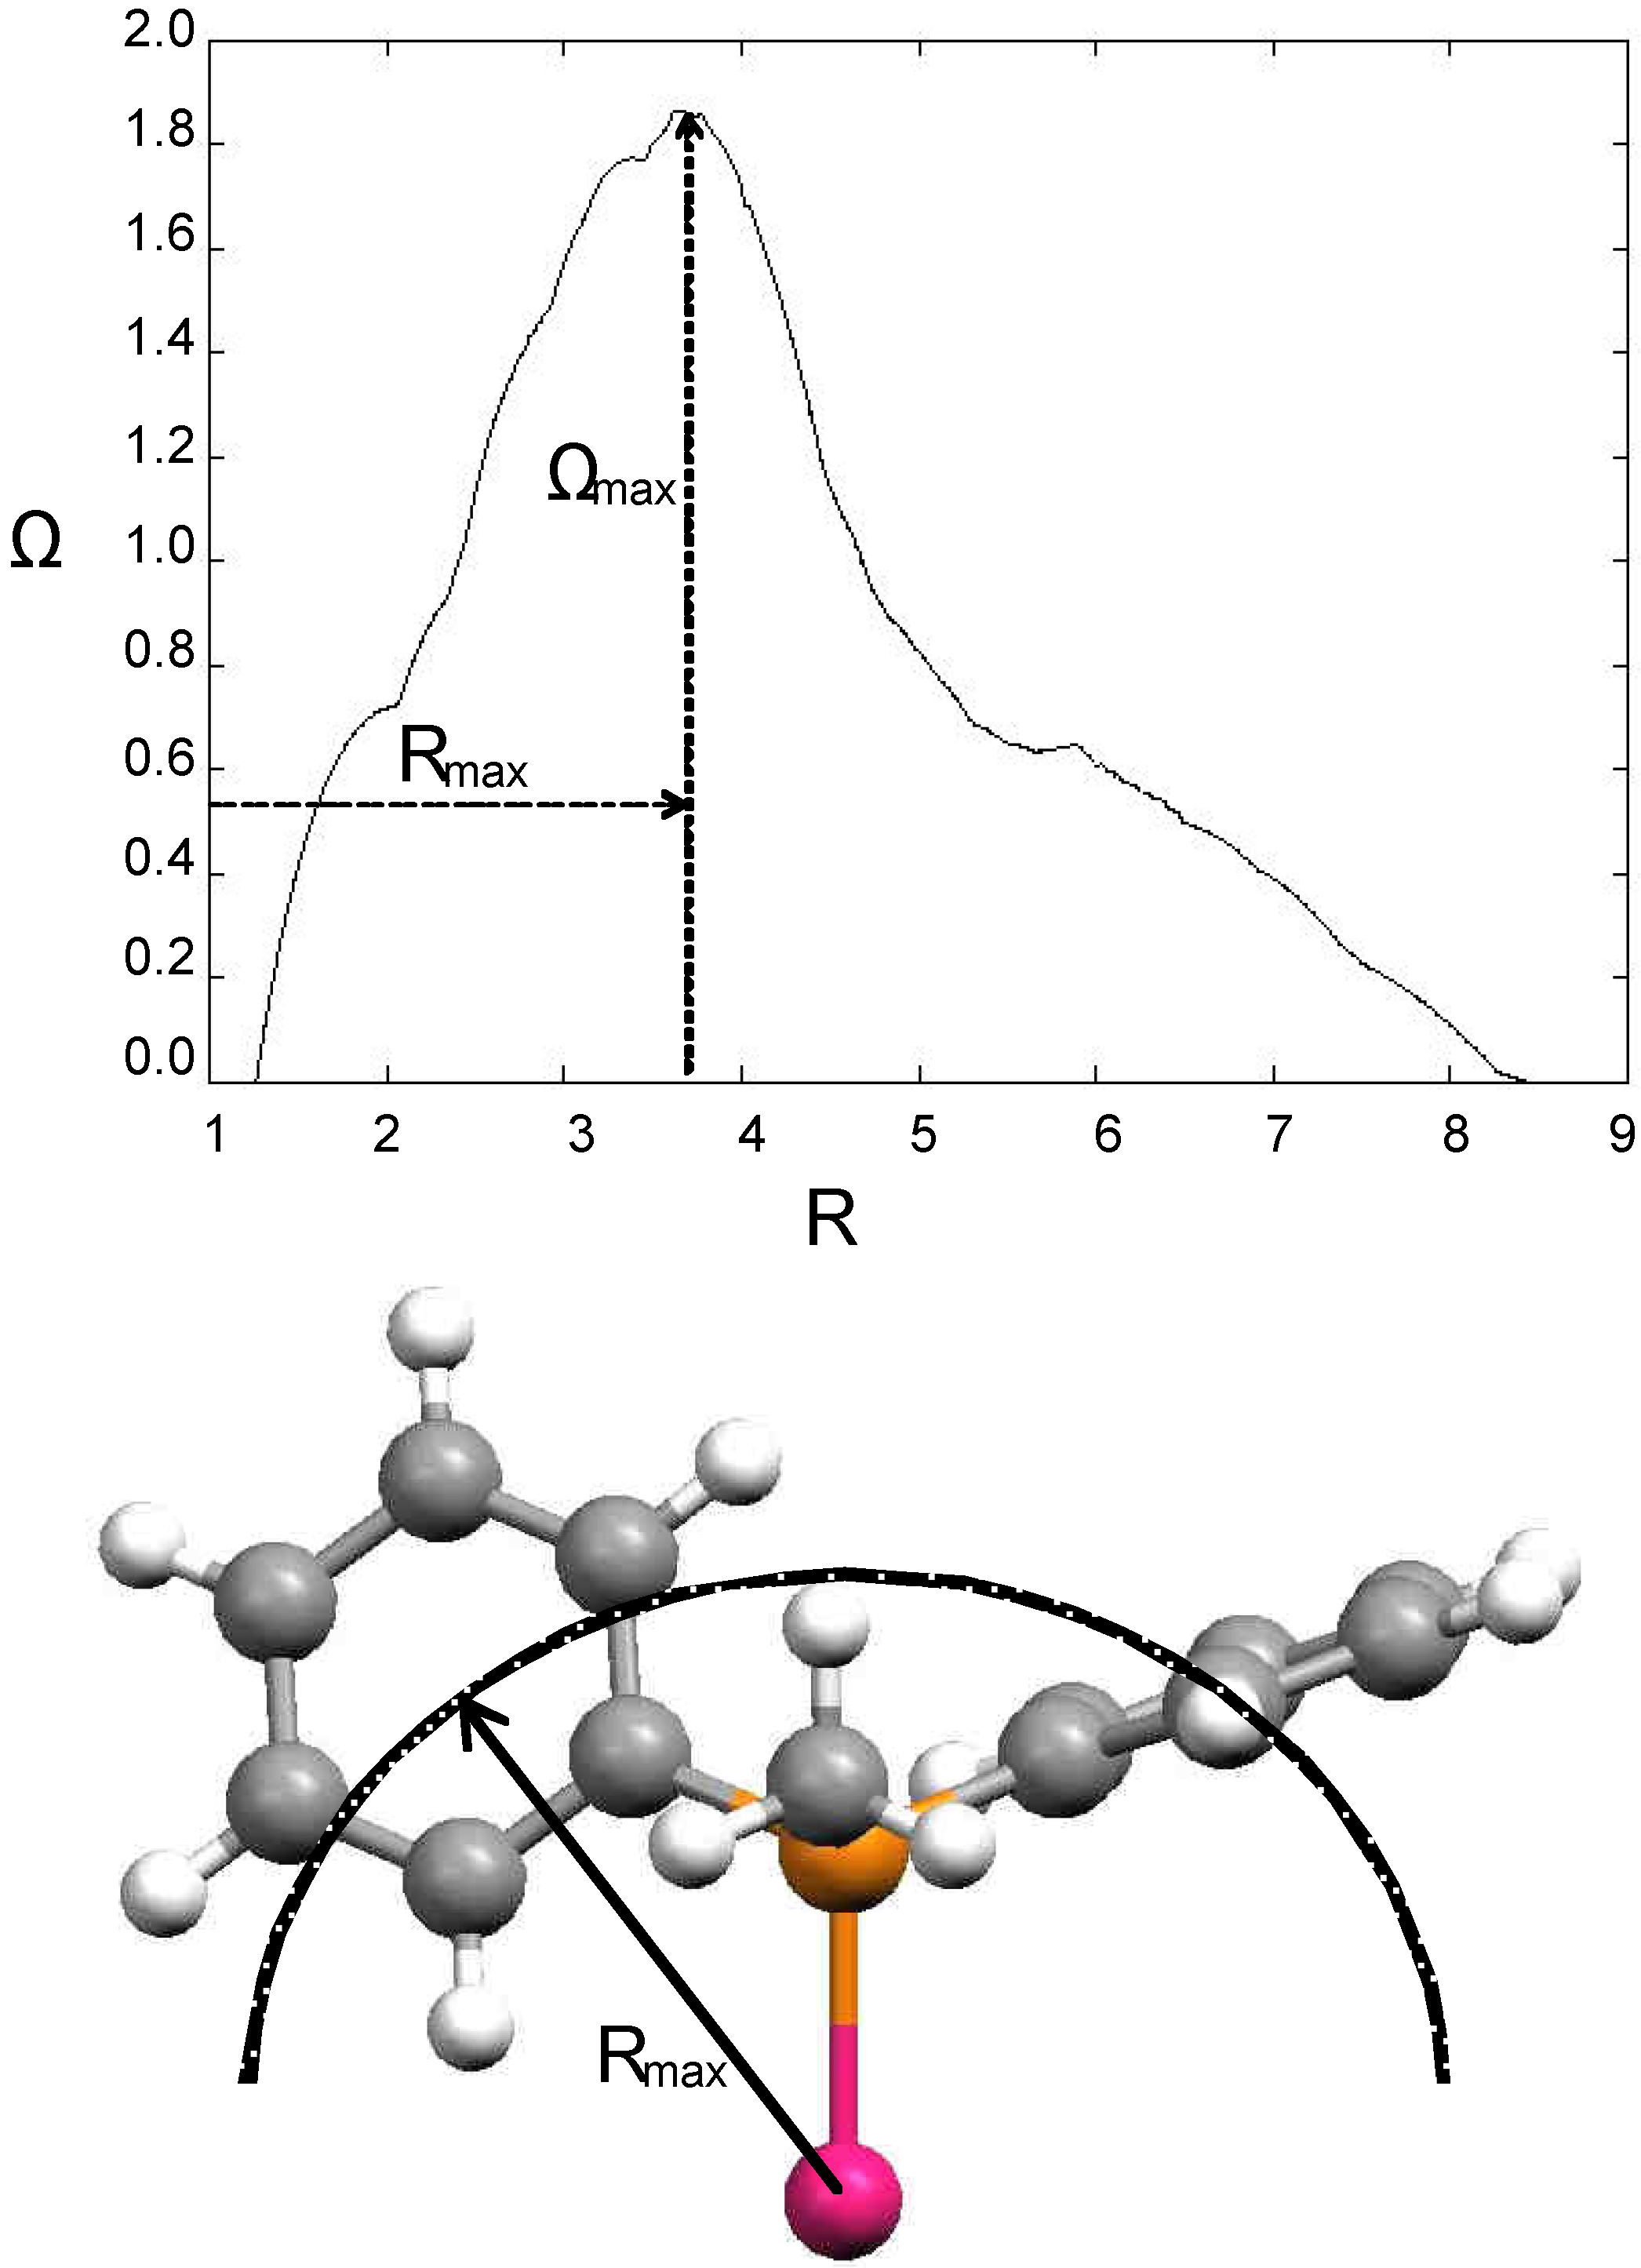
Many attempts were undertaken to define a reliable steric parameter.[23] Tolman’s cone angle model is simple and generally applicable. However, it has several limitations. Substituents groups on ligands bound to the same metal center can sometimes mesh with one another, permitting closer packing of ligands than would be expected from cone angle values. Moreover, when the ligand environment is crowded, low-energy bending distortions can occur. Another problem stems from the fact that ligands rarely form a perfect cone (e.g. when the substituents on the ligating atom are different from each other); in some cases the sterics near the metal centre are important, while in others the bulk formed far from the metal centre plays a determinant role. On the basis of these considerations several modifications and extensions of the cone angle concept were made. These elaborations include mathematical methods,[24, 25] calculations based on X-ray structural data,[17, 26,27,28] and solid cone angle measures.[29,30,31,32,33,34,35,36,37,38] White et al. wrote a program (Steric®) for calculating the steric size of molecules around a point (e.g. the metal atom) or by projection on a directional area (e.g. the XY plane). Parameters derived from the first case view the ligand from the metal atom and are applicable in situations where the sterics around a point atom are important (e.g. in stereoselective synthesis or metal coordination). Ligand sterics can be also viewed as a radial distribution function. In this approach, one measures the size of the ligand along a growing sphere centered on the metal atom. This creates a steric profile where the radius of the sphere is correlated to the bulk of the ligand. Rmax denotes the radius of the sphere where the ligand’s solid angle is maximal. Examples where the molecular orthogonal projection is of interest are molecule-surface interactions and π-stacking interactions. The program also calculates the steric size of conformer averages. This value is obtained from a weighted average of conformer sterics, the weights being calculated from the energies obtained using another program that generates conformer data. Figure 1 shows a steric profile of the PPH2Me ligand calculated using the Steric software.[39]
Figure 1.
Some steric descriptors calculated with the Steric® program. (top) Steric profile for the monophosphine PPh2Me ligand. R is the radius of the growing sphere centered on the metal atom. Rmax is the distance between the Pd atom and the bulkiest cross-section of the ligand, Ωmax is the solid angle at this cross-section. (bottom) 3D representation of the ligand steric parameter Rmax

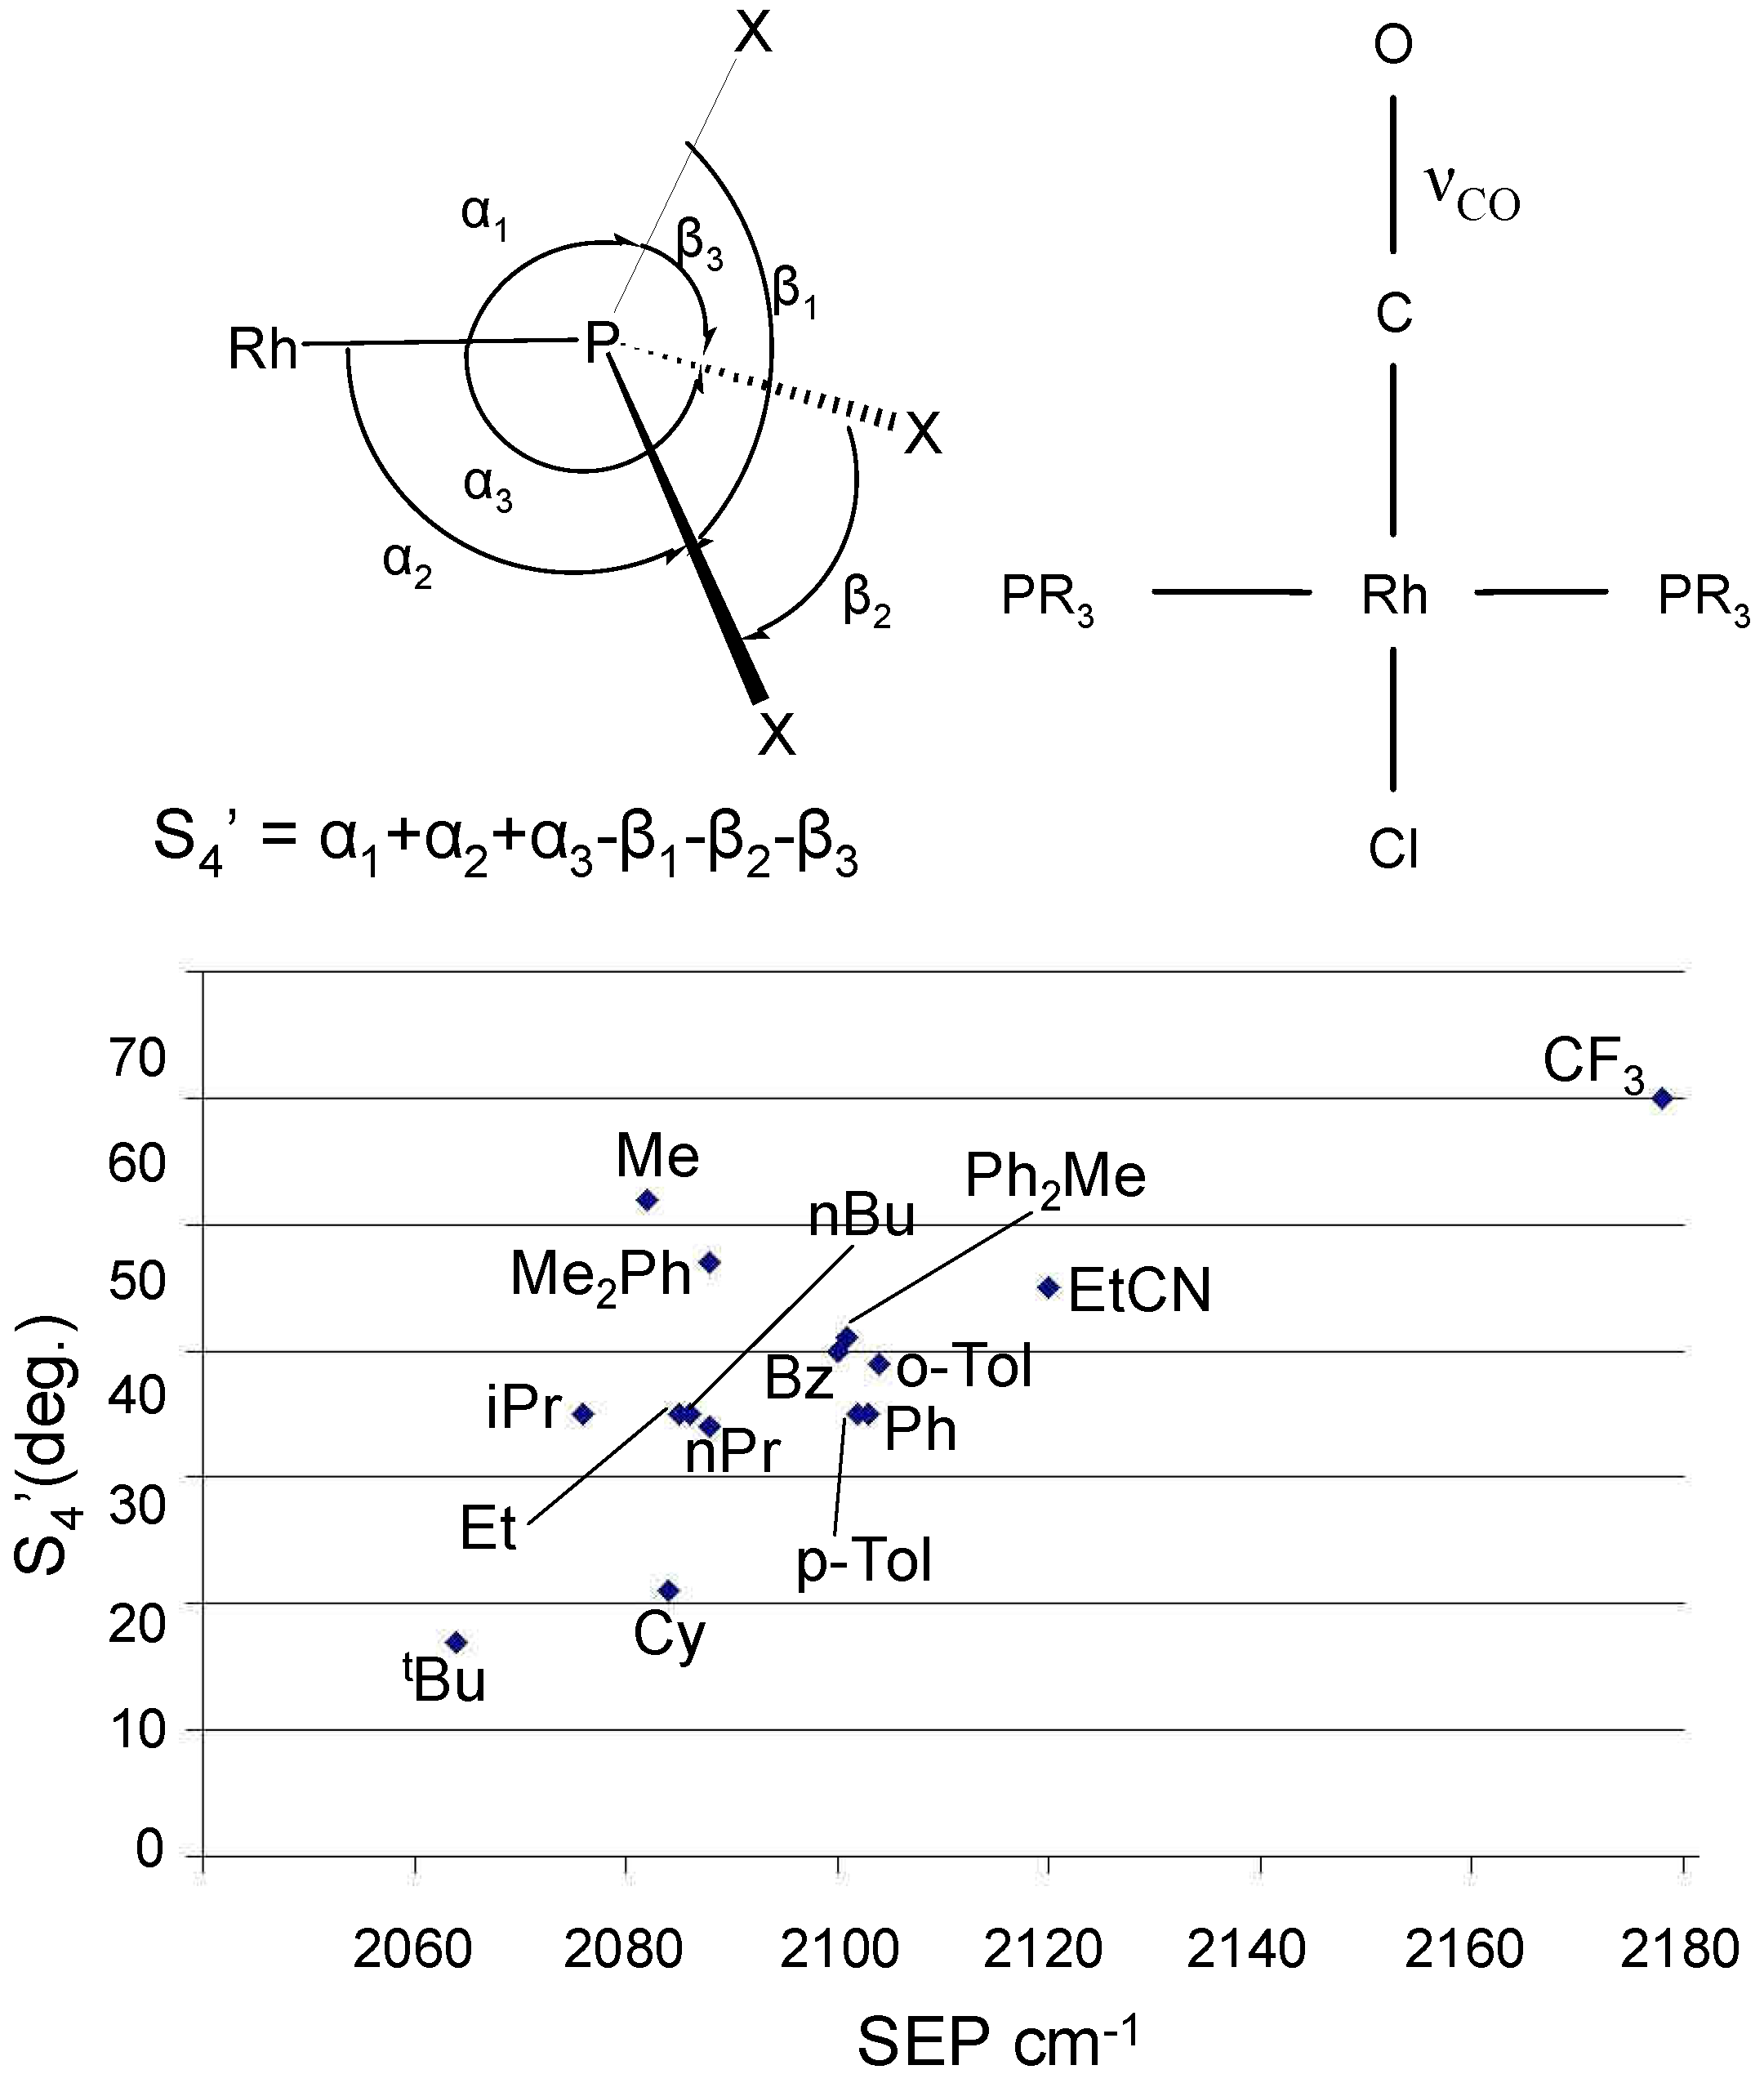
Cooney et al. developed a two dimensional stereo-electronic map for characterizing phosphines and phosphates using semi-empirical PM3tm methods (see Figure 2).[40] Semi-empirical Quantum Mechanics (SEQM) methods are faster than ab initio calculations. Moreover, they are easily applied to medium size libraries (100–1000 compounds). In combinatorial design this work fits well because it relies on fast and reliable calculations of parameters that are known to affect the catalytic process of transition metal catalyzed reactions. Using a simple 2D plot, the catalyst designer can achieve the maximum degree of chemical diversity among libraries and therefore enrich the ligand set with new diverse structures. In this way “empty holes” in the experimental space are filled by virtual ligands, and highly populated areas can be reduced by discarding duplicate molecules. The result is a highly diverse ligand library.
Figure 2.
(top) Descriptors calculated for phosphines in the trans-Rh(PR3)2(CO)Cl catalyst (values taken from Cooney et al.). The deformation coordinate S4’ is employed as steric measure. For the same PM3(tm)-optimized geometry, the IR spectrum was also calculated yielding the SEP parameter (CO stretching frequency). (bottom) Stereoelectronic map showing the distribution of ligands in the 2-dimensional descriptors space.
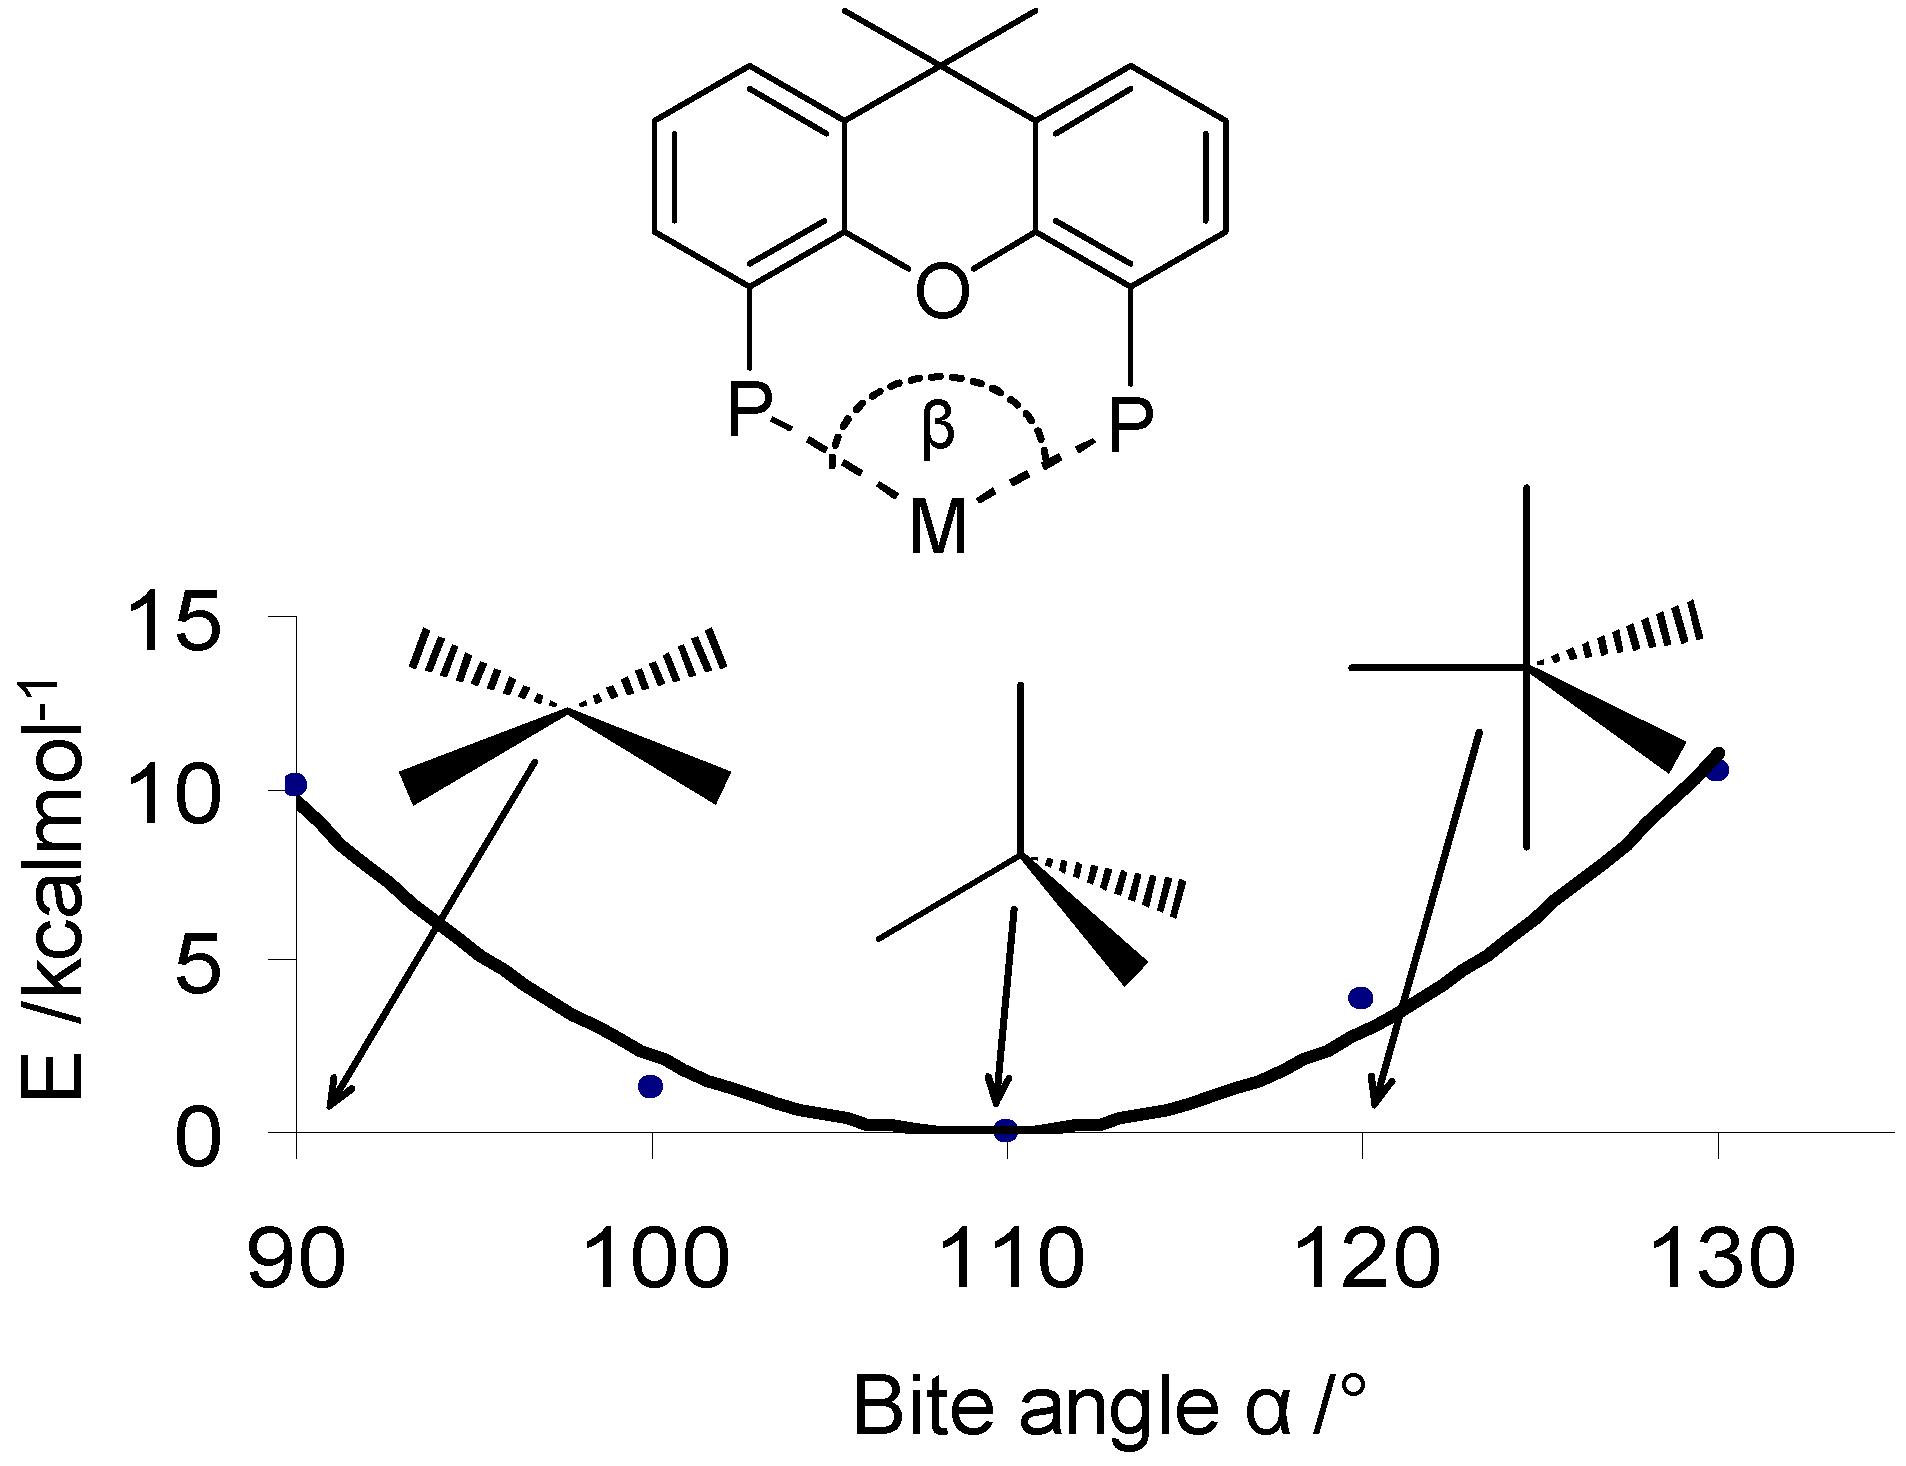
The concept of ligand sterics was extended also to bidentate ligands. In this case the critical parameter for catalysis is the bite angle, which measures the P-M-P angle (Figure 3 top). This angle can be measured by experiments or calculated with molecular modelling techniques. It correlates well with the product yield for several catalytic reactions.[41,42,43,44,45,46,47,48,49,50,51] The value is a compromise between the ligand’s preferred bite angle and the type and number of d orbitals available from the metal. In the pot of soft computing techniques the bite angle calculation requires special attention. The inclusion of the metal centre in molecular mechanics requires the design of ad hoc forcefields that can treat the metal-phosphorous bond. Given that the possible combinations of metal-ligand is far too low explored in this sense, an approximation is made assuming the metal to be a dummy atom and fixing the distance between the metal centre and the ligating atom. Such an approximation emphasizes the effect of the ligand structure on the bite angle. This is close to reality, as demonstrated by Dierkes et al.[48] A statistical analysis of crystal structures retrieved from the Cambridge Structural Database (CSD) showed that bite angles concentrate in a narrow distribution for most ligands, with standard deviation between 1.5–3.0 degrees. No restrictions were imposed on the nature of the transition metal, its oxidation state or other ligands coordinated to the same metal centre. This observation indicates that the P-M-P angle, in monomeric complexes, is mainly determined by the P–P distance defined by the ligand backbone. If the metal and ligand requirements do not match, di- or poly-nuclear complexes may form.
A bidentate ligand can be further characterized in terms of flexibility (Figure 3, bottom). This parameter measures the range of the bite angle value when the ligand adopts geometries with energies slightly above that of the minimized structure. The ligand flexibility is a theoretical parameter. It cannot be measured experimentally, unlike the bite angle. We interpret the ligand flexibility as the ability of the ligand to change its bite angle (and consequently its coordination state) in the course of the catalytic cycle.
Figure 3.
(top) The bite angle (α) is the angle formed when a bidentate ligand coordinates to a metal centre; (bottom) A flexibility profile showing the energy change vs. the bite angle. In this example, square planar co-ordination structures (α = 90º) are disfavored (10 kcal above the minimum). Tetrahedral and trigonal bipyramidal structures are closer to the minimum and therefore more likely.
Sousa and Gasteiger published an elegant numerical approach for modelling chirality in homogeneous catalysis.[52, 53] They represented chirality not by means of a single value, but using a spectrum-like, fixed-length code. This code included information about the chiral centers geometry, properties of atoms in their neighborhood and bond lengths. Using the addition of diethyl zinc to benzaldehyde reaction as a case study, the code is calculated on a set of chiral catalysts and additives, while 3D structures are generated using the Corina software.[54] The authors were able to predict catalyst enantioselectivities and which of the two enantiomers was preferred for a particular reaction.
2.2 The CoMFA Method
Since its introduction several years ago, the Comparative Molecular Field Analysis (CoMFA) method has become one of the most powerful tools for QSAR and drug design.[55] In fact, CoMFA has pioneered a new paradigm of three-dimensional QSAR studies, where properties of molecules are related to their specific structural and electronic features and their spatial arrangement. Thus, molecular modification to improve biological performance or catalyst activity can be more rooted in the actual chemistry of the molecules (e.g. by focusing on a precise reaction step that needs to be optimized in the process). More importantly, CoMFA allows the study of steric factors that affect asymmetric reactions, an important aspect in homogeneous catalysis.
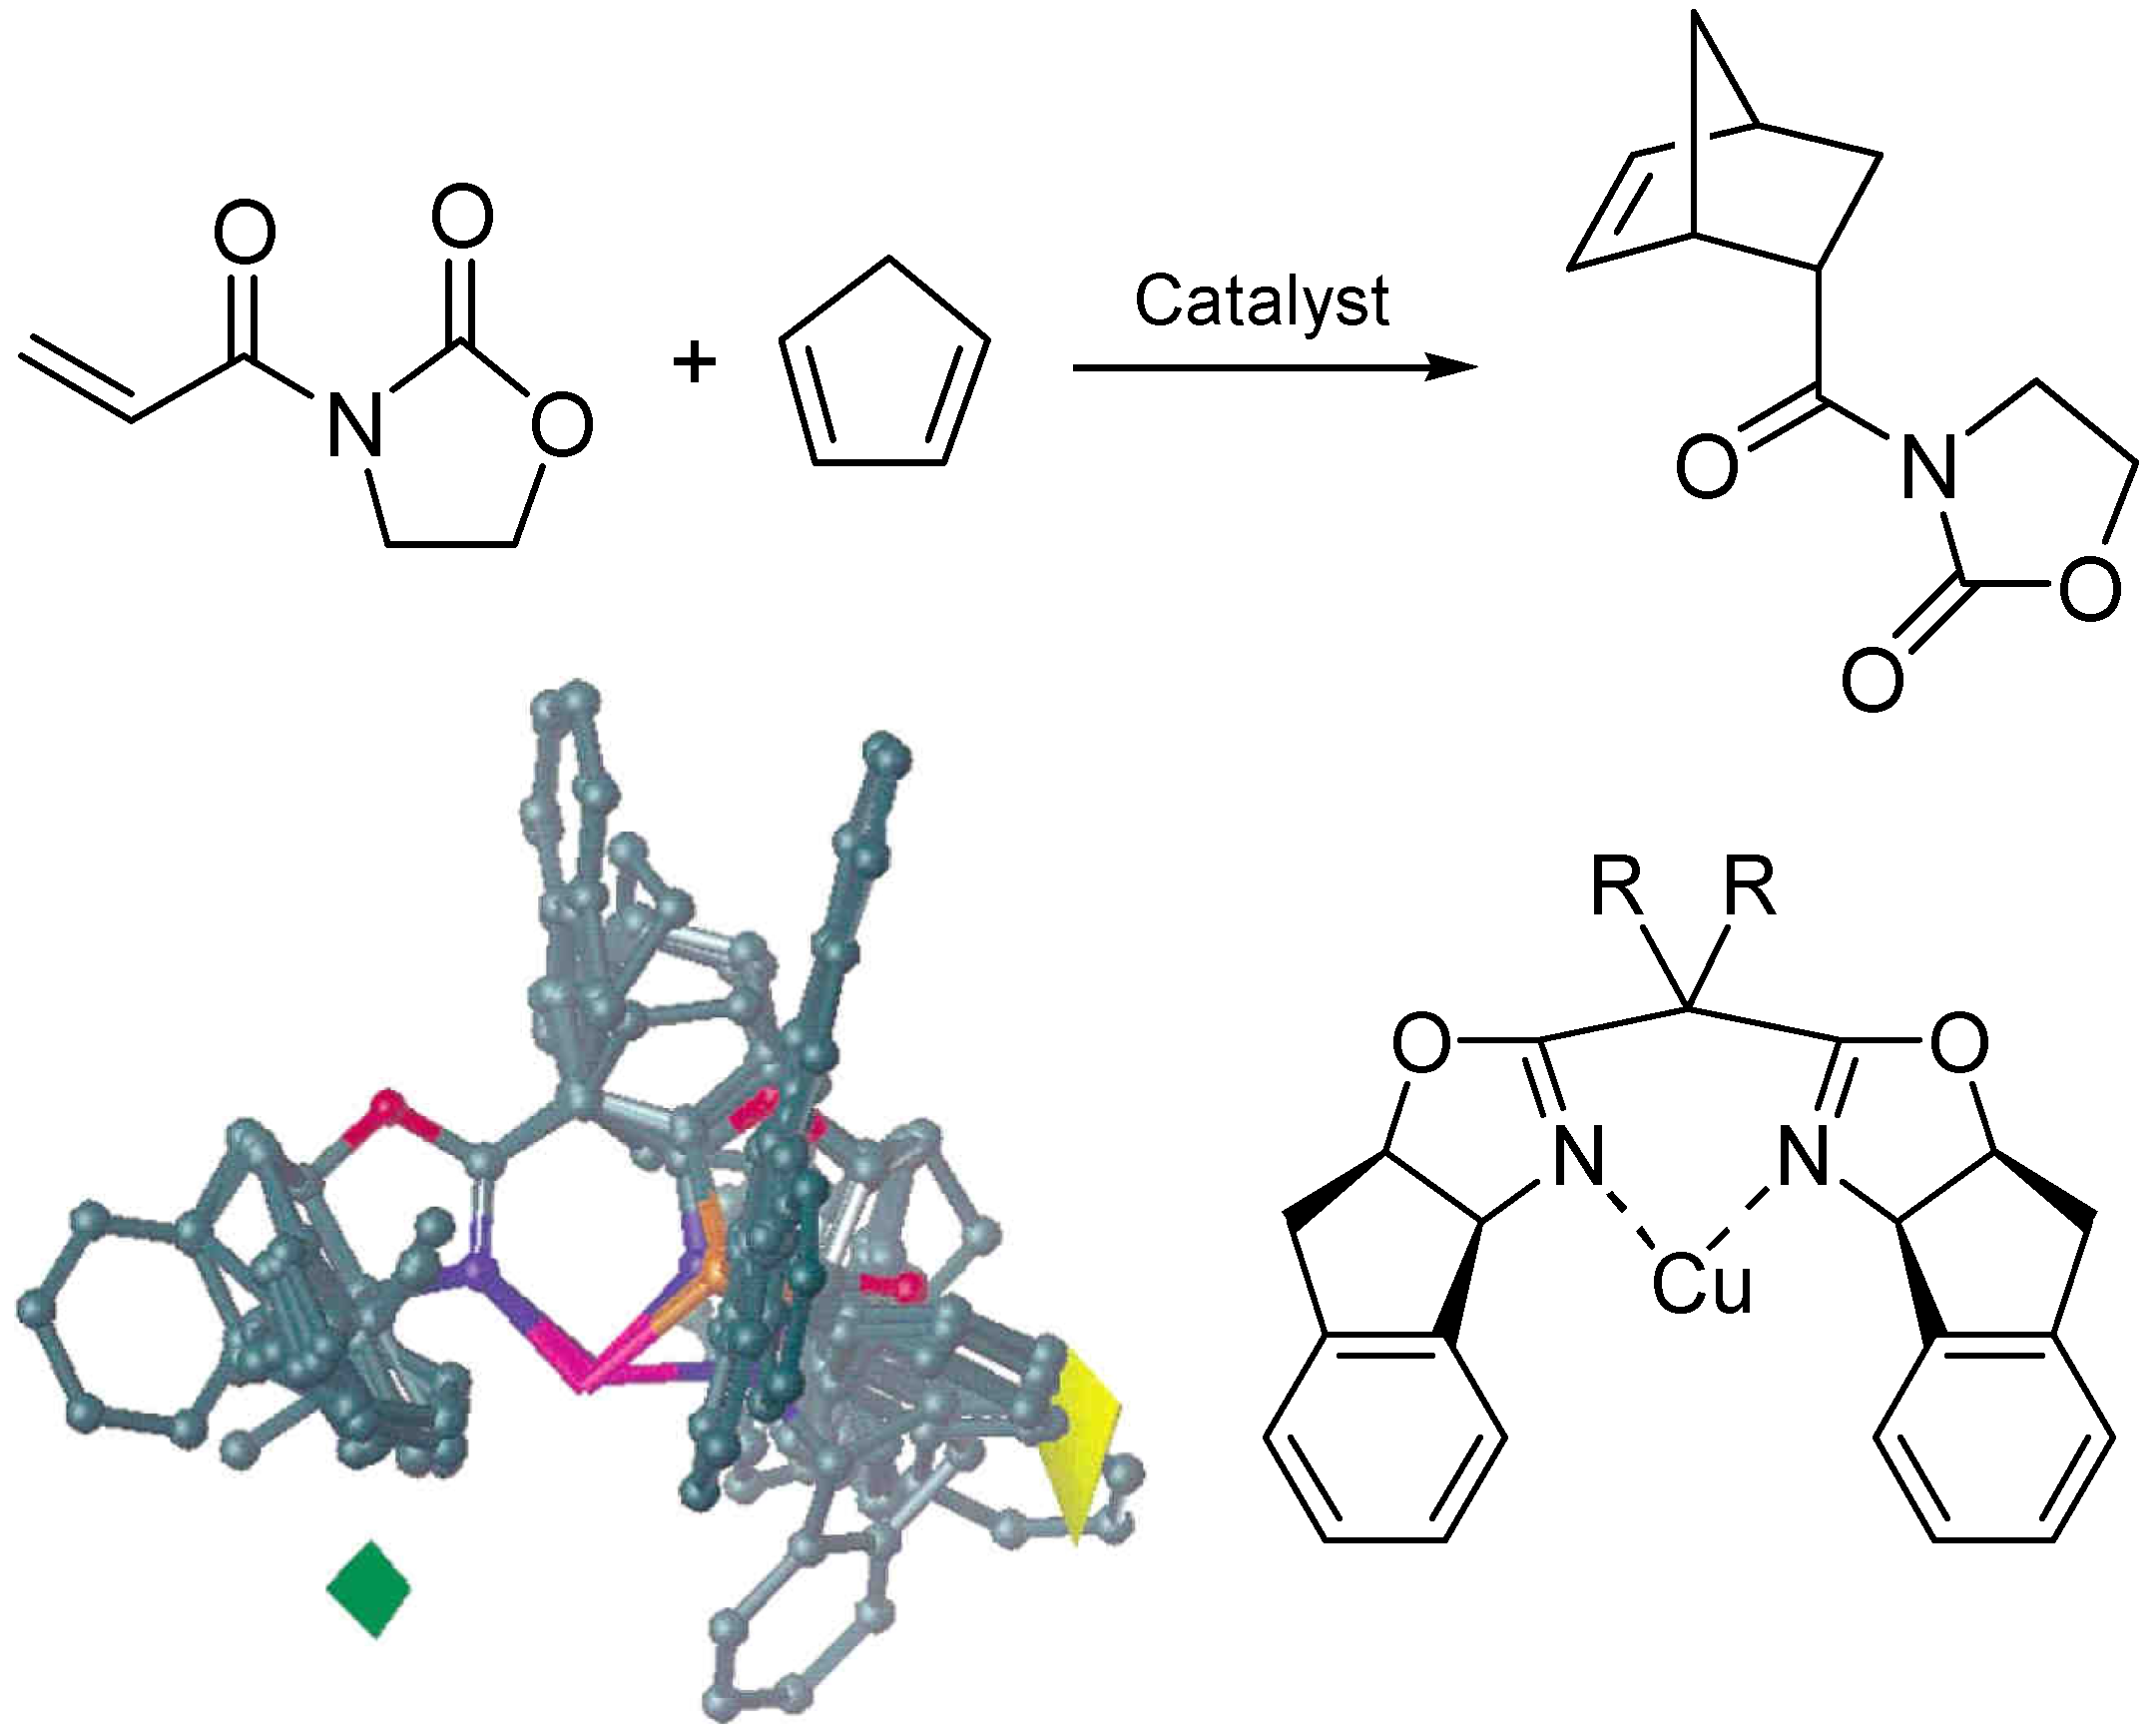
Lipkowitz and Pradhan used the CoMFA method for predicting the ee in the Diels-Alder reaction of N-2-alkenoyl-1,3-oxazolidine-2-one with cyclopentadiene (Figure 4, top).[56,57,58,59] The ligands used are bisoxazolidines or phosphinoxazolidines which are known to induce asymmetry during the above reaction. The CoMFA approach for ligand QSAR is based on the assumption that non-covalent interactions affect the catalytic activity and therefore should correlate with the steric and electronic fields of these molecules. To develop the numerical representation of those fields, all the molecules under investigation are first structurally aligned and the steric and electrostatic fields around them sampled with probe atoms (Figure 4, bottom). This is done by moving a positively charged sp3 Carbon atom on a rectangular grid that encompasses the aligned molecules. In most cases the molecular field is developed from the quantum-chemically calculated atomic partial charges of the molecule under investigation. MNDO, AM1, and PM3 Mulliken charges have been used for this purpose. A table of thousands of columns is formed thereafter from the numerical values of the fields at each grid point which is subsequently analyzed using multivariate statistical analyses, such as partial least-squares (PLS) analysis. The model is a linear relationship between the FOM ee and the intensity of the steric and electronic fields. The result of the molecular alignment is a schematic representation similar to that of the pharmacophore in drug design. In the work of Lipkowitz and Pradhan this kind of stereotypical ligand allows to identify regions of the ligand where the steric bulk needs to be increased or diminished to achieve high ee.
Figure 4.
(top) Scheme of the Diels-Alder reaction between N-2-alkenoyl-1,3-oxazolidine-2-one with cyclopendadiene.; (bottom) Alignment of all 23 bisoxazoline and phosphinooxazoline ligands used in the CoMFA study. Regions of space where steric bulk should enhance or decrease stereoinduction are plotted using iso-value contour maps. Placement of bulky groups near the green region and/or removal of steric bulk near the yellow region should increases the ee for those catalysts that are not very selective.
2.3 The Ligand Repulsive Energy Method
Some ligands possess several energetically accessible conformations with significantly different steric properties; others show important structural changes when moving from free to metal-bound conformations. In such cases, one needs to decide which conformer is the appropriate one to study (i.e. a descriptor related to the ligand’s energy is required). The ligand repulsive energy (ER) method can answer this question.[60] This methodology relies on quantifying the van der Waals repulsive energy variation as a function of the ligand-metal/complex distance (eq 1). In this equation EvdW is the pure repulsive form of the vdW potential and re is the bond length between the metal and the ligating atom on a ligand (the negative sign ensures that as the steric bulk of the ligand increases, ER also increases). As the ligand-metal/complex distance, r, changes, the amount of non-bonded repulsion between the ligand and the environment also changes. Note that ER values are based on computations involving energies and forces, whereas the cone and solid cone angles are geometric constructs. Nevertheless, ER correlates well with both.

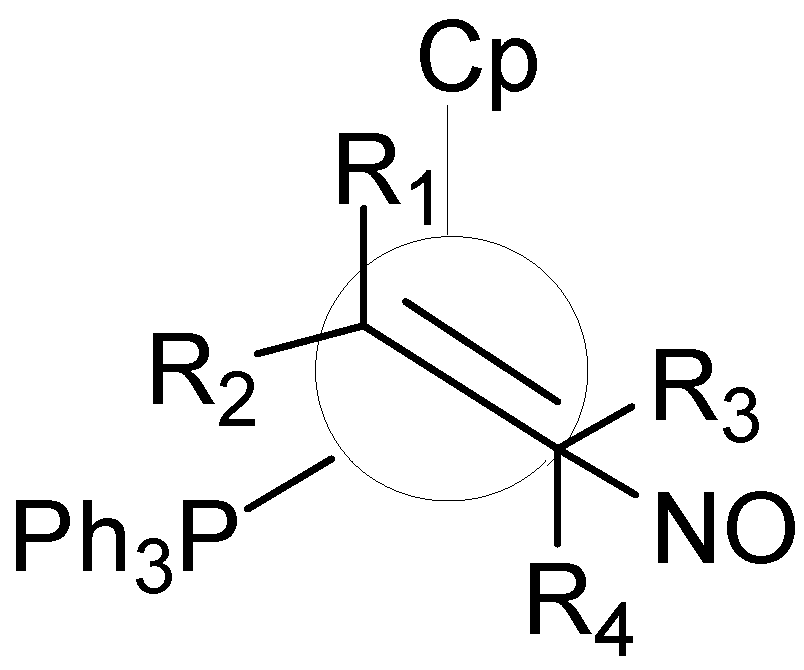
The concept of ligand repulsive energy was used to understand the binding selectivity of [CpRe-(NO)(PPh3)]+ towards prochiral alpha-olefins using a molecular mechanics-based steric model (Figure 5). Gillespie et al. examined the steric interplay between ligands on the Re atom and the substituent on the prochiral alpha-olefin (R1 and R2) in order to rank the relative importance of the size of ligands in terms of binding selectivities.[61, 62] The authors concluded that the size of the phosphine is more important than the size of the cyclopentadienyl ring in determining which face of the prochiral olefin is bound by an enantiomerically pure organometallic Lewis acid. The study is a part of the so called de novo ligand design pyramid, where sterics and energetics of the system are studied using different levels of computational theory, from MM to ab initio passing by SEQM and QM.
Figure 5.
Newman projection of [(η5C5H5)Re(η2-olefin)-(PPh3)(NO)]+ as viewed down the olefin centroid-Re axis.
Figure 5.
Newman projection of [(η5C5H5)Re(η2-olefin)-(PPh3)(NO)]+ as viewed down the olefin centroid-Re axis.

2.4 2D and 1D Descriptors
Ideally, the descriptors used for model development should be rapid to calculate and easy to interpret. 3D descriptors offer the most realistic way to represent a chemical system but their computational time depends on the geometry optimization step, and therefore on the size and degrees of freedom of the chemical system. When the size of combinatorial libraries is large, the calculation of 3D descriptors becomes too time consuming and therefore simpler parameters such as 1D and 2D descriptors are calculated. These descriptors are derived from the connectivity tables of molecules and pertain to size, flexibility, electron distribution and physicochemical properties of molecules. 2D and 1D descriptors are three orders of magnitude faster than MM forcefields derived descriptors. One can compute descriptors for a million ligands using topological descriptors in 10 h using a desktop PC with a 2.5 GHz processor, compared to 1000 with MM methods and only 10 with PM3 semiempirical methods. If the number of possible structural variations in the catalyst system is huge, only 2D and 1D descriptors are able to represent the catalyst space. The time advantage of using 2D descriptors, however, is offset by several limitations. First, conformational information is neglected. Second, chirality cannot be treated. Finally, although 2D descriptors account for specific physicochemical properties of molecules, there is no mechanistic interpretation for them.
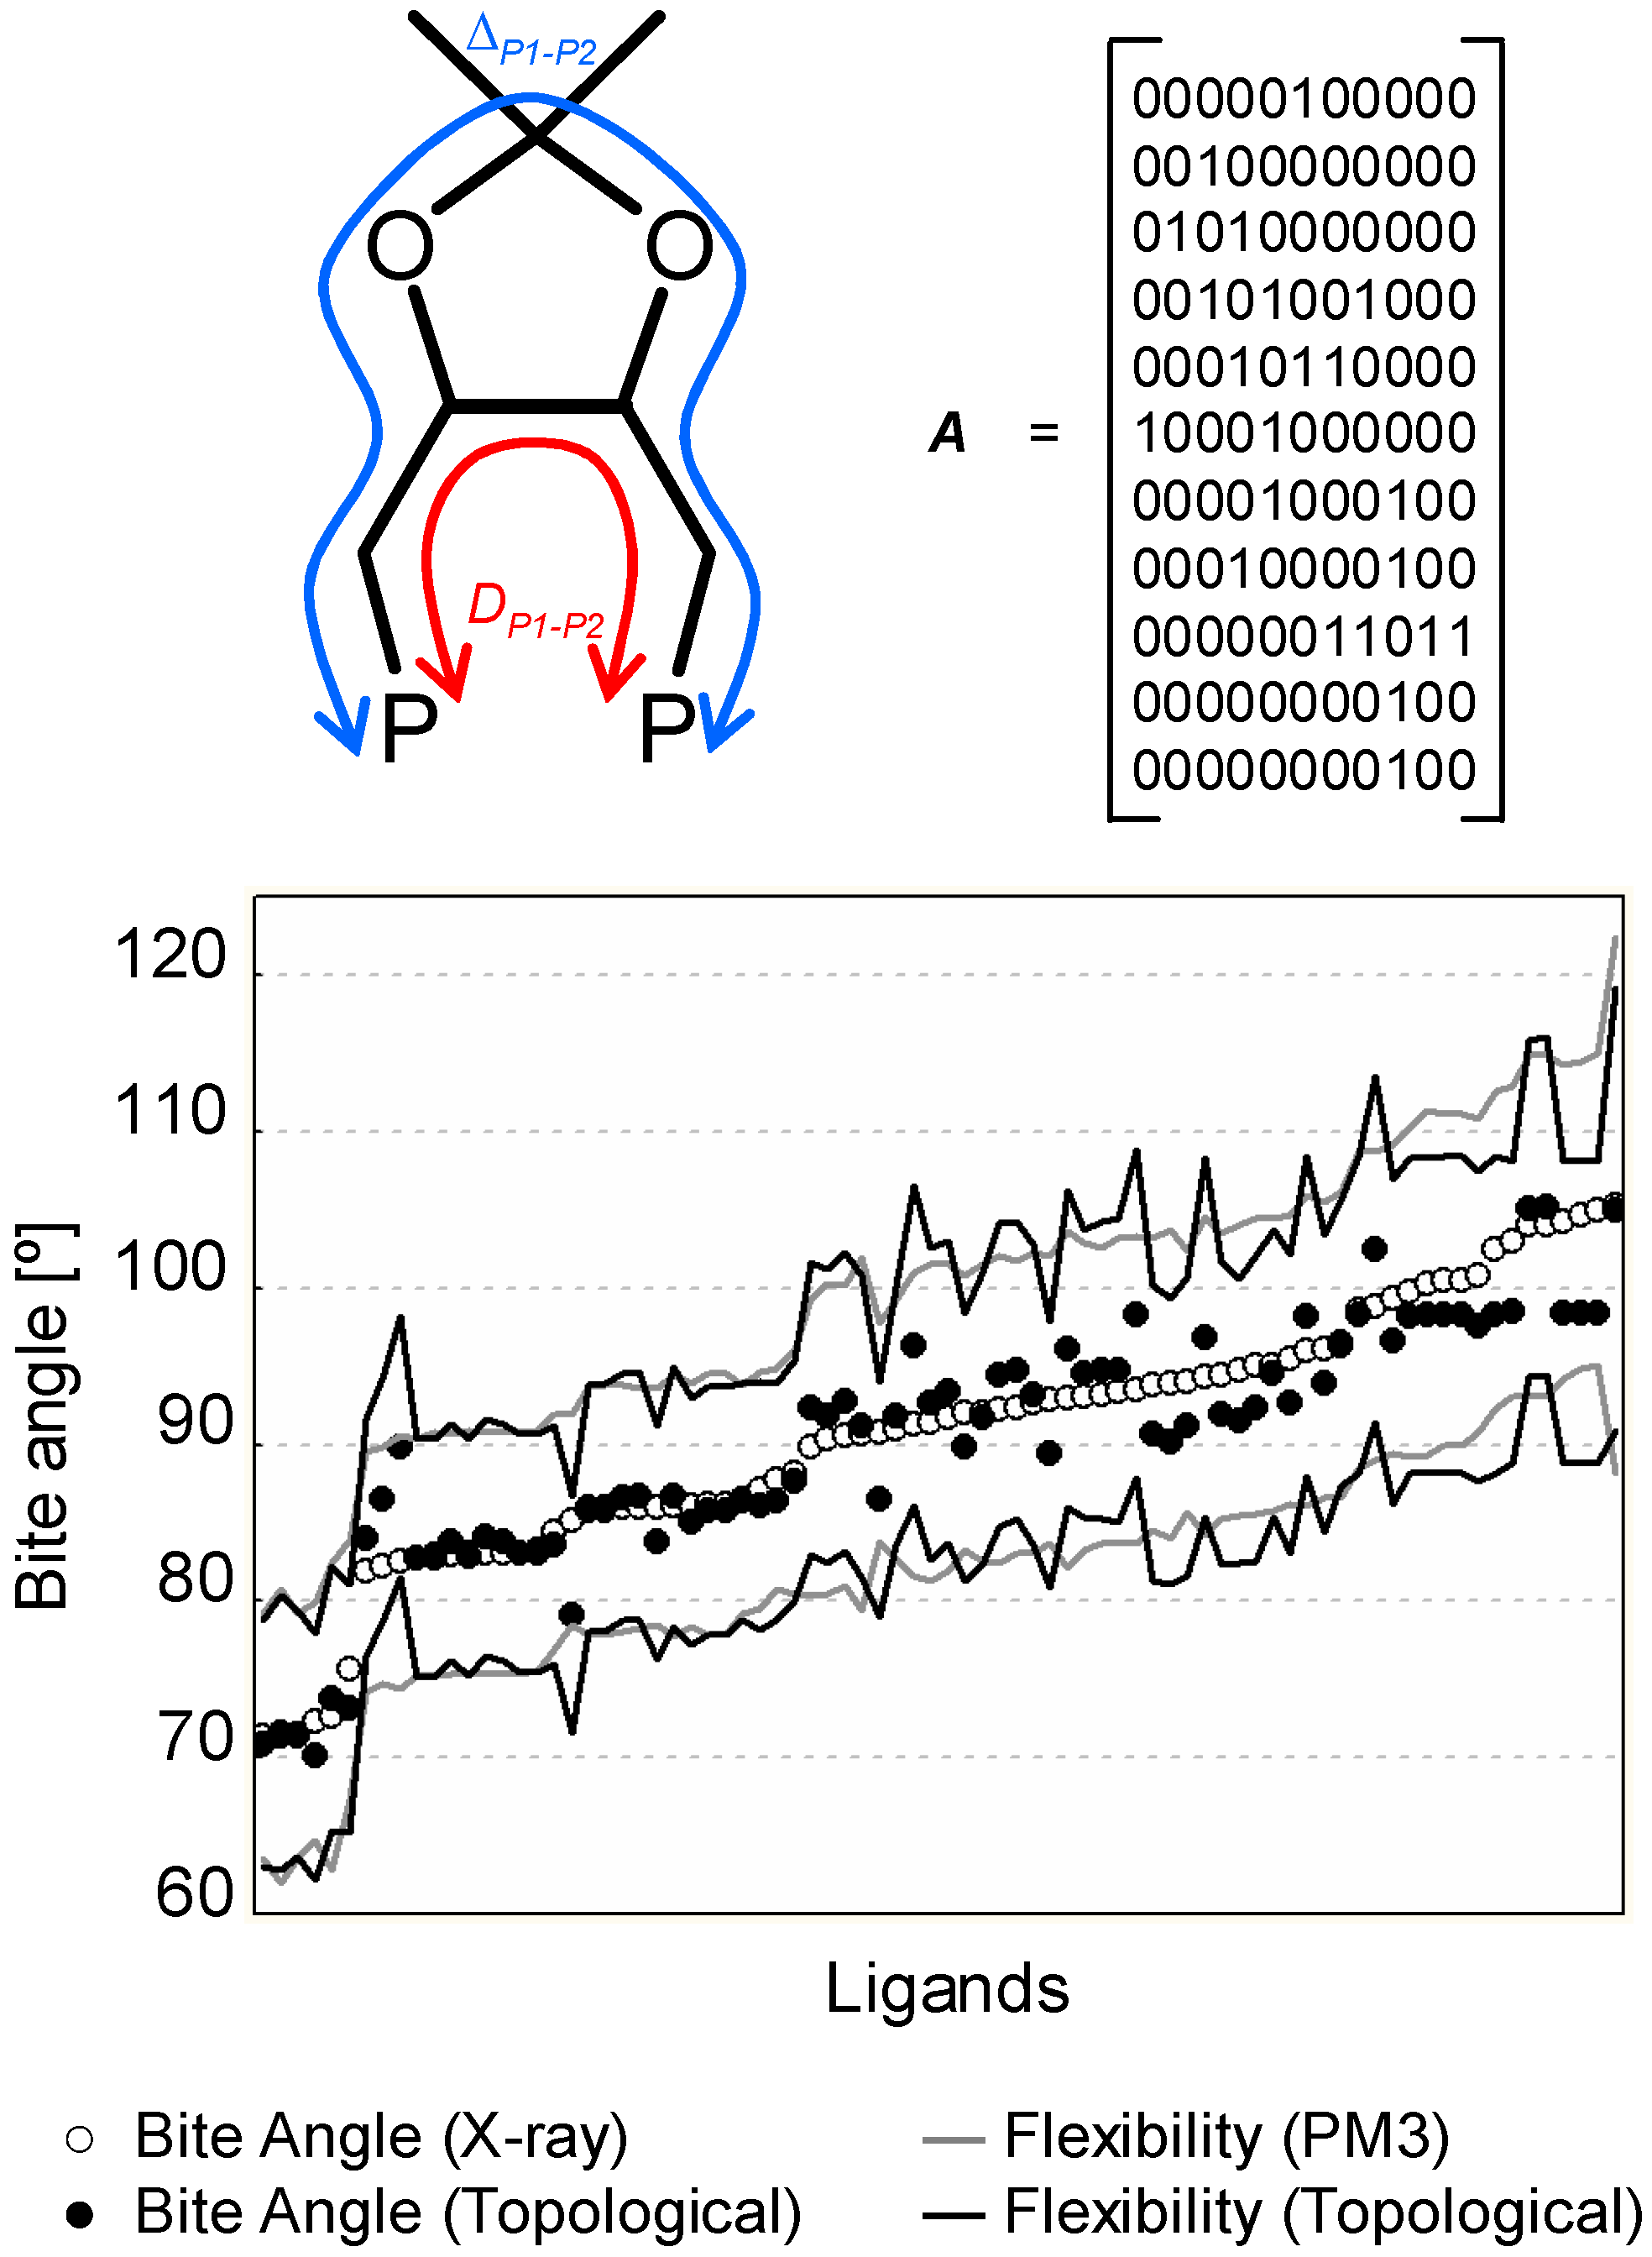
In a recent work, we developed a simple set of topological descriptors focusing on the P–P connectivity patterns of bidentate ligands like phosphines and phosphites.[63] The descriptors included all P-P connectivity paths, from the shortest (DP1-P2) to the longest (ΔP1-P2), as well as their weighted versions (e.g. by MW or atom electronegativity). The study revealed that some descriptors are correlated to ligand properties such as the bite angle and the flexibility that require a more severe calculation (i.e. they require an energy minimization step that is avoided during the calculation of 2D descriptors). In Figure 6 (bottom) we see how 2D descriptors perform compared to bite angle and flexibility values obtained respectively by X-ray data and PM3 semiempirical calculations. The value of 2D descriptors is that they can be used as a diversity measure in a large catalyst library, which in turn can serve as a basis for a more detailed analysis using 3D descriptors.
Figure 6.
(top). Molecular graph and adjacency matrix of the DIOP ligand. DP1-P2 and Δ P1-P2 are respectively the shortest and longest P–P connectivity paths. The adjacency matrix of a molecular graph is a matrix with rows and columns labeled by graph vertices v (i.e. the atoms), with a 1 or 0 in position (vi, vj) according to whether vi or vj are adjacent or not. (bottom) Observed and predicted bite angle and flexibility values for a set of biphosphine and biphosphite ligands. The empty dots and the grey line represent respectively the bite angle and flexibility values calculated on a set of 80 ligand-metal complexes retrieved from the CSD. Black dots and the black line represent the same values predicted using a 2D-descriptor QSAR model.
Chavali et al. demonstrated that 2D connectivity indexes are useful for generating structure-property correlations for biological and chemical properties in reactions catalysed by transition metals.[64, 65] These tools were applied in the Computer Aided Molecular Design (CAMD) environment, a powerful computational tool used in product design. The method uses optimization techniques coupled with molecular design and property estimation methods, generating those molecular structures that match a desired set of properties. Structure-properties relationships are developed based on literature data. The figures of merit include: electronegativity, toxicity and density of the catalyst. The authors present two examples concerning epoxidation reactions with molybdenum catalysts.
2.5 Modelling the Chemical and Physical Properties of Solvents
Solvents are known to affect a chemical reactions and processes in many ways. Chemists characterize solvent activity on reaction rates in terms of polarity, acidity or solubility with another substance, whereas from a process point of view, thermodynamic properties such as the boiling point or the vapor pressure are more important. It is advisable to use a combination of both properties to represent solvent effects although physical properties are more related to the process optimization and therefore obey constrains related to reactor design problems.
Solvent effects can be described using the dielectric approach or the chemical approach. The former pictures the solvent as a homogeneous dielectric continuum, meaning that the solvent molecules have zero size and cannot move. The latter is more sensitive to short-range phenomena and accounts for local solute-solvent interactions.
The dielectric approach correlates well with reactions in which a charge is either developed or localized (or vice versa) and where solvent molecules act by creating a cage or solvation shell around the activated complex. The chemical approach relies on empirical solvent parameters that measure some solvent sensitive physical property of a model solute (e.g. solvatochromic or NMR shifts). Many of these parameters can be grouped into two main classes: one class is more concerned with cation, or positive dipole’s end solvation, the other reflects anion or negative dipole’s end solvation.[66,67,68,69] The first class contains the Gutmann Donor Number (DN)[70] and the Kamlet-Taft Basicity (β).[71] The latter class includes scales such as the Gutmann Acceptor Number (AN),[70] the Dimroth-Reichardt Polarity ET(30) and the Kamlet-Taft Polarizability (π*).[72]
Solvation is not the only mode of action taken by the solvent on chemical reactivity. Since chemical reactions are accompanied by changes in volume, even reactions with no alteration of charge distribution are sensitive to the solvent. The solvent dependence of a reaction where both reactants and products are neutral species is treated in terms of the solvent cohesive energy density (εc). Its square root is termed the Hildebrand solubility parameter δH and measures the work necessary for creating a suitable sized cavity for the solute. δH is calculated by dividing the standard internal energy of vaporization by the molar volume of the liquid.
At first, solvent effects on reactivity were studied in terms of some particular solvent parameter. Later on, more sophisticated methods via multiparameter equations were applied. Termed the linear solvation energy relationship (LSER), it has the form of eq 2:
![Ijms 07 00375 i012]() where s, a, b, c and h are solvent independent coefficients characteristic of the reaction and indicative of its sensibility to the accompanying solvent properties, and δ is a polarizability correction term. The scales implemented in the equation account for solvent properties like: bulk/cavity (δH), dipolarity/polarizability (π*), and acidity/basicity (α/β).
where s, a, b, c and h are solvent independent coefficients characteristic of the reaction and indicative of its sensibility to the accompanying solvent properties, and δ is a polarizability correction term. The scales implemented in the equation account for solvent properties like: bulk/cavity (δH), dipolarity/polarizability (π*), and acidity/basicity (α/β).

Each of these descriptors was derived empirically: the cavity term was usually the molar volume, the other three terms were derived directly from UV-Vis spectral shifts (hence the descriptors are sometimes referred to as the solvatochromic parameters). The equation comprises several different solvent effects although the regression equation might use just few of them.
The use of empirical scales, however, does not allow the prediction of new solvent properties, as it requires the synthesis of these compounds in order to measure the descriptors. More recent studies showed that it is possible to derive a theoretical linear solvation energy relationship (TLSER), where the relationship attempts to maintain the same characteristics as the LSER, but under a theoretical basis. Descriptors require the use of semi-empirical or higher computational levels but the regression coefficients are usually good.[73,74,75]
More simple 2D descriptors are used to derive solvent physical properties in QSPR studies. These methods offer excellent results when datasets of homogeneous compounds (i.e. hydrocarbons, alcohols etc.) are analyzed. Examples include the boiling point, the refractive index, the dipole moment and other related physical properties.[76]
Another way for selecting good solvent candidates is by using the CAMD methodology.[77, 78] CAMD works as follows: given a set of building blocks and a specified set of target properties, it determines the molecular structure that matches these properties. It involves the solution of two problems: the forward problem requires the computation of macroscopic properties for a given molecular structure, while the backward problem requires the identification of the appropriate molecular structure satisfying the desired properties. A variety of methods, including molecular modelling, group contribution, and correlations has been developed to address the forward problem. The techniques for solving the backward problem can be divided into two major classes. In the first class, structures are composed exhaustively, randomly or heuristically, from a given set of chemical groups. The compounds are then examined to determine if they have the desired properties. In the second class, a mathematical programming method is applied to a problem in which the objective function expresses the distance to the target compound. Applications of CAMD are found throughout the literature. Most of them concern chemical engineering and reactor design problems, but there are also some recent applications to homogeneous catalysis and drug design.
2.6 Using Descriptors: Pros and Cons
The above descriptors are applied for developing quantitative-structure activity/property relationships in various areas (the CoMFA method, for example, is widely used in drug design and biochemical reactions). Descriptors derived from quantum mechanics, e.g. using semiempirical methods, usually possess a definite physical meaning. Thus, they are especially useful for exploring reaction mechanisms. Also, in contrast to empirical substituent or solvent effect constants, QM-based descriptors can be derived solely from the theoretical structure of the molecule, provided that its geometry has been optimized. This enables applications of QSAR/QSPR correlation equations to hypothetical structures that were never synthesized. However, QM descriptors are not universal and, depending on the chemical structures or process involved, may have several limitations. First, all QM calculation are performed on a single structure at an energy minimum. This corresponds to the hypothetical physical state of the gas at 0 K and zero pressure. Also, the zero point vibrations of the molecule are neglected. Therefore 3D descriptors cannot account for entropic and temperature effects. Most QM modelling packages have an option to calculate the vibrational, rotational, and translational partition functions molecules at a given temperature and estimate their respective contributions to the molecular enthalpy, entropy, and other thermodynamic functions. However, these functions still refer to a single conformer, so a preliminary averaging of the molecular descriptors via arithmetic or Boltzmann schemes is advisable. Finally, as most chemical reactions occur in condensed (mostly liquid) media, it should be advantageous to use molecular descriptors calculated using algorithms that account for specific and non-specific solvation effects. Specific effects, primarily hydrogen bonding, on the molecular structure can be accounted for using the supermolecule approach where the solute is treated together with the specifically coordinated solvent molecules. A number of different calculation schemes are available for describing solvent bulk effects on the solute geometrical and electronic structure. Several of these are included in the standard program packages.
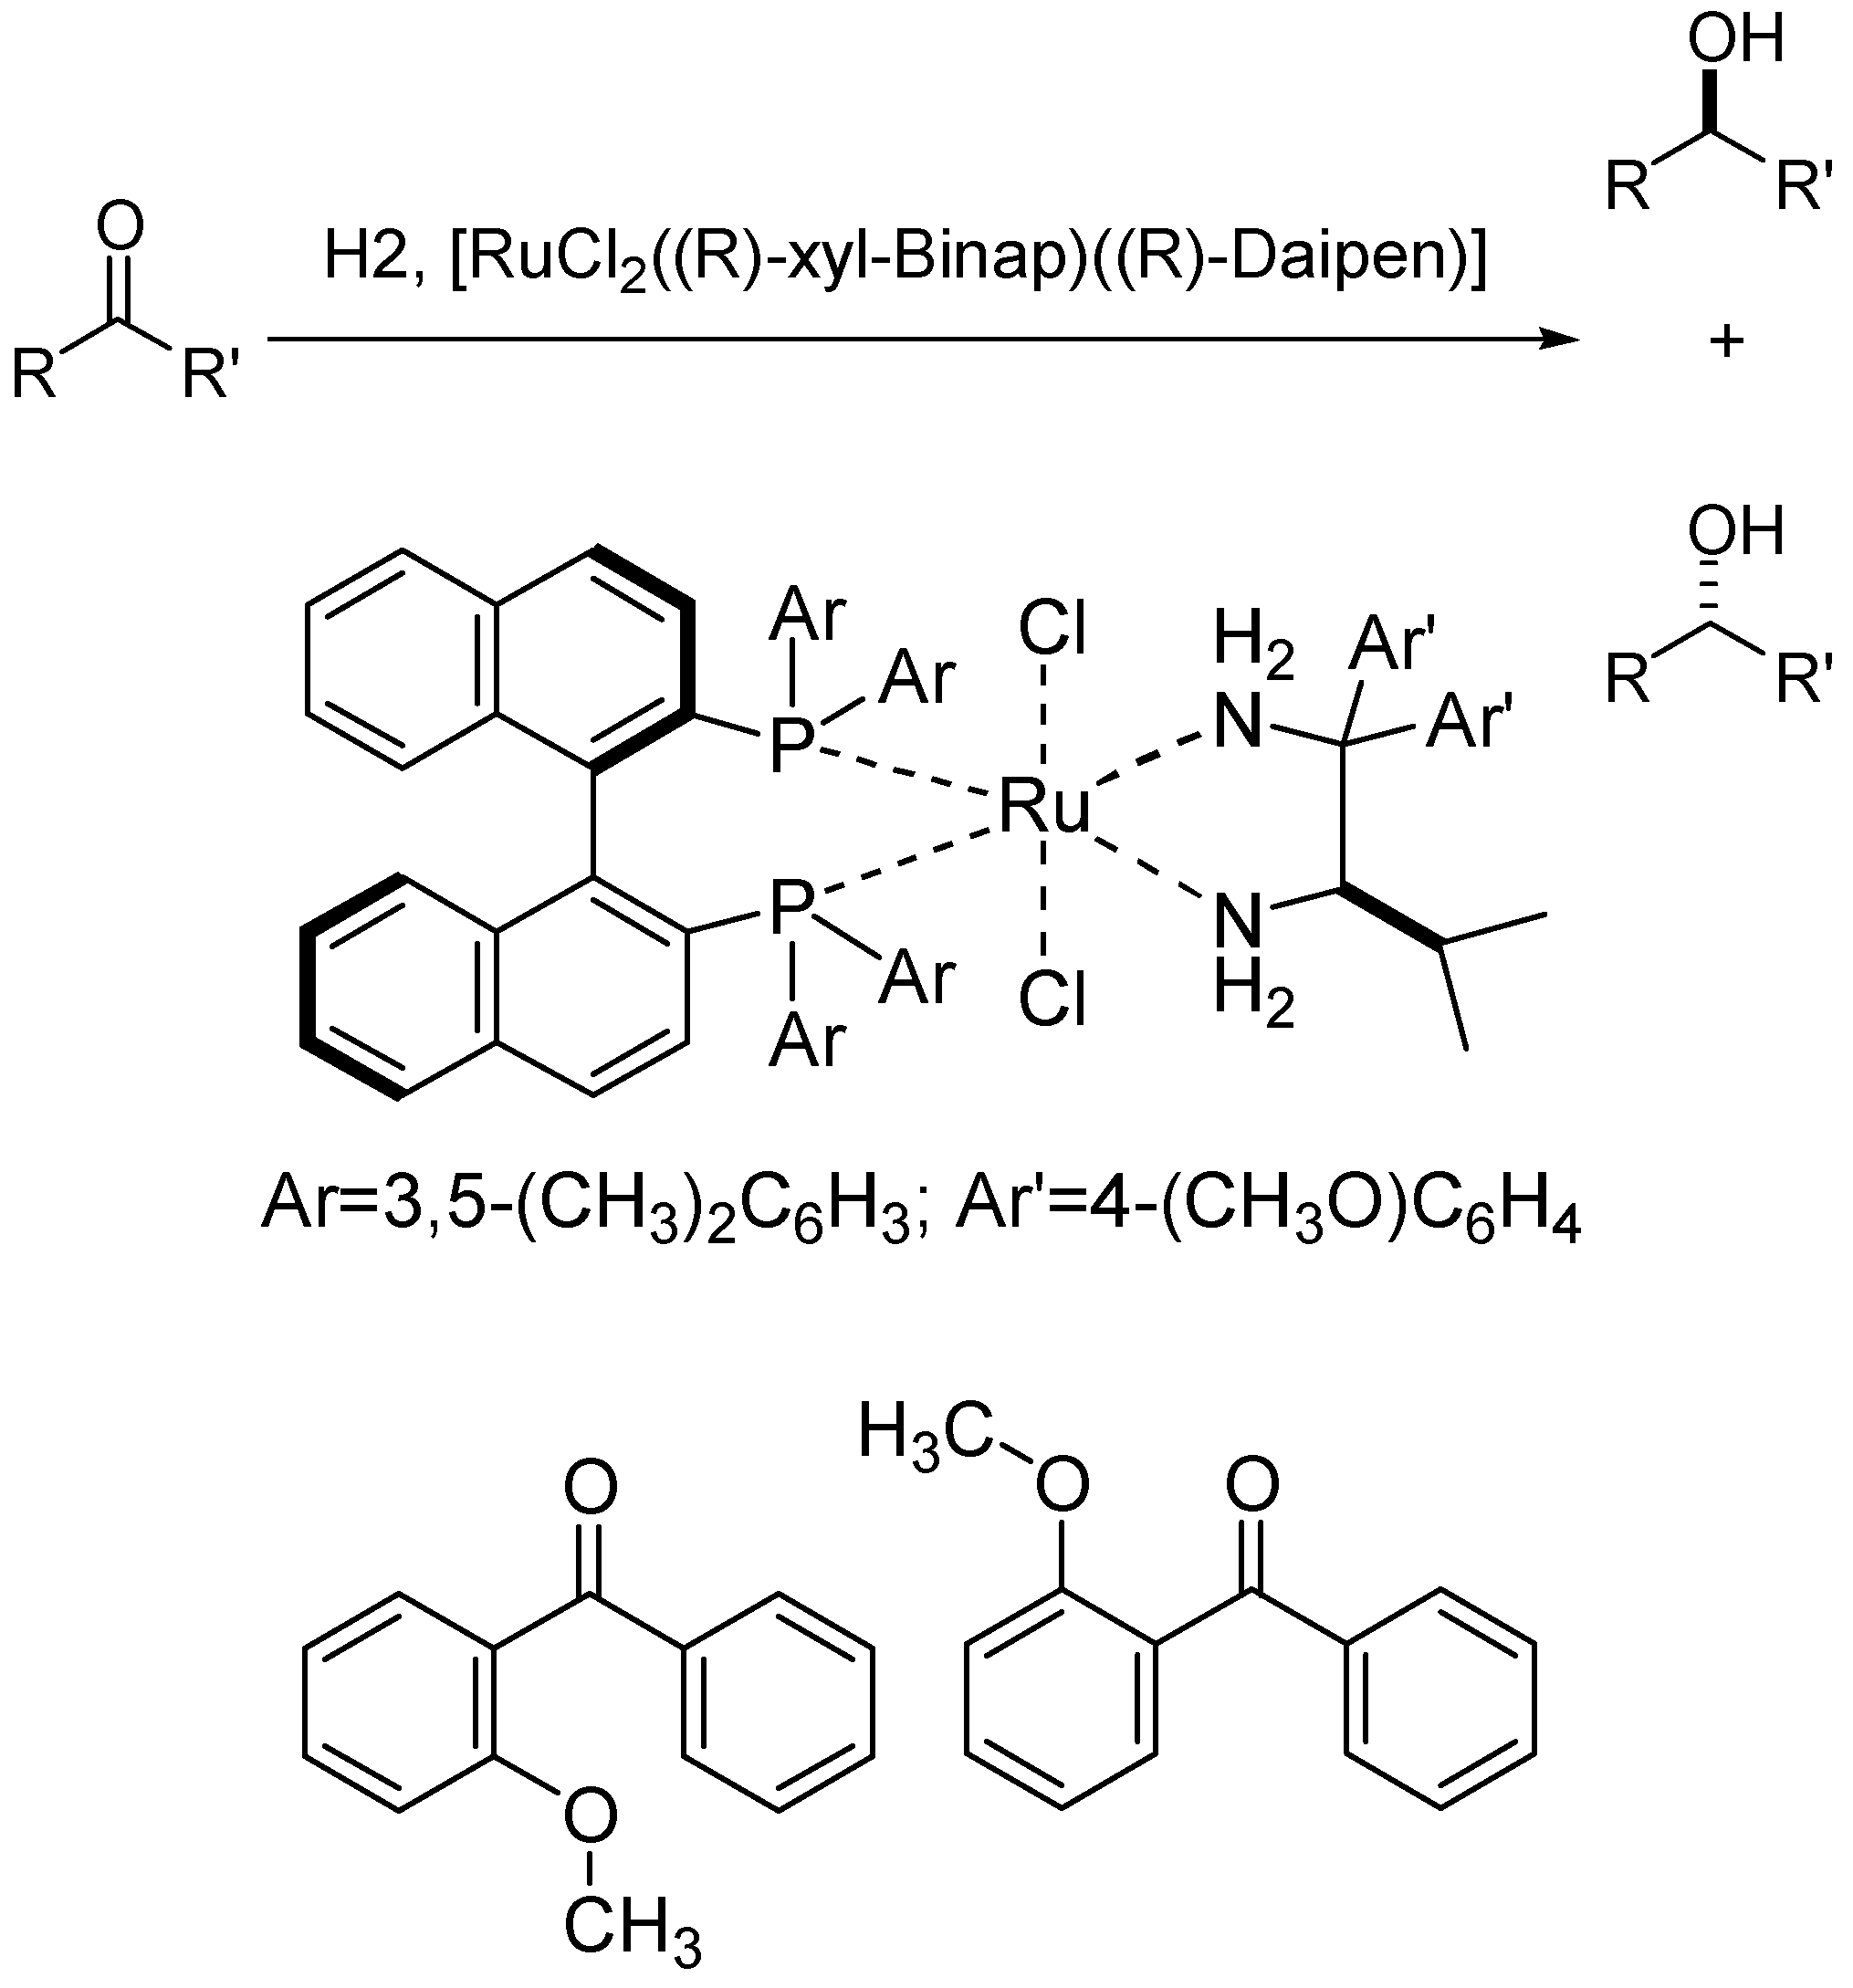
When descriptors are calculated for single molecules one faces the problem of choosing the right conformer. The lowest energy conformer is usually chosen, as it is easily obtained using MM forcefield methods. However this is not always the right conformer. One way to verify this is checking whether the model fit improves when local minimum-energy conformations are explored. A QSPR study of the asymmetric ketone hydrogenation reaction with Noyori’s catalyst (Figure 8) by van der Linden et al. proved a better regression coefficient when an alternative conformation of ortho-substituted ketones was considered. In this case the authors were looking for ketone substrates that would eventually give the desired ee. The descriptors were calculated using the Dragon software and included 2D and 3D parameters.[79] A closer look at model outliers allowed the identification of possible reasons for a conformational change in the modelling stage. Such information can be easily implemented once more mechanistic information is gained.
3. Modelling and data analysis
Before the advent of combinatorial chemistry, the discovery process was based on synthetic feasibility, existing structure-activity data, experience and intuition. The recent advances in synthesis and screening technologies fundamentally changed the way chemists look at experiments. The possibility of screening large datasets of compounds gives more information on the process, but also poses problems regarding the way this information is extracted. Typically, part of such research aims at disclosing relationships between chemical properties and performance of compounds. One way to investigate such relationship is to use semi-empirical mathematical models in which the catalyst performance is expressed as a function of molecular descriptors.
This kind of mathematical expression is often referred to as a quantitative structure-activity relationship. QSAR models can predict the performance of new, specific catalyst candidates. In addition, it can indicate which chemical features regulate a certain process and how to modify them to improve performance.
A QSAR model can be generated in several ways. The most simple regression model is the linear free energy relationship (LFER), based on a linear equation of the type lnk=a*d1+b*d2+...+c. Examples of such equation occur throughout the literature. In homogeneous catalysis two well known examples equation for monophosphine ligands and the QALE ligand effect developed by Fernandez et al.[80] These empirical equations require few well characterized parameters, usually derived from experimental measurements or QM calculations, and their applicability is limited to datasets with small structural variations. Such equations rely on mechanistic assumptions, so the model requires some chemical knowledge.
When the number of descriptors calculated is very high and/or there is no clear idea on the precise molecular mechanism, one faces the problem of finding the right descriptors but also the right way to correlate them to the figure of merit. For regression studies, two main approaches are used: linear and non-linear modelling. Both approaches are equally valid (although a linear model is easier to interpret) and one should use both and compare the results. Non-linear methods, such as Artificial Neural Networks, are more effective when the system is complicated and many factors are believed to affect the outcome of the reaction.
3.1 Partial Least-Squares Analysis
Most examples of linear modelling with multivariate data employ PLS analysis.[81] In PLS one set of latent variables is extracted from the starting set of descriptors and another set is extracted simultaneously from the dependent variables (the figures of merit). The extraction process is based on decomposition of a crossproduct matrix involving both the independent and y variables. The X-scores of the independent latents are used to predict the Y-scores or the response latent(s), and the predicted Y scores are used to predict the manifest response variables. The X- and Y- scores are selected by PLS so that the relationship of successive pairs of X and Y scores is as strong as possible. The advantages of PLS include the ability to model multiple figures of merit, handle multicollinearity among descriptors and rank them according to their influence on the Ys.
Examples that use PLS modelling concern the study of ligand/substrate variations that account for improved activity and selectivity in organometallic reactions. van der Linden e al. used PLS analysis to correlate the substrate structure to the ee for a set of asymmetric benzophenone hydrogenation reactions (Figure 7).[82] The catalyst structure is not included in the calculations and the QSAR model is used instead to predict the substrate performance. The method relies on classical 2D/3D descriptors and did not require prior knowledge on the reaction mechanism. On the contrary the inspection of outliers and subsequent model refinement lead to useful mechanistic information concerning the possible transition state structure of the ketone.
Figure 7.
a. Asymmetric catalytic ketone reduction and Noyori catalyst studied in the work of Johannes B. van der Linden et al. b. The conformations of benzophenone for the initial model (left) and the improved model (right).
Figure 7.
a. Asymmetric catalytic ketone reduction and Noyori catalyst studied in the work of Johannes B. van der Linden et al. b. The conformations of benzophenone for the initial model (left) and the improved model (right).
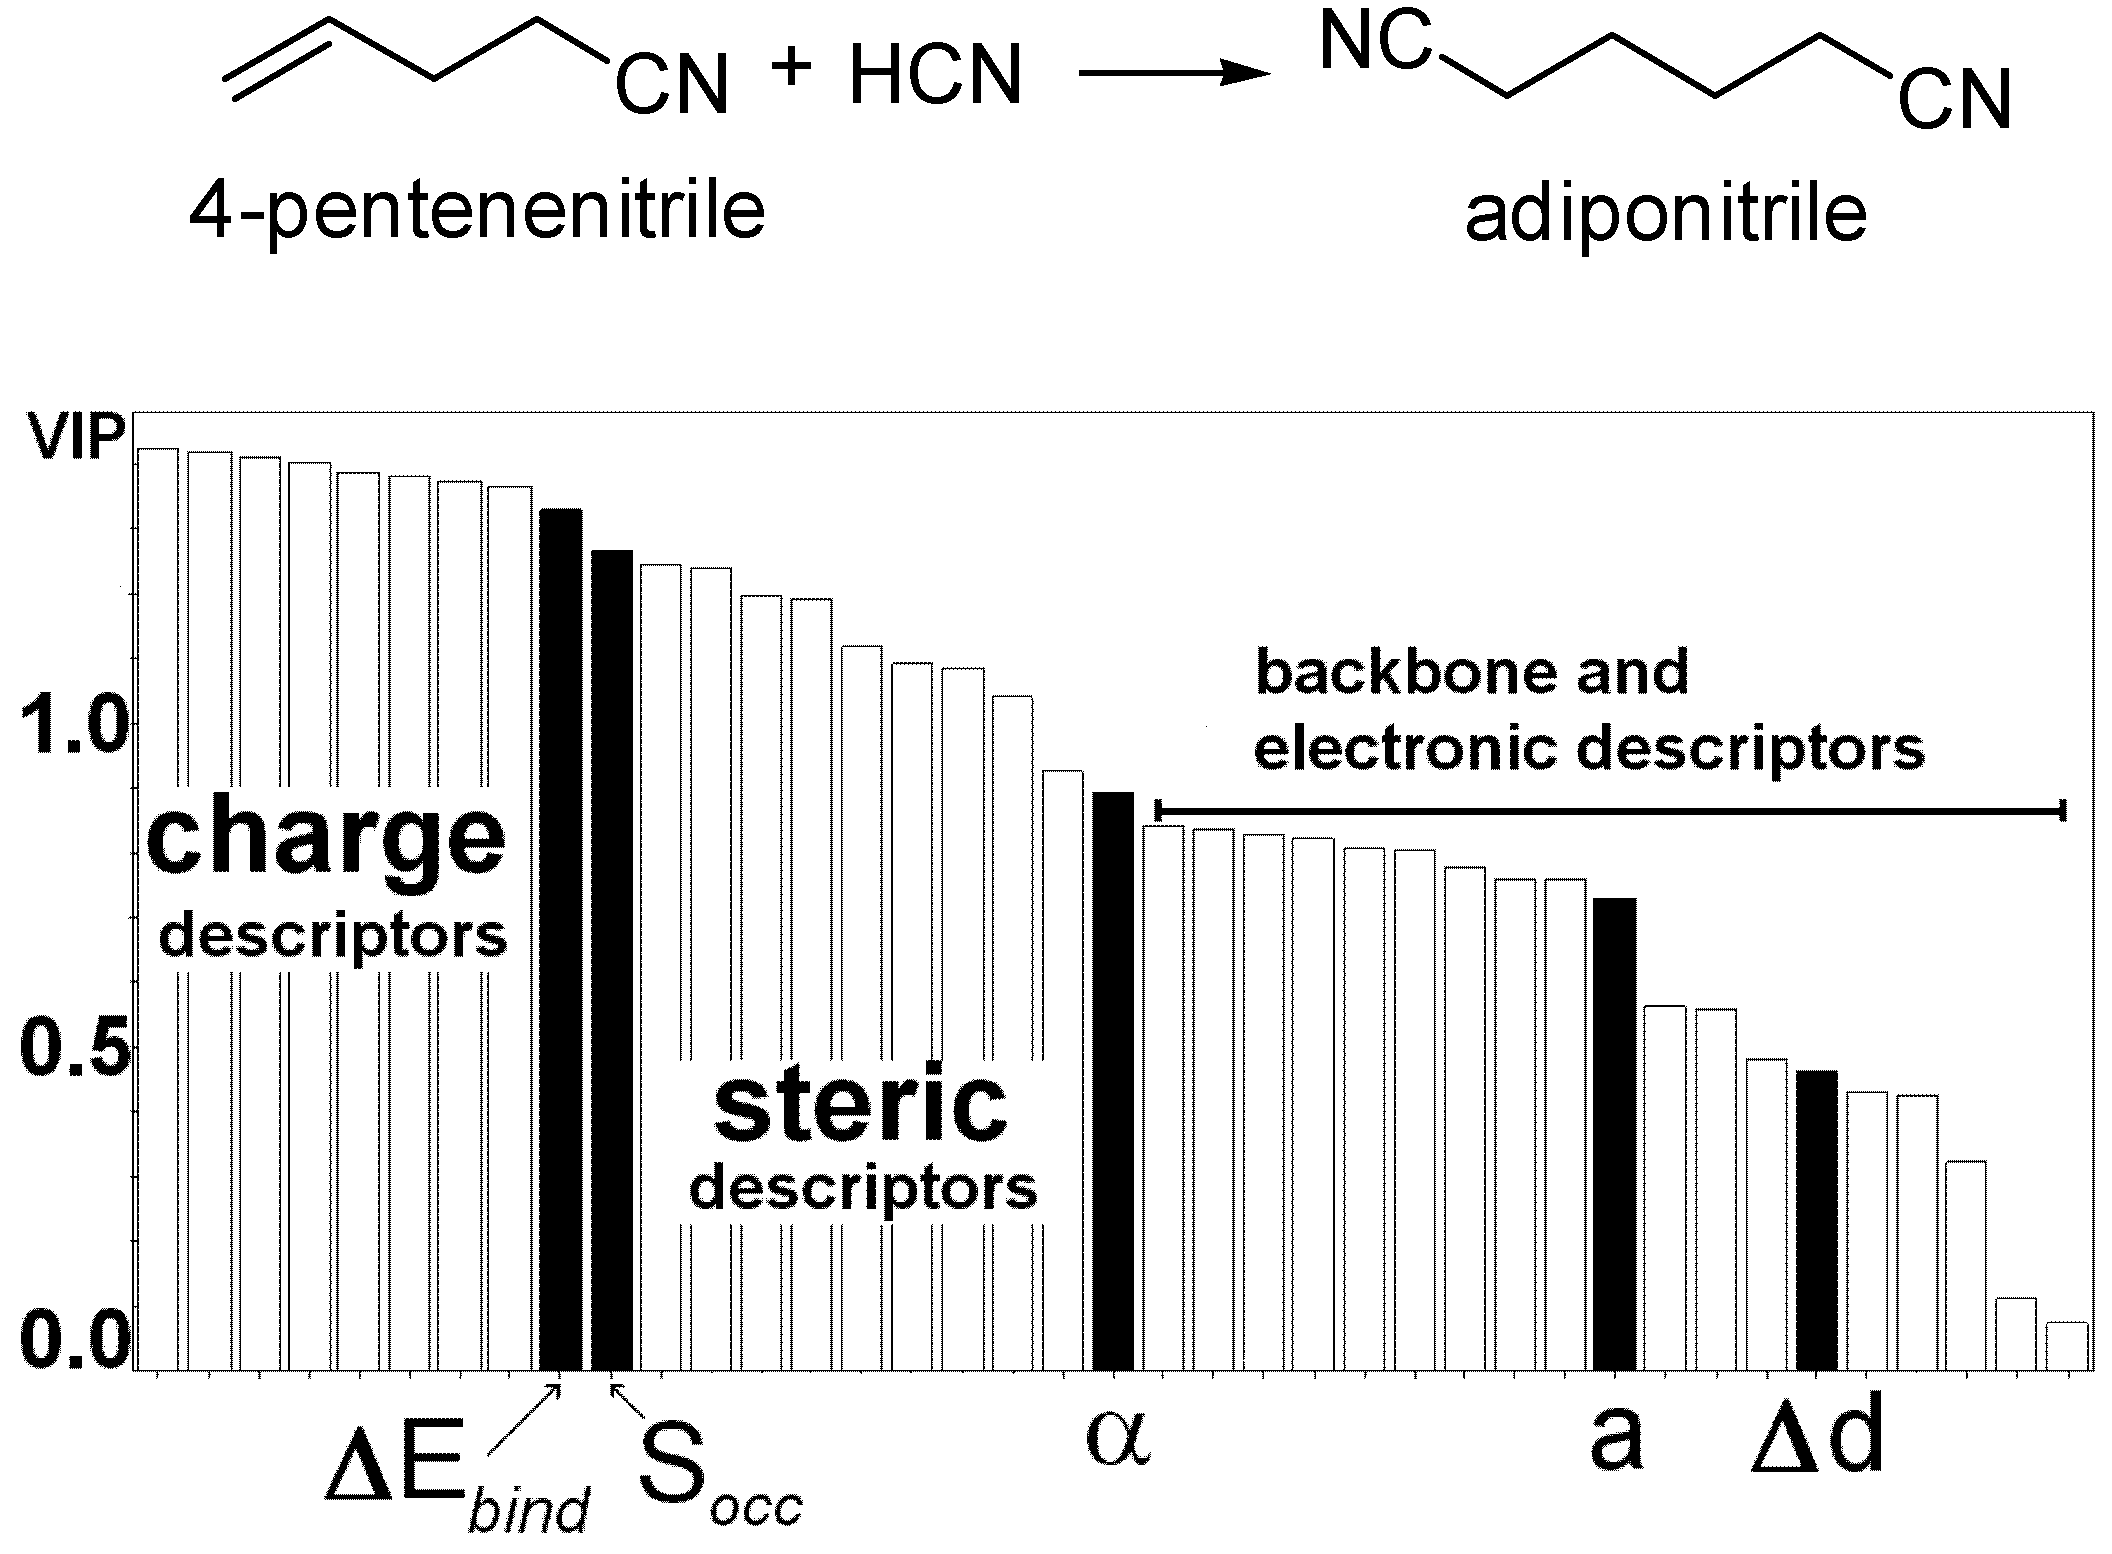
We followed a similar approach for the Ni-catalyzed hydrocyanation reaction where PLS analysis is used to develop a QSAR model that relates steric and electronic parameters calculated on a set of 42 ligands with their catalytic performance (TON).[83] The influence of each descriptor on the figure of merit (adiponitrile product yield) is calculated as the VIP parameter and can be seen as the sum over all model dimensions of the variable influence contributions (Figure 8). The charge at the ligating atoms, the rigidity of the molecules, the steric crowding around the metal centre and the bite angle are the most important descriptors evidenced by the PLS model. The results comply with known mechanistic and experimental information and the model correctly pinpoints key structural features related to high catalyst activity.
Another approach that employs PLS analysis is the CoMFA methodology. For the purpose of interpretation, the results from CoMFA studies are often presented with contour plots of the partial regression coefficients obtained by the PLS analysis. Again, the coefficients are needed for prediction of new samples, but since their size and sign reveal the relative importance of the variables, they are also suitable for interpretation. The information is not coded as descriptors but rather as a set of parameters that relate to the steric and electronic field of the molecules. The CoMFA methodology was applied by several authors to study structure-activity relationships of catalysts in the Asymmetric Diels-Alder reaction and the metallocene-based ethylene polymerization.[59]
Figure 8.
Variable importance (VIP) plot, showing the importance of every descriptor in the model for the hydrocyanation of pentenenitrile. VIP values higher than 1.0 are attributed to descriptors that contribute most in the prediction of ligand activity. Charge descriptors refer to the Mulliken charge calculated at the ligating atoms. ΔEbind is the energy difference between the free ligand and the metal complex, and can be related to the chelating effect and flexibility of the molecule. Socc is the sphere occupation descriptor and measures the sterics around the metal centre. α is the bite angle. a is the second derivative of the flexibility profile polynomial. Δd is the difference in the interatomic distance between the ligating atoms between the free ligand and the complex. Steric descriptors are calculated with the Steric® software. Backbone descriptors refer to properties calculated on the backbone alone. Electronic descriptors are HOMO, LUMO and dipoles of molecules.
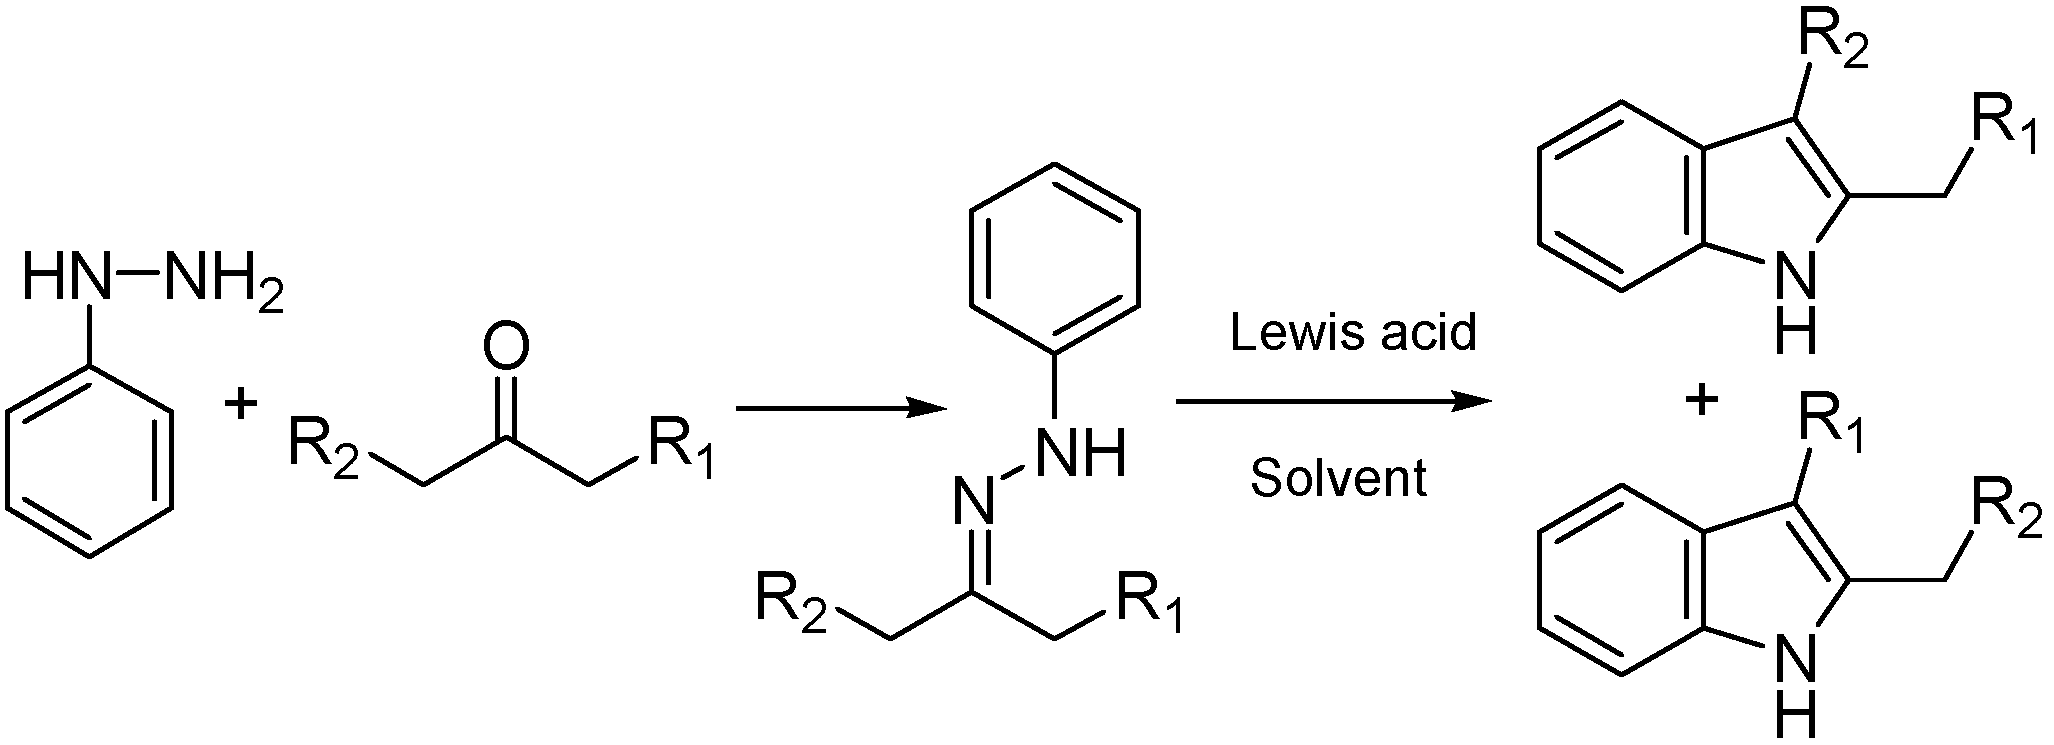
An interesting PLS model that discriminates between successful and failed reaction systems was developed by Carlson and Gautun.[84] They describe a combinatorial study in which the substrate, Lewis acid catalyst and solvent were varied to determine if certain combinations yield a regioselective indole synthesis (Figure 9). The total number of possible combinations is 600. Of these, 256 were tested experimentally. In choosing these experiments, the ketones, solvents and catalysts were selected according to their principal property score values. In this way, the researchers maximized the spread in the property space, and minimized the number of experiments. Score values and their squares were included together with the interaction terms and used as input variables for the PLS analysis. The most important influence is from the interaction term that accounts for nucleophilic/electrophilic properties of ketones and the size of one of their side chains, implying that large substituents and polarized ketones favor the reaction. The PCA analysis revealed that data points in the score vector plot form clusters. The clusters were defined by different ketone substrates and therefore the catalyst and solvent effects are valid for every ketone tested. A PLS analysis on reactions with the same ketone substrate revealed that properties such as catalyst hardness and solvent polarity/polarizability were positively correlated with ‘successful reaction’. Another important interaction term between the Lewis acid hardness and the solvent polarizability was found to affect negatively the reaction outcome.
Figure 9.
Formation of indoles from dissymmetric ketones by the Fisher indole synthesis. In the work of Carlson and Gautun, PLS analysis is used to identify critical properties of the reaction system so that both conditions that are favorable for the reaction as well as conditions that can fail can be identified. Substrates, solvents and Lewis acids are varied systematically obtaining a set of 254 reactions.
3.2 Artificial Neural Networks and Classification Analysis
As data mining became more attractive for the analysis of existing chemical systems, several new methods were implemented in the QSAR studies. Methods such as Artificial Neural Networks (ANNs) and classification techniques are broadly applied to biochemical systems and few examples can be found in the field of homogeneous catalysis. Neural networks are applicable in every situation where a relationship between the independent variables (inputs) and predicted variables (outputs) exists, but especially when that relationship is complex and difficult to explain in the usual terms of "correlations". With their remarkable ability to derive meaning from complicated or imprecise data, ANNs can be used to extract patterns and detect trends that are too complex to be noticed by either humans or other computer techniques.
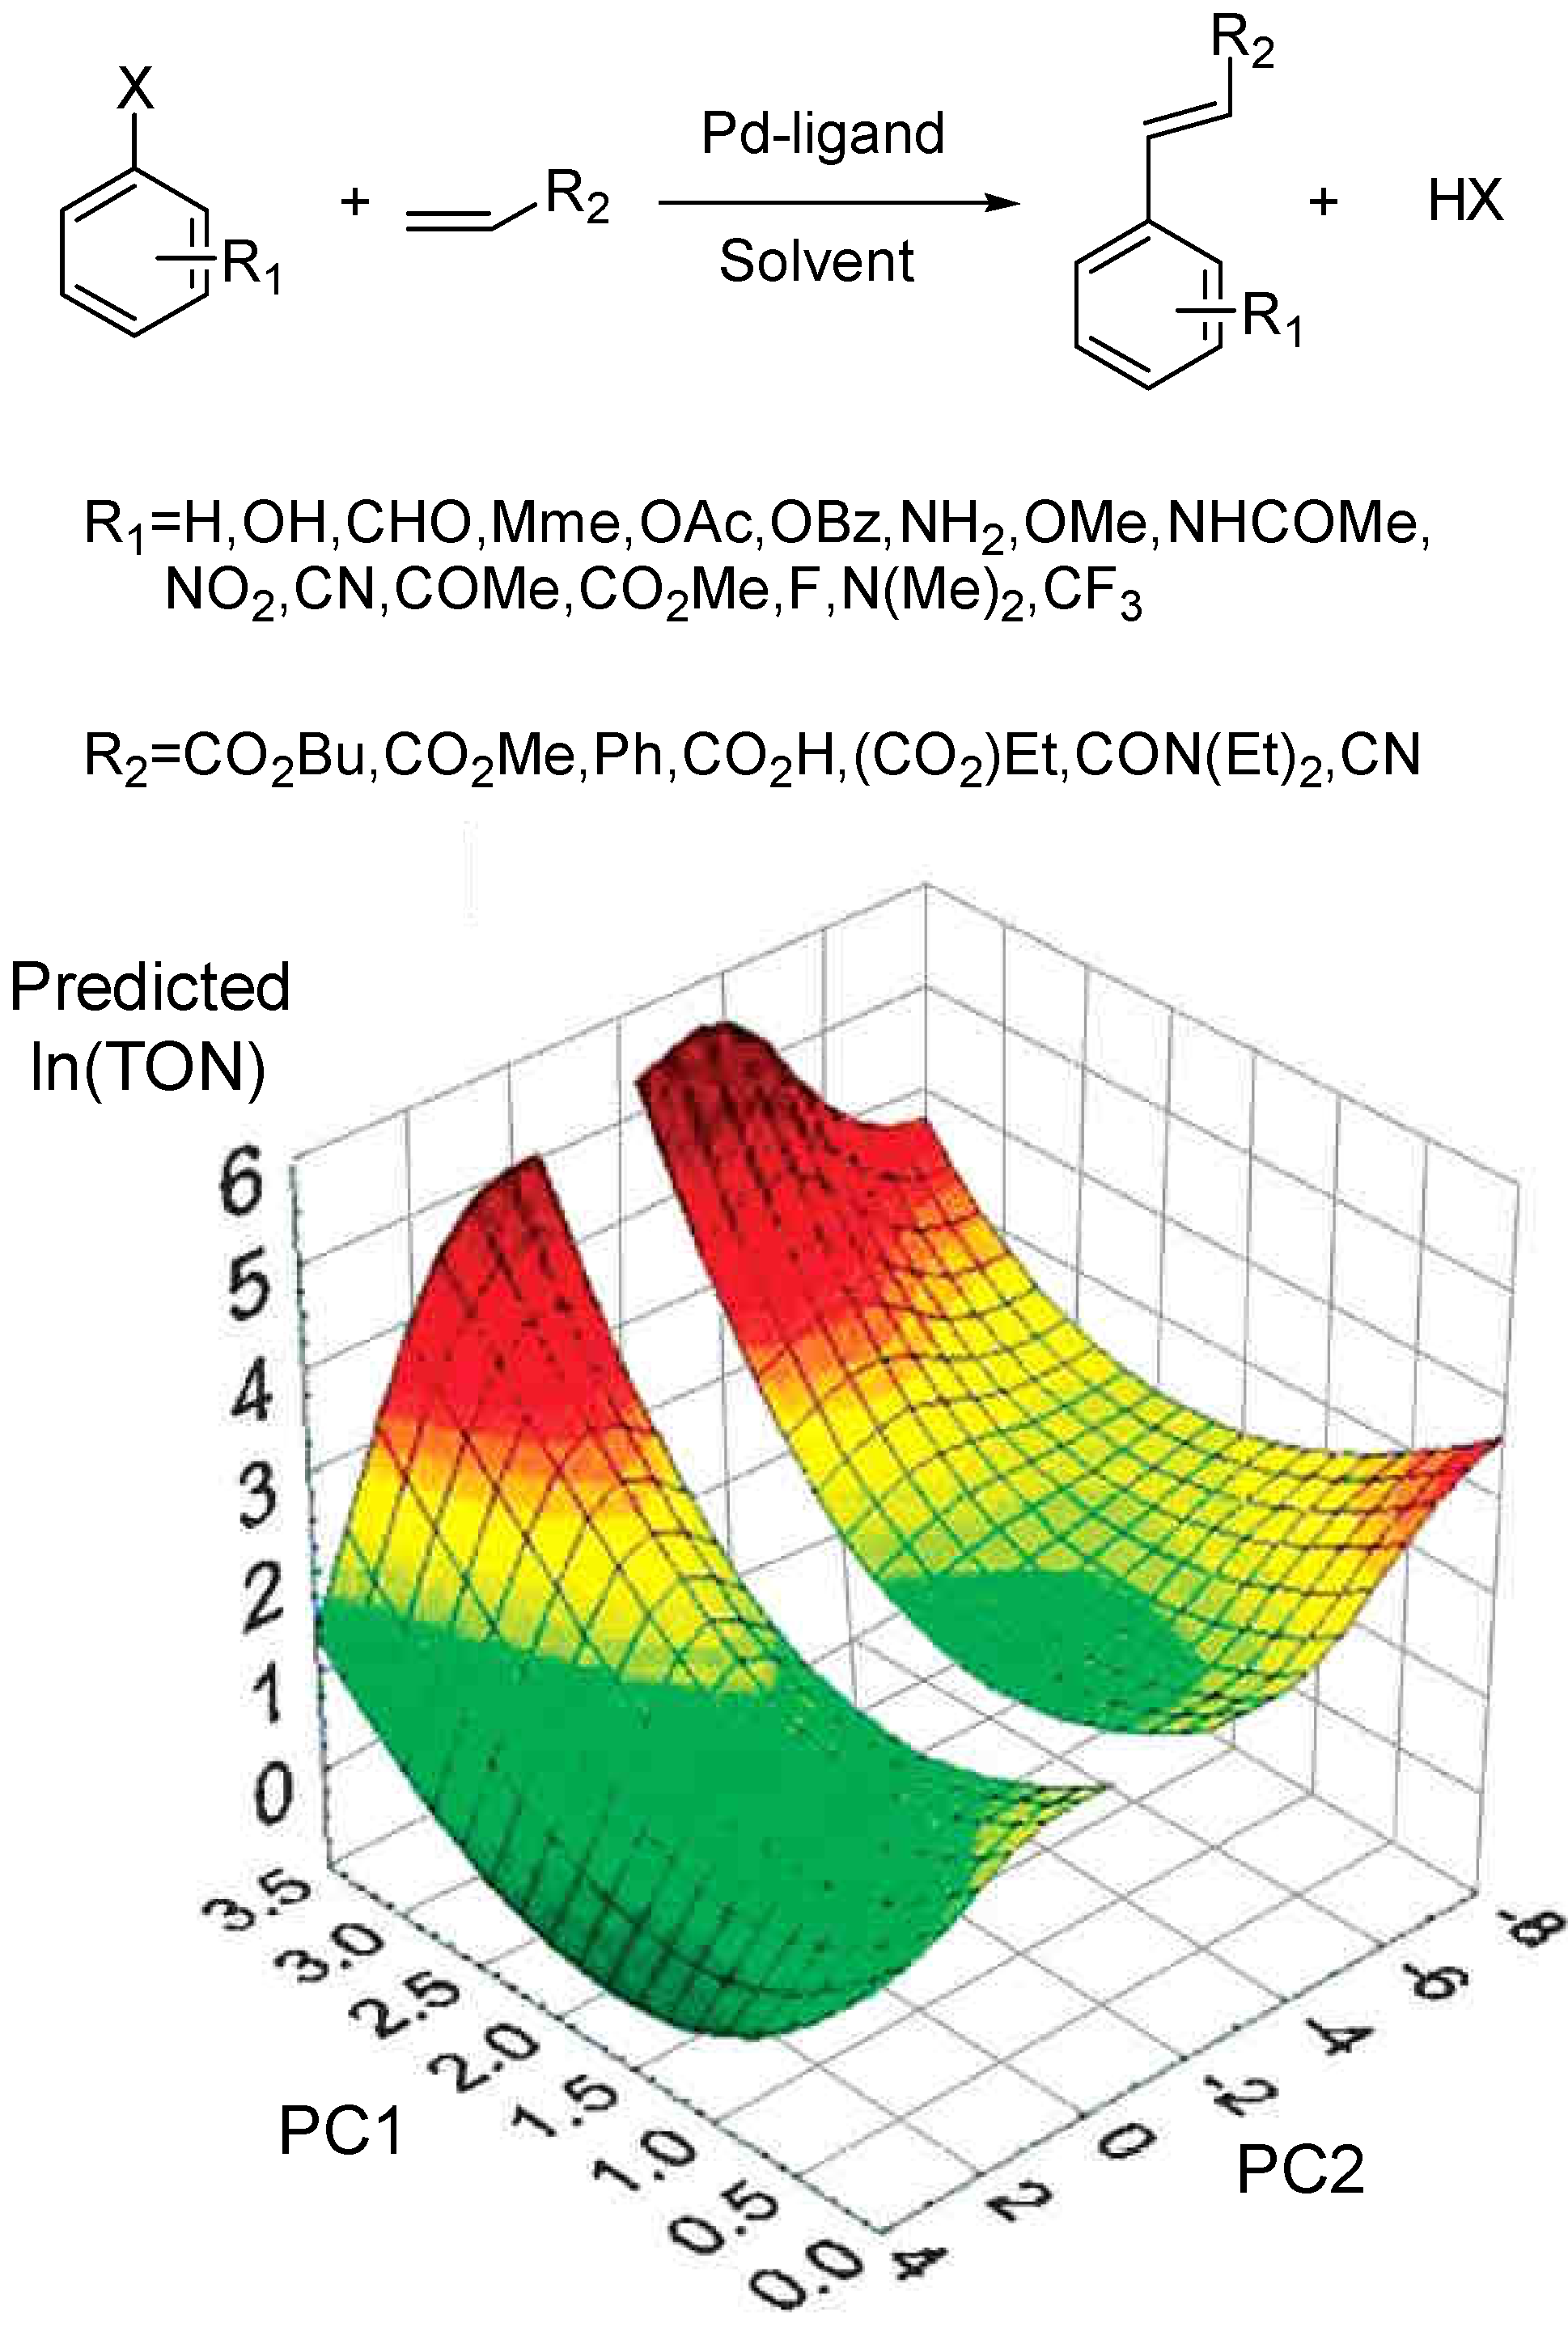
We recently used ANNs to analyze a set of 412 Heck cross-coupling reactions collected from published literature (Figure 10 top).[85] Linear multiple regression, neural networks and classification analysis were used to pinpoint correlations between the figures of merit of the reactions (Turnover number and Turnover frequency) and the descriptors calculated on ligand and substrate structures. Solvents were represented by empirical scales; reaction conditions such as Pd loading, time and temperature were also included in the study. All statistical analyses pointed out the importance of the Pd loading but the non-linear methods were able to capture high-order effects showing the importance of steric and electronic ligand parameters. The fact that a negative correlation exist between the TON and the metal loading can be explained by means of metal cluster formation. As many other authors we maintain that every Heck reaction that is catalyzed by “homogeneous Pd complexes” also involves Pd clusters or Pd0 atoms. The analysis of reactions from literature supports the idea that if clusters are indeed involved one would expect an inverse relationship between Pd concentration and the figure of merit, because a high concentration of clusters would lead to faster deactivation via Pd black. The best NN model was then used to screen a new set of 60,000 Heck reactions containing all possible combinations of 61 new phosphines with four olefins, four arylhalides, five catalyst precursors, four solvents, and three palladium concentrations. The new 61 ligand structures were designed using building blocks available from commercial catalogues. Figure 10 shows a contour plot of the predicted TON for the 60,000 virtual reactions vs. the two first principal components. This approach enables a simple and fast selection of the most promising catalysts candidates.
Figure 10.
(top) General Heck reaction dataset. Ligands: monophosphines and monophosphites; solvents: DMF, THF, DMA, dioxane, Et3N, PhMe, NMP, MeCN, EtCN, PrCN, HMPT and 1,2-DCE; (bottom) Predicted TON values for 60,000 virtual cross-coupling reactions are plotted versus the first two PCs calculated for all the reaction descriptors. The first PC is correlated mainly with the Pd loading and the electronic descriptors of the organic residue on the alkene, R2. The second PC represents mainly the ligand’s electronic descriptors.
Another application of neural networks and classification methods for data analysis in homogeneous catalysis is given by Cundari et al.[86,87,88] The authors employed several data mining methods to disclose relationships between various metric parameters in transition metal imido complexes, a class of catalysts implicated in nitrogen fixation and C-H activation processes. The structures analysed were retrieved from the CSD and carried the motif: LnM=NZ, where M is the transition metal, L a ligand, N the nitrogen bound to the metal and Z a generic substituent. These data mining techniques confirmed the suspected relationship between the metal-nitrogen bond length and the metal-nitrogen-substituent angle: as this angle increases the metal-nitrogen distance shortens. Hence, metals, ligands and substituents that favor a double bond between the nitrogen and the metal would be expected to be favorable from the point of view of catalyst design. Furthermore, the results obtained with such data mining methods pointed out the existence of several outliers clustered together. The identification of outliers is important as they might correspond to unreported experimental errors or novel chemical entities that need further investigation. The metric parameters are obtained directly from crystal structures and therefore this method of analysis cannot be used to examine virtual compounds. However, the CSD comprises many structures that include a metal atom and constitute a valuable source of information that can be extracted in such a way.
3.3 General Methodology in Data Analysis
Creating a QSAR/QSPR model involves several additional steps that need to be mentioned. These are the validation of the model and the selection of relevant variables. If data are scarce or one cannot prove the validity of a model by performing new experiments, the model can still be validated. The validation consists of dividing the dataset into two parts: a training set that is used to develop a QSAR model, and a test set. The experimental activities of the latter are known but are not employed to generate the model. Once obtained the regression equation for the training set, a prediction of activity is calculated on the test set. In this way several different models, all trained on the training set, can be compared on the test set. This is the basic form of cross-validation. A better method, which is intended to avoid the possible bias introduced by relying on any one particular division into test and train components, is to partition the original set in several different ways and compute an average score over the different partitions. An extreme variant of this is to split the p patterns into a training set of size p-1 and a test of size 1 and average the squared error on the left-out pattern over the p possible ways of obtaining such a partition. This is called leave-one-out cross-validation. The advantage is that all the data can be used for training - none has to be held back in a separate test set.
The problem of finding the right descriptors is complicated. One way is to use intuition, choosing among several well known descriptors. This is difficult to do when many interconnected effects predominate, or when the number of descriptors is very large. In such cases, the high-dimensional data representations that are commonplace in combinatorial chemistry pose a number of problems. First, as the number of descriptors increases, the likelihood of intercorrelation also increases. Redundant variables tend to bias the result and increase the computational costs. In most cases, however, ranking methods such as principal component analysis (PCA) can remove the redundant information. PCA takes as its input a set of vectors described by partially cross-correlated variables (the descriptors) and transforms it into one characterized by a smaller number of orthogonal variables without losing the variance of the data. For regression purposes, one can use directly the latent variables as inputs or select a subset of least inter-correlated descriptors.
Variable selection techniques include more recent efforts such as the application of evolutionary strategies to find the optimal subset of descriptors that lead to the best fit model. These methods are particularly suitable when the number of possible combinations among descriptors is far too high to be explored exhaustively (a detailed discussion on variable selection techniques, is available elsewhere [89, 90]).
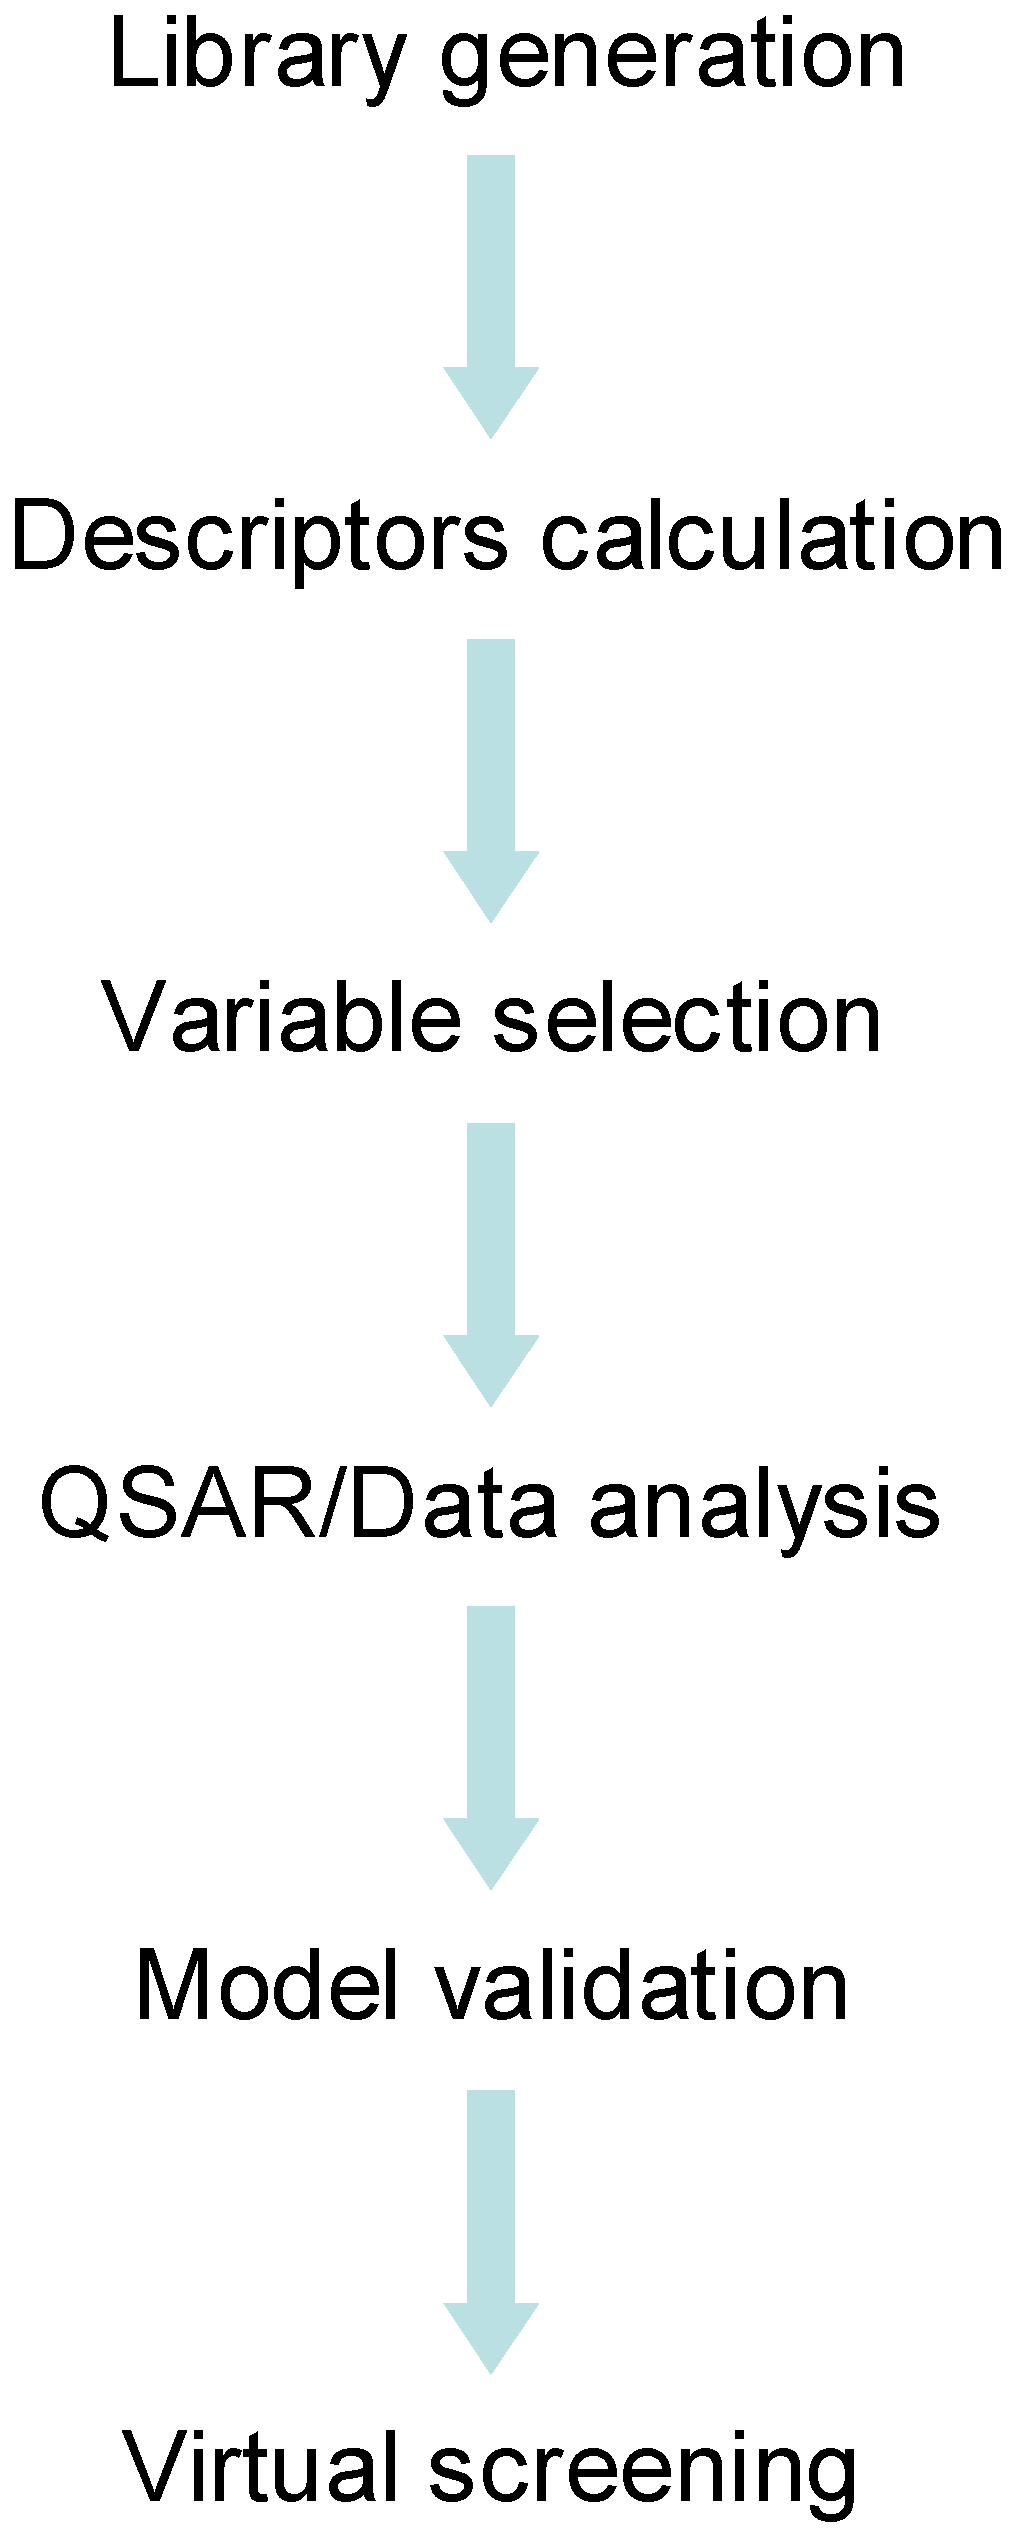
Scheme 2 shows a general flowchart for computer-aided catalyst design. It summarizes the steps analyzed in this review. The first step is the library generation which can be achieved by attaching automatically building blocks to a central scaffold (see the work of Hageman et al.[91] for an example of automatic library generation). The library generation can lead to 1D, 2D and 3D structures of catalysts. 3D descriptors require geometry optimization, whereas 2D and 1D descriptors can be calculated directly from connectivity tables of molecules. After the calculation of descriptors, the variables need to be selected before the modelling step. The variable selection process can be an iterative process together with the modelling step, provided that a certain goodness of fit is achieved. The QSAR/QSPR analysis can be accomplished by using linear and non-linear methods; the choice usually depends on the problem complexity and the number of parameters that vary in the dataset (e.g. solvent, catalyst loading or ligand structure). Finally the model, generated using the training set, is validated against an external set of catalysts. Once the model is validated it is then used to predict catalyst performance on virtual libraries of catalysts or reaction conditions.
Scheme 2.
Flowchart for virtual screening of catalyst library.
4. Conclusions and Outlook
Recent years have witnessed major advances in combinatorial synthesis and high-throughput screening for discovery and optimization in homogeneous catalysis. Although these were met with resistance, the increasing number of scientific papers and patents devoted to this field show that the initial skepticism has turned into acceptance and application. One thing is certain: High-throughput experimentation and modelling is complementing chemical knowledge and chemical intuition, not replacing it. A successful catalyst discovery/optimization workflow requires a genuine interdisciplinary team. It needs chemists, chemometricians, engineers and computer scientists. With the advances in hardware and robotics, more and more experimental data is available, and the “price” of the basic research unit, the chemical experiment, plummets. To make good use of these developments, catalysis chemists must change their view of experiments. Instead of doing single experiments, one should plan and perform sets of experiments. These in vitro sets can then be combined with in silico experiments, yielding libraries of better catalysts.
This is an exciting field, with several important open questions. Top-down design of homogeneous catalysts by selecting candidates from virtual libraries is one important challenge. Defining and understanding catalyst diversity is another. Indeed, understanding catalyst diversity is the key to efficient sampling of the catalyst space. Yet another challenge is choosing the right descriptors for a given reaction, as well as the optimal model system.
References and Notes
- Dolle, R.E. Comprehensive Survey of Combinatorial Library Synthesis: 1999. J. Comb. Chem. 2000, 2, 383–433. [Google Scholar] [CrossRef]
- Boring, E.; Geletii, Y.V.; Hill, C.L. A homogeneous catalyst for selective O-2 oxidation at ambient temperature. Diversity-based discovery and mechanistic investigation of thioether-oxidation by the Au(III)Cl2NO3(thioether)/O-2 system. J. Am. Chem. Soc. 2001, 123, 1625–1635. [Google Scholar] [CrossRef]
- Schareina, T.; Kempe, R. Combinatorial libraries with p-functionalized aminopyridines: Ligands for the preparation of efficient C(Aryl)-Cl activation catalysts. Angew. Chem. Int. Ed. 2002, 41, 1521–1523. [Google Scholar] [CrossRef]
- Schiedel, M.S.; Briehn, C.A.; Bauerle, P. C-C cross-coupling reactions for the combinatorial synthesis of novel organic materials. J. Organomet. Chem. 2002, 653, 200–208. [Google Scholar] [CrossRef]
- Stambuli, J.P.; Hartwig, J.F. Recent advances in the discovery of organometallic catalysts using high-throughput screening assays. Curr. Opin. Chem. Biol. 2003, 7, 420–426. [Google Scholar] [CrossRef]
- Stambuli, J.P.; Stauffer, S.R.; Shaughnessy, K.H.; Hartwig, J.F. Screening of homogeneous catalysts by fluorescence resonance energy transfer. Identification of catalysts for room-temperature Heck reactions. J. Am. Chem. Soc. 2001, 123, 2677–2678. [Google Scholar] [CrossRef]
- Fagan, P.J.; Hauptman, E.; Shapiro, R.; Casalnuovo, A. Using intelligent/random library screening to design focused libraries for the optimization of homogeneous catalysts: Ullmann ether formation. J. Am. Chem. Soc. 2000, 122, 5043–5051. [Google Scholar] [CrossRef]
- Yue, T.Y.; Nugent, W.A. Enantioselective hydrogenation of 3-alkylidenelactams: High-throughput screening provides a surprising solution. J. Am. Chem. Soc. 2002, 124, 13692–13693. [Google Scholar] [CrossRef]
- Boele, M.D.K.; van Strijdonck, G.P.F.; de Vries, A.H.M.; Kamer, P.C.J.; de Vries, J.G.; van Leeuwen, P.W.N.M. Selective Pd-catalyzed oxidative coupling of anilides with olefins through C-H bond activation at room temperature. J. Am. Chem. Soc. 2002, 124, 1586–1587. [Google Scholar] [CrossRef]
- Long, J.; Hu, J.Y.; Shen, X.Q.; Ji, B.M.; Ding, K.L. Discovery of exceptionally efficient catalysts for solvent-free enantioselective hetero-Diels-Alder reaction. J. Am. Chem. Soc. 2002, 124, 10–11. [Google Scholar] [CrossRef]
- Sigman, M.S.; Jacobsen, E.N. Schiff base catalysts for the asymmetric Strecker reaction identified and optimized from parallel synthetic libraries. J. Am. Chem. Soc. 1998, 120, 4901–4902. [Google Scholar] [CrossRef]
- Burgess, K.; Lim, H.J.; Porte, A.M.; Sulikowski, G.A. New catalysts and conditions for a C-H insertion reaction identified by high throughput catalyst screening. Angew. Chem. Int. Ed. Engl. 1996, 35, 220–222. [Google Scholar] [CrossRef]
- Shaughnessy, K.H.; Kim, P.; Hartwig, J.F. A fluorescence-based assay for high-throughput screening of coupling reactions. Application to Heck chemistry. J. Am. Chem. Soc. 1999, 121, 2123–2132. [Google Scholar] [CrossRef]
- Gao, X.; Kagan, H.B. One-pot multi-substrate screening in asymmetric catalysis. Chirality 1998, 10, 120–124. [Google Scholar]
- Rappe, A.T.; Skiff, W.M.; Casewit, C.J. Modeling metal-catalyzed olefin polymerization. Chemical Reviews 2000, 100, 1435–1456. [Google Scholar] [CrossRef]
- Willett, P. Chemoinformatics - similarity and diversity in chemical libraries. Curr. Opin. Biotechnol. 2000, 11, 85–88. [Google Scholar] [CrossRef]
- Fergus, S.; Bender, A.; Spring, D.R. Assessment of structural diversity in combinatorial synthesis. Curr. Opin. Chem. Biol. 2005, 9, 304–309. [Google Scholar] [CrossRef]
- Maldonado, A.G.; Doucet, J.P.; Petitjean, M.; Fan, B.T. Molecular similarity and diversity in chemoinformatics: From theory to applications. Molecular Diversity 2006, 10, 39–79. [Google Scholar] [CrossRef]
- Tolman, C.A. Phosphorus ligand exchange equilibriums on zerovalent nickel. Dominant role for steric effects. J. Am. Chem. Soc. 1970, 92, 2956–2965. [Google Scholar] [CrossRef]
- Tolman, C.A. Electron donor-acceptor properties of phosphorus ligands. Substituent additivity. J. Am. Chem. Soc. 1970, 92, 2953–2956. [Google Scholar] [CrossRef]
- Tolman, C.A. Electronic effects of phosphorus ligands on the protonation of NiL4 complexes. Inorg. Chem. 1972, 11, 3128–3129. [Google Scholar] [CrossRef]
- Tolman, C.A. Steric effects of phosphorus ligands in organometallic chemistry and homogeneous catalysis. Chem. Rev. 1977, 77, 313–348. [Google Scholar] [CrossRef]
- Brown, T.L.; Lee, K.J. Ligand Steric Properties. Coord. Chem. Rev. 1993, 128, 89–116. [Google Scholar] [CrossRef]
- Imyanitov, N.S. Cone angle of ligands - Group IV and V compounds. Koordinatsionnaya Khimiya 1985, 11, 1171–1178. [Google Scholar]
- Imyanitov, N.S. Numerical determination of the steric characteristics of ligands. Conical angles of Group IV and V element hydrides and halides. Koordinatsionnaya Khimiya 1985, 11, 1041–1045. [Google Scholar]
- Alyea, E.C.; Dias, S.A.; Ferguson, G.; Restivo, R.J. Structural Studies of Steric Effects in Phosphine Complexes. Synthesis and Crystal and Molecular Structure of the Dinitrato( tricyclohexylphosphine)mercury (II) Dimer. Inorg. Chem. 1977, 16, 2329–2334. [Google Scholar] [CrossRef]
- Alyea, E.C.; Dias, S.A.; Ferguson, G.; Parvez, M. Structural studies of steric effects in phosphine complexes. Part 6. The synthesis, characterization and molecular structure of the dinitro(trimesitylphosphine)mercury(II)dimer. Inorg. Chim. Acta 1979, 37, 45–52. [Google Scholar] [CrossRef]
- Smith, J.D.; Oliver, J.D. Ligand profiles of tricyclohexylphosphine. Structure of (.pi.-allyl)bis(tricyclohexylphosphine)platinum hexafluorophosphate. Inorg. Chem. 1978, 17, 2585–2589. [Google Scholar] [CrossRef]
- Zakharov, L.N.; Saf'yanov, Y.N.; Domrachev, G.A. A role of non-bonding interactions in the chemistry of organometalic compounds. Inorg. Chim. Acta 1989, 160, 77–82. [Google Scholar] [CrossRef]
- Xing-Fu, L.; Ao-Ling, G. The Nature of seat-ligand fitting in coordination space. V. Steric hindrances and reaction mechanisms — a further discussion on the structure and chemistry of compounds containing three pi-bonded cyclopentadienyl groups. Inorg. Chim. Acta 1987, 134, 143–153. [Google Scholar] [CrossRef]
- Xing-Fu, L.; Eggers, S.; Kopf, J.; Jahn, W.; Fischer, R.D.; Apostolidis, C.; Kanellakopulos, B.; Benetollo, F.; Polo, A.; Bombieri, G. Preparation and characterization of the first triscyclopentadienyl lanthanoid complexes containing two aliphatic nitrile ligands: Crystal and molecular structures of the isomorphous compounds Trans-bis(acetonitrile)tris(η5cyclopentadienyl)lanthanoid(III) (Ln = La, Ce, Pr). A successful confirmation of the solid ‘solid angle sum rule’. Inorg. Chim. Acta 1985, 100, 183–189. [Google Scholar] [CrossRef]
- Immirzi, A.; Musco, A. A method to measure the size of phosphorus ligands in coordination complexes. Inorg. Chim. Acta 1977, 25, L41–L42. [Google Scholar] [CrossRef]
- White, D.; Taverner, B.C.; Leach, P.G.L.; Coville, N.J. Quantification of Substituent and Ligand Size by the Use of Solid Angles. J. Comp. Chem. 1993, 14, 1042–1049. [Google Scholar] [CrossRef]
- White, D.; Tavener, B.C.; Leach, P.G.L.; Coville, N.J. Solid Angles . 1. The Radial Profile. J. Organomet. Chem. 1994, 478, 205–211. [Google Scholar] [CrossRef]
- White, D.; Coville, N.J. Quantification of steric effects in organometallic chemistry. In Advances in Organometallic Chemistry; Vol 36, 1994; pp. 95–158. [Google Scholar]
- White, D.; Taverner, B.C.; Coville, N.J.; Wade, P.W. Solid Angles .3. The Role of Conformers in Solid Angle Calculations. J. Organomet. Chem. 1995, 495, 41–51. [Google Scholar] [CrossRef]
- White, D.P.; Anthony, J.C.; Oyefeso, A.O. Computational measurement of steric effects: the size of organic substituents computed by ligand repulsive energies. J. Org. Chem. 1999, 64, 7707–7716. [Google Scholar] [CrossRef]
- Taverner, B.C.; Smith, J.M.; White, D.P.; Coville, N.J. Quantification of ligand-ligand interactions using solid angles. South African Journal of Chemistry-Suid-Afrikaanse Tydskrif Vir Chemie 1997, 50, 59–66. [Google Scholar]
- Steric®. Steric is available in binary for Linux (1.2.8), IRIX (5.2) and 32-bit extended DOS (gjgpp), as well as in source code for other Unix platforms. See http://www.ccl.net/cca/software/SOURCES/C/steric/index.shtml.
- Cooney, K.D.; Cundari, T.R.; Hoffman, N.W.; Pittard, K.A.; Temple, M.D.; Zhao, Y. A priori assessment of the stereoelectronic profile of phosphines and phosphites. J. Am. Chem. Soc. 2003, 125, 4318–4324. [Google Scholar] [CrossRef]
- Kamer, P.C.J.; Reek, J.N.H.; van Leeuwen, P.W.N.M. Designing ligands with the right bite. Chemtech 1998, 28, 27–33. [Google Scholar]
- Kamer, P.C.J.; van Leeuwen, P.W.N.M.; Reek, J.N.H. Wide bite angle diphosphines: Xantphos ligands in transition metal complexes and catalysis. Acc. Chem. Res. 2001, 34, 895–904. [Google Scholar] [CrossRef]
- van der Veen, L.A.; Kamer, P.C.J.; van Leeuwen, P.W.N.M. Unraveling the bite angle effect - New ligands for selective hydroformylation of internal alkenes. Cattech 2002, 6, 116–120. [Google Scholar] [CrossRef]
- Van Haaren, R.J.; Van Leeuwen, P.W.N.M.; Van Strijdonck, G.P.F.; Oevering, H.; Reek, J.N.H.; Kamer, P.C.J. Bite angle effects on the regioselection of allylic alkylation. Abs. Pap. Am. Chem. Soc. 2000, 220, U522–U522. [Google Scholar]
- van Leeuwen, P.W.N.M.; Kamer, P.C.J.; Reek, J.N.H. The bite angle makes the catalyst. Pure Appl. Chem. 1999, 71, 1443–1452. [Google Scholar] [CrossRef]
- van Leeuwen, P.W.N.M.; Kamer, P.C.J.; Reek, J.N.H.; Dierkes, P. Ligand bite angle effects in metal-catalyzed C-C bond formation. Chem. Rev. 2000, 100, 2741–2769. [Google Scholar] [CrossRef]
- van Leeuwen, P.W.N.M.; Kamer, P.C.J.; van der Veen, L.A.; Reek, J.N.H. Bite angle effects in hydroformylation catalysis. Chin. J. Chem. 2001, 19, 1–8. [Google Scholar]
- Dierkes, P.; van Leeuwen, P.W.N.M. The bite angle makes the difference: a practical ligand parameter for diphosphine ligands. J. Chem. Soc., Dalton Trans. 1999, 1519–1529. [Google Scholar] [CrossRef]
- Freixa, Z.; van Leeuwen, P.W.N.M. Bite angle effects in diphosphine metal catalysts: steric or electronic? Dalton Trans. 2003, 1890–1901. [Google Scholar] [CrossRef]
- Kranenburg, M.; Kamer, P.C.J.; van Leeuwen, P.W.N.M. The effect of the bite angle of diphosphane ligands on activity and selectivity in palladium-catalyzed allylic alkylation. Eur. J. Inorg. Chem. 1998, 25–27. [Google Scholar] [CrossRef]
- Lenero, K.A.; Kranenburg, M.; Guari, Y.; Kamer, P.C.J.; van Leeuwen, P.W.N.M.; Sabo-Etienne, S.; Chaudret, B. Ruthenium dihydrogen complexes with wide bite angle diphosphines. Inorg. Chem. 2003, 42, 2859–2866. [Google Scholar] [CrossRef]
- Aires-de-Sousa, J.; Gasteiger, J. Prediction of enantiomeric excess in a combinatorial library of catalytic enantioselective reactions. J. Comb. Chem. 2005, 7, 298–301. [Google Scholar] [CrossRef]
- Aires-de-Sousa, J.; Gasteiger, J. New description of molecular chirality and its application to the prediction of the preferred enantiomer in stereoselective reactions. J. Chem. Inf. Comp. Sci. 2001, 41, 369–375. [Google Scholar]
- A demo version of the 2D-to-3D conversion program Corina is accessible at no charge from http://www.molecular-networks.com/online_demos/corina_demo.html.
- Cramer, R.D.I.; Patterson, D.E.; Bunce, D.J. Comparative Molecular Field Analysis (CoMFA). 1. Effect of Shape on Binding of Steroids to Carrier Proteins. J. Am. Chem. Soc. 1988, 110, 5959–5967. [Google Scholar] [CrossRef]
- Lipkowitz, K.B.; Schefzick, S.; Avnir, D. Enhancement of enantiomeric excess by ligand distortion. J. Am. Chem. Soc. 2001, 123, 6710–6711. [Google Scholar] [CrossRef]
- Lipkowitz, K.B.; Schefzick, S. Ligand distortion modes leading to increased chirality content of Katsuki-Jacobsen catalysts. Chirality 2002, 14, 677–682. [Google Scholar] [CrossRef]
- Lipkowitz, K.B.; Kozlowski, M.C. Understanding stereoinduction in catalysis via computer: New tools for asymmetric synthesis. Synlett 2003, 1547–1565. [Google Scholar] [CrossRef]
- Lipkowitz, K.B.; Pradhan, M. Computational studies of chiral catalysts: A comparative molecular field analysis of an asymmetric Diels-Alder reaction with catalysts containing bisoxazoline or phosphinooxazoline ligands. J. Org. Chem. 2003, 68, 4648–4656. [Google Scholar] [CrossRef]
- Bubel, R.J.; Douglass, W.; White, D.P. Molecular mechanics-based measures of steric effects: Customized code to compute ligand repulsive energies. J. Comp. Chem. 2000, 21, 239–246. [Google Scholar] [CrossRef]
- Gillespie, A.M.; White, D.P. Understanding the steric control of stereoselective olefin binding in cyclopentadienyl complexes of rhenium: An application of de novo ligand design. Organometallics 2001, 20, 5149–5155. [Google Scholar] [CrossRef]
- Gillespie, A.M.; Morello, G.R.; White, D.P. De novo ligand design: Understanding stereoselective olefin binding to η(5)-C5H5)Re(NO)(PPh3) (+) with molecular mechanics, semiempirical quantum mechanics, and density functional theory. Organometallics 2002, 21, 3913–3921. [Google Scholar] [CrossRef]
- Burello, E.; Rothenberg, G. Topological mapping of bidentate ligands: A fast approach for screening homogeneous catalysts. Adv. Synth. Catal. 2005, 347, 1969–1977. [Google Scholar] [CrossRef]
- Chavali, S.; Lin, B.; Miller, D.C.; Camarda, K.V. Environmentally-benign transition metal catalyst design using optimization techniques. Comp. Chem. Eng. 2004, 28, 605–611. [Google Scholar] [CrossRef]
- Lin, B.; Chavali, S.; Camarda, K.; Miller, D.C. Computer-aided molecular design using Tabu search. Comp. Chem. Eng. 2005, 29, 337–347. [Google Scholar] [CrossRef]
- Schmid, R. Effect of Solvent on Chemical Reactions and Reactivity. In Handbook of Solvents; Wypych, G., Ed.; 2001; ChemTech Publishing: Toronto. [Google Scholar]
- Drago, R.S.; Hirsch, M.S.; Ferris, D.C.; Chronister, C.W. A Unified Scale of Solvent Polarities for Specific and Nonspecific Interactions. J. Chem. Soc., Perkin Trans. 2 1994, 219–230. [Google Scholar]
- Mu, L.; Drago, R.S.; Richardson, D.E. A model based QSPR analysis of the unified non-specific solvent polarity scale. J. Chem. Soc. Perkin Trans. 2 1998, 159–167. [Google Scholar]
- Kamlet, M.J.; Abboud, J.L.M.; Taft, R.W.; Abraham, M.H. Linear Solvation Energy Relationships. 23. A Comprehensive Collection of the Solvatochromic Parameters, p*, a, and ß, and Some Methods for Simplifying the Generalized Solvatochromic Equation. J. Org. Chem. 1983, 48, 2877–2887. [Google Scholar] [CrossRef]
- Gutmann, V. Donor-Acceptor Approach to Molecular Interactions; Plenum Press: New York, 1978. [Google Scholar]
- Kamlet, M.J.; Taft, R.W. The Solvatochromic Comparison Method. 1. The ß-Scale of Solvent Hydrogen-Bond Acceptor (HBA) Basicities. J. Am. Chem. Soc. 1976, 98, 377–383. [Google Scholar] [CrossRef]
- Kamlet, M.J.; Abboud, J.L.M.; Taft, R.W. The Solvatochromic Comparison Method. 6. The p* Scale of Solvent Polarities. J. Am. Chem. Soc. 1977, 99, 6027–6038. [Google Scholar] [CrossRef]
- Famini, G.R.; Tran, D.; Wilson, L.Y. Application of TLSER molecular descriptors to rate constants. Abs. Pap. Am. Chem. Soc. 1999, 218, U505–U505. [Google Scholar]
- Famini, G.R.; Wilson, L.Y. Using theoretical descriptors in linear free energy relationships: characterizing several polarity, acid and basicity scales. J. Phys. Org. Chem. 1999, 12, 645–653. [Google Scholar] [CrossRef]
- Murray, J.S.; Politzer, P.; Famini, G.R. Theoretical alternatives to linear solvation energy relationships. J. Mol. Struct. - Theochem 1998, 454, 299–306. [Google Scholar] [CrossRef]
- Bonchev, D. Overall connectivities/topological complexities: A new powerful tool for QSPR/QSAR. J. Chem. Inf. Comp. Sci. 2000, 40, 934–941. [Google Scholar]
- Sinha, M.; Achenie, L.E.K.; Ostrovsky, G.M. Environmentally benign solvent design by global optimization. Comp. Chem. Eng. 1999, 23, 1381–1394. [Google Scholar] [CrossRef]
- Gani, R.; Jimenez-Gonzalez, C.; Constable, D.J.C. Method for selection of solvents for promotion of organic reactions. Comp. Chem. Eng. 2005, 29, 1661–1676. [Google Scholar] [CrossRef]
- For information on the Dragon software package see http://www.talete.mi.it/dragon_net.htm.
- Fernandez, A.L.; Reyes, C.; Prock, A.; Giering, W.P. The stereoelectronic parameters of phosphites. The quantitative analysis of ligand effects (QALE). J. Chem. Soc., Perkin Trans. 2 2000, 1033–1041. [Google Scholar]
- For a good general introduction to chemometric methods see http://www.chemometrics.se.
- van der Linden, J.B.; Ras, E.J.; Hooijschuur, S.M.; Klaus, G.M.; Luchters, N.T.; Dani, P.; Verspui, G.; Smith, A.A.; Damen, E.W.P.; McKay, B.; Hoogenraad, M. Asymmetric catalytic ketone hydrogenation: Relating substrate structure and product enantiomeric excess using QSPR. QSAR Comb. Sci. 2005, 24, 94–98. [Google Scholar] [CrossRef]
- Burello, E.; Marion, P.; Galland, J.C.; Chamard, A.; Rothenberg, G. Ligand Descriptor analysis in nickel-catalysed hydrocyanation: A combined experimental and theoretical study. Adv. Synth. Catal. 2005, 347, 803–810. [Google Scholar] [CrossRef]
- Carlson, R.; Gautun, H. Combinatorial libraries and the development of organic synthetic methods. PLS modelling to discriminate between successful and failed reaction systems. Chemom. Intell. lab. Syst. 2005, 78, 113–124. [Google Scholar] [CrossRef]
- Burello, E.; Farrusseng, D.; Rothenberg, G. Combinatorial explosion in homogeneous catalysis: Screening 60,000 cross-coupling reactions. Adv. Synth. Catal. 2004, 346, 1844–1853. [Google Scholar] [CrossRef]
- Cundari, T.R.; Deng, J.; Pop, H.F.; Sarbu, C. Structural analysis of transition metal beta-X substituent interactions. Toward the use of soft computing methods for catalyst modeling. J. Chem. Inf. Comp. Sci. 2000, 40, 1052–1061. [Google Scholar]
- Cundari, T.R.; Russo, M. Database mining using soft computing techniques. An integrated neural network-fuzzy logic-genetic algorithm approach. J. Chem. Inf. Comp. Sci. 2001, 41, 281–287. [Google Scholar]
- Cundari, T.R.; Sarbu, C.; Pop, H.F. Robust fuzzy principal component analysis (FPCA). A comparative study concerning interaction of carbon-hydrogen bonds with molybdenum-oxo bonds. J. Chem. Inf. Comp. Sci. 2002, 42, 1363–1369. [Google Scholar]
- Bocker, A.; Schneider, G.; Teekentrup, A. Status of HTS data mining approaches. QSAR Comb. Sci. 2004, 23, 207–213. [Google Scholar] [CrossRef]
- Walters, W.P.; Goldman, B.B. Feature selection in quantitative structure-activity relationships. Curr. Opin. Drug. Discov. Develop. 2005, 8, 329–333. [Google Scholar]
- Hageman, J.A.; Westerhuis, J.A.; Fruhauf, H.W.; Rothenberg, G. Design and assembly of virtual homogeneous catalyst libraries - Towards in silico catalyst optimisation. Adv. Synth. Catal. 2006, 348, 361–369. [Google Scholar] [CrossRef]
© 2006 by MDPI (http://www.mdpi.org). Reproduction is permitted for noncommercial purposes.
Share and Cite
MDPI and ACS Style
Burello, E.; Rothenberg, G. In Silico Design in Homogeneous Catalysis Using Descriptor Modelling. Int. J. Mol. Sci. 2006, 7, 375-404. https://doi.org/10.3390/i7090375
AMA Style
Burello E, Rothenberg G. In Silico Design in Homogeneous Catalysis Using Descriptor Modelling. International Journal of Molecular Sciences. 2006; 7(9):375-404. https://doi.org/10.3390/i7090375
Chicago/Turabian StyleBurello, Enrico, and Gadi Rothenberg. 2006. "In Silico Design in Homogeneous Catalysis Using Descriptor Modelling" International Journal of Molecular Sciences 7, no. 9: 375-404. https://doi.org/10.3390/i7090375