Article

Variation of the Nuclear, Subnuclear and Chromosomal Flavanol Deposition in Hemlock and Rye

1
Department for Plant Science, Center of Life Science Weihenstephan (WZW), Technical University Munich (TUM), D-85354 Freising, Germany
2
Physical Biochemistry, Research Department Biosciences, WZW, TU Munich (TUM), D-85354 Freising, Germany
*
Author to whom correspondence should be addressed.
Int. J. Mol. Sci. 2007, 8(7), 635-650; https://doi.org/10.3390/i8070635
Submission received: 27 April 2007 / Revised: 31 May 2007 / Accepted: 27 June 2007 / Published: 10 July 2007
(This article belongs to the Section Biochemistry)

Abstract

:
Nuclei of hemlock (Tsuga canadensis and Tsuga canadensis var. nana) were investigated for the presence of flavanols. Histochemical staining with p-dimethylaminocinnamaldehyde proved to be a highly valuable method yielding a bright blue flavanol coloration for nuclei. There was a significant variation in flavanol deposition (1) among nuclei, (2) at the subnuclear level and also (3) along the chromosomes during mitosis. The presence of flavanols in nucleoli could not be established probably because they were too small, measuring less than 1 μm in diameter. In contrast to Tsuga, the cells and nuclei of rootlets from rye (Secale cereale) were totally devoid of natural flavanols. However, externally added flavanols, catechin and epicatechin, were bound to the rye nuclei, while the rather large nucleoli failed to associate with the flavanols. The strong sink activity of nucleoplasm and chromosomes for flavanols in Tsuga and Secale indicates a process which is apparently widespread even in distantly related plant species. Variations in chromatin-associated flavanols could to some extent be induced by acetylation/deacetylation of histones, as confirmed in the present study by means of UVVIS spectroscopic titrations of histone sulphate and chemically acetylated histone sulphate.

1. Introduction

There is conclusive evidence based on different methods that flavanols as a subclass of the flavonoids are naturally located in nuclei of coniferous trees [14], whereby histone proteins forming nucleosome structures with DNA were found to associate with flavanols [4]. In this context, it is of interest that chalcone synthases, the starter enzymes for flavonoids, were found in nuclei of Arabidopsis[5]. Conceivably these authors speculated whether special flavonoids might be synthesized in the nucleus itself. Indeed, microscopic studies repeatedly revealed the presence of yellow fluorescing flavonoid-type compounds in nuclei of different plants [1,6].
Apart from chromatin histones it should not be overlooked that also a free pool of histones can be found in the nucleosol as described for rice embryos [7] or for mammalian cells [8]. Gunjan et al. [9] reported that a delay in DNA replication triggers the accumulation of excess histones which should be avoided by regulatory strategies. Speculatively, such freely moving histones might be scavenged by flavanols.
Freely moving monomeric catechins were found to form with aldehydes complex condensation products [10]. As the DMACA reagent also contains an aldehyde group the soluble vacuolar flavanols might likewise form such complexes which avoid any leaching from vacuoles or nuclei.
The objectives of this study were to map the flavanol staining in nuclei and chromosomes of hemlock (Tsuga canadensis and Tsuga nana) and rye (Secale cereale). These distantly related species were chosen for two reasons. Firstly, contrary to the hemlock forest tree the cereal species rye has no natural nuclear flavanols. This allowed to demonstrate that nevertheless externally applied flavanols were firmly bound to the rye nuclei. Secondly, the nucleoli of Tsuga were too small to allow a clear affirmation whether or not flavanols associate with this subnuclear unit. In contrast, rye nuclei possess very large nucleoli which allowed to check a possible binding with externally supplied flavanols.
As shown in some foregoing papers [1,2] the intensity of the nuclear flavanol staining is fairly variable. This might be due to intermolecular interactions among polyphenols with more than 12 – 16 phenolic hydroxyl groups and special proteins as described thoroughly by Haslam [11]. However, also monomeric flavanols associate at least with histone proteins [3,4], and from a biological point of view it would be of advantage for the permanently active and dynamic nucleus if such a bonding would be weak and reversible.
Alternatively, the strength of flavanol binding to chromatin might be influenced by histone modifications, as for example, histone acetylation is an essential factor in cell differentiation [12]. Using UV-VIS spectroscopic titration techniques it could be shown that acetylation of histone sulphate lowered the affinity for flavanols. Thus this finding is of importance in leading to a molecular understanding of the possible effects of flavanols on the epigenetic histone code.

2. Results and Discussion

2.1. Results

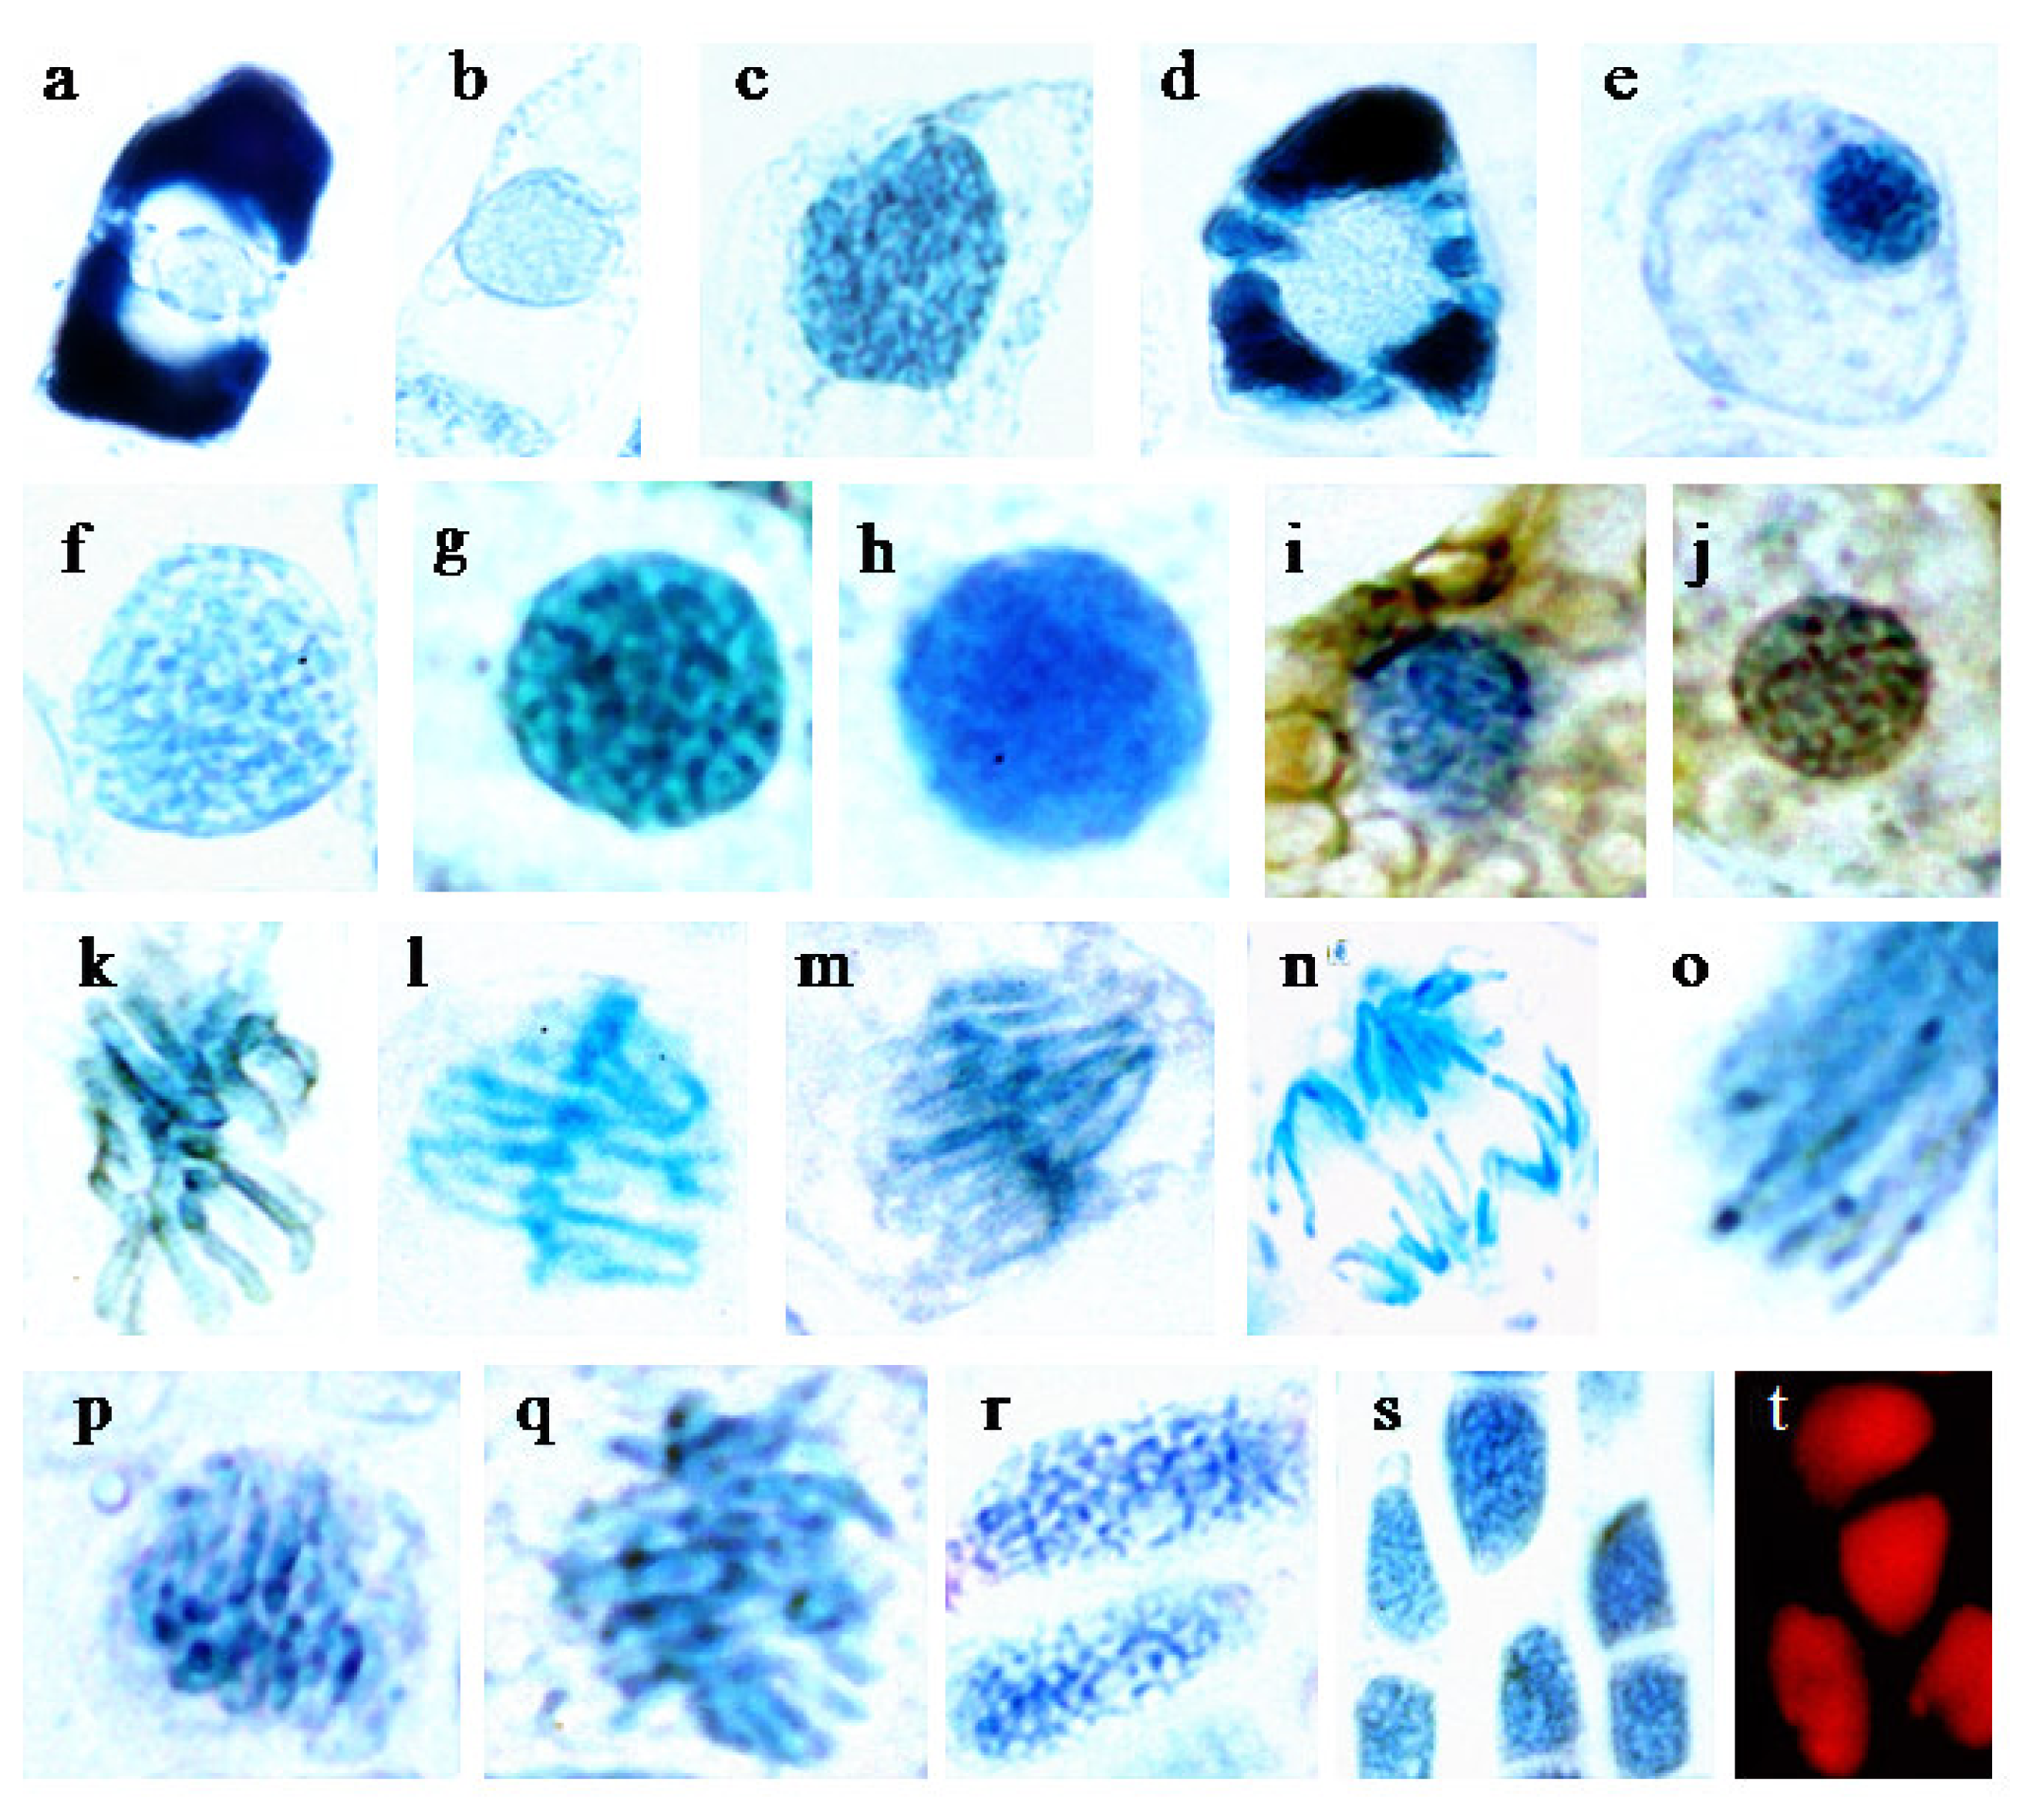
2.1.1. Tsuga (histology)

2.1.1.1 Nuclei with different degrees and modes of flavanol deposition

In seed wings there were sometimes strikingly low levels of nuclear flavanols even when high amounts of flavanols were stored in vacuoles (Figure 1a). In other cases both storage flavanols and nuclear flavanols were very low (Figure 1b). Both Figures show a faint flavanol border on the nuclear envelope. Hypothetically, this border could be due to ER which is known to be closely attached to the outer nuclear membrane.
An extremely high nuclear flavanol loading is best demonstrated in an example from needle mesophyll (Figure 1c). A further example is presented for T. nana indicating a heavy loading of flavanols into the vacuoles (Figure 1d). The nucleus located centrally in the cell was however rather pale reflecting a low flavanol concentration. By contrast, in a further nucleus of T. nana (Figure 1e) a maximal staining reaction and compact habit is presented, and there was even some cytoplasmic affinity for flavanols.
The interphase nuclei of Figures 1f-h (hemlock) were similar in size. However, the nucleoplasm stained very differently for flavanols. The regular staining pattern is characterized by a moderate blue, fine-granulated chromatin and a nearly colourless nucleosol (Figure 1f). Some nuclei were rather dense in flavanols (Figure 1g). They showed a liquid appearance and were interspersed with numerous dark blue patches. By contrast, in another example the compacted patches had disappeared completely (Figure 1h) and the extremely blue nucleoplasm revealed a highly diffuse watery pattern. This type of nuclear development, however, was only visible in rare instances.
A short cold period during the spring flush caused the nights to become frosty (−2 °C), and the dwarfed tree form Tsuga nana (height 40 cm) suffered from frost damage. The cytoplasm and its plastids turned brown. However, most of the nuclei were capable of withstanding these frost conditions and retained the blue flavanol colour (Figure 1i). In fact, only up to 8 % of a total of 200 nuclei scored showed that the blue “healthy” colour was replaced by a dark brown (Figure 1j).

2.1.1.2 Chromosomes

The following Figures 1k-r provide evidence that DMACA staining showed evenly distributed flavanols along the rod-shaped chromosomes. Sometimes the chromosomes contain randomly distributed dense blue blobs indicative of heterochromatin.
The metaphase preparation (Figure 1k) showed pronounced dense regions as well as faint blue arms of chromosomes. This contrasts with the rather uniformly and moderately blue stained long armed metaphase spread (Figure 1ℓ). Quite different in appearance was a metaphase spread (Figure 1m) with fairly blue rod-shaped chromosomes which were embedded in a diffuse blue haze of flavanols.
When the sister chromosomes break apart at the centromers, then hook-shaped anaphase chromosomes begin to move towards the poles (Figure 1n). Some of these chromosomes were surrounded by diffuse flavanols and others revealed well discernible small blue blobs at the telomeric physical ends. For example, such a telomer was much more apparent in the following magnified sector at the distal end of anaphase chromosomes (Figure 1o).
Two mitotic spreads, tentatively late prophase (Figure 1p) and metaphase (Figure 1q, polar view) were shown because of the numerous well demarcated and densely packed knobs of flavanols. Finally, in two stretched cells (Figure 1r) evenly distributed well defined dark blue knobs were deposited in the elongated nuclei.

2.1.1.3 Conifers with very small nucleoli

When using the DMACA reagent it was not possible to detect the Tsuga nucleoli. However, 4′,6-diamidino-2-phenylindole dihydrochloride (DAPI) staining revealed small nucleoli of only about 1 μm in diameter. For this reason hardly any nucleoli were recognizable within the large blue nuclear mass.
The size of nucleoli of several other coniferous species has been studied during the past 10 years and it was found with DAPI staining that they are only about 1 μm in diameter. The following genera and species were investigated: (1) Abies alba, A. cephalonica, A. homolepis, A. koreana, A. lasiocarpa, A. pinsapo. (2) Picea alba, P. mugus, P. omorika, P. orientalis. (3) Tsuga canadensis, T. nana, T. heterophylla.

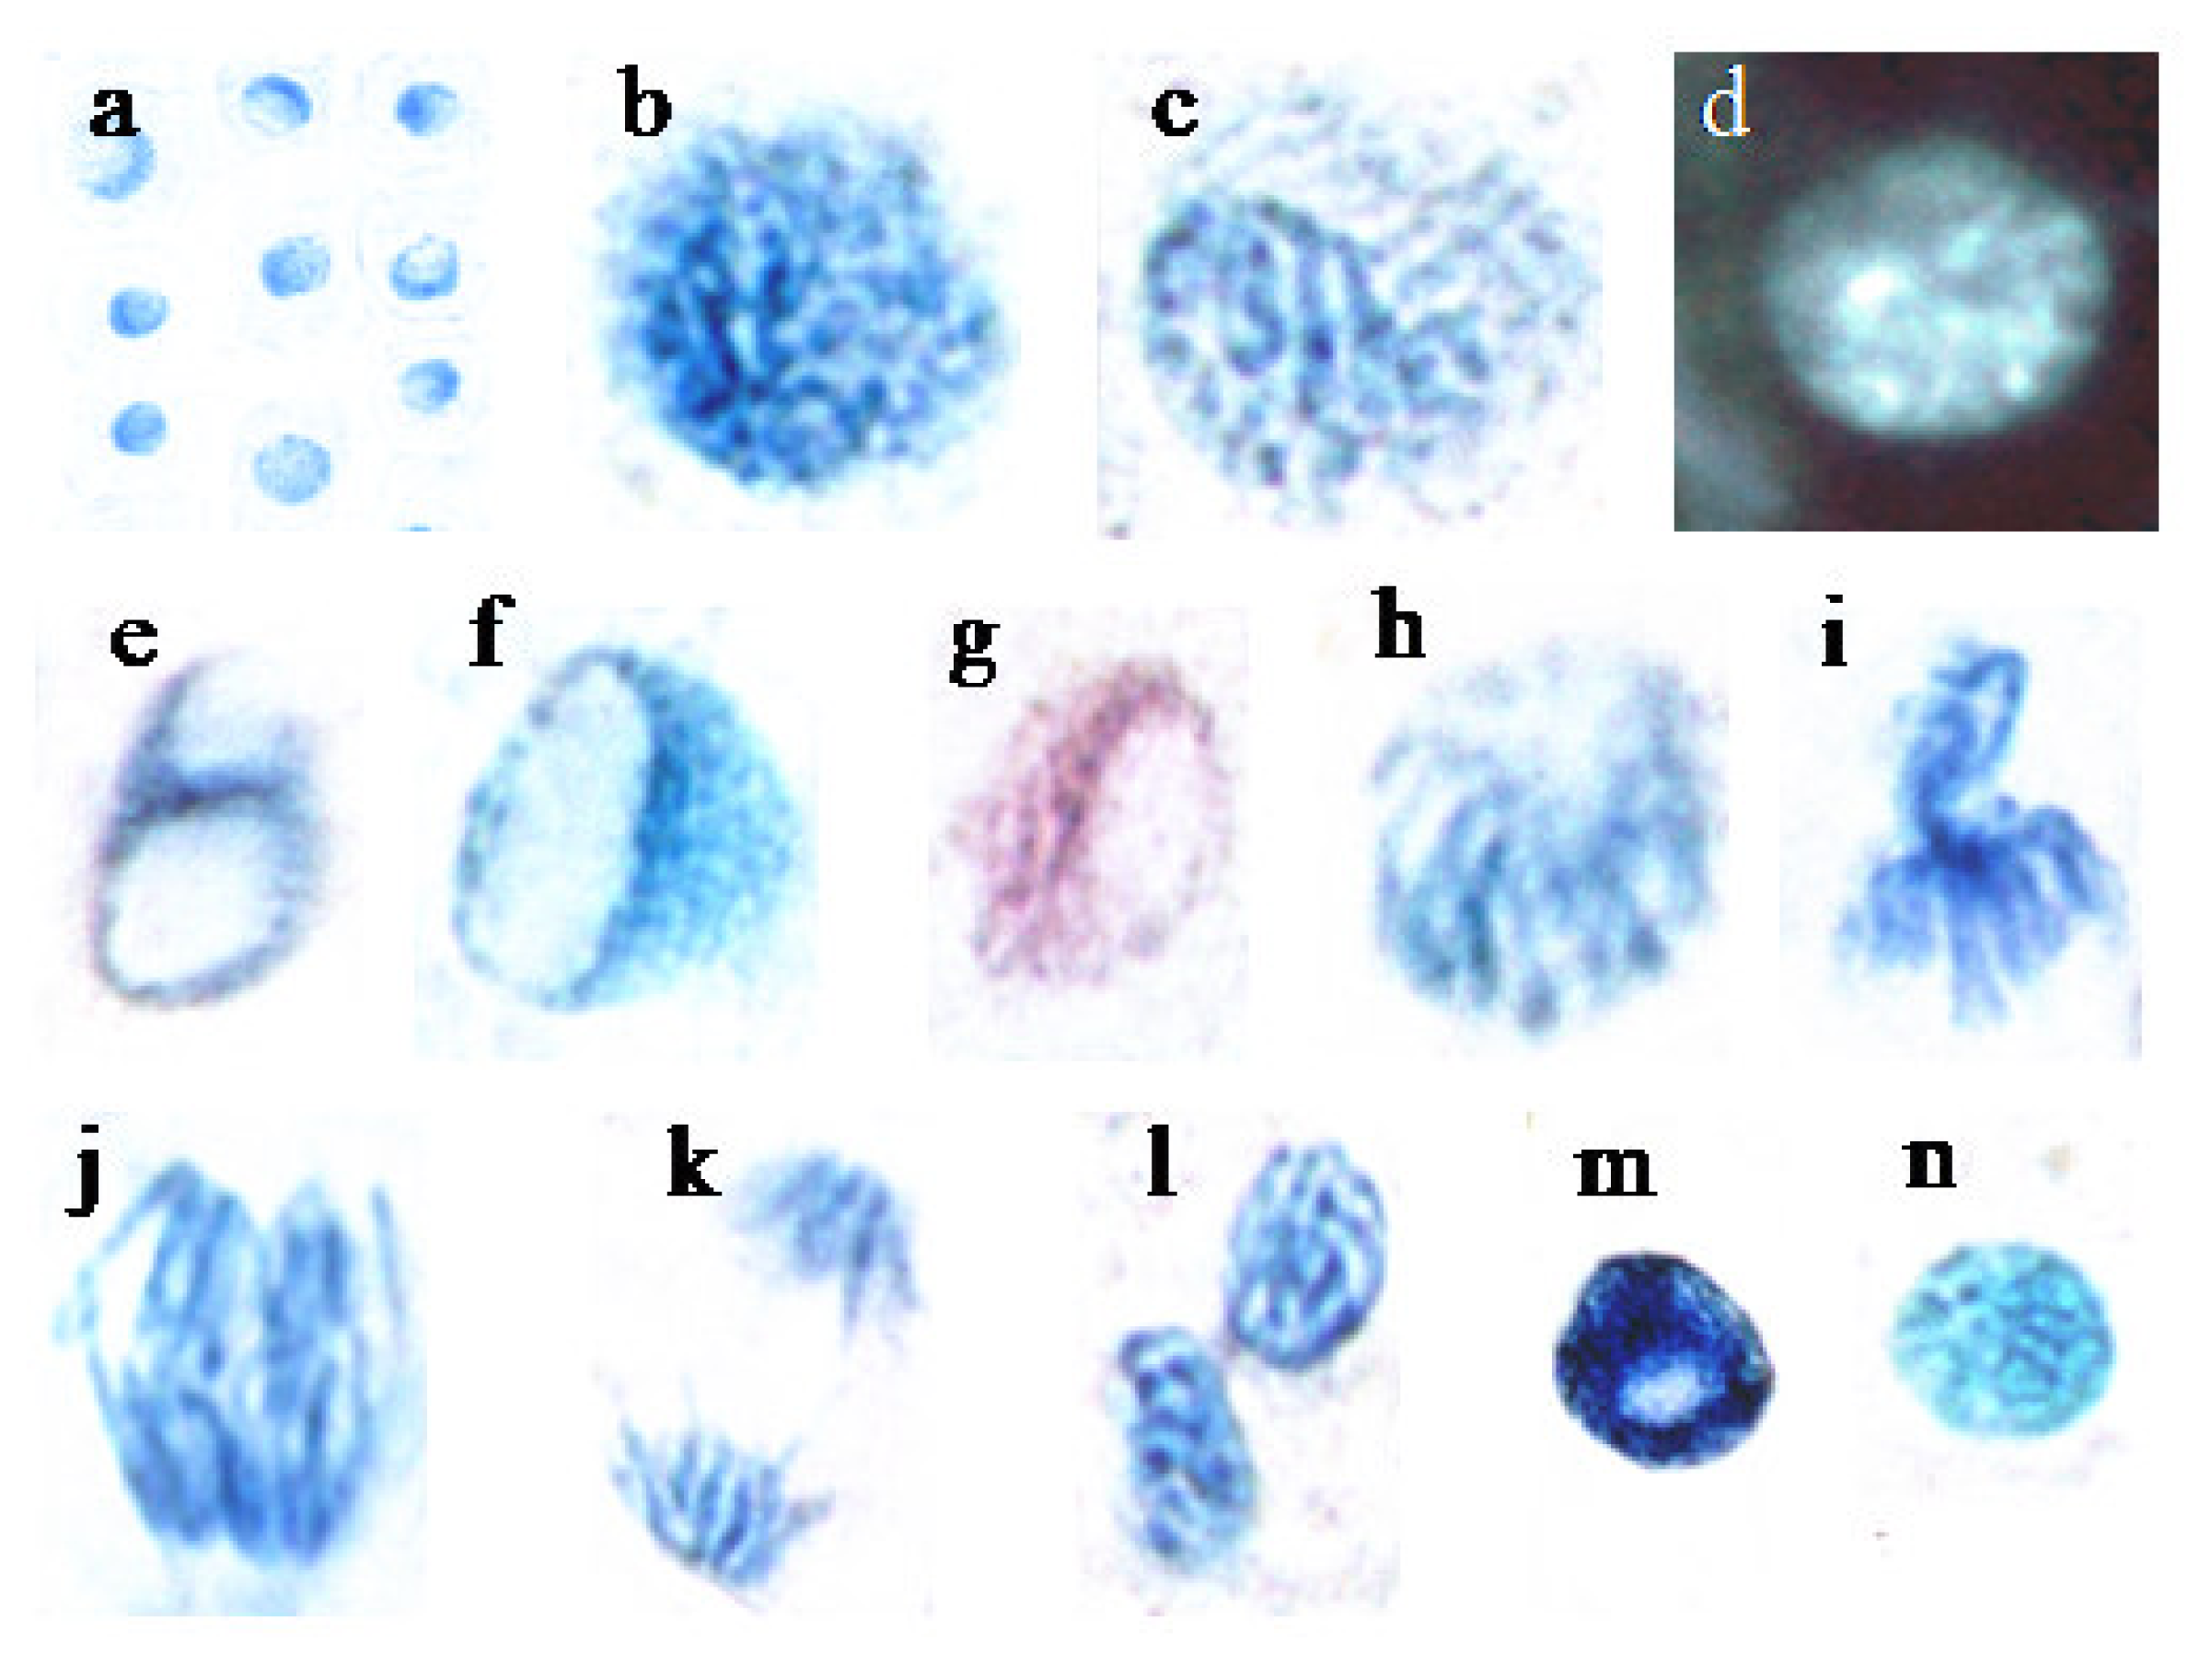
2.1.2. Secale cereale (histology)

2.1.2.1 Nuclei of rootlets at interphase

Interphase nuclei located in the meristematic zone of a rye rootlet showed that only the nuclei bind strongly with externally added flavanols (Figure 2a). Most nuclei of this cell group showed clearly visible nucleoli which is typical for a meristematic state. In the elongation zone, however, the nucleoli sometimes were not recognizable, as revealed by higher magnification (Figure 2b). It is evident that rye nuclei possess prominent blue coloured patches, e.g. heterochromatin, which tend to be dispersed over the entire nuclear area.
Sometimes the nuclei reach a maximal size of 12 μm in diameter and their structure typically is less compact with a smaller number of blue patches which are dispersed unevenly over the nuclear area (Figure 2c). For comparison, a nucleus is shown after DAPI staining with a few blobs of intense fluorescence indicating dense chromatin structures which are interspersed in a more loosely arranged chromatin (Figure 2d).

2.1.2.2 Mitotic nuclei

The highly meristematic root sector of rye developed the largest nucleoli so that the nucleoplasm was often pressed towards the nuclear periphery. In some instances two nucleoli were formed (Figure 2e), however, one large nucleolus is the normal feature (Figure 2f). Along the nucleolar border line facing the nucleoplasm there was often a characteristic file of small heterochromatic knobs (Figure 2f). For comparison, orcein staining also revealed those condensed knobs (Figure 2g).
At prophase some loosening of the chromatin structures took place (Figure 2h). By contrast, the more condensed metaphase chromosomes were altogether darker blue (Figure 2i). At mid metaphase typical hook-like structures of chromosomes were recognizable (Figure 2j). At late anaphase uneven blue regions of more or less dense chromatin could be observed (Figure 2k). The telophase spread showed some well-defined dark blobs of flavanols in each daughter nucleus (Figure 2l).

2.1.2.3 Elongation zone and root cap

The nuclei of the root elongation zone showed a marked reduction of nucleolar size. One example is shown in Figure 2m. The dark blue colour of the demonstrated nucleus is however not typical. Indeed, this rye nucleus demonstrates a maximal loading capacity for flavanols.
The enlarged, somewhat rectangular cells of the root cap were morphologically well discernable from those cells of the proximally located meristematic zone. The root cap nuclei were comparatively small (about 7 μm in diameter) and stained moderately blue, but nucleoli were principally not detectable (Figure 2n). Using DAPI staining, poorly defined rather small nucleoli appeared, which had a maximum diameter of about 1 μm (not shown). This indicates that the root cap nucleoli were too small to be detected using the DMACA reagent.

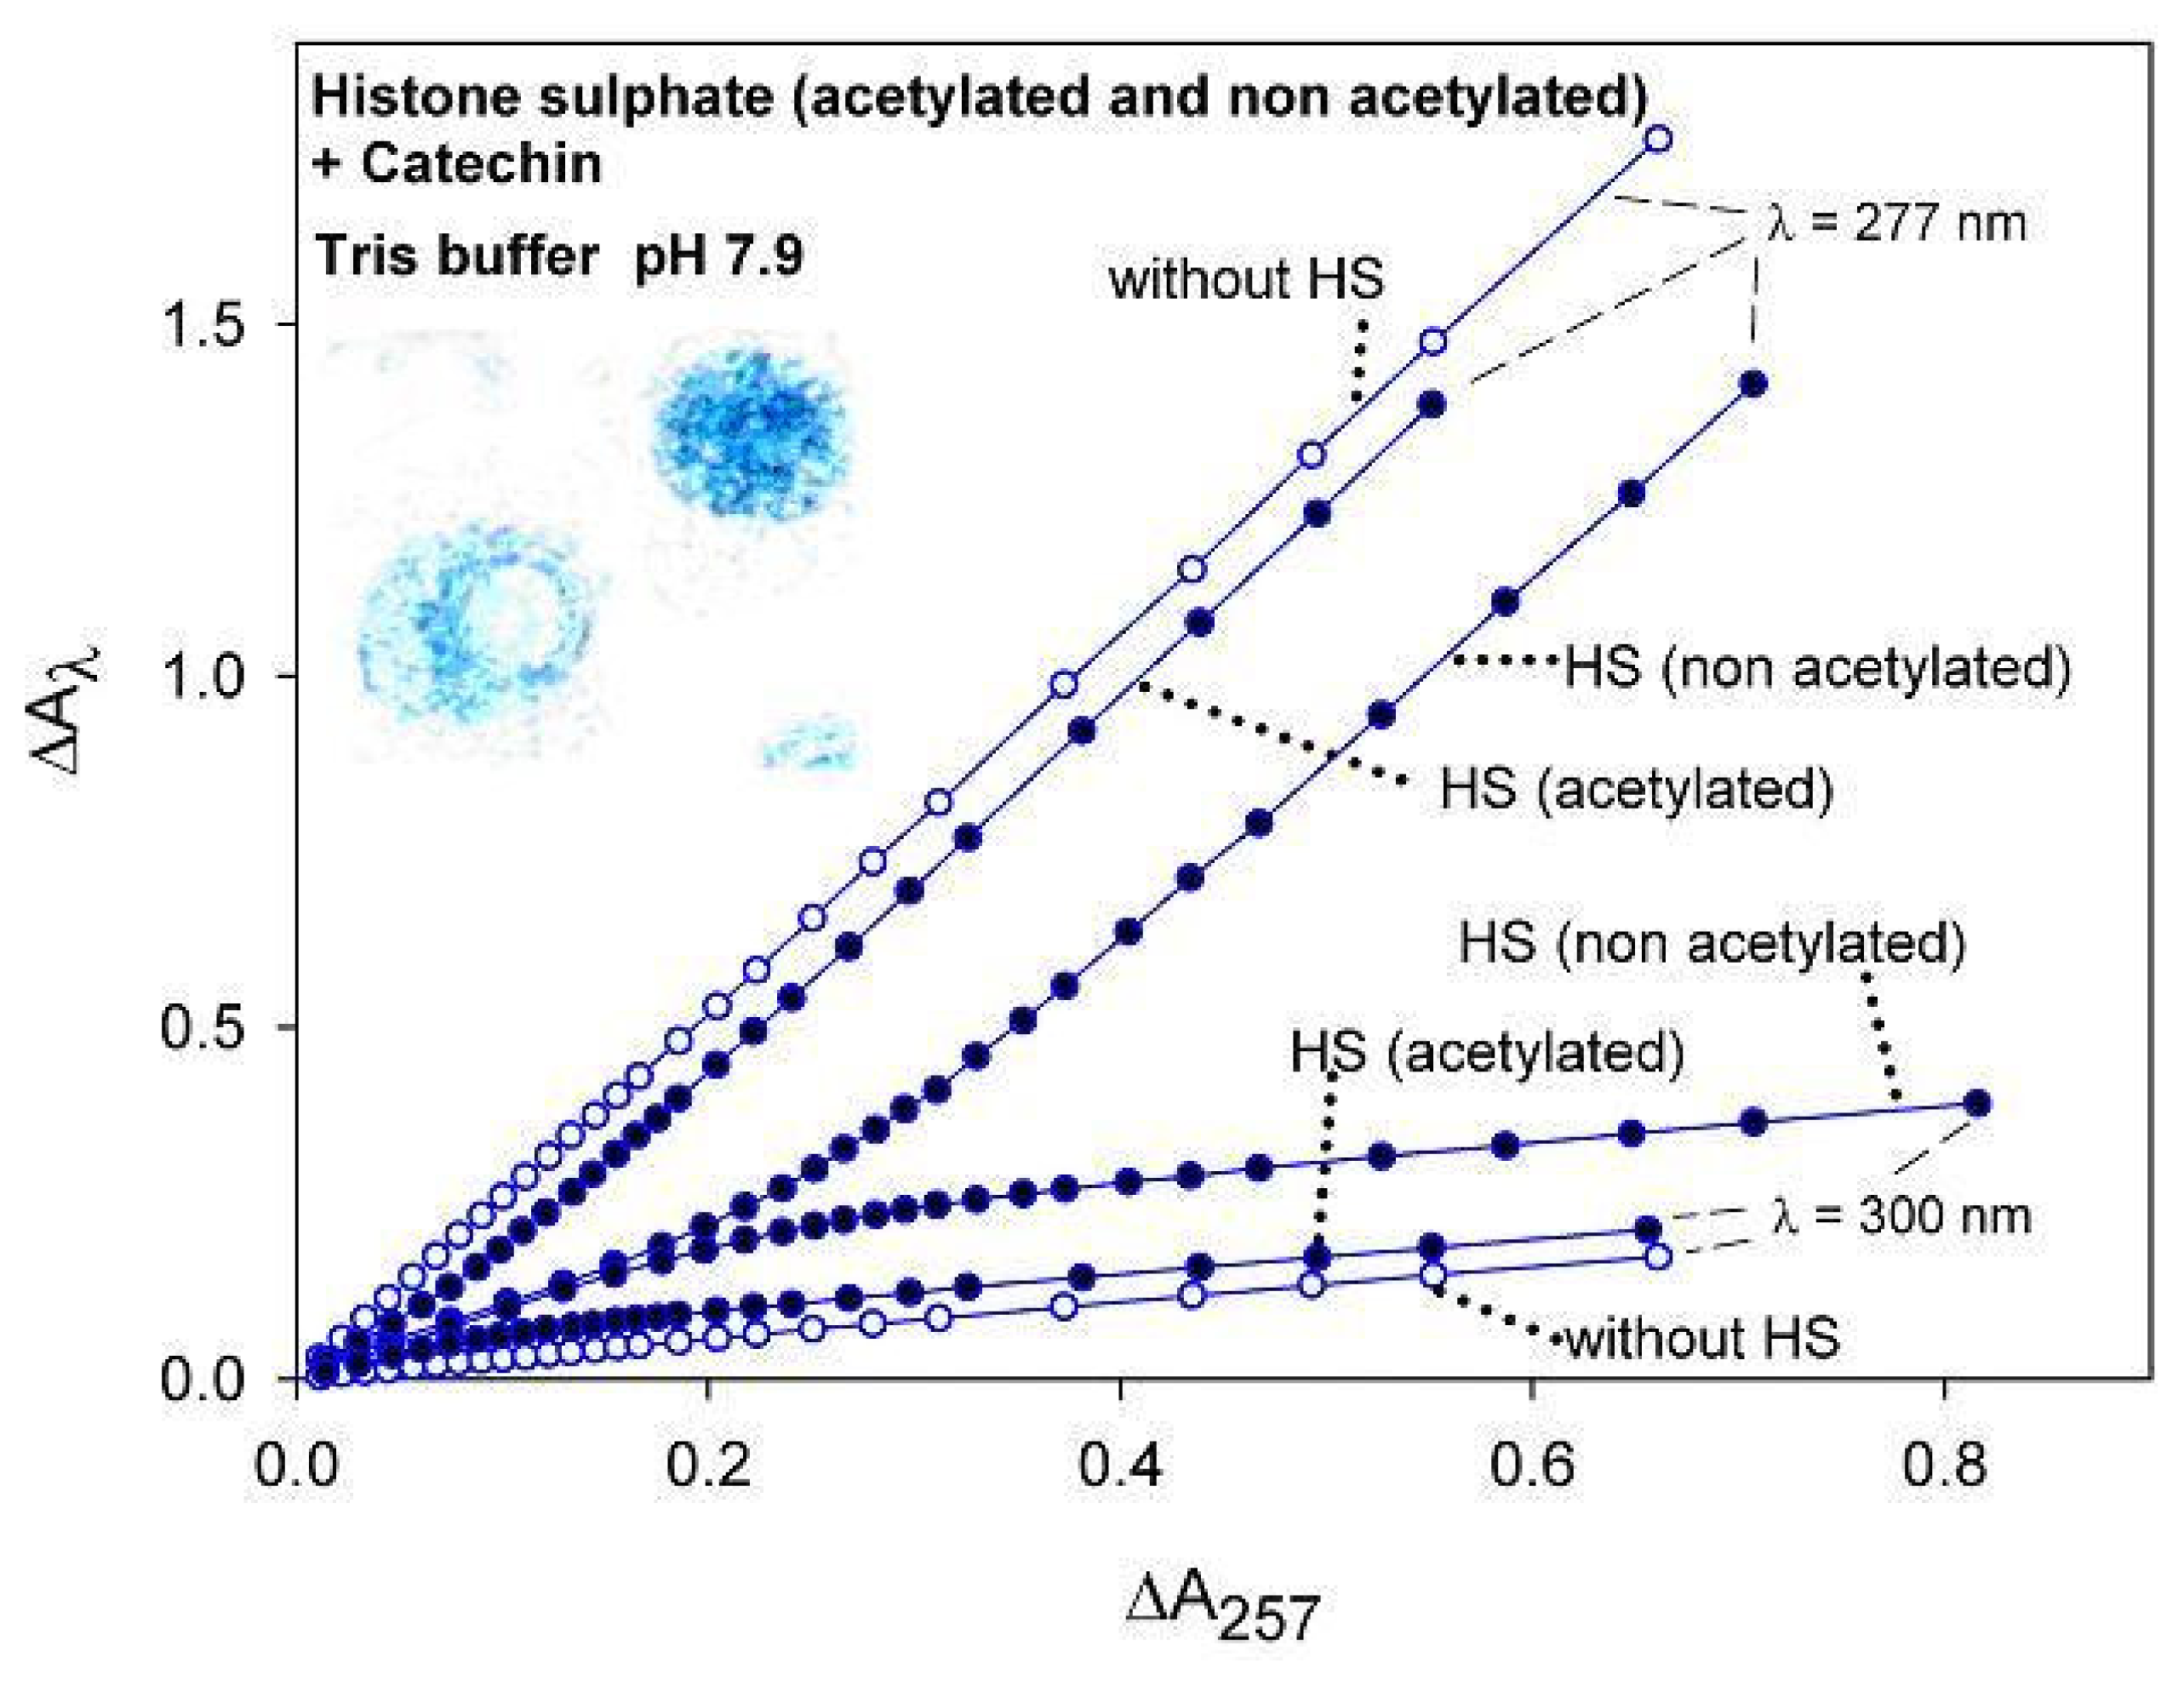
2.1.3. UV-VIS spectroscopic-kinetic analysis and titrations

Different histone preparations were found to show an altered association behaviour for flavanols as for example epigallocatechin gallate [13].
Biochemical modifications of histones (epigenetic code) may change the interactions between histones and flavonoids. Acetylation, phosphorylation and methylation reactions change the (local) charge of histone proteins. In order to test whether acetylation of histones may lead to a changed association behaviour histone sulphate and chemically acetylated histone sulphate were titrated with catechin in Tris buffer (0.1 M; pH 7.9; 20.0 °C).
Histone sulphate was acetylated with 1-acetylimidazole in Tris and imidazole buffer (both solutions 0.1 M, pH 8.0, room temperature, see Material and Methods). Since acetylimidazole is spontaneously hydrolyzed in buffer the half time t½ was determined in different buffers by means of formal integration according to [14], [3]
Δ A λ Δ t = A λ ( t + Δ t ) - A λ ( t ) Δ t = k 1 A λ - k 1 t t + Δ t A λ dt Δ t
with
Aλ(t) = absorbance at time t (correspondingly, Aλ(t + Δt) at time (t + Δt))
Aλ∞ = absorbance at time t → ∞ ((Aλ(t → ∞) = Aλ∞)
k1 = rate constant of first order
and the equation
t 1 / 2 = ln  2 k 1
The results are presented in Table 1. Since Tris and imidazole can themselves be acetylated by 1-acetylimidazole the ‘pure’ spontaneous hydrolysis reaction of acetylimidazole is accompanied by an aminolysis and imidazolysis reaction respectively being reactions of pseudo first order. The reactions in Tris and imidazole buffer can be formally evaluated according to a mechanism consisting of only one (linearly independent) reaction of (pseudo) first order. As expected, the degradation reaction in Tris buffer is the fastest and in imidazole the slowest (since here the reaction product is itself acetylimidazole). The results show that 1-acetylimidazole is an acceptable acetylation reagent for amino groups. Thus, histone proteins may be also acetylated with this reagent using sufficiently high acetylimidazole concentration and relatively long exposure time depending on reaction conditions (see Experimental Section, Acetylation of histone sulphate).
When catechin is added step by step to a ‘pure’ Tris buffer solution (titration procedure) straight lines are obtained in the corresponding absorbance difference (AD) diagram as shown in Figure 3 (see lines: ‘without HS’; the theory is treated in detail in [4] and [3]). Distinctly non-linear curves result when ‘untreated’ histone sulphate is titrated with catechin indicating association behaviour (see Figure 3, HS (non acetylated)). However, the corresponding curves of the acetylated histone sulphate do not at all coincide with those of the untreated histone sulphate. These curves run near to the straight lines of catechin in the case of ‘pure’ Tris buffer being an indication for weak association. Thus, a distinct change of catechin association behaviour between ‘non acetylated histone sulphate’ and chemically ‘acetylated histone sulphate’ can be observed. Basically, the same titration results are obtained with ‘acetylated histone sulphate’ which was produced in imidazole buffer and titrated with catechin in imidazole buffer. The results indicate that histone proteins and flavanols might actually alter their interdependency in dependence on epigenetic changes.
The behaviour of titration is changed when a histone mixture (H1, H2A, H2B, H3, H4) purchased from the company ‘Roche Diagnostics’ is used instead of histone sulphate (Sigma-Aldrich). In the AD diagram (see Figure 4), all three curves belonging to the same wavelength combination lie close together (titration of buffer with catechin in the absence of histones, catechin titration in the presence of ‘Roche-histone mixture’ and chemically acetylated ‘Roche-histone mixture’, respectively). Thus, no pronounced differences can be UV-VIS spectroscopically observed here being in contrast to Figure 3. The cause of this distinction might be that the proteins of histone sulphate and of the ‘Roche-histone mixture’ are differently epigenetically modified.

2.2. Discussion

An appealing characteristic of the Tsuga nuclei is the wide variation in histochemically visible flavanols. The question arises whether the different nuclear investment in flavanols is controlled by stringent physiological requirements or by any other factors? Phenylalaninammonium-lyase (PAL) is ‘a key’ starter enzyme of phenylpropanoid biosynthesis and is located along the ER [15]. It is under the control of several different factors. In addition, among the various biosynthetic routes to the different flavonoids the flavanol branch pathway can be regulated by a number of enzymes [16].
Some obvious changes in nuclear flavanols are presented in this paper, for example, a rather diffuse appearance of flavanols (Figure 1h). Was there an overexpressed action of proteinases [17] or an overproduction of freely moving histones [7]? S-phase nuclei need a very delicate balance between histone and DNA synthesis, and too much free histones have deleterious consequences for the nucleosomes [9]. Frost injury was a striking example of nuclear damage as manifested by oxidative browning in 8 % of the nuclei from T. nana whereas 92 % showed no damage and retained their normal blue colour (Figure 1i,j).
Distinct chromocenters being heterochromatic nucleolus organizer regions (NOR) are described to be clustered along the border line of nucleoli [18]. This phenomenon was observed in rootlets of rye along the prominent nucleoli of interphase nuclei (Figure 2e,f). Also the polar distribution of heterochromatin within hemlock nuclei (Figure 1p) and rye nuclei (Figure 2b,c) was described previously as a typical feature for Arabidopsis[19].
Mitotic spreads of the hemlock species (Figure 1k,l,m,n,o) showed dark blue blobs typical of condensed chromatins. Centromeric and telomeric locations were also described for rye [20], [21]. These higher-order heterochromatin aggregations have an effect in triggering a distinct spatial nuclear organization [18]. However, constitutive bands of telomeric heterochromatin, as evidenced by Giemsa staining [20] could not be detected in summer rye when using the flavanol staining method. One can infer that some rye species lack telomeric heterochromatin [22] and that there is a large variation in this respect even within the same plant [23]. Dynamic unfolding and opening of tightly packed 30 nm telomeric chromatin fibers has been reported [24].
To return to the fundamental problem, the nucleus as an impetuous sink for flavanols is best exemplified in cells of seed wings of Tsuga (Figure 1s,t). It seems as if these cells have only one goal: Supplying the nucleus with flavanols. But even in plant tissues lacking flavanols such as roots of rye, it is obvious that the nuclei can easily take up external flavanols. Histochemistry proves to be a useful and straight forward way to establish firmly the flavanol attachment to chromatin. Most importantly, the flavanol molecules either of endogenous origin or externally applied pass along hundreds of different proteins located in the cell wall and cytoplasm without being bound. The same is true for the nucleolus with its numerous proteins (for example 350 proteins, [25]). Condensed chromatin is located within nucleoli as revealed by electron microscopy [26]. However, these particles were too small to be detected by means of light microscopy.
The question which has yet to be addressed pertains to the molecular site of flavanol association. Catechin, epicatechin, epigallocatechin gallate and epicatechin gallate can interact with components of histone sulphate [4], [27], [28]. However, when histone sulphate is replaced by a histone mixture of Roche Diagnostics the titration behaviour may change as shown for catechin in Figures 3 and 4. These conflicting results can have quite different reasons. For example, the histone protein composition can be changed quantitatively and, thus, different histone aggregates may be formed in solutions to which flavanols are associated [4]. The conformation of the histone proteins may be altered during the purification steps, too. Furthermore, possible impurities of histone proteins should also not be excluded. However independent of the ‘Roche-histone mixture’ results, the bare facts are that the intact histone systems within the intact rye nuclei take over catechin and epicatechin.
The titration results of Figure 3 and Figure 4 support the assumption that an epigenetic change of histone components may have a strong effect on the association behaviour of flavanols and histones. For example, when the histone proteins are acetylated (or as generally known phosphorylated or methylated) the locally changed charge may lead to an altered association behaviour. Thus, the components of histone sulphate and those of the ‘Roche-histone mixture’ may have a different epigenetic pattern leading to altered interactions with flavanols (catechin).
However, in contrast to catechin, epigallocatechin gallate associates to proteins of histone sulphate and of the ‘Roche-histone mixture’ in Tris buffer (pH 8.0; unpublished).
Meristematic cells of shoot tips and needles from Taxus baccata (sampled during spring growth) produce no vacuoles which are loaded with flavanols, however, their nuclei seem to be the only organelles to stain blue with the DMACA reagent ([2]; compare also the insert of Figure 3). The main flavanol produced in the shoot tips of Taxus baccata is catechin [2]. The inserted photo in Figure 3 shows two neighbouring cells of Taxus baccata. The nucleus of one cell is intensely stained blue with the DMACA reagent whereas the other cell is only faintly stained blue with a big colourless nucleolus. Nucleoli of Helianthus tuberosus and Daucus carota were enlarged at a strong cell activity as compared with controls [29]. It is assumed that acetylated histones lead to stronger genetic activities [30]. The titration results of Figure 3 (AD-plot) would be in accordance with this assumption.

2.3. Conclusions

Flavanols reacting with the DMACA reagent were generally found to be bound in different intensities in the nuclei of hemlock trees. However, and most important, no natural flavanols were found in the nuclei of rye rootlets, but when added externally they bind strongly to the intact chromatin system.
Untreated histone sulphate and chemically acetylated histone sulphate showed different interactions with catechin. These results provide a first glimpse that the epigenetic code of histones might influence the association behaviour of chromatin to flavonoids.

3. Experimental Section

3.1. Plant-Material

Trees of Tsuga canadensis (hemlock) and the dwarfed Tsuga canadensis var. nana as well as Taxus baccata are grown in the Botanical Garden Weihenstephan associated to the Technical University Munich. Samples were collected over ten years for hemlock and over 2 years for the dwarfed type (T. nana). The hemlock trees were about 6 to 9 m in height, and those of the dwarfed type only 40 cm. The data obtained from the large hemlock trees were based on roughly 3,000 interphase nuclei or mitotic spreads. Sampling of needles from the dwarfed trees was repeated monthly from May to October. In early May 2005 there was a short frost during two nights (−2 °C). Three days later the young needles were investigated on possible injuries.
The presence of nucleoli was evaluated from a large number of species (presented in “Results”) of the genera Abies, Picea and Tsuga. The samples were taken through the season of several years and at different developmental stages of the needles.
Seeds of summer rye (Secale cereale) were germinated in Petri dishes. A total of 60 root tips sampled from three varieties of summer rye were studied for the nuclear affinity for (+)-catechin and (−)-epicatechin. Cells from the root cap, mitotic zone and elongation zone were investigated.

3.2. Histology

Principally, the samples were not fixed and embedded. The fresh tissues were instantly used for the staining procedures. The needles were sectioned by hand (razor blade) in the paradermal plane. This allowed to scrape out the mesophyll cells rapidly (less than 2 min) with a style without any injury. The cells were placed in a drop of water on a microscope slide.
The seed wings of the female cones normally develop flavanol storing vacuoles. However, sometimes larger groups of rapid proliferating cells lacked these vacuoles and the nuclei occupied generally nearly the entire cell volume. Both tissue types were collected and stained for flavanols or DNA.
Flavanols were stained with DMACA (p-dimethylaminocinnamaldehyde) dissolved in 1.5 N H2SO4. (Ethanol, usually a part of the reagent, was omitted) [31], [32]. Staining was performed for 15 min. The tissues turned brown during staining but achieved a bright blue colour when a drop of water was added. Excess of the reagent was removed when the cover slide was pressed on the microscope slide. DAPI (4′,6-diamidino-2-phenylindole dihydrochloride, Serva) staining was used for DNA localization under UV light [33]. Propidium iodide (Sigma) was used for DNA staining [34]. Orcein reagent (Sigma) [35] was used for nuclei yielding a reddish colour.
In the case of rye the fresh root tips were squashed on a cover slide. Then the tissues were imbibed for 2 h in epicatechin or catechin. Both monomeric flavanols were added at a concentration of 150 ppm in water. Staining for flavanols was performed for 15 min. The coloured tissues of Taxus and Secale were examined with a Zeiss microscope Axiom using Agfa colour film (CT precisa).

3.3. Chemicals (for Titration, Kinetics and Acetylation)

1-Acetylimidazole was purchased from Fluka (product no: 01194, Sigma-Aldrich Chemie, Steinheim, Germany), (+)-catechin from Carl Roth (product no: 6200, Karlsruhe, Germany), potassium dihydrogen phosphate and dipotassium hydrogen phosphate (trihydrate) from Merck (Darmstadt, Germany), imidazole from AppliChem GmbH (product no: A3635,0050, Darmstadt, Germany) and Tris (Tris-(hydroxymethyl)amino methane) from BIOMOL (Hamburg, Germany). Histone sulphate (from calf thymus, Fluka, article no: 53420) was a kind gift from Sigma-Aldrich Chemie. ‘Rochehistone mixture’ is an article of Roche Diagnostics (product no. 223 565, Mannheim, Germany).

3.4. Buffers and Stock solutions (for Titration, Kinetics and Acetylation)

Buffers and stock solutions were prepared as described previously [4]. Tris buffer (0.1 M) solution and imidazole buffer (0.1 M) solution were adjusted to pH with HCl and a pH meter (WTW, inoLab pH Level 1). Phospate buffer was produced by mixing a 0.1 M K2HPO4 solution with a 0.1 M KH2PO4 solution. Immediately before use, 1-acetylimidazole solution was prepared in acetonitrile (1 M, 0.25 M and 10 mM, respectively). For titration, catechin was dissolved in ethanol in a concentration of 4.0 mg/ml.

3.5. Acetylation of histones

10 mg of histone sulphate from calf thymus were suspended in 5 ml of Tris buffer (pH 8.0) with 3.3 % ethanol. After stirring for about 15 min, the suspension was centrifuged (10 min at about 14,000 g) and 4 ml of the clear supernatant were pooled. Acetylation reaction was done overnight with 8 μl fresh 1-acetylimidazole stock solution (1 M in acetonitrile) at room temperature without further purification. For control the same procedure was carried out with 10 mg of histone sulphate and 8 μl acetonitrile (without 1-acetylimidazole). Instead of Tris buffer, imidazole buffer (0.1 M; pH 8.0) was also used (here 8 μl of 0.25 M 1-acetylimidazole in acetonitrile were added to 4 ml of the histone sulphate supernatant).
The same acetylation procedure as mentioned above was performed with the ‘Roche-histone mixture’ in Tris buffer on the basis of 3.3 % ethanol. The acetylimidazole concentration and the amount of histones (in mg/ml) were identical to the acetylation procedure of histone sulphate (however, the final reaction volumes were only a quarter). The acetylated Roche-histone solution was diluted to half in Tris buffer (with 3.3 % ethanol) for titration.

3.6. UV-VIS spectroscopic titrations

2.5 ml of the acetylated histone sulphate respectively nonacetylated histone sulphate supernatant were placed in a common quartz cuvette (pathlength 1 cm) of a diode array spectrometer (Hewlett Packard, Agilent Technologies, Series 8453). The temperature was kept constant at 20.0 °C with a HP 89090A Peltier Temperature Control Accessory. The first spectrum was obtained from the corresponding protein buffer solution without catechin. Then, portions of a catechin stock solution were added to the cuvette in 15 × 1 μl, 3 × 2 μl, 3 × 4 μl, 4 × 8 μl and 1 × 16 μl steps. For all titration steps, spectra were registered in 3-min intervals in order to maintain constant temperature. Titrations were also carried out in the absence of histone sulphate. Then, catechin was added to the pure buffer solution (with 3.3 % ethanol) in the same steps as declared.
The titration procedure for acetylated Roche-histones was the same as described for acetylated histone sulphate. However, a fifth of liquid volume and a special cuvette (pathlength 1 cm) for smaller volumes was used.
The absorbances measured were corrected by means of Aλ(corrected) = Aλ(measured) · (V0 + V)/V0 (V0 = original cuvette volume, V = total volume added by titration). Absorbance difference (AD) diagrams (one of the Mauser diagrams) were constructed with the corrected spectroscopic data [3,4,36]. The absorbance differences at various wavelengths (ΔAλi = Aλi (nth titration step) − Aλi (without catechin)) belonging to each titration step (n) were plotted against each other to establish AD diagrams (ΔAλ1 vs. ΔAλ2) as described in [4].

3.7. UV-VIS spectroscopic-kinetic analysis: reactions of 1-acetylimidazole in different buffers

100 μl 1-acetylimidazole solution (10 mM in acetonitrile) were given into a common quartz cuvette (pathlength 1 cm) filled with 3 ml buffer of pH 8.0 (Tris, imidazole or phosphate) and the UV-VIS spectroscopic-kinetic measurement was started. The reactions were observed at 20.0 °C. The absorbances of the wavelengths 240, 245, 250 and 260 nm were used for the kinetic evaluation on the basis of formal integration (see eqns. (1) and (2) in Results).
Figure 1. Cells from Tsuga canadensis, except d, e, i which are from Tsuga var. nana; (n, diameter of the nucleus in μm); a) Cell from a seed wing showing a large vacuole filled with abundant flavanols. The nucleus stained rather pale for flavanols (n, 6 μm); b) Cell from a seed wing with a low flavanol content in the nucleus. There is a distinct line of flavanols surrounding the nucleus (n, 7 μm); c) Mesophyll cell from a needle showing a fairly well stained nucleus with some small blobs of heterochromatin (n, 9 μm); d) Mesophyll cell (T. nana) with large amounts of flavanols in vacuoles and a rather pale nucleus (n, 8 μm); e) Mesophyll cell (T. nana) with some diffuse cytoplasmic flavanols, however, the nucleus contains abundant flavanols (n, 6 μm); f) Nucleus from mesophyll with homogenously distributed flavanols. Darker blue knobs are prominent at the lower pole of the nucleus (n, 9 μm); g) Dark blue cell of a sprouting shoot with patches of abundant heterochromatin embedded in blue nucleosol (n, 10 μm); h) Nucleus from a sprouting shoot being homogenously dark blue (n, 9 μm); i) Mesophyll cell (T. nana) showing frost-damaged, brown plastids and a non-damaged blue nucleus (n, 8 μm); j) Mesophyll cell (T. nana) with a frost-damaged brown nucleus and degraded plastids (n, 8 μm); k) Metaphase from mesophyll with differently blue chromosome regions; l) Late metaphase from mesophyll showing a homogenous, moderate affinity for flavanols; m) Late metaphase from mesophyll showing a different staining of chromosome regions and diffuse free flavanols; n) Segregation of hook-like sister chromosomes during anaphase with typical centromeric cohesion; o) Magnification of anaphase chromosomes with several blobs of heterochromatin; p) Pronounced occurrence of dark blue knobs (tentative prophase); q) Chromosomes enriched with chromocentric blobs; r) Elongated cells and stretched nuclei showing a uniform and dense distribution of numerous dark chromatin blobs; s) Sector of a seed wing with large nuclei showing a uniform distribution dark chromatin; t) Sector of the same seed wing showing the narrow distance between the nuclei (stained a red colour for DNA with propidium iodide).
Ijms 08 00635f1
Figure 2. Nuclei of root tips of Secale cereale (n, diameter of the nucleus in μm); a) Group of 9 expanding cells located immediately proximal to the meristem zone clearly shows an exclusive flavanol staining of nuclei (n, 6 – 10 μm); b) Nucleus with dense distribution of dark heterochromatin blobs (n, 10 μm); c) Enlarged nucleus with loosened chromatin blobs (n, 12 μm); d) Nucleus showing a bright fluorescence with DAPI. Few heterochromatin blobs fluoresced with higher intensity (n, 6 μm); e) Nucleus with two large nucleoli (n, 11 μm large diameter); f) Nucleus with one large nucleolus. A number of dark blue but small blobs are clustered along the border line of nucleolus and nucleoplasm (n, 12 μm); g) Similar nucleus stained with orcein (n, 10 μm); h) Early prophase with few condensed flavanol regions (n, 13 μm); i) Metaphase spread with dense flavanol staining at different regions; j) Long armed, rod-like anaphase chromosomes with different flavanol-dense regions; k) Late anaphase with some variation in flavanol staining along the rod-like chromosomes; l) Telophase with dark blue blobs of heterochromatin; m) Nucleus of the elongating root zone. The nucleus is extremely loaded with flavanols and shows a small nucleolus (n, 8 μm); n) Nucleus of the root cap (n, 7 μm).
Ijms 08 00635f2
Figure 3. AD-diagram for the titration of acetylated histone sulphate (acetylation reaction was carried out in Tris buffer) and non acetylated histone sulphate with catechin in Tris buffer (“HS (acetylated)”; “HS (non acetylated)”; 20.0 °C). When catechin is added successively to Tris buffer straight lines are obtained (“without HS”); Insert (Taxus baccata). Left cell: loosely arranged chromatin and a large nucleolus as hypothetic indications of acetylated histones. Right cell: dark blue nucleus with condensed chromatin.
Ijms 08 00635f3
Figure 4. ‘Roche-histone mixture’: AD-diagram for the titration of chemically acetylated histones (acetylation reaction was carried out in Tris buffer) and non acetylated histones with catechin in Tris buffer (20.0 °C). When catechin is added successively to Tris buffer nearly straight lines are obtained, too (“without histones”; empty symbols).
Ijms 08 00635f4
Table 1. Spontaneous hydrolysis of 1-acetylimidazole in different buffers (all buffers 0.1 M, pH 8.0; 20.0 °C). The half time t ½ was determined by means of equation 2 on the basis of equation 1.
Half timeTrisimidazolephosphate
t ½ [min]3.737.620.8

References and Notes

  1. Polster, J.; Dithmar, H.; Burgemeister, R; Friedemann, G.; Feucht, W. Flavonoids in plant nuclei: detection by laser microdissection and pressure catapulting (LMPC), in vivo staining, UV-visible spectroscopic titration. Physiologia Plantarum 2006, 128, 163–174. [Google Scholar]
  2. Feucht, W.; Treutter, D.; Polster, J. Flavanol binding of nuclei from tree species. Plant Cell Reports 2004, 22, 430–436. [Google Scholar]
  3. Polster, J. Chromatography, Titration, and Reaction Kinetics: UV-VIS Spectroscopic Evaluation on the Basis of the Mauser Diagrams; Research Signpost: Trivandrum, Kerala, India, 2006. [Google Scholar]
  4. Polster, J.; Dithmar, H.; Feucht, W. Are histones the targets for flavan-3-ols (catechins) in nuclei? Biol. Chem. 2003, 384, 997–1006. [Google Scholar]
  5. Saslowski, D.; Winkel-Shirley, B. Localization of flavonoid enzymes in Arabidopsis roots. Plant J 2001, 27, 37–48. [Google Scholar]
  6. Hutzler, P.; Fischbach, R.; Heller, W.; Jungblut, T.P.; Reuber, S.; Schmitz, R.; Veit, M.; Weissenböck, G.; Schnitzler, J.P. Tissue localization of phenolic compounds in plants by confocal laser scanning microscopy. J. Exp. Bot 1998, 49, 953–965. [Google Scholar]
  7. Ahmed, C.M.; Padayatty, J.D. Presence and function of a free pool of histones in the nucleosol of rice embryos. Indian J. Biochem. Biophys 1982, 19, 155–159. [Google Scholar]
  8. Covelo, G.; Sarandeses, C.S.; Díaz-Jullien, C.; Freire, M. Prothymosin α interacts with free core histones in the nucleus of dividing cells. Journal of Biochemistry 2006, 140(5), 627–637. [Google Scholar]
  9. Gunjan, A.; Paik, J.; Verreault, A. Regulation of histone synthesis and nucleosome assembly. Biochimie 2005, 87, 625–635. [Google Scholar]
  10. Tanaka, T.; Kusano, R.; Kondou, K.; Kawashiri, M.; Kouno, I. Reaction of Flavan-3-ol-aldehyde condensation products with amino acids and thiol compounds. Third Tannin Conference, Bend, Oregon (USA), Juli 20–25; 1998. [Google Scholar]
  11. Haslam, E. Practical polyphenolics. From structure to molecular recognition and physiological action; Cambridge; University Press, 1998. [Google Scholar]
  12. Loidl, P. A plant dialect of the histone language. Trends in Plant Science 2004, 9(2), 84–90. [Google Scholar]
  13. Berger, S.; Dithmar, H.; Polster, J.; Feucht, W. Are there controlled interactions between histones and epigallocatechin gallate. Free Radical Research 2003, 37 Supplement 2, 29–30. [Google Scholar]
  14. Mauser, H. Formale Kinetik; Bertelsmann Universitätsverlag: Düsseldorf, 1974. [Google Scholar]
  15. Hrazdina, G.; Jensen, R.A. Spatial organization of enzymes in plant metabolic pathways. Ann. Rev. Plant Physiol. Plant Mol. Biol 1992, 43, 241–267. [Google Scholar]
  16. Pfeiffer, J.; Kühnel, C.; Brandt, J.; Duy, D.; Punyasiri, P.A.N.; Forkmann, G.; Fischer, T.C. Biosynthesis of flavan-3-ols by leucoanthocyanidin 4-reductases and anthocyanidin reductases in leaves of grape (Vitis vinifera L.) apple (Malus x domestica Borkh.) and other crops. Plant Physiol. and Biochemistry 2006, 44, 323–334. [Google Scholar]
  17. Margueron, R.; Trojer, P.; Reinberg, D. The key to development: interpreting the histone code? Current Opinion in Genetics and Development 2005, 15, 163–176. [Google Scholar]
  18. Probst, A.V.; Fransz, P.F.; Pazkowski, J.; Mittelsten-Scheid, O. Two means of transcriptional reactivation with heterochromatin. Plant J 2003, 33, 743–749. [Google Scholar]
  19. Fuchs, J.; Demidov, D.; Houben, A.; Schubert, J. Chromosomal histone modification patterns – from conservation to diversity. Trends in Plant Sci 2006, 11, 199–208. [Google Scholar]
  20. Godin, D.E.; Stack, S.M. Heterochromatic connections between the chromosomes of Secale cereale. Can. J. Genet. Cytol 1975, 17, 269–273. [Google Scholar]
  21. Bedbrook, J.R.; Jones, J.; O’Dell, M.; Thompson, R.D.; Flavell, R.B. A molecular description of telomeric heterochromatin in Secale species. Cell 1980, 19(2), 545–560. [Google Scholar]
  22. Gustafson, J.P.; Lukaszewski, A.L.; Bennet, M.D. Somatic deletion and redistribution of telomeric heterochromatin in the genus Secale and in Triticale. Chromosoma 1983, 88, 293–298. [Google Scholar]
  23. De Putter, M.; Van de Vooren, J.G. Identification of Allium cepa cultivars by means of statistical analysis of C-banded chromosomes. Euphytica 1988, 39, 153–160. [Google Scholar]
  24. Robinson, P.J.J.; Rhodes, D. Structure of the ‘30 nm’ chromatin fibre: A key role for the linker histone. Curr. Opinion in Structural Biol 2006, 16, 336–343. [Google Scholar]
  25. Anderson, J.S.; Lam, Y.W.; Leung, A.K.L.; Ong, S.; Lyon, C.E.; Lamond, A.L.; Mann, M. Nuclear proteome dynamics. Nature 2005, 433, 77–83. [Google Scholar]
  26. Mineur, P.; Jennane, A.; Thiry, M.; Deltour, R.; Goessens, G. Ultrastructural distribution of DNA within plant meristematic cell nucleoli during activation and the subsequent inactivation by a cold stress. J. Struct. Biol 1998, 123, 199–210. [Google Scholar]
  27. Feucht, W.; Dithmar, H.; Polster, J. Nuclei of tea flowers as targets for flavanols. Plant Biology 2004, 6, 696–701. [Google Scholar]
  28. Feucht, W.; Treutter, D.; Dithmar, H.; Polster, J. Flavanols in somatic cell division and male meiosis of tea (Camellia sinensis) anthers. Plant Biology 2005, 7, 168–175. [Google Scholar]
  29. Barckhausen, R. Ultrastructural changes in wounded plant storage tissue cells. In Biochemistry of wounded plant tissues; Kahl, G., Ed.; Walter de Gruyter & Co: Berlin New York, 1978; pp. 1–42. [Google Scholar]
  30. Chua, Y.L.; Brown, A.P.C.; Gray, J.C. Targeted histone acetylation and altered nuclease accessibility over short regions of the pea plastocyan gene. The Plant Cell 2001, 13, 599–612. [Google Scholar]
  31. Thies, M.; Fischer, R. Über eine neue Farbreaktion zum mikrochemischen Nachweis und zur quantitativen Bestimmung von Catechinen. Microchim. Acta (Wien) 1971, 13, 9–13. [Google Scholar]
  32. Feucht, W.; Nachit, M. Flavolans and growth-promoting catechins in young shoot tips of Prunus species and hybrids. Physiol. Plant 1977, 40, 230–234. [Google Scholar]
  33. Coleman, A.W.; Maguire, M.J.; Coleman, J.R. Mithramycin- and 4,6-diamidino-2-phenylindole (DAPI)-DNA staining for fluorescence microspectro-photometric measurement of DNA in nuclei, plastids and virus particles. J. Histochem. Cytochem 1981, 29, 959–968. [Google Scholar]
  34. Hudson, B.; Upholt, W.B.; Devinny, J.; Vinograd, J. The use of an ethidium analogue in the dyebuoyant density procedure for the isolation of closed circular DNA: the variation of the superhelix density of mitochondrial DNA. Proc. Natl. Acad. Sci. U.S.A 1969, 62, 813–820. [Google Scholar]
  35. Gerlach, D. Botanische Mikrotechnik: Eine Einführung; Georg Thieme Verlag: Stuttgart, 1969. [Google Scholar]
  36. Polster, J.; Lachmann, H. Spectrometric Titrations. Analysis of Chemical Equilibria; VCH Verlagsgesellschaft mbH: Weinheim, 1989. [Google Scholar]

