Article

Relationships between Xanthohumol and Polyphenol Content in Hop Leaves and Hop Cones with Regard to Water Supply and Cultivar

1
Slovenian Institute for Hop Research and Brewing, Žalskega tabora 2, SI-3310 Žalec, Slovenia
2
Chair of Chemisty, Department of Food Science and Technology,, Biotechnical Faculty, University of Ljubljana, Jamnikarjeva 101, SI-1111 Ljubljana, Slovenia
*
Author to whom correspondence should be addressed.
Int. J. Mol. Sci. 2007, 8(9), 989-1000; https://doi.org/10.3390/i8090989
Submission received: 30 May 2007 / Revised: 20 August 2007 / Accepted: 9 September 2007 / Published: 12 September 2007
(This article belongs to the Special Issue Phenolics and Polyphenolics)

Abstract

:
The effect of water supply – especially of drought stress – on the content of some secondary metabolites in hops (Humulus lupulus L.) was studied. The experiment took place in 2006. Some relevant data from 2005 were included for comparison. Leaves and cones of nine hop cultivars grown under field conditions as well as in a pot experiment under three water regimes were analyzed. The cultivars ranged from those most grown in Slovenia to promising crossbreed being tested. Leaves were sampled from July 18, 2006 to August 18, 2006, while cones were picked in the time of technological maturity. Standard analytical methods were applied to determine the contents of xanthohumol, polyphenols and α-acids in hop leaves and hop cones. The contents of the secondary metabolites in question depended more on the cultivar under investigation than on the water supply, at least as far the growing conditions for a relatively normal development of the plant were met.

1. Introduction

Hops, Humulus lupulus L., is a widely known cultivated plant, grown especially for its secondary metabolites (among them mostly the α- and β-acids) which are used in beer brewing to add bitterness and aroma to beer. Lately, it has become of interest due to its relatively high content of polyphenolic substances, which are becoming more and more popular due to their beneficial influences on health and metabolism [1]. Generally speaking, polyphenolics are very commonly occurring secondary plant metabolites [2]; their presence in plants has been related to reactions against various plant pests, they are known as regulators of plant growth as well as substances related to plant colourants [3,4].
Dried hop cones contain 4 – 14% of polyphenols, these being mainly phenolic acids, prenylated chalcones, flavonoids, catechins and proanthocyanidins [5,6]. Numerous studies, especially in vitro ones, indicate interesting biological effects of hop-derived prenylflavonoids and humulone. Evidence accumulated over the past 10 years speaks to the cancer preventive potential of these compounds among other potentially interesting biological effects [1]. Among hop-prenylflavonoids, xanthohumol (XAN), chemically a structurally simple prenylated chalcone, represents a major component and has gained the most attention, due to the well known fact that flavonoids, including chalcones, inhibit the proliferation of cancer cells and tumor growth [7]. Its anti-HIV-1 activity was demonstrated recently [8].
In breweries, hops is generally used on the basis of its α-acid content, but it seems that the content of xanthohumol and especially its ratio to α-acid content could and should also be considered when speaking of the brewing value of a hop cultivar or hop product. The content of xanthohumol and that of α-acids depends mainly on the cultivar in question and very little on the growing area [9]. This is, mutatis mutandis, generally true for the great majority of secondary metabolites. On the other hand, the fact that different forms of stress generally mean increased content of various plant secondary metabolites [10], i. e. also of polyphenolics, is also generally accepted, but for hops has not yet quantitatively evaluated. It was proven that plants start accumulating phenolic compounds when exposed to various forms of stress. Consequently, when a plant is exposed to stress, it or its parts can be considered a more abundant source of polyphenolic substances compared to the non stressed “blank”.
The aim of the present study was to determine the impact of drought stress on the content of xanthohumol as well as total polyphenolics in hop leaves and in hop cones in different hop cultivars. Futher on, we wanted to make a critical comparison of these values to those obtained for the same cultivars grown under normal conditions. There are relatively few data on the content of phenolic compounds or of xanthohumol in hop leaves [6]. Though content in hop cones is the most interesting, that in the leaves can be of potential benefit when speaking of using these as raw material for extraction of this (these) substance(s). We thought that hop leaves, which are now a rather troublesome waste, could perhaps be used as source for phenolic compounds of different potentially interesting biological activities.

2. Results and Discussion

2.1 Data included in the study

Tables 15 and Figures 1 and 2 give the results obtained (2006) or those from 2005 included in this study. Xanthohumol and polyphenol content in leaves and cones is given, the data for xanthohumol in cones are combined also with the values for α-acid content in the same material. Comparison of the data which are being collected on the Slovenian Institute of Hop Research and Brewing (content of polyphenols and content of xanthohumol in hop cones for various cultivars) with those included in these study (Table 5) are in excellent agreement and additionally, because such comparisons are common if incomplete sets of data are available [11]. Last but not least, the main purpose is to compare the contents of secondary metabolites, which – as generally known – depend on stress, but have not been systematically studied for various hop cultivars and under different drought conditions.

2.2 Visible effects of drought stress

In the field experiment plants showed no visible signs of drought stress. On the contrary, plants in pot experiments developed visible signs of drought after half a month without water. For the variants that were watered regularly, hop plants had normal, green leaves, while the variants that were not watered (drought stress) or were watered according to the outdoor precipitation (drought during the second half of July) there were lots of dry leaves. The best habitus was developed by cv. Merkur at the regularly watered variant. Non watered variants (drought stress) formed no secondary sprouts, except for new Slovenian cultivar 279D112 [12] (lateral sprouts were still green after having suffered drought for half a month) and cv. Merkur (dry secondary sprouts).

2.3 Xanthohumol content in hop leaves

The content of xanthohumol in hop leaves and hop cones differ in orders of magnitude [6]. The economic interest for xanthohumol or other polyphenols in hop leaves would be justified if with a simple stress such as drought or with crossbreeding their contents were increased.
Low contents of xanthohumol were detected in hop leaves from the pot and field experiment (Tables 1 and 2); the highest in leaves of cv. Taurus (0.08% in DM), followed by cv. Southern Star. For the plants which were regularly watered, xanthohumol content in leaves was mainly lower, compared to plants which were exposed to drought stress and plants watered naturally by the rain outdoors. In the pot experiment, xanthohumol content in leaves was higher at the beginning of August compared to the middle of July, then the trend changed as to cultivar and water treatment.
Similarly, in the field experiment, xanthohumol content in leaves was the highest in cv. Taurus too (Table 2). In the middle of July xanthohumol content was 2.4 to 8.4-times higher in the leaves of that cultivar compared to other included cultivars. Xanthohumol content in leaves decreased from the middle of July to the beginning of August (the period was dry and hot), except for cv. Merkur and cv. 279D112, where the content increased, and for cv. Taurus, where the content was stable during that period. For all cultivars included in this study xanthohumol content in leaves decreased from the beginning of August to the middle of August (that period was relatively cold and wet, the hop cones were developing intensively).

2.4 Polyphenol content in hop leaves

Polyphenol content in leaves of plants grown in the pots increased from the middle of July to the beginning of August and then decreased for all cultivars and all water treatments (Tables 3 and 4). There were differences among cultivars; the highest content was found at South African cultivar Southern Star (as high as 14.28 g/kg DM), followed by the new Slovenian cultivar 279D112 (7.24 g/kg DM), Aurora and Cicero (Slovene cultivars) (Table 3). For the majority of cultivars the highest polyphenol content was determined in the leaves of plants that were not watered. The exceptions were cv. Taurus and crossbread 279/122, where the highest polyphenol content in leaves was detected at plants which were watered as indicated by the precipitation and cv. 279D112 where the highest polyphenol content in leaves was detected at plants watered regularly.
The results in the field experiment were rather similar: polyphenol content in leaves increased from the middle of July to the beginning of August and then decreased for all cultivars. The highest contents in the field were measured in cvs. Southern Star, 279D112 and Taurus. The lowest contents were measured for cvs. Celeia and Aurora. (Table 4)

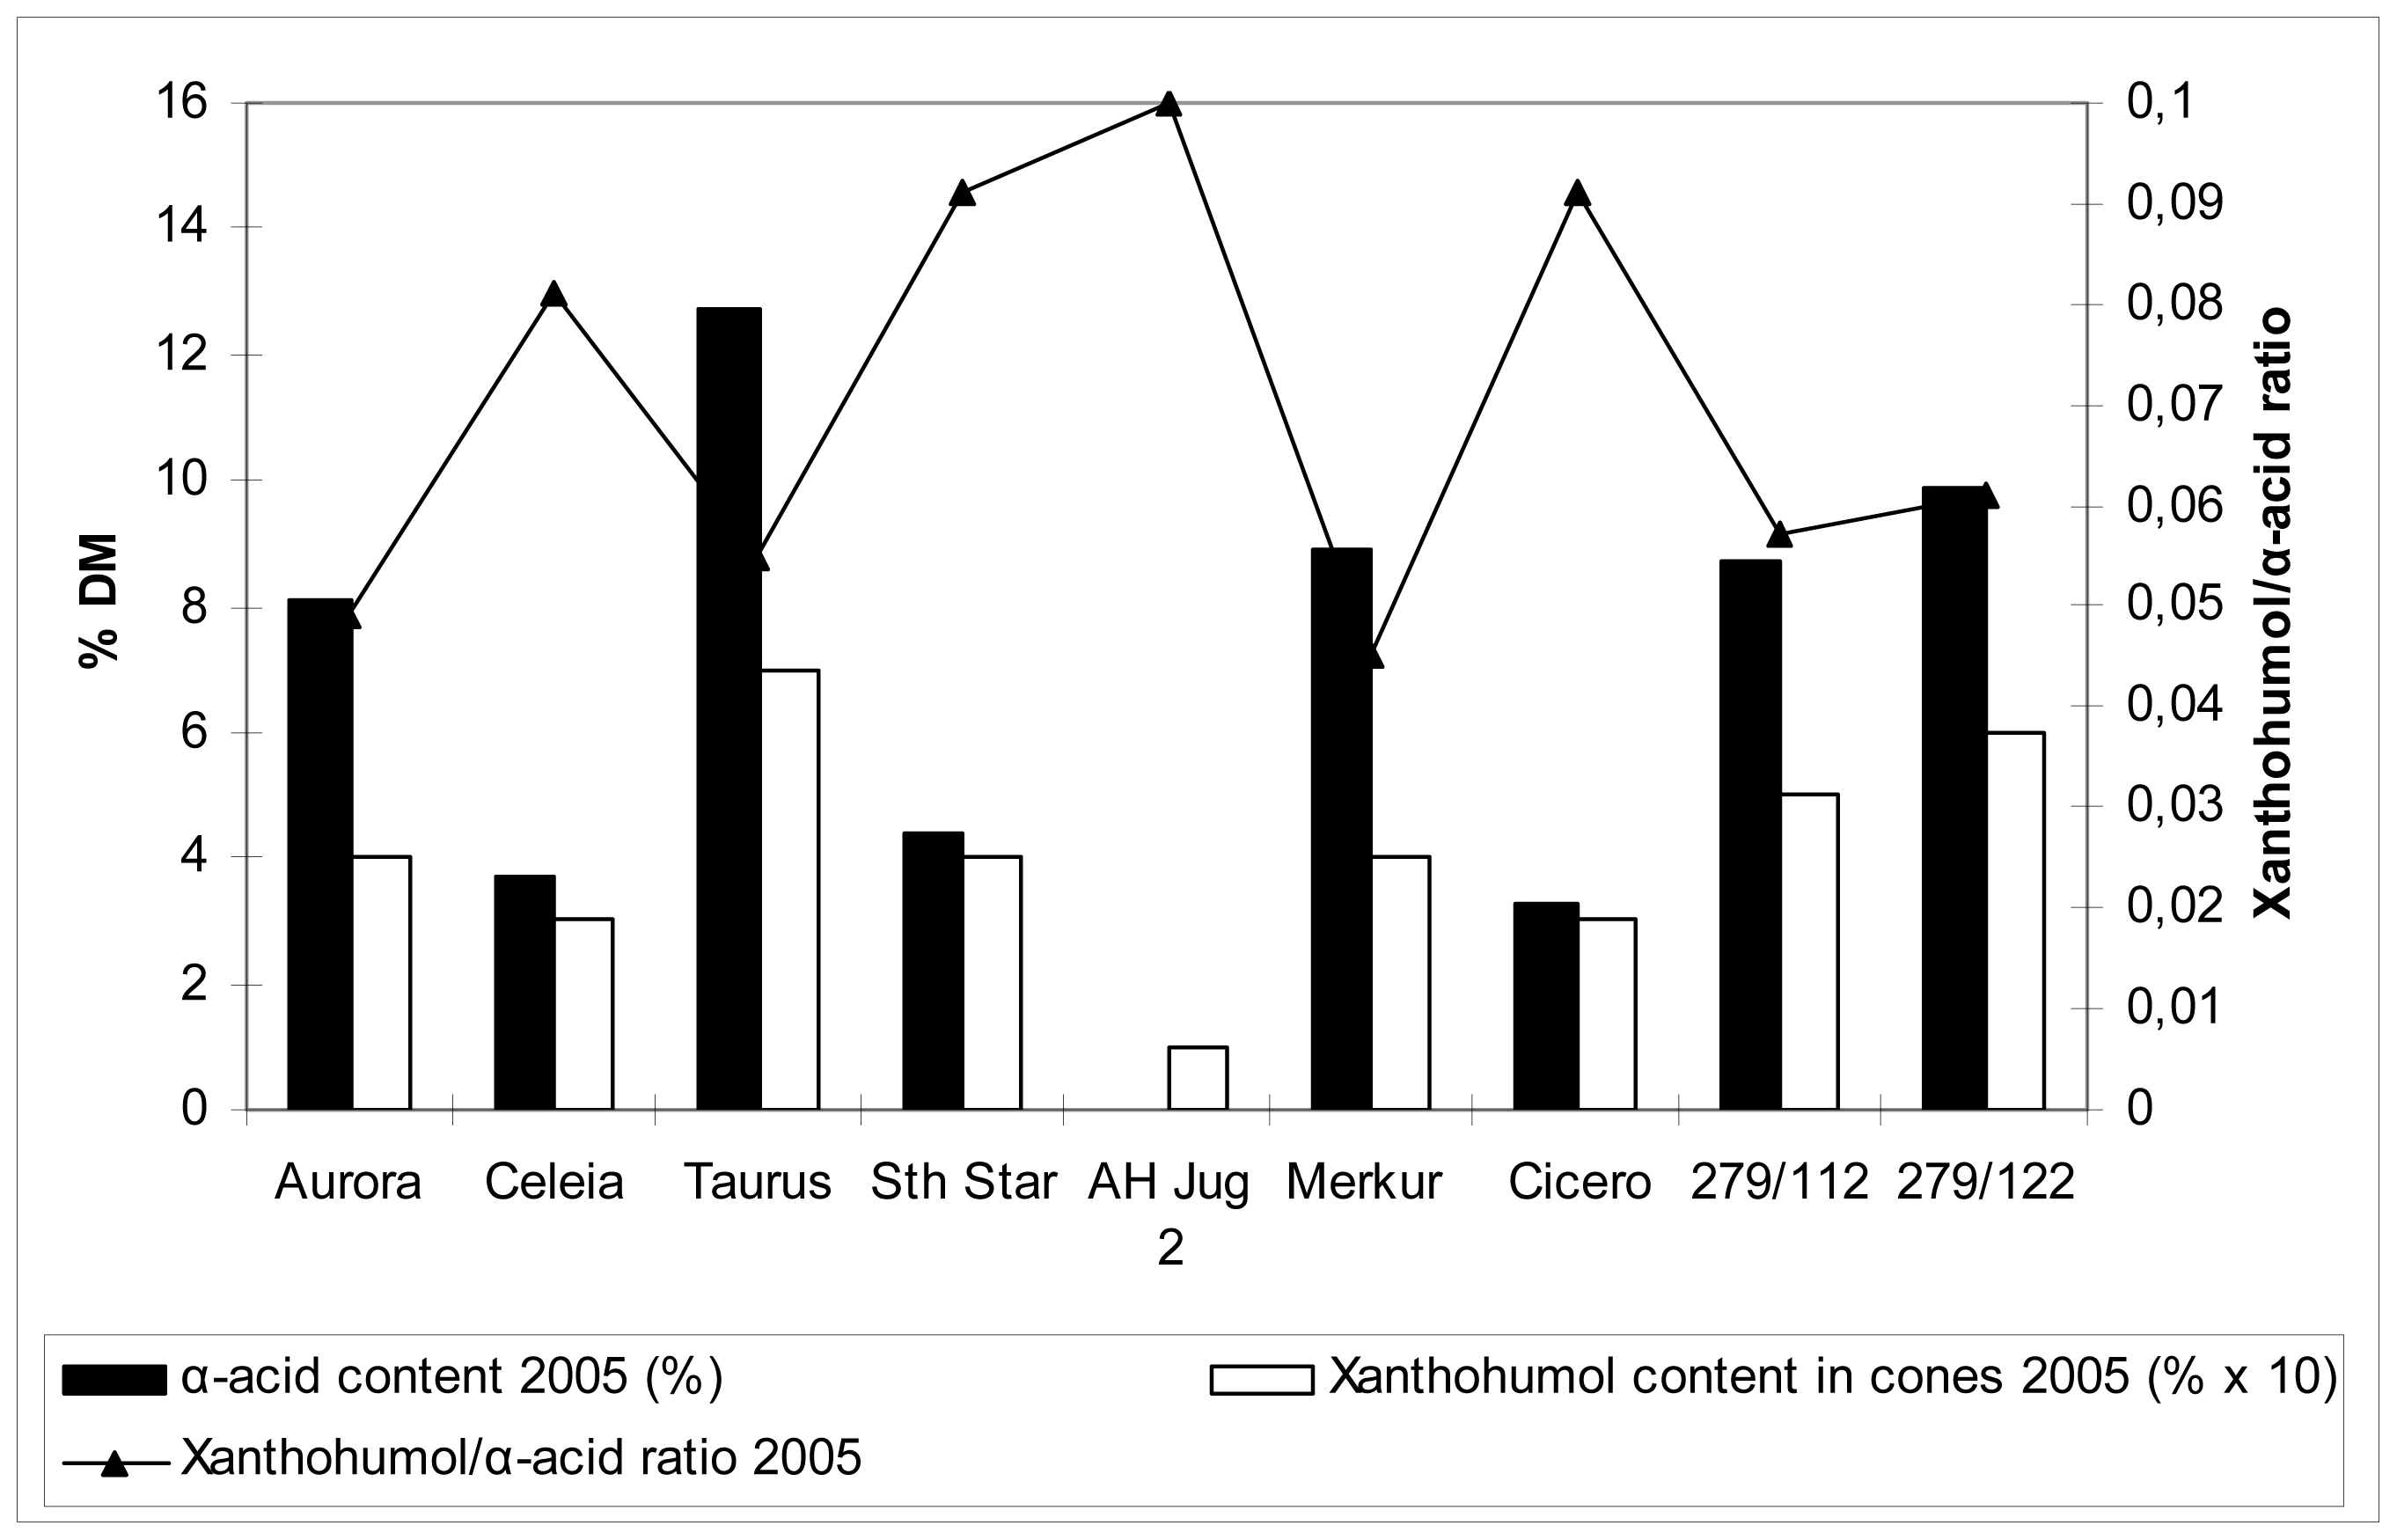
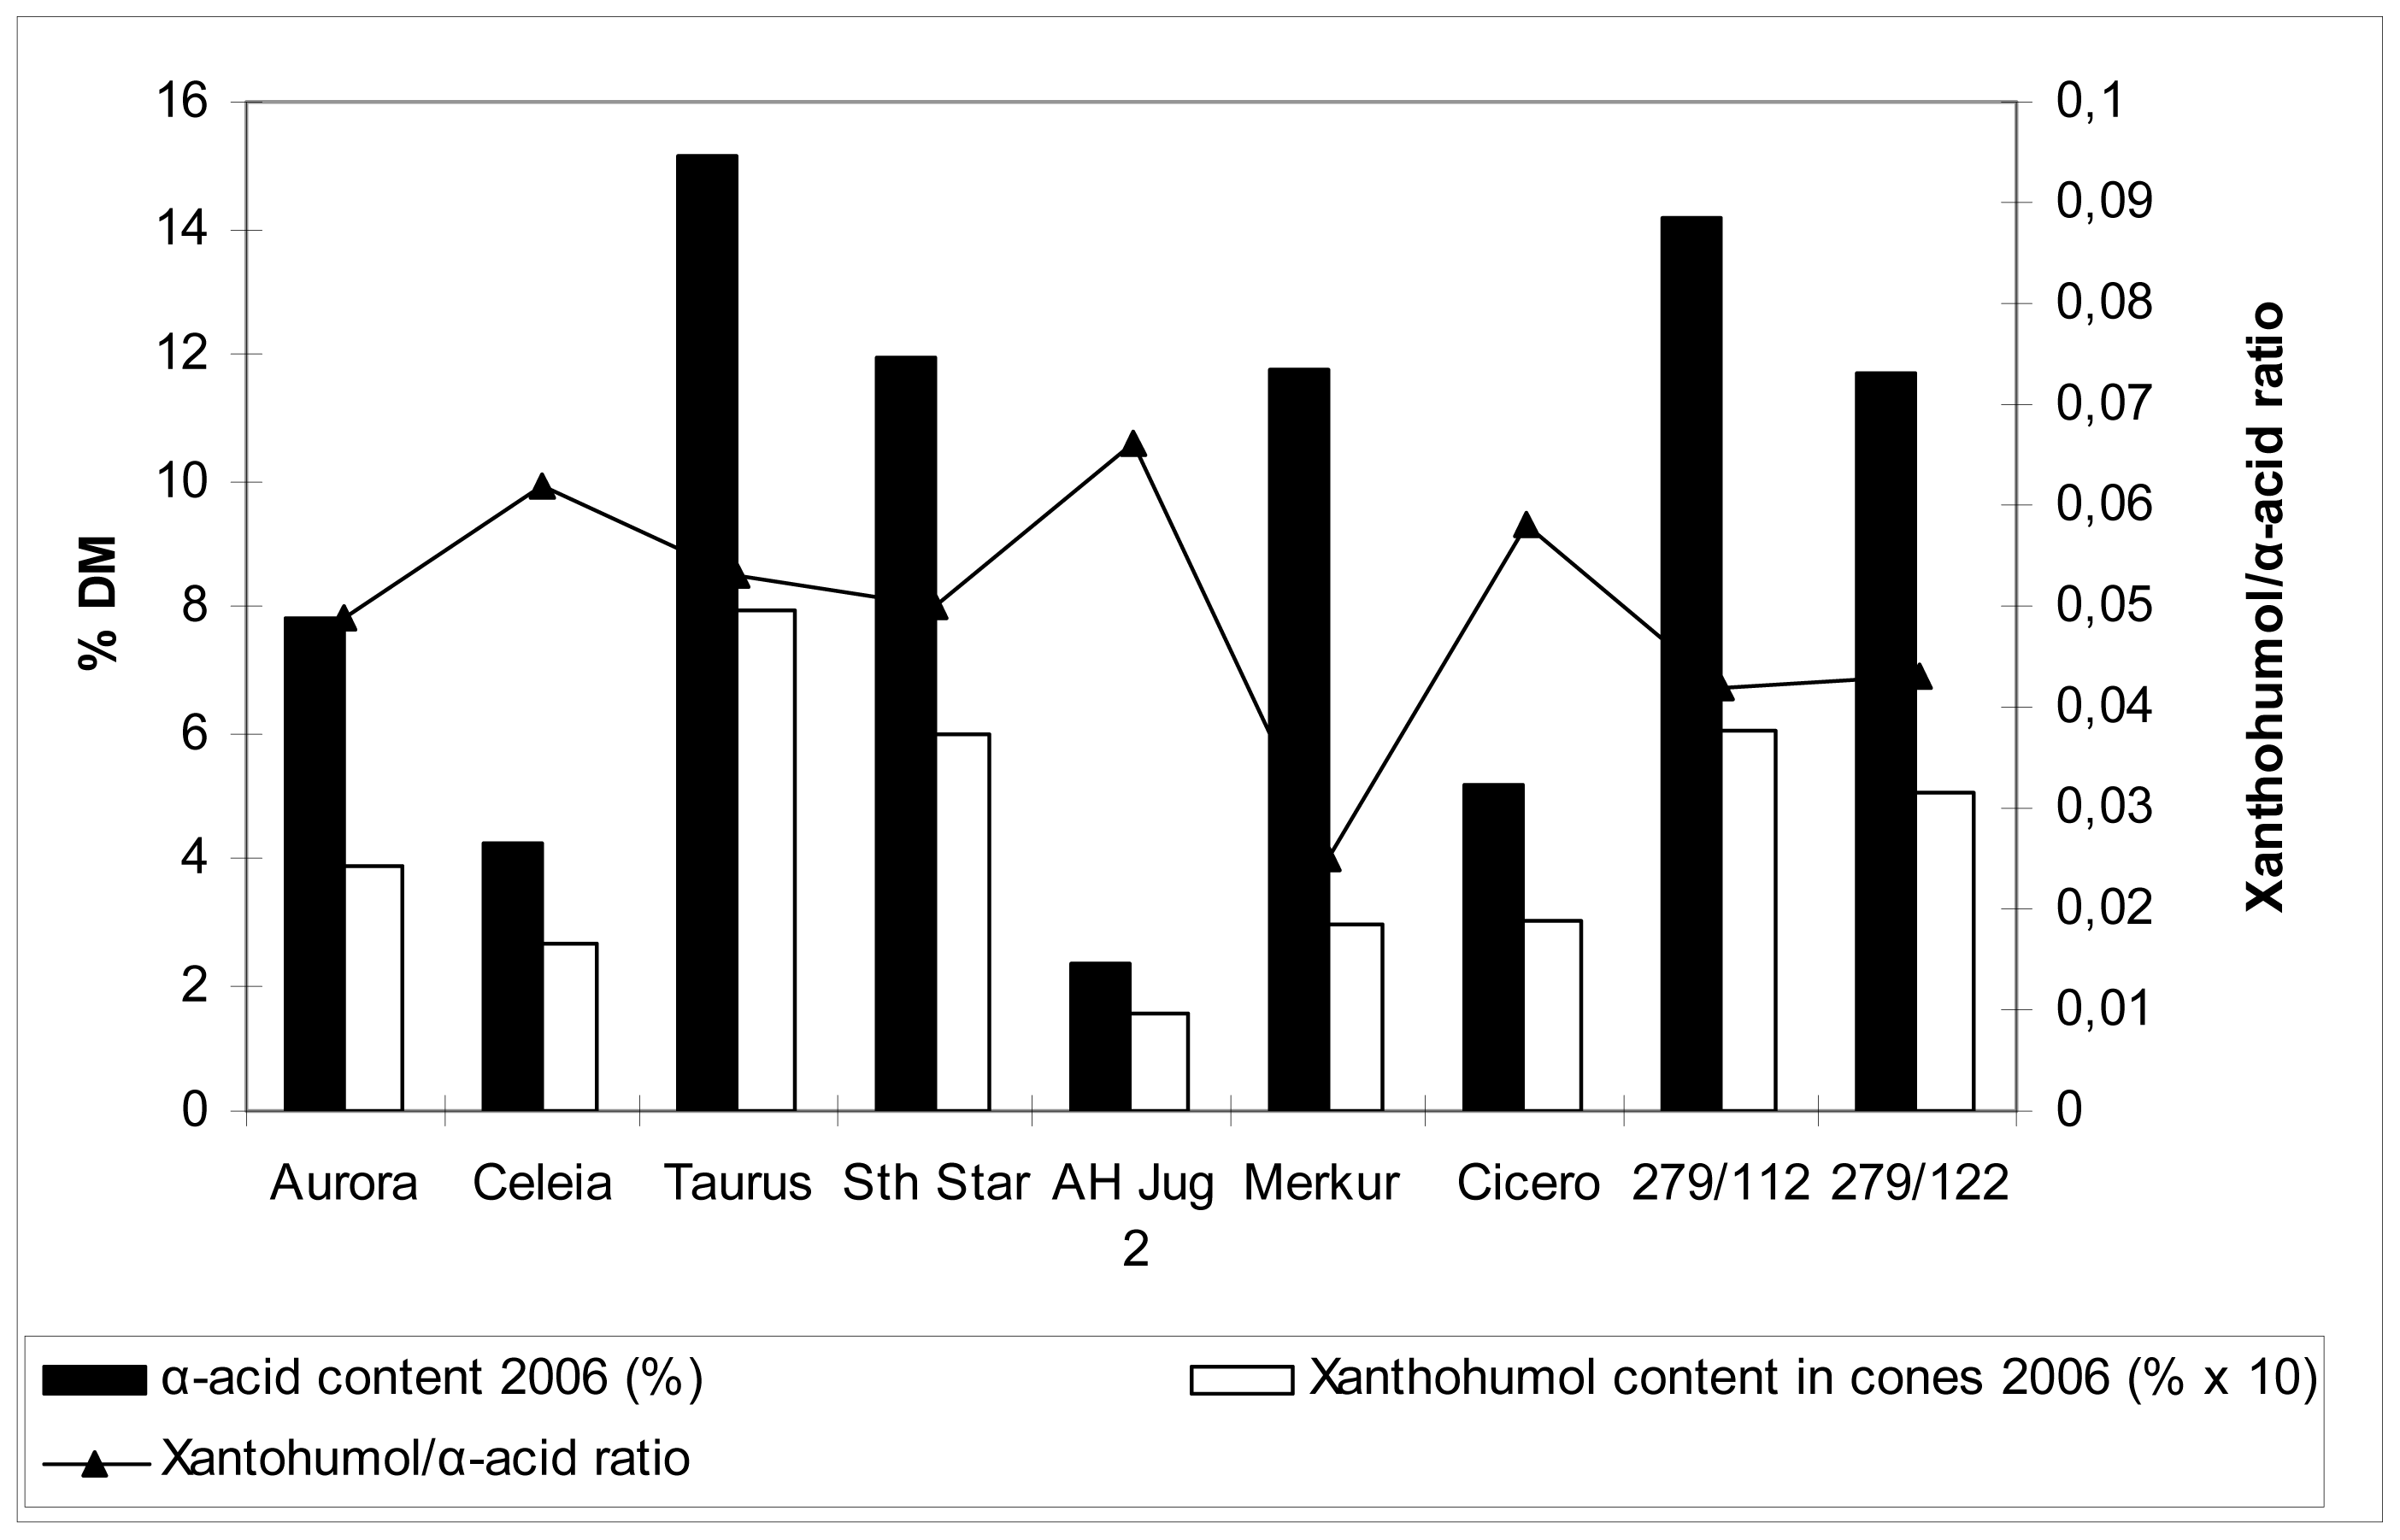
2.5 Xanthohumol, polyphenol and α-acid content in hop cones

Table 5 and Figures 1 and 2 show the data on xanthohumol and polyphenol content in cones, together with relevant comparison with α-acid content. These values are far more familiar compared to those for the content of the same substances in the leaves, so no detailed commentary is included. Generally speaking, there were differences among cultivars in polyphenol content in hop cones. Higher content was detected for cvs. Merkur, Aurora, Celeia and Southern Star, lower for cvs. Taurus, Cicero and at the autochtonous hop Jug2. Higher content of polyphenols in leaves did not necessarily reflect in higher content of polyphenols in cones.
Xanthohumol is the principal simple prenylated chalcone that occurs only in the hop plant. It is secreted as part of the hop resin and is accompanied by at least 13 related chalcones [13]. Although prenylflavonoids have a restricted distribution, the biosynthesis of flavonoids is well characterized at both genetic and enzymatic levels. It has been proven in many plants that flavonoids protect them from UV light [14].
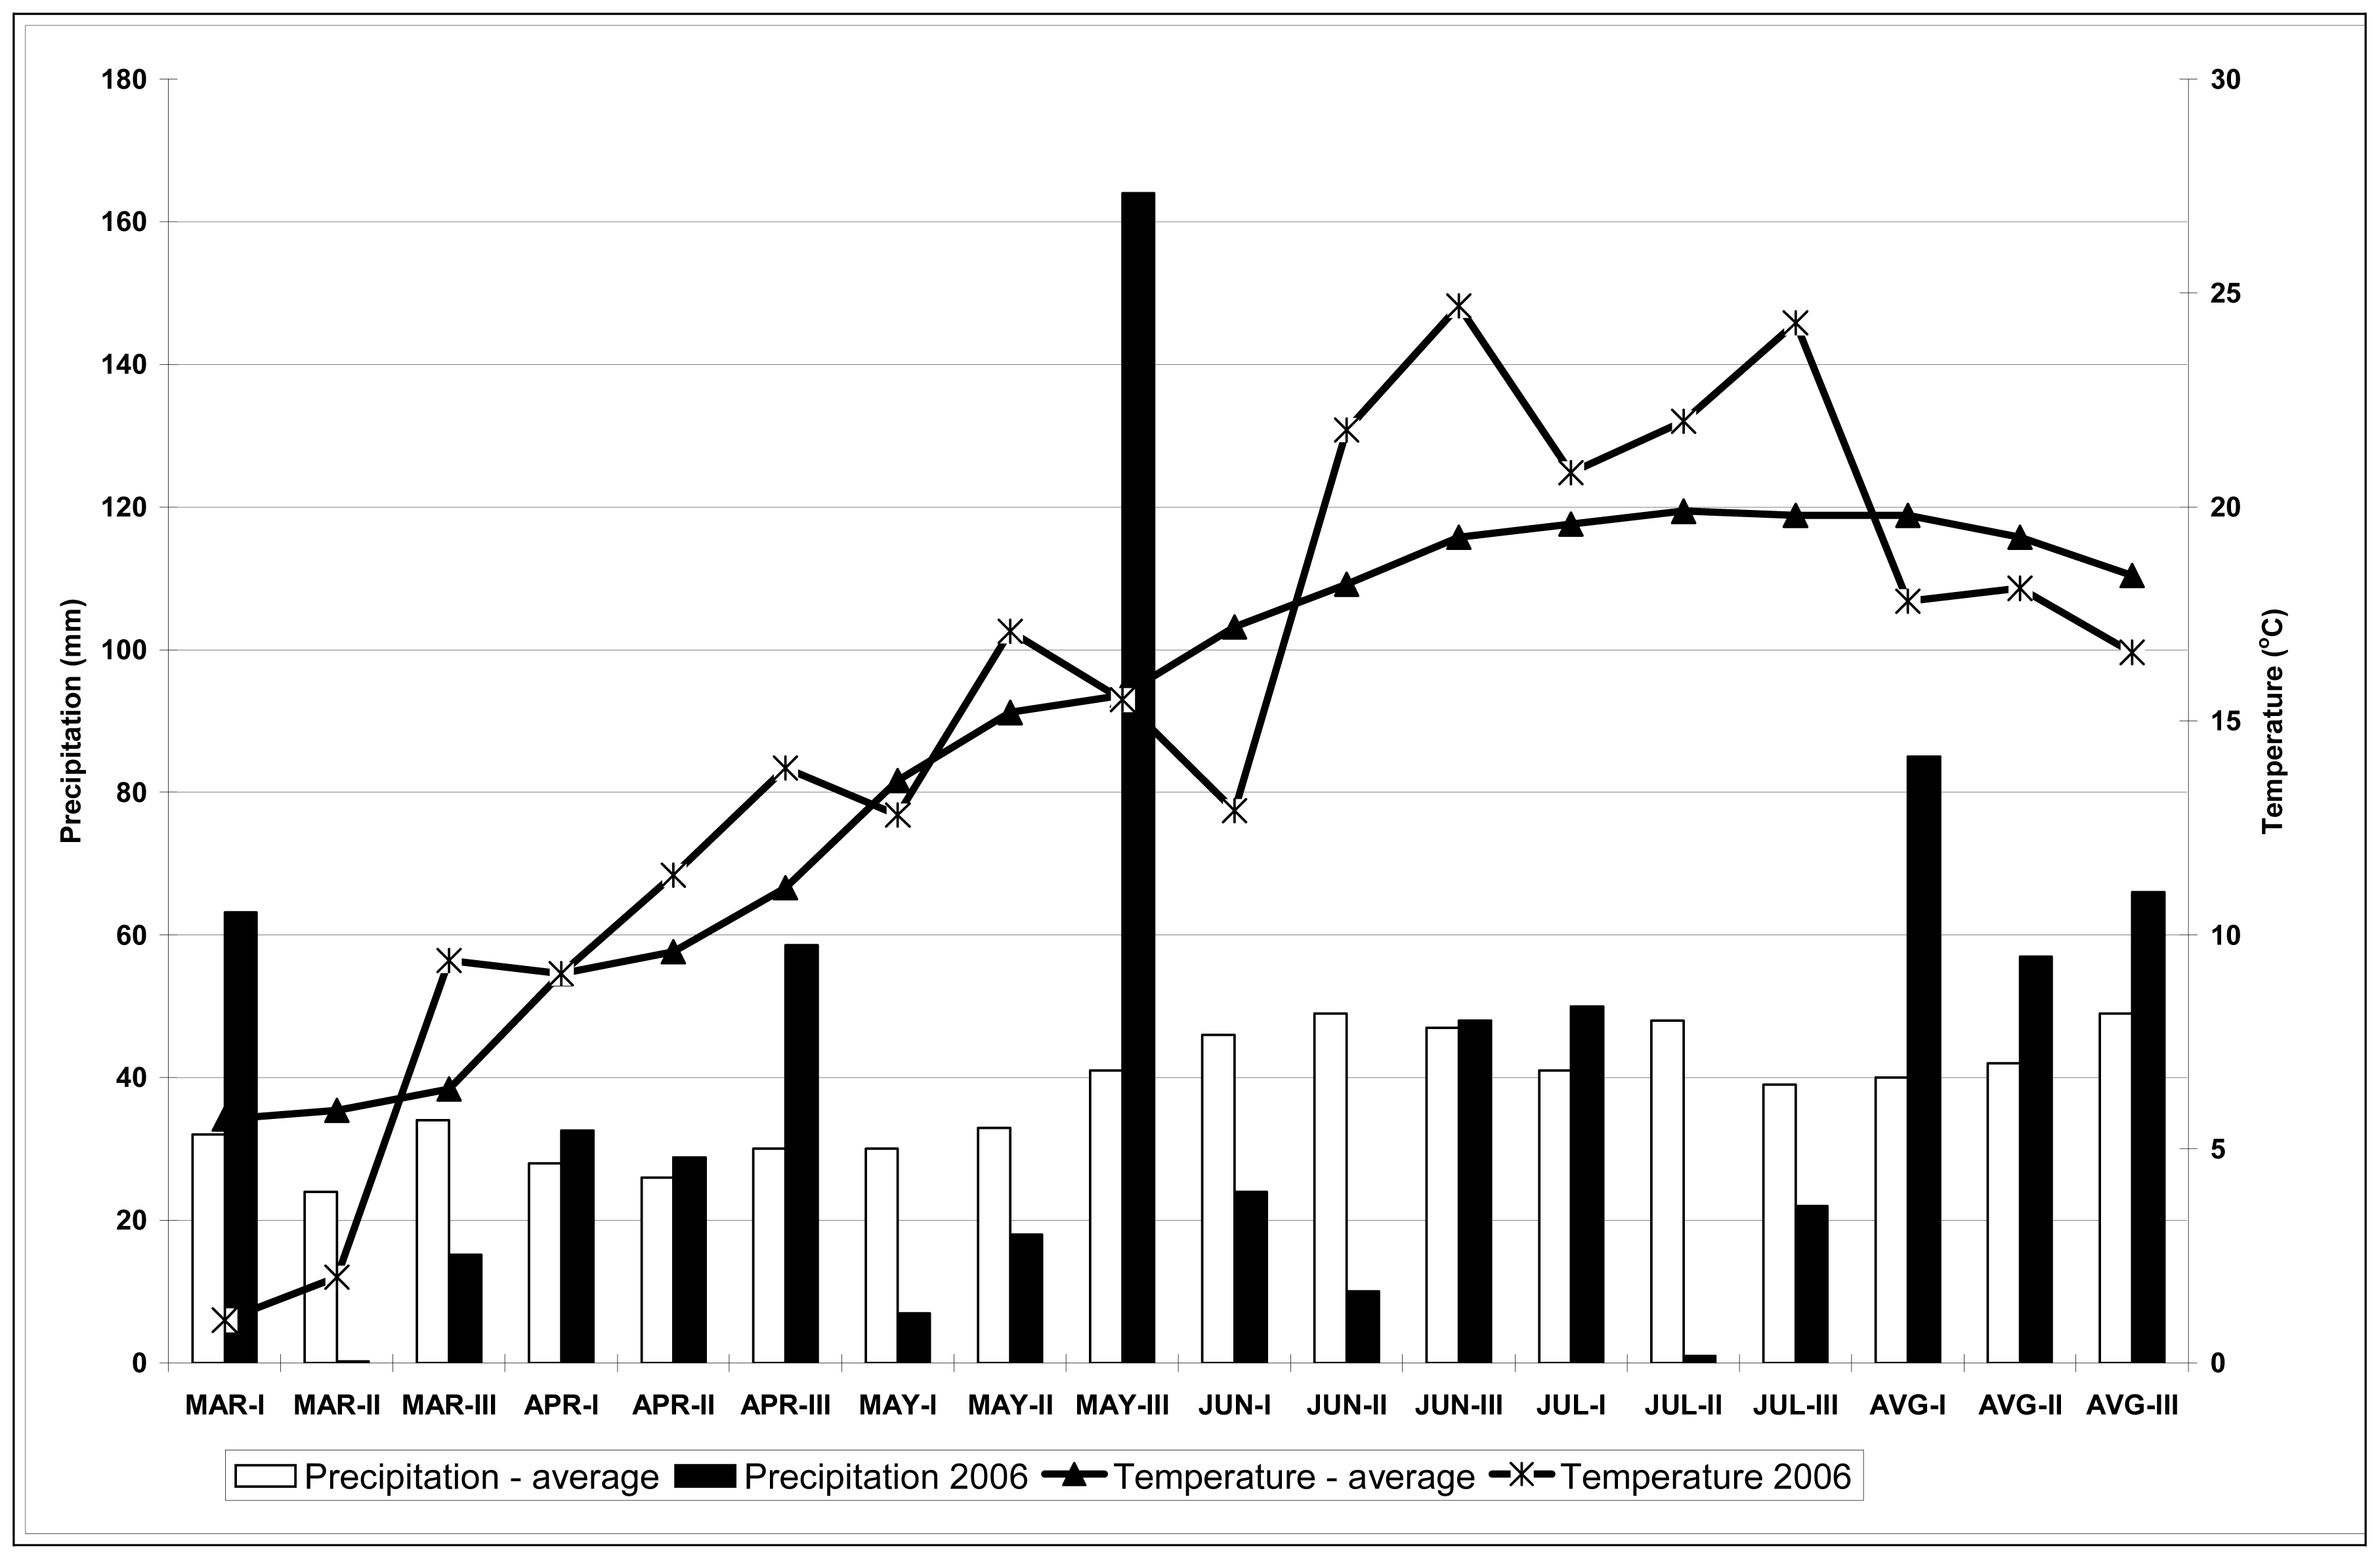
The 2006 season was a good one to investigate drought stress impact on the content of secondary metabolites in hops grown in the field (in our case the content of polyphenols and xanthohumol) in hop leaves and cones. Precipitation was low in July, accompanied by temperatures over 30 °C. In the period from the middle of July to the beginning of August the content of polyphenols in leaves increased for all cultivars included in this study, while that of xanthohumol decreased. The only exceptions being the cv. 279D112 and cv. Merkur, where xanthohumol content in leaves increased during the period in question. Xanthohumol in leaves reached values up to 0.009% DM, while polyphenol content in leaves ranged from 0.57 g/kg DM to 14.28 g/kg DM. Higher values were reached at plants in pots compared to the plants on the field because drought stress was certainly higher for plants in pots compared to the plants in the field where absorption of water was possible from lower layers of soil; there was also 22 mm of precipitation in the second and the third decade of July and the wind lowered the temperatures of the leaves.
Cvs. Merkur and Cicero, which are cultivars less adapted to drought, did not differ in contents of polyphenols and xanthohumol in leaves compared to the other investigated cultivars that are known to be more drought adapted (i. e. less susceptible to drought).
To our best knowledge this is the first systematic study of the effect of water supply on the content of polyphenols and especially on the content of xanthohumol in hops. As water supply (i. e. water or drought stress) is hard to define under field conditions, we combined the field experiment with a pot experiment. Consequently, we had to face the fact, that cones are not always obtainable under such (namely the pot experiment) conditions. We had to compromise and so results presented in this study give xanthohumol and total polyphenol content for hop leaves as well as for hop cones. Leaves were also the only alternative if any data on the time dependence of these substances should be obtained. Some analytical problems emerged especially because the substances under investigation are present in leaves only in rather low concentrations.
Nevertheless, one could conclude that the metabolism and above all the relative content of secondary metabolites in hops depends more on the cultivar than on the growing conditions. In this experiment we noticed that such a simple stress as drought cannot increase much the content of xanthohumol and total polyphenolics. In other words when higher content of xanthohumol or other polyphenols of interest in hop leaves are an aim then metabolic engineering of prenylflavonoid biosynthesis for developing such hop varieties is a necessity. It looks like we are on a right track with the new cultivar 279D112 and our crossbread 279/122.

3. Experimental Section

3.1 Hop samples investigated

The experiments were performed in 2006 with nine hop cultivars grown under conditions represented in Table 6. For better and more meaningful comparison some representative data for 2005 were included also (see Figs 1, 2 as well as Table 5).

Pot experiment in greenhouse

Plants of all included cultivars were planted in pots in 2004 and placed in a greenhouse in the spring of 2006.

Field experiment

Plants in the field experiment were planted in 2004, samples of leaves and cones for the present research were collected during the 2006 season.

Sampling

Samples of leaves were collected in the greenhouse and in the field three times. Dates of collection were: July 18, 2006; August 3, 2006; August 18, 2006. Only primary leaves were collected; equal amounts from lower, middle and upper part of the plant. For each sample about 1 liter of leaves were collected and then average subsamples were used for analyses. Samples of hop cones were sampled at the time of the technological maturity in the field experiment in 2 consecutive years, 2005 and 2006.

3.2 Weather conditions in 2006 relevant for the experiment

Weather conditions in 2006 were not favorable for hops. The spring was relatively cold and wet. But there was not enough precipitation right before the first N side-dressing in the middle of May. At the middle of June and throughout July the temperatures were extremely high and there was not enough precipitation. There were 28 days with temperatures over 30 °C. Then, in the first half of August, the weather changed to relatively cold for that period and there was a high amount of precipitation (Figure 3). The unfavorable weather conditions reflected in low yields with low α-acid content.

3.3 Analytical methods applied

Determination of xanthohumol and polyphenol content in leaves

Sampled fresh green leaves were carefully dried on 45 °C to remove the majority of water. This air-dry material (the so called pre-dried leaves) was then used in further analyses.
Moisture content was determined in pre-dried leaves according to the official analytical method 7.2 (Analytica-EBC, 2000) [15]: 3–5 g of pre-dried leaves were dried in oven at 103–104 °C to constant weight. HPLC was used for determination of XAN and was performed according to the official analytical method Analytica-EBC 7.7 (Analytica-EBC, 2000): about 5 g of pre-dried and milled leaves were extracted for 30 min by shaking in a mixture of diethylether (50 mL, Ridel de Haën) and methanol (10 mL, ρ = 0,79 g/mL, Fluka), and then for another 10 min after adding 20 mL of 36–38% HCl solution (Carlo Erba). The extracts were fractioned by HPLC (HP 1050) using a Nucleosyl 5 C18, 5 μ ODS RP18, 250 mm × 4 mm column (Marcherey-Nagel, Düren, Germany). The injection sling was 10 μL. Determination was carried out by UV/VIS detector, with external calibration at 370 nm. The mobile phase used for separation was solvent A (methanol-water-phosphoric acid = 85:21:0.5). Solvent B (methanol-water = 1:1) was used for cleaning of the column after each run. Water was prepared according to ISO 3696: 1998, second grade, and phosphoric acid was 85%, ρ = 1.71 g/mL, purchased from J. T. Baker. Solvents A and B were filtered through a membrane filter (ø = 47 mm; 0.2 μm) before use. The flow rate was 1 mL/min. Peaks were identified by comparison of the retention times with those of standard reference compounds, as well as by inspection of the respective UV spectra. XAN standard (90.08% purity, Hopsteiner, Simon H. Steiner, GmbH, Mainburg, Germany) was used for the quantification of XAN in hop leaves.
For determination of polyphenols in leaves the following procedure was used. To 1 g of pre-dried and milled hop leaves N,N-dimethylformamide (25 mL, Fluka) and water (75 mL) were added, the mixture was shaken for 30 min and then filtered through filter paper (Whatman, 2 μm), an aliquot of supernatant (25 m) was transferred into a separatory funnel and chloroform (25 mL, Fluka) was added. The water phase was collected in a flask and dried under vacuum avoiding temperatures higher than 25 °C. Samples were diluted with 100 mL of water. Consequently, 10 mL of this solution was taken and carboxymethylcellulose sodium salt solution (CMC, 8 mL, Fluka), Fe reagent (0.5 mL) and aqueous ammonia (water-ammonia = 1:3, 0.5 mL) were added. The CMC solution was prepared by dissolving CMC (10 g) and EDTA (2 g) in water (1 L). Fe reagent was prepared by dissolving ammonium ferric citrate (5.6 g, Fluka) in water (1 L). After 10 min, the absorbance was measured at 600 nm with a UV-VIS spectrophotometer. Calculation was done according to the instructions in Analytica-EBC 9.11 method (Analytica-EBC, 2000).

Determination of α-acids in hop cones

Moisture content in hop cones was determined as in the case of hop leaves (see above). In the case of determination of α-acids in hop cones, the same procedure was followed as in the case of determination of xanthohumol in hop leaves (see above) with the exception of the wavelength monitoring the effluent (detector was set to 314 nm). A mixture of α- and β-acids of standardized composition (ICE–2: International Calibration Extract–2; 14.45% cohumulone, 34.49% humulone + adhumulone, 12.92% colupulone, 12.02% lupulone + adlupulone, Versuchsstation Schweizerische Brauerei, Zürich, Switzerland) served as external standard to quantify α- and β-acids.
Figure 1. α-acid content, xanthohumol content and xanthohumol/α-acid content ratio in hop cones in 2005
Ijms 08 00989f1
Figure 2. α-acid content, xanthohumol content and xanthohumol/α-acid content ratio in hop cones in 2006.
Ijms 08 00989f2
Figure 3. Precipitation and temperatures during the hop growth season 2006 compared to long-term average (Žalec, Slovenia).
Ijms 08 00989f3
Table 1. Xanthohumol in leaves (% DM) as to date of sampling and water supply–pot experiment 2006.
CultivarJuly 18, 2006August 3, 2006August 18, 2006
WR*W*D*WR*W*D*WR*W*D*
Aurorand*ndnd0.0160.0090.0120.011nd0.0097
Celeiandndnd0.0070.0100.0100.010nd0.013
Taurusndndnd0.0800.0310.0680.0640.0490.036
Sth Star0.0300.0210.0520.0290.0190.0200.0160.0000.035
AH Jug20.0080.0100.0120.0080.0030.0120.0100.011traces
Merkur0.0140.0160.0190.0150.0060.0110.0250.0190.027
Cicerondndnd0.0070.0060.0060.014nd0.009
279D1120,0240.0250.0200.0080.0080.0140.0050.0280.006
279/1220.0300.0280.0300.0150.0140.0130.0240.0250.013
*WR= watered regularly
*W= watered as indicated by the outdoor precipitation
*D= drought stress from July 18 to August 18, 2006
*nd = no data
Table 2. Xanthohumol in leaves (% DM) as to date of sampling – field experiment 2006.
CultivarJuly 18, 2006August 3, 2006August 18, 2006
Aurora0.0010.0000.000
Celeia0.0010.0000.000
Taurus0.0090.0090.009
Sth Star0.0040.001traces
AH JUG 20.0020.0020.000
Merkur0.0020.0030.001
Cicero0.0010.0000.000
279D1120.0020.0030.000
279/1220.0030.0000.000
Table 3. Polyphenol content in hop leaves (g/kg DM) as to date of sampling and water supply – pot experiment 2006.
CultivarJuly 18, 2006August 3, 2006August 18, 2006
WR*W*D*WR*W*D*WR*W*D*
Aurorandndnd2.114.426.310.80traces0.57
Celeiandndnd1.822.413.250.75traces1.24
Taurusndndnd1.953.712.501.571.681.48
Sth Star4.686.974.185.835.6114.282.991.336.85
AH JUG 22.121.882.052.762.252.982.061.871.35
Merkur1.750.831.811.771.882.272.001.521.68
Cicerondndnd3.053.335.201.07traces1.66
279D1123.583.191.617.243.463.953.482.043.12
279/1221.781.451.442.653.061.911.381.553.59
*WR= watered regularly
*W= watered as indicated by the outdoor precipitation
*D= drought stress from July 18 to August 18 2006
nd = no data
Table 4. Polyphenol content in hop leaves (g/kg DM) as to date of sampling – field experiment 2006.
CultivarJuly 18, 2006August 3, 2006August 18, 2006
Aurora1.332.021.55
Celeia1.022.061.45
Taurus1.732.591.09
Sth Star2.212.631.27
AH JUG 22.002.391.10
Merkur1.572.461.23
Cicero1.422.461.29
279D1121.962.591.45
279/1220.952.451.10
Table 5. Xanthohumol content in hop cones for 2005 and 2006 and polyphenol content in hop cones for 2006 – field experiment (cones sampled on September 23, 2005 and September 21, 2006).
CultivarXanthohumol content in hop cones in 2005 (% DM)Xanthohumol content in hop cones in 2006 (% DM)Polyphenol content in hop cones in 2006 (% DM)
Aurora0.40.415.92
Celeia0.30.314.66
Taurus0.70.87.44
Sth Star0.40.614.89
AH Jug20.10.210.76
Merkur0.40.316.75
Cicero0.30.310.22
279D1120.50.613.94
279/1220.60.59.83
Table 6. Hop cultivars and conditions of the trial.
Cultivar investigated (its provenance and name)Field trial (no. of plants)Greenhouse trial (no. of plants)

WR*W*D*

SlovenianAurora5333
Celeia5333
Cicero5333
GermanMerkur5333
Taurus5333
S. AfricanSouthern Star5333
AutochthonAH JUG25333
New Slovenian279D1125333
Crossbread279/1225333
*WR= watered regularly
*W= watered as indicated by the outdoor precipitation
*D= drought stress from July 18 to August 18, 2006

References

  1. Gerhauser, C. Beer constituents as potential cancer chemopreventive agents. Eur. J. Cancer 2005, 41, 1941–1954. [Google Scholar]
  2. Abram, V.; Simčič, M. Fenolne spojine kot antioksidanti. Farmcev. Vest 1997, 48, 573–589. [Google Scholar]
  3. Seigler, D. S. Plant Secondary Metabolism; Kluwer Academic Press: Boston, U.S.A, 1998. [Google Scholar]
  4. Piendl, A.; Biendl, M. Physiological significance of polyphenols and hop bitters in beer. Brauwelt Int 2000, IV, 310–317. [Google Scholar]
  5. Stevens, J. F.; Ivancic, M.; Hsu, V. L.; Deinzer, M. L. Prenylflavonoids from Humulus lupulus. Phytochemistry 1997, 44, 1575–1585. [Google Scholar]
  6. De Keukeleire, J.; Ooms, G.; Heyerick, A.; Roland-Ruiz, I.; Van Bockstakle, E.; De Keukeleire, D. Formation of α-acids, β-acids, desmethylxanthohumol and xanthohumol during flowering of hops. J. Agric. Food Chem 2003, 51, 42–45. [Google Scholar]
  7. Miranda, C.L.; Stevens, J.F.; Helmrich, A.; Henderson, M.C. Antiproliferative and cytotoxic effects of prenylated polyphenols from hops (Humulus lupulus) in human cancer cell lines. Food Chem. Toxicol 1999, 37, 271–285. [Google Scholar]
  8. Wang, Q.; Ding, ZH.; Liu, JK.; Zheng, YT. Xanthohumol, a novel anti-HIV-1 agent purified from Hops Humulus lupulus. Antivir. Res 2004, 64, 189–94. [Google Scholar]
  9. Hrastar, R.; Kač, M.; Košir, I.J. Vpliv sorte in lokacije na vsebnost ksantohumola v hmelju. Hop Bull 2006, 13, 5–12. [Google Scholar]
  10. Mayer, A. Polyphenol oxidases in plants and fungi: going places? A review. Phytochemistry 2006, 67, 2318–31. [Google Scholar]
  11. Biendl, M.; Pinzl, C. Arzneipflanze Hopfen; Deutsches Hopfenmuseum Wolnzach: Wolnzach, 2007; p. 127. [Google Scholar]
  12. Čerenak, A.; Šatović, Z.; Javornik, B. Genetic mapping of hop (Humulus lupulus L.) applied to the detection of QTLs for alpha-acid content. Genome 2006, 49, 485–494. [Google Scholar]
  13. Stevens, J. F.; Page, J. E. Xanthohumol and related prenylflavonoids from hops and beer: to your good health! Phytochemistry 2004, 65, 1317–1330. [Google Scholar]
  14. Winkel-Shirley, B. Biosynthesis of flavonoids and effects of stress. Curr. Opin. Plant Biol 2002, 5, 218–223. [Google Scholar]
  15. European Brewery Convention, Analytica-EBC/. Section 7 – Hops, Method 7.2, 7.4, 7.7; Carl, Getränke-Fachverlag: Nürnberg, 2000.

