Analysis of Soil Heavy Metal Pollution and Pattern in Central Transylvania


1
Babes Bolyai University, Faculty of Physics, 1st M. Kogalniceanu, 400084 Cluj-Napoca, Romania
2
“Iuliu Haţieganu” University of Medicine and Pharmacy Cluj-Napoca, 6 Louis Pasteur, 400349 Cluj-Napoca, Romania
3
Technical University of Cluj-Napoca, 103-105 Muncii Bvd, 400641 Cluj-Napoca, Romania
*
Author to whom correspondence should be addressed.
Int. J. Mol. Sci. 2008, 9(4), 434-453; https://doi.org/10.3390/ijms9040434
Submission received: 28 January 2008
/
Revised: 29 March 2008
/
Accepted: 31 March 2008
/
Published: 2 April 2008
Abstract
:The concentration of five soil heavy metals (Pb, Co, Cr, Cu, Hg) was measured in forty sampling sites in central Transylvania, Romania, regions known as centres of pollution due to the chemical and metallurgical activities. The soil samples were collected from locations where the ground is not sliding and the probability of alluvial deposits is small. The concentration of heavy metals was measured by using the Inductively Coupled Plasma Spectrometry method. Data were verified by using the Neutron Activation Analysis method. In some locations, the concentration for the investigated heavy metals exceeds the concentration admitted by the Romanian guideline. The highest concentration of lead (1521.8 ppm) and copper (1197.6 ppm) was found in Zlatna. The highest concentration of chromium was found in Târnăveni (1080 ppm). The maximum admitted concentrations in the sensitive areas revealed to be exceed from five to forty times.
List of abbreviations:
NAA = Neutron Activation Analysis; ICP = Inductively Coupled Plasma Spectrometry; RSV = Reference Value in the Sensitive Area; ALS = Alert Level in the Sensitive Area; RVLS = Reference Value in the Less Sensitive Area; ALLS = Alert Level in the Less Sensitive Area; AIT = Area Intervention Threshold1. Introduction
Heavy metal contamination of soil results from anthropogenic such as mining [1], smelting procedures [2] and agriculture [3] as well as natural activities. Chemical and metallurgical industries are the most important sources of heavy metals in the environment [4].
The metals are classified as “heavy metals” if in their standard state they have a specific gravity of more than 5 g/cm3. There are known sixty heavy metals. Heavy metals get accumulated in time in soils and plants and could have a negative influence on physiological activities of plants (e.g. photosynthesis, gaseous exchange, and nutrient absorption), determining the reductions in plant growth, dry matter accumulation and yield [5,6]. In small concentrations, the traces of the heavy metals in plants or animals are not toxic [7]. Lead, cadmium and mercury are exceptions; they are toxic even in very low concentrations [8].
Every 1000 kg of “normal soil” contains 200 g chromium, 80 g nickel, 16 g lead, 0.5 g mercury and 0.2 g cadmium, theoretically [9]. Monitoring the endangerment of soil with heavy metals is of interest due to their influence on groundwater and surface water [10,11,12] and also on plants [13,14,15], animals and humans [16,17,18].
The main goal of the present research was to assess the heavy metals distribution in some Transylvanian areas, known as mining, chemical or metallurgy industry centres. The comparison of the soil heavy metal concentrations with the maximum value admitted by the Romanian guideline [19,20] has also been made.
2. Experimental Section
2.1. Studied Areas
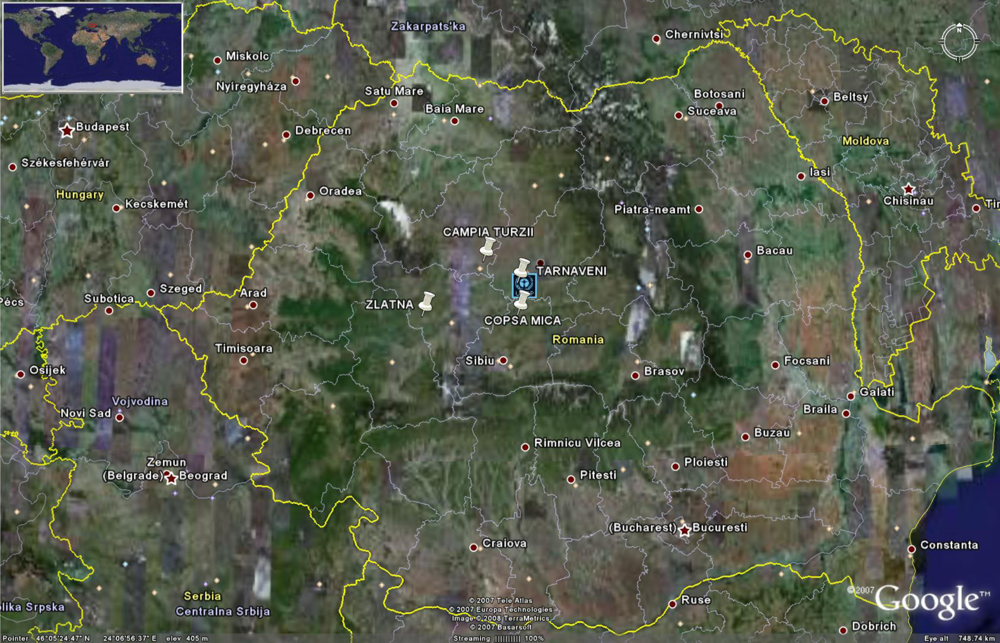
Four areas near to the Romanian towns known as important pollution centres (Târnăveni area - Mureş County, Copşa Mică - Sibiu County, Zlatna - Alba County, and Câmpia Turzii - Cluj County) were choose to be included into the study (Figure 1, from Google Earth1).
The main characteristics of the pollution centres included into analysis were as follows:
- Tărnâveni, situated on the Târnava Mica River, an important chemical industry centre. To date, the acetylene is the only product of the chemical industry, but the previous activities must also be considered. Nitrogen S.A. factory was built in 1916 and the main chemical produced were mercury, gold, bismuth, barium salts, copper sulphate, sodium and potassium dichromate, sulphuric acid. The soil structure in the area is [21]: brown and black earth, pseudoredzinic soils, and hayfield black earth, regosoils, clay soils and alluvial soils (the last areas types were not included into analysis). These types of soil had medium or reduced pollution vulnerability, which allows to obtained accurate long-term soil pollution information [22].
- Copşa Mică, situated on the Târnava Mare River, the most polluted area in the Sibiu County, was classified as an environmental disaster area2. The town is best known in Europe for its status (in the 1990s) as one of the most polluted in Europe2. The S.C. Sometra S.A., a non-ferrous metallurgical factory, is the main industry responsible by the pollution. The emissions coming from the others economic agents from the industrial platform of Mediaş city (S.C. Emailul, S.C. Vitrometan, and S.C. Geromed) is add to the pollution in this area.
- Zlatna, a west Carpathians mining region, particularly known due to its old polymetallic ores processing enterprises. Zlatna town is known as of the top 10 pollution ‘hot spots’ in Romania [23]. The primary and secondary metallic sulphides are concentrated by floating technology, and metals are extracted trough smelting procedures. The town is also a chemical centre preparing different mineral salts. The soil structures in the area consist of cambiosoils, luvisoils and regosoils, with high and moderate vulnerability to the pollution. Due to the pollutant industries in Zlatna, the mean annual atmospheric emissions were of 150 450 tones SO2 and 3498 tones dust laden with Pb, Zn, Cu, Cd, Sb, Bi and As in 1993 [24]. These values were of 41 000 tones SO2 and 2715 tones dust (Pb: 44%, Zn: 26%, Cu: 21%) on research reported by Clepan in 1999 [25]. It is known that Zlatna soil (around the industrial complex) is loaded with Pb, Cu, Zn and Cd at content levels exceeding up the maximum allowable limits [26].
- Câmpia Turzii, situated on the inferior course of the Arieş River, in the proximity of the Turda city, in an area where the brown soils prevail. The Industria Sârmei S.A. is the main economic agent (one of the biggest metallurgical units in Romania, manufacturing 41% of the production of wire drawing with a low concentration of carbon). Other two important contributors are CERCOM S.A. (ceramic products), and Chemical Independent Group S.A. (chemical industry).
To date, there are no surveys referring to the pollution generated in the city's neighbouring area of above cities and areas even if it is known that are important polluting centre.
2.2. Sampling
Nine locations (see Table 1) were investigated on each region included into the study.
The location from where the soil samples were collected accomplished the following criteria:
- The absence of both ground sliding and existence of alluvial
- Samples of soil from the area situated near to the industrial platform (~ 2 km) [27]
- Samples of soil from the area situated at a distance up to 10 km from the industrial platform [27]
- The steps applied for sampling was as follow:
- Step 1: Holes with an area of 40×50 cm were dug
- Step 2: Soil samples were took from depths of 5 cm, 15 cm and 25 cm
- Step 4: The samples were sifted and homogenized after drying. They were labelled and separated, being prepared for analysis. Portions of samples were prepared to determine the concentration by NAA (Neutron Activation Analysis) and ICP spectrometry (Inductively Coupled Plasma Spectrometry). The determinations were made at the Institute for Nuclear Research Piteşti (NAA) and at the EXPROGAZ Mediaş (ICP).
- Step 5: NAA (Neutron Activation Analysis) determination. Samples of 70 mg were used for this determination. These were irradiated in the pneumatic mail of the TRIGA reactor. The irradiation time was from 1.5 up to 2 hours. The following data were collected: (1) the flow of the thermal neutrons (E < 0.5 eV) = 4.7·1012 n/cm2/s; (2) the cadmium ratio: RCd = 1.8; (3) the thermal flow/epithermal flow ratio ≈ 10. The measuring of the activity has been made with a γ spectrometer chain of high resolution with an HpGe detector having a relative efficiency of 20%. The time of measurement ranged within 3000s and 12000s. The measurements started after the cooling of Na24, isotope whose halving time is 15 hours. The concentration was determined by means of the KO method with a Zr monitor; a method whose detection limits varies between 3 and 5 ppm. The obtained data were processed with the GENIE 2000 software3 and the results were compared with the values on standard samples (SRM) [30] (see Table 2).
- Step 6: ICP (Inductively Coupled Plasma Spectrometry) determination. On the samples of 250 mg was added 3 ml of HNO3 65% and 3 ml of HF 40% for these determinations. The obtained mixture was introduced in a microwave oven and disintegrated. After the digestion, it was introduced in a glass bubble and completed with distilled water up to 50 ml. The solution was placed in a plasma jet by means of a peristaltic pump, with 8 rolls and 3 channels. The maximum speed of 200 rotations/minute controlled by the computer was applied. An ultrasonic Cross-flow Babington IRIS ADVANTAGE spectrometer and an Echell-type cross-dispersion spectrograph was used, covering a spectra interval of 178 - 800 nm. The system resolution ranged from < 0.01 nm to < 200 nm to < 0.03 to 600 nm. The CID 38196 mm2 detector with 262144 grouped individual detectors into a 512×512 matrix, cooled with a two-step heat changer allowing on integration with a random access was used. The source of plasma rousing with the frequency of 27.12 MHz, controlled by the crystal can supply a power of 750–1750 W, in 6 steps, controlled by the computer. The obtained data were processed in a first stage with the Thermos SPEC/CID soft. The library of 20000 lines, all-accessible in at least one order/degree of diffraction, gives the possibility to obtain the image of the whole spectra and a complete identification of the peaks. The detection limits ranged from 1ppm to 1 ppb, as follows: Cu, Co, Hg < 1 ppb, Hg < 10 ppb.
The same researcher in all locations extracted the soil samples. The same person made the IPC and NAA determinations. Due to the limited financial resources there was not possible to carry out more than one determination for a given depth and a give location. Thus, the uncertainty of measurements [31,32] was not possible to be determined.
3. Results and Discussion
One hundred and eight soil samples from a total surface of 4800 km2 were collected and analyzed. The results are presented according with the name of the studied areas.
3.1. Târnăveni area
The concentration of four heavy metals (Co, Cr, Cu, and Hg) was identified and quantified by using ICP and/or NAA in 9 locations situated in Târnăveni region (Table 3). The lead was the heavy metal not identified in Târnăveni area.
Most of the higher concentrations of identified soil metals were found in the 3rd location. These concentrations were over the intervention level. Note that the 3rd location is situated near de Chemical Platform where chemical fertilisers, carbide, basic inorganic chemicals, anti-pests are produced.
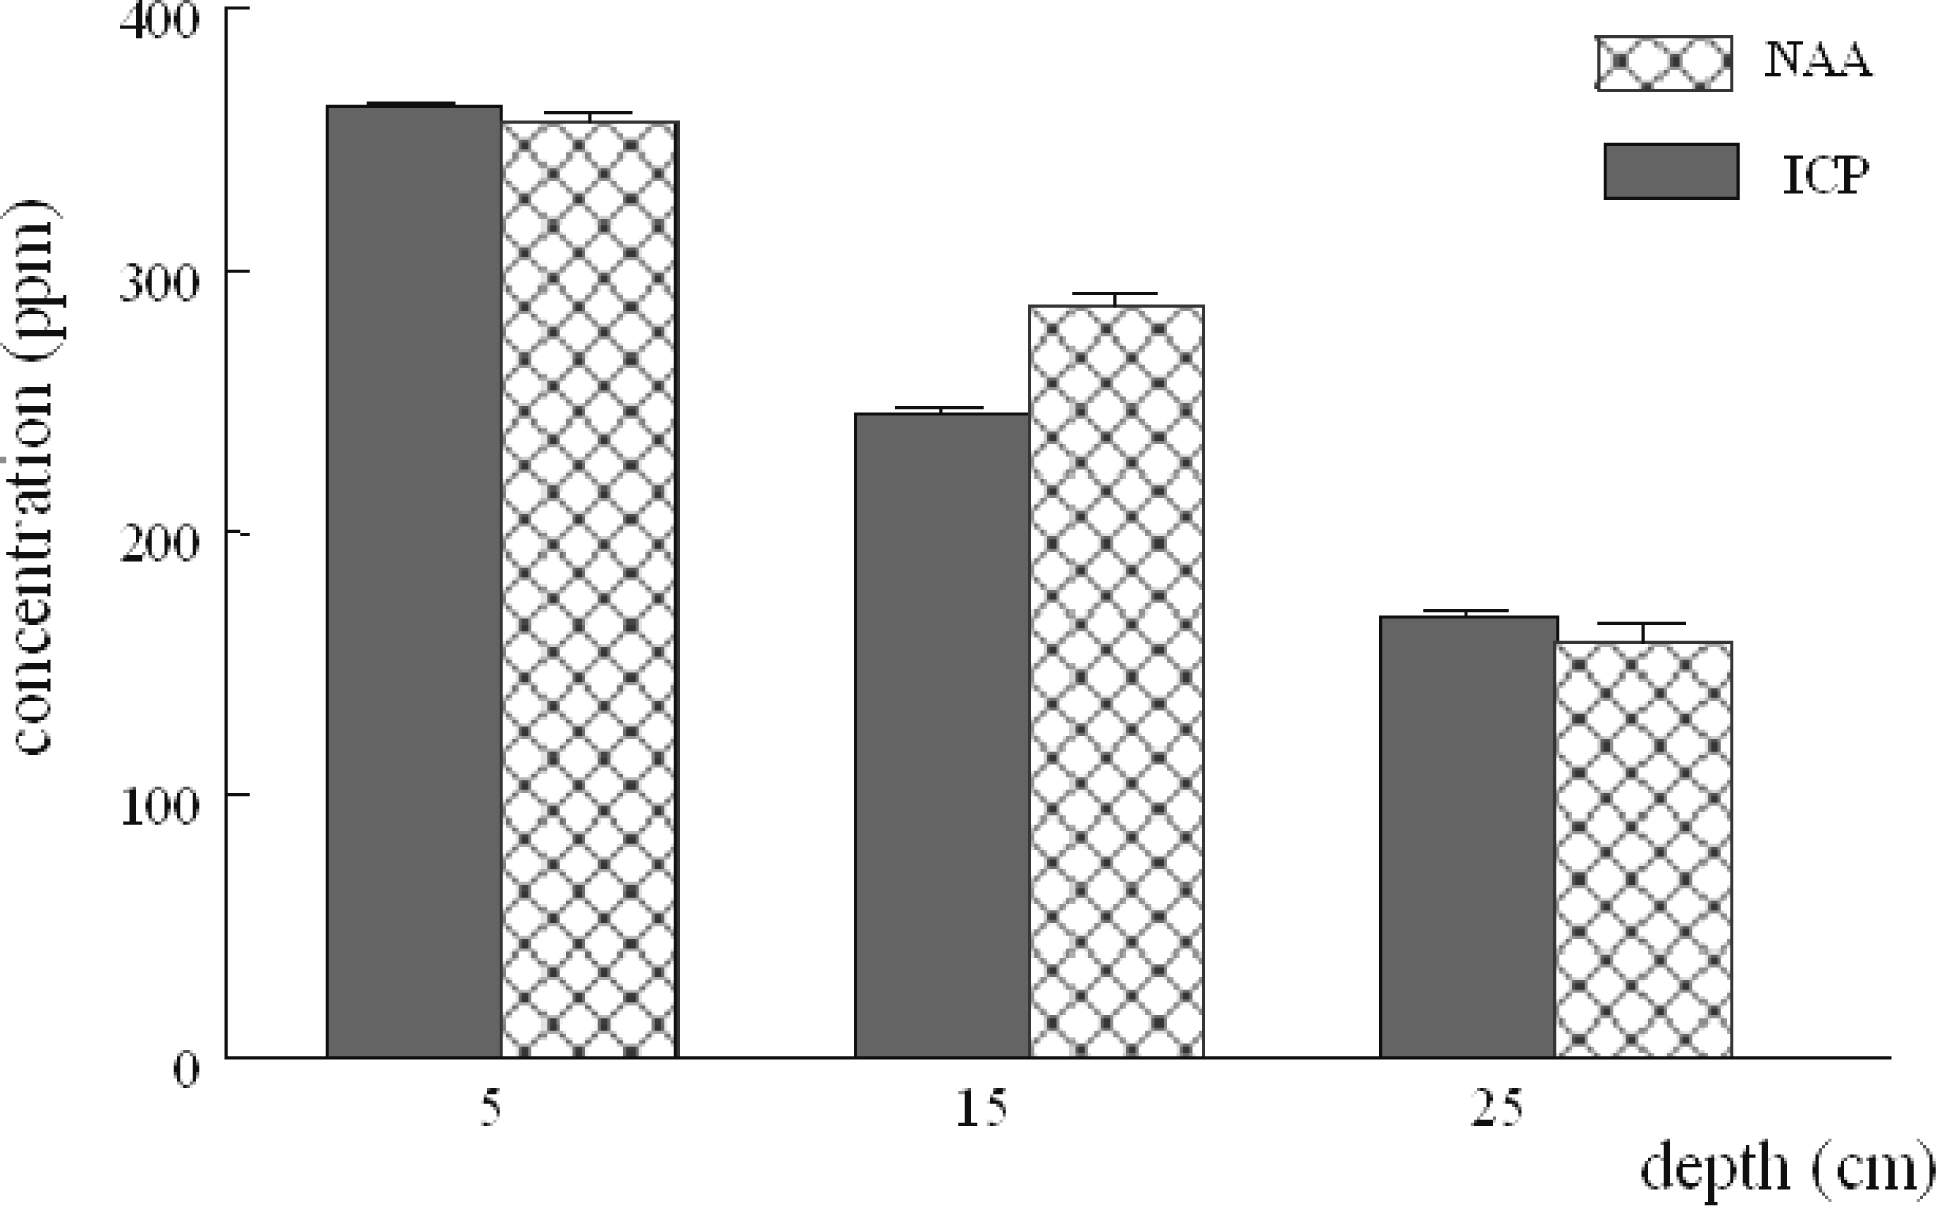
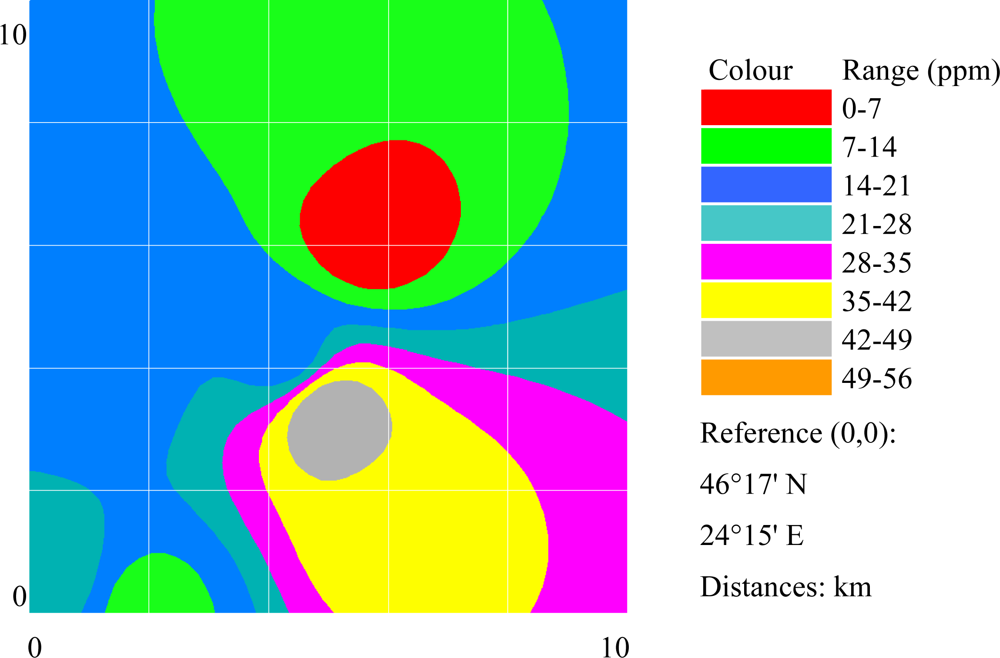
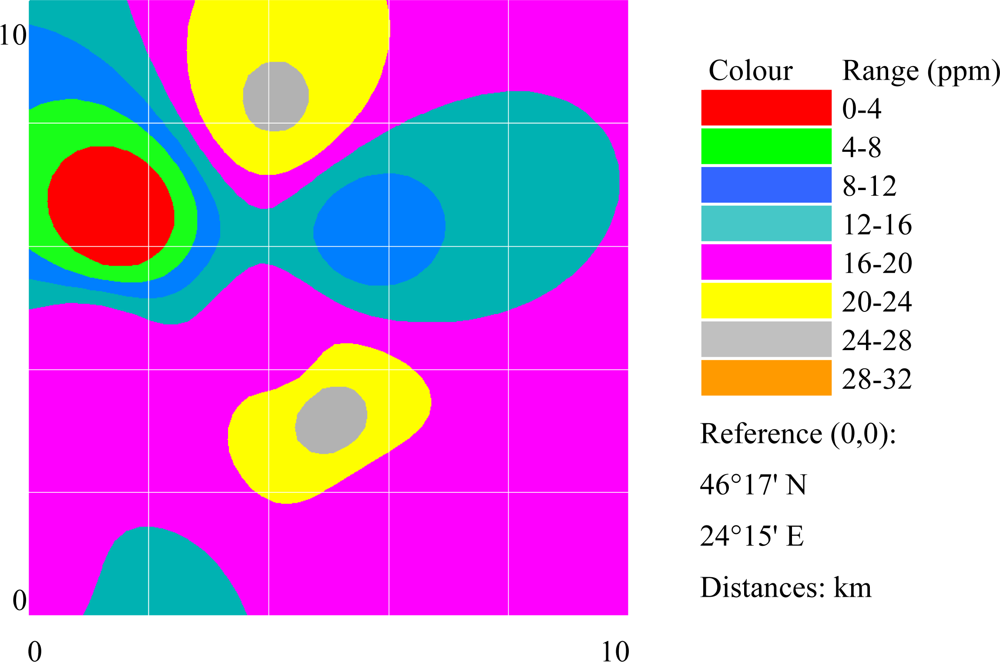
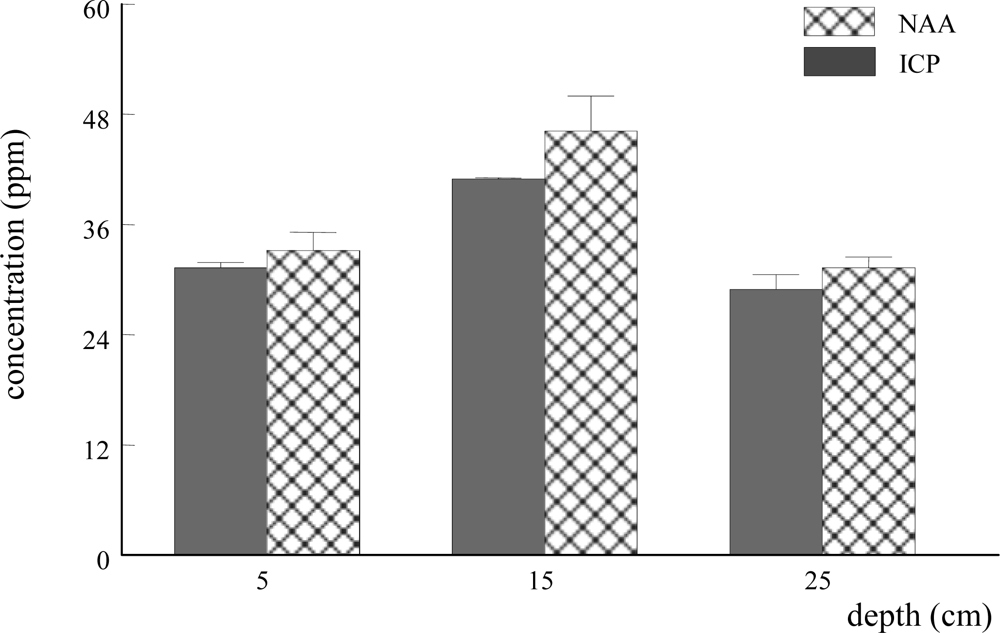
The concentration of Co at a depth of 5 and 15 cm in the soil exceeds the ALS in 1st (Figure 5) and 3rd location. The maximum value of 48.2 ppm was found at 15 cm depth in the 3rd location that is situated near the Chemical Platform. It may be noticed that the absolute error as regards the determiners through ICP varies from 0.1 to 1.6 ppm while for NAA determiners the absolute error varies from 1.2 to 2 ppm.
At 6 km east from the Chemical Platform (the 5th location), just the concentration of Cu was found to be within limits, and did not exceed the ALLS level.
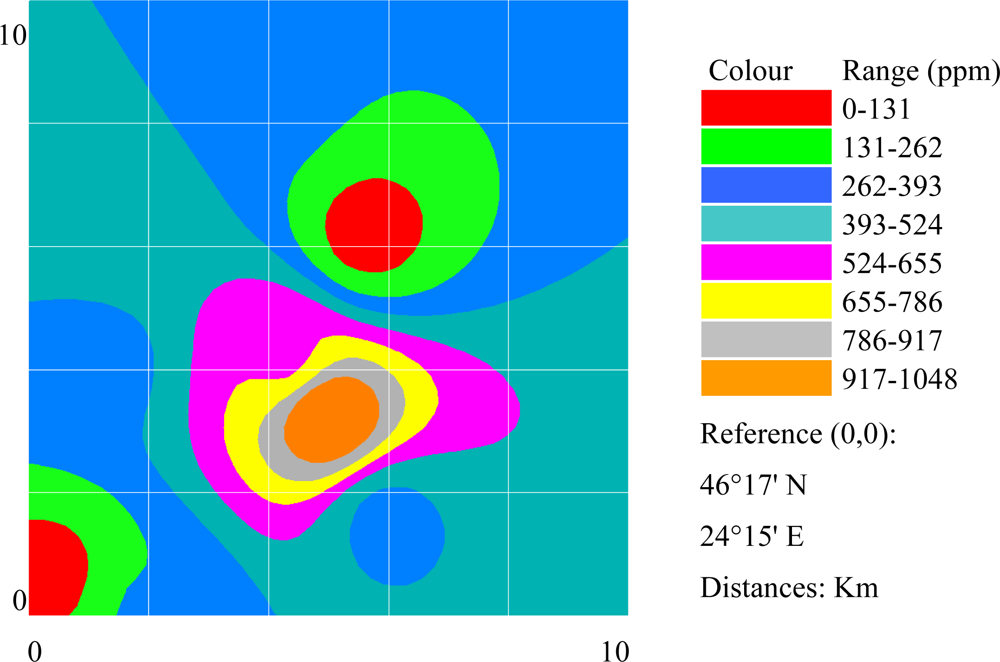
The Cr concentration exceeds eleven times the ALS (Table 3, Figure 6) while the quick silver exceeds 5 times the ALS. These exceeding were noticed in the proximity of the chemical platform and of the warehouse where waste products coming from the chemical plateau are found.
The correlation matrix applied on the experimental data showed that is was no strong correlation between any groups of elements. The highest concentration of 0.64 was obtained for the couple Cu-Hg, followed by Cr-Hg (r = 0.52, where r = Pearson correlation coefficient). For these values, according with Colton's classification of correlation coefficient [33] it can be say that there is a moderate correlation between concentrations of those metals in investigated soil.
It was identified a weak relationship between the following heavy metals couples: Co-Cr (r = 0.45), and Cr-Cu (r = 0.38). No correlation was identified on the following two couples of heavy metals: Co-Cu (r = 0.29), and Co-Hg (r = –0.05). The results obtained were in accordance with previously reported results [34,35]. The distance between the investigated location and the Chemical Platform revealed to be important element that leads to these results in investigated metals.
3.2. Copşa Mică area
In the area of Copşa Mică was not detected the presence of Co and Hg in the investigated soil samples. The concentrations of the metals measured by using the ICP method are presented in Table 4.
The analysis of the concentrations presented in Table 4 revealed that the concentration of Co slightly exceeded the ALS.
The concentration of Cr was within the normal limits.
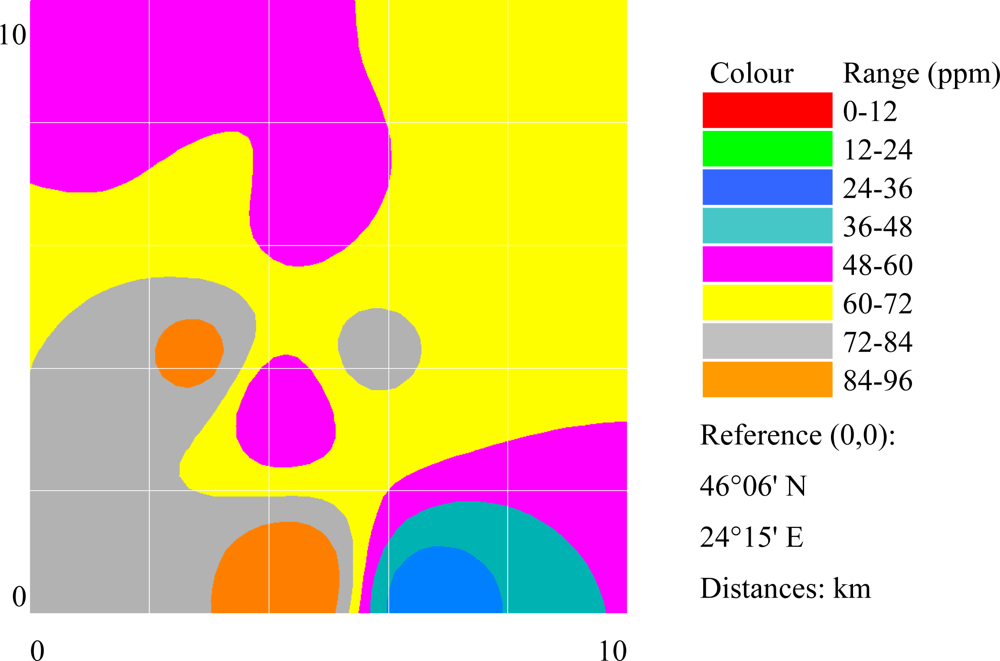
The lead concentrations revealed to exceed by 14 times the ALS. A spatial distribution of Pb in Copşa Mică area at 5 cm depth was obtained and it is presented in Figure 9.
The correlation matrix of investigate heavy metals shown that a moderate correlation existed between soil Cr and Pb concentration (r = 0.54). A weak relationship was identified for the following couple of soil heavy metals: Cu-Pd (r = 0.44) and Cr-Cu (r = 0.32).
The non-ferrous metalworking and chemical processing plants from this area proved to have a devastative effect on the environment that is still present even if the pollutant facilities were forced to close in 1993.
3.3. Zlatna
Four (Co, Cr, Cu, and Pb) out of five heavy metals were identified and their concentrations in soil at 3 depths were measured. The concentrations obtained by using the ICP method are presented in Table 5.
The graphical representations of identified heavy metal concentrations on this area are presented in Figure 10 – 13.
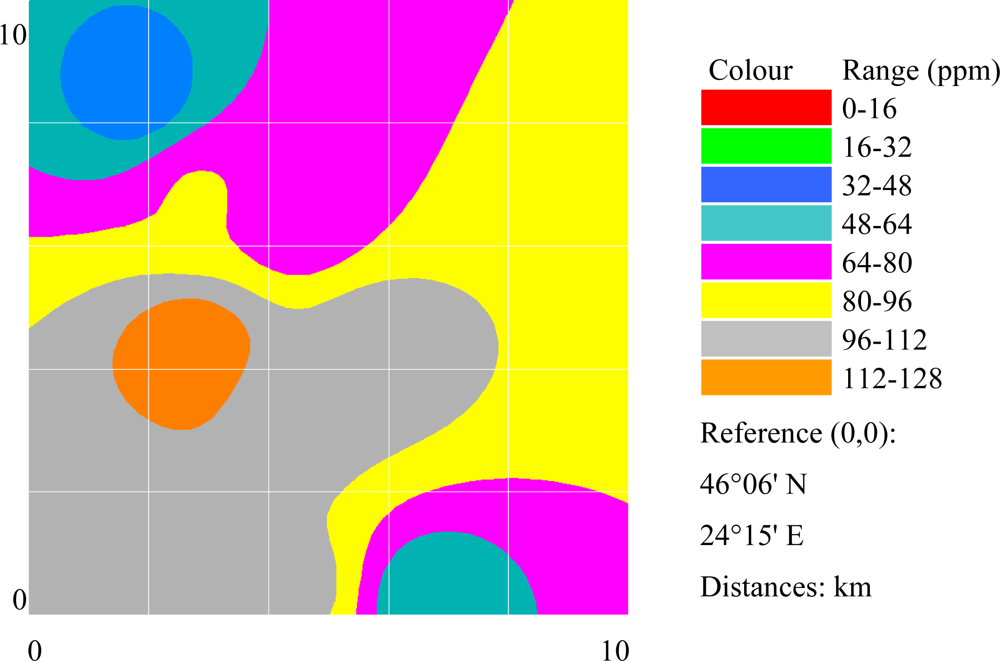
The quick silver was not detected at Zlatna area (see Table 5). Important exceeding in the concentration of Cu, Pb and Co was found in this area. Co was identified just in three out of nine locations with up to 2.6 times exceed ALS (Table 5).
The lead and copper concentrations exceed in all locations the ALS. The Pb concentrations in the soil samples exceeds up to 30 times the ALS level, while the Cu exceeds up to 40 times the ALS level (Table 5).
The correlation matrix was applied to identify and quantify the relationship between couple of investigated heavy metals. The results revealed that there exist:
- A good positive relationship between soil concentrations of Cu and Pb (r = 0.76)
- An acceptable degree of association between soil concentrations of Co and Cr (positive relationship, r = 0.35), between Cr and Cu (negative relationship, r = – 0.32), and between Cr and Pb (negative relationship, r = – 0.26)
- No relationships between the following couple of heavy metals: Co-Cu (r = 0.01), and Co-Pb (r = –0.06).
The high concentrations of heavy metals in the superior strata suggest that the polluting activity was recently stopped.
3.4. Câmpia Turzii area
Câmpia Turzii can be considered the least polluted area from the investigated zones. Three heavy metals were identified and their concentrations in soil were quantified.
The results expressed as concentrations determined by using ICP are presented in Table 6.
The graphical representations of identified heavy metal concentrations on this area are presented in Figure 14 – 16.
The lead concentration exceeded 16 times the ALS (see Table 6). Spatial distribution of maximum Pb soil concentration in Câmpia Turzii area is presented in Figure 14.
The analysis of the correlation matrix of investigated heavy metals revealed that there is a degree of association between Cu and Pb concentrations in soil (r = 0.33). It was not identified any association between concentration in soil of Cr and Pb (r = 0.08) or between Cr and Cu (0.14).
4. Concluding Remarks
The presence of Cu, Co, Pb and Hg were determined in most of the investigated areas. Some exceeding at the alert level was identified in the sensitive areas (agricultural areas). The results of the study can lead to an image of the historical pollution, determining the concentration of several elements, according to the depths in the soil.
Different correlation rapports were identified in different areas. The maximum correlation coefficient was found between Cu and Pb, in Zlatna area. A negative correlation coefficient was obtained between Hg and Co, in Târnăveni area, and between Pb and Co, Pb and Cr, and Cu and Cr, in Zlatna area. These observations may suggest a different geochemical behaviour of the studied elements in sediments and exemplify the complexity of the effects in the industrial systems [36].
The greatest excess for chromium was registered in Târnăveni, for lead in Copşa Mic and for copper in Zlatna. The concentrations of studied heavy metals in the areas near the chemical yard of BICAPA, SOMETRA, INDUSTRIA SARMEI and AMPELUM companies exceeds the intervention threshold, and sometime the area intervention threshold.
Mercury's presence was identified in some areas having concentrations that exceed 5.5 times the intervention level.
Excepting the Zlatna area, the copper concentration ranges within normal limits.
The differences registered between ICP and NAA method can be explained by the existence of several detection limits and by the problems connected to the homogeneity of solid samples.
The choice of locations for measures is very important. The measurement of the concentration in air, in running waters or of the accumulations of chemical elements in lichens, provides data on the time of measurements or in a brief period of time [37]. Unlike the method of studying the accumulations in lichens [38], the method of direct study of element concentration in soil eliminates the necessity of a reference batch and the corrections are not necessary.
The presence of heavy metals not detected in the superior strata of soils allows us to conclude that the pollution was produced a long time ago and the pollutant activities in the investigated areas were discard.
Acknowledgment
The research was partly supported by the UEFISCSU Romania through research grants.
Notes
- 1Wikipedia. [viewed: January 27, 2008]. Available from: http://en.wikipedia.org/wiki/Copsa_Mica
- 2Google Earth. ©2007 Google [viewed: January 27, 2008]. Available from: http://earth.google.com
- 3Genie – soft. © Genie-Soft Corporation 2001–2008. [viewed: January 23, 20008]. Available from: http://www.genie-soft.com/
References
- Navarro, MC; Pérez-Sirvent, C; Martínez-Sánchez, MJ; Vidal, J; Tovar, PJ; Bech, J. Abandoned mine sites as a source of contamination by heavy metals: A case study in a semi-arid zone. Journal of Geochemical Exploration 2008, 96(2–3), 183–193. [Google Scholar]
- Brumelis, G; Brown, DH; Nikodemus, O; Tjarve, D. The monitoring and risk assessment of Zn deposition around a metal smelter in Latvia. Environmental Monitoring and Assessment 1999, 58(2), 201–212. [Google Scholar]
- Vaalgamaa, S; Conley, DJ. Detecting environmental change in estuaries: Nutrient and heavy metal distributions in sediment cores in estuaries from the Gulf of Finland, Baltic Sea. Estuarine, Coastal and Shelf Science 2008, 76(1), 45–56. [Google Scholar]
- Cortes, OEJ; Barbosa, LAD; Kiperstok, A. Biological treatment of industrial liquid effluent in copper production industry. Tecbahia Revista Baiana de Tecnologia 2003, 18(1), 89–99. [Google Scholar]
- Devkota, B; Schmidt, GH. Accumulation of heavy metals in food plants and grasshoppers from the Taigetos Mountains, Greece. Agriculture, Ecosystems and Environment 2000, 78(1), 85–91. [Google Scholar]
- Baker, AJM. Accumulator and excluders: Strategies in response of plant to heavy metals. J Plant Nutr 1981, 3, 643–654. [Google Scholar]
- de Vries, W; Romkens, PF; Schutze, G. Critical soil concentrations of cadmium, lead, and mercury in view of health effects on humans and animals. Reviews of Environmental Contamination and Toxicology 2007, 191, 91–130. [Google Scholar]
- Galas-Gorchev, H. Dietary Intake of Pesticide Residues: Cadmium, Mercury and Lead. Food Add Cont 1991, 8, 793–806. [Google Scholar]
- IOCC, CAOBISCO, Heavy Metals Rapport. 1996.
- Wieting, J. Effects of air-pollutants on groundwater quality in the Federal Republic of Germany. Wasser Boden 1988, 40(4), 183–186. [Google Scholar]
- Clemente, R; Dickinson, NM; Lepp, NW. Mobility of metals and metalloids in a multi-element contaminated soil 20 years after cessation of the pollution source activity. Environmental Pollution 2008, (in press). [Google Scholar]
- Boukhalfa, C. Heavy metals in the water and sediments of Oued Es-Souk, Algeria, a river receiving acid effluents from an abandoned mine. African Journal of Aquatic Science 2007, 32(3), 245–249. [Google Scholar]
- Stimpfl, E; Aichner, M; Cassar, A; Thaler, C; Andreaus, O; Matteazzi, A. The state of fruit orchard soils in South Tyrol (Italy). Laimburg Journal 2006, 3(1), 74–134. [Google Scholar]
- Pandey, J; Pandey, U. Accumulation of heavy metals in dietary vegetables and cultivated soil horizon in organic farming system in relation to atmospheric deposition in a seasonally dry tropical region of India. Environmental Monitoring and Assessment 2008, 1–14. [Google Scholar]
- Stobrawa, K; Lorenc-Plucińska, G. Thresholds of heavy-metal toxicity in cuttings of European black poplar (Populus nigra L.) determined according to antioxidant status of fine roots and morphometrical disorders. Science of the Total Environment 2008, 390(1), 86–96. [Google Scholar]
- Lagisz, M; Laskowski, R. Evidence for between-generation effects in carabids exposed to heavy metals pollution. Ecotoxicology 2008, 17(1), 59–66. [Google Scholar]
- de Vries, W; Romkens, PF; Schutze, G. Critical soil concentrations of cadmium, lead, and mercury in view of health effects on humans and animals. Reviews of Environmental Contamination and Toxicology 2007, 191, 91–130. [Google Scholar]
- Korashy, HM; El-Kadi, AOS. Modulation of TCDD-mediated induction of cytochrome P450 1A1 by mercury, lead, and copper in human HepG2 cell line. Toxicology in Vitro 2008, 22(1), 154–158. [Google Scholar]
- Monitorul Oficial al Romaniei, No. 303 bis/ 6 XII 1997/ OM 756/1997, 1997.
- Guo, GI; Zhou, QX. Evaluation of heavy metal contamination in Phaeozem of northeast China. Environmental Geochemistry and Health 2006, 28, 331–340. [Google Scholar]
- Rogobete, Gh; Oancea, N. The general and ameliorative pedology; (in Romanian). Ed. Did. & Ped. Bucharest, Romania, 1977. [Google Scholar]
- Batjes, N.H. Methodological Framework for Assessment and Mapping of the Vulnerability of Soils to Diffuse Pollution at a Continental Level; SOVEUR Project, FAO and ISRIC, 2000.
- Gurzau, BE; Vultur, C; Stoica, A; Filimon, V; Puscas, M. Innovative intersectoral approach reduces blood lead levels of children and workers in Romania. International Journal of Occupational and Environmental Health 1999, 5, 50–56. [Google Scholar]
- Serban, R; Stefanescu, Fl; Moroianu, I. Impactul uzinei Ampellum Zlatna asupra calitatii aerului. Prezent si perspective, Mediul Inconjurator 1993, VI(1), 41–49. [Google Scholar]
- Clepan, D. Poluarea Mediului, Altip, Alba-Iulia, 1999.
- Pope, J; Farago, M; Thornton, I; Cordos, E. Metal Enrichment in Zlatna, a Romanian Copper Smelting Town. Water, Air, and Soil Pollution 2005, 162(1–4), 1–18. [Google Scholar]
- Suciu, I; Cosma, C; Todica, M. Monitoring the heavy metals concentration in the soil in the Campia Turzii area. AIP Conference Proceedings 2006, 899, 751. [Google Scholar]
- Hanns, M. Analytical chemistry today and tomorrow. Fresenius’ Journal of Analytical Chemistry 1984, 319(4), 357–363. [Google Scholar]
- American Society for Testing and Materials. Standard Test Method for Determining Elements in Waste Streams by Inductively Coupled Plasma-Atomic Emission Spectroscopy (ICP-AES) ASTM C1111–98, 1998.
- Nam, S-H; Kim, J-J. Development of analytical methods for the determination of trace elements in sediment with NAA method and ICP-MS. Proceeding of the International Symposium on Research Reactor and Neutron Science, Daejon, Korea, April 2005.
- Guide to Expressions of Uncertainty in Measurement – GUM, ISO Publishing, 1995.
- Giniotis, V; Grattan, KTV; Rybokas, M; Kulvietiene, R. Uncertainty and indeterminacy of measurement data. Measurement 2004, 36, 195–202. [Google Scholar]
- Colton, T. Statistics in Medicine; Little Brown and Company: New York, NY, 1974. [Google Scholar]
- Biji, M; Biji, E. Theoretical Statistics; (in Romanian); Ed. Did & PedBucharest, Romania, 1979. [Google Scholar]
- Razo, I; Carrizales, L; Castro, J; Díaz-Barriga, F; Monroy, M. Arsenic and heavy metal pollution of soil, water and sediments in a semi- arid climate mining area in Mexico. Water, Air, and Soil Pollution 2004, 152, 129–152. [Google Scholar]
- Duzgoren-Aydin, NS; Wong, CSC; Aydin, A; Song, Z; You, M; Li, XD. Heavy metal contamination and distribution in the urban environment of Guangzhou, SE China. Environmental Geochemistry and Health 2006, 28, 375–391. [Google Scholar]
- Asonye, CC; Okolie, NP; Okenwa, EE; Iwuanyanwu, UG. Some physico-chemical characteristics and heavy metal profiles of Nigerian rivers, streams andwaterways. African Journal of Biotechnology 2007, 6(5), 617–624. [Google Scholar]
- Culicov, OA; Frontasyeva, MV; Steinnes, E; Okina, OS; Santa, Z; Todoran, R. Atmospheric deposition of heavy metals around the lead and copper-zinc smelters in Baia Mare, Romania, studied by the moss biomonitoring technique, neutron activation analysis and flame atomic absorption spectrometry. Journal of Radioanalytical and Nuclear Chemistry 2002, 254(1), 109–115. [Google Scholar]
Figure 1.
Geographic areas included into the study.

Figure 2.
Co maximum surface levels (depth = 5..25 cm): Târnăveni area.

Figure 3.
Cr surface levels (depth = 5 cm): Târnăveni area.

Figure 4.
Cu surface levels (depth = 5 cm): Târnăveni.

Figure 5.
Co concentration in Târnăveni area (1st location): NAA vs. ICP

Figure 6.
Cr concentration in Târnăveni area (1st location): ICP vs. NAA

Figure 7.
Cu surface levels (depth = 5cm): Copşa Mică area.

Figure 8.
Cr surface levels (depth = 5 cm): Copşa Mică area.

Figure 9.
Pb surface levels (depth = 5 cm): Copşa Mică area.

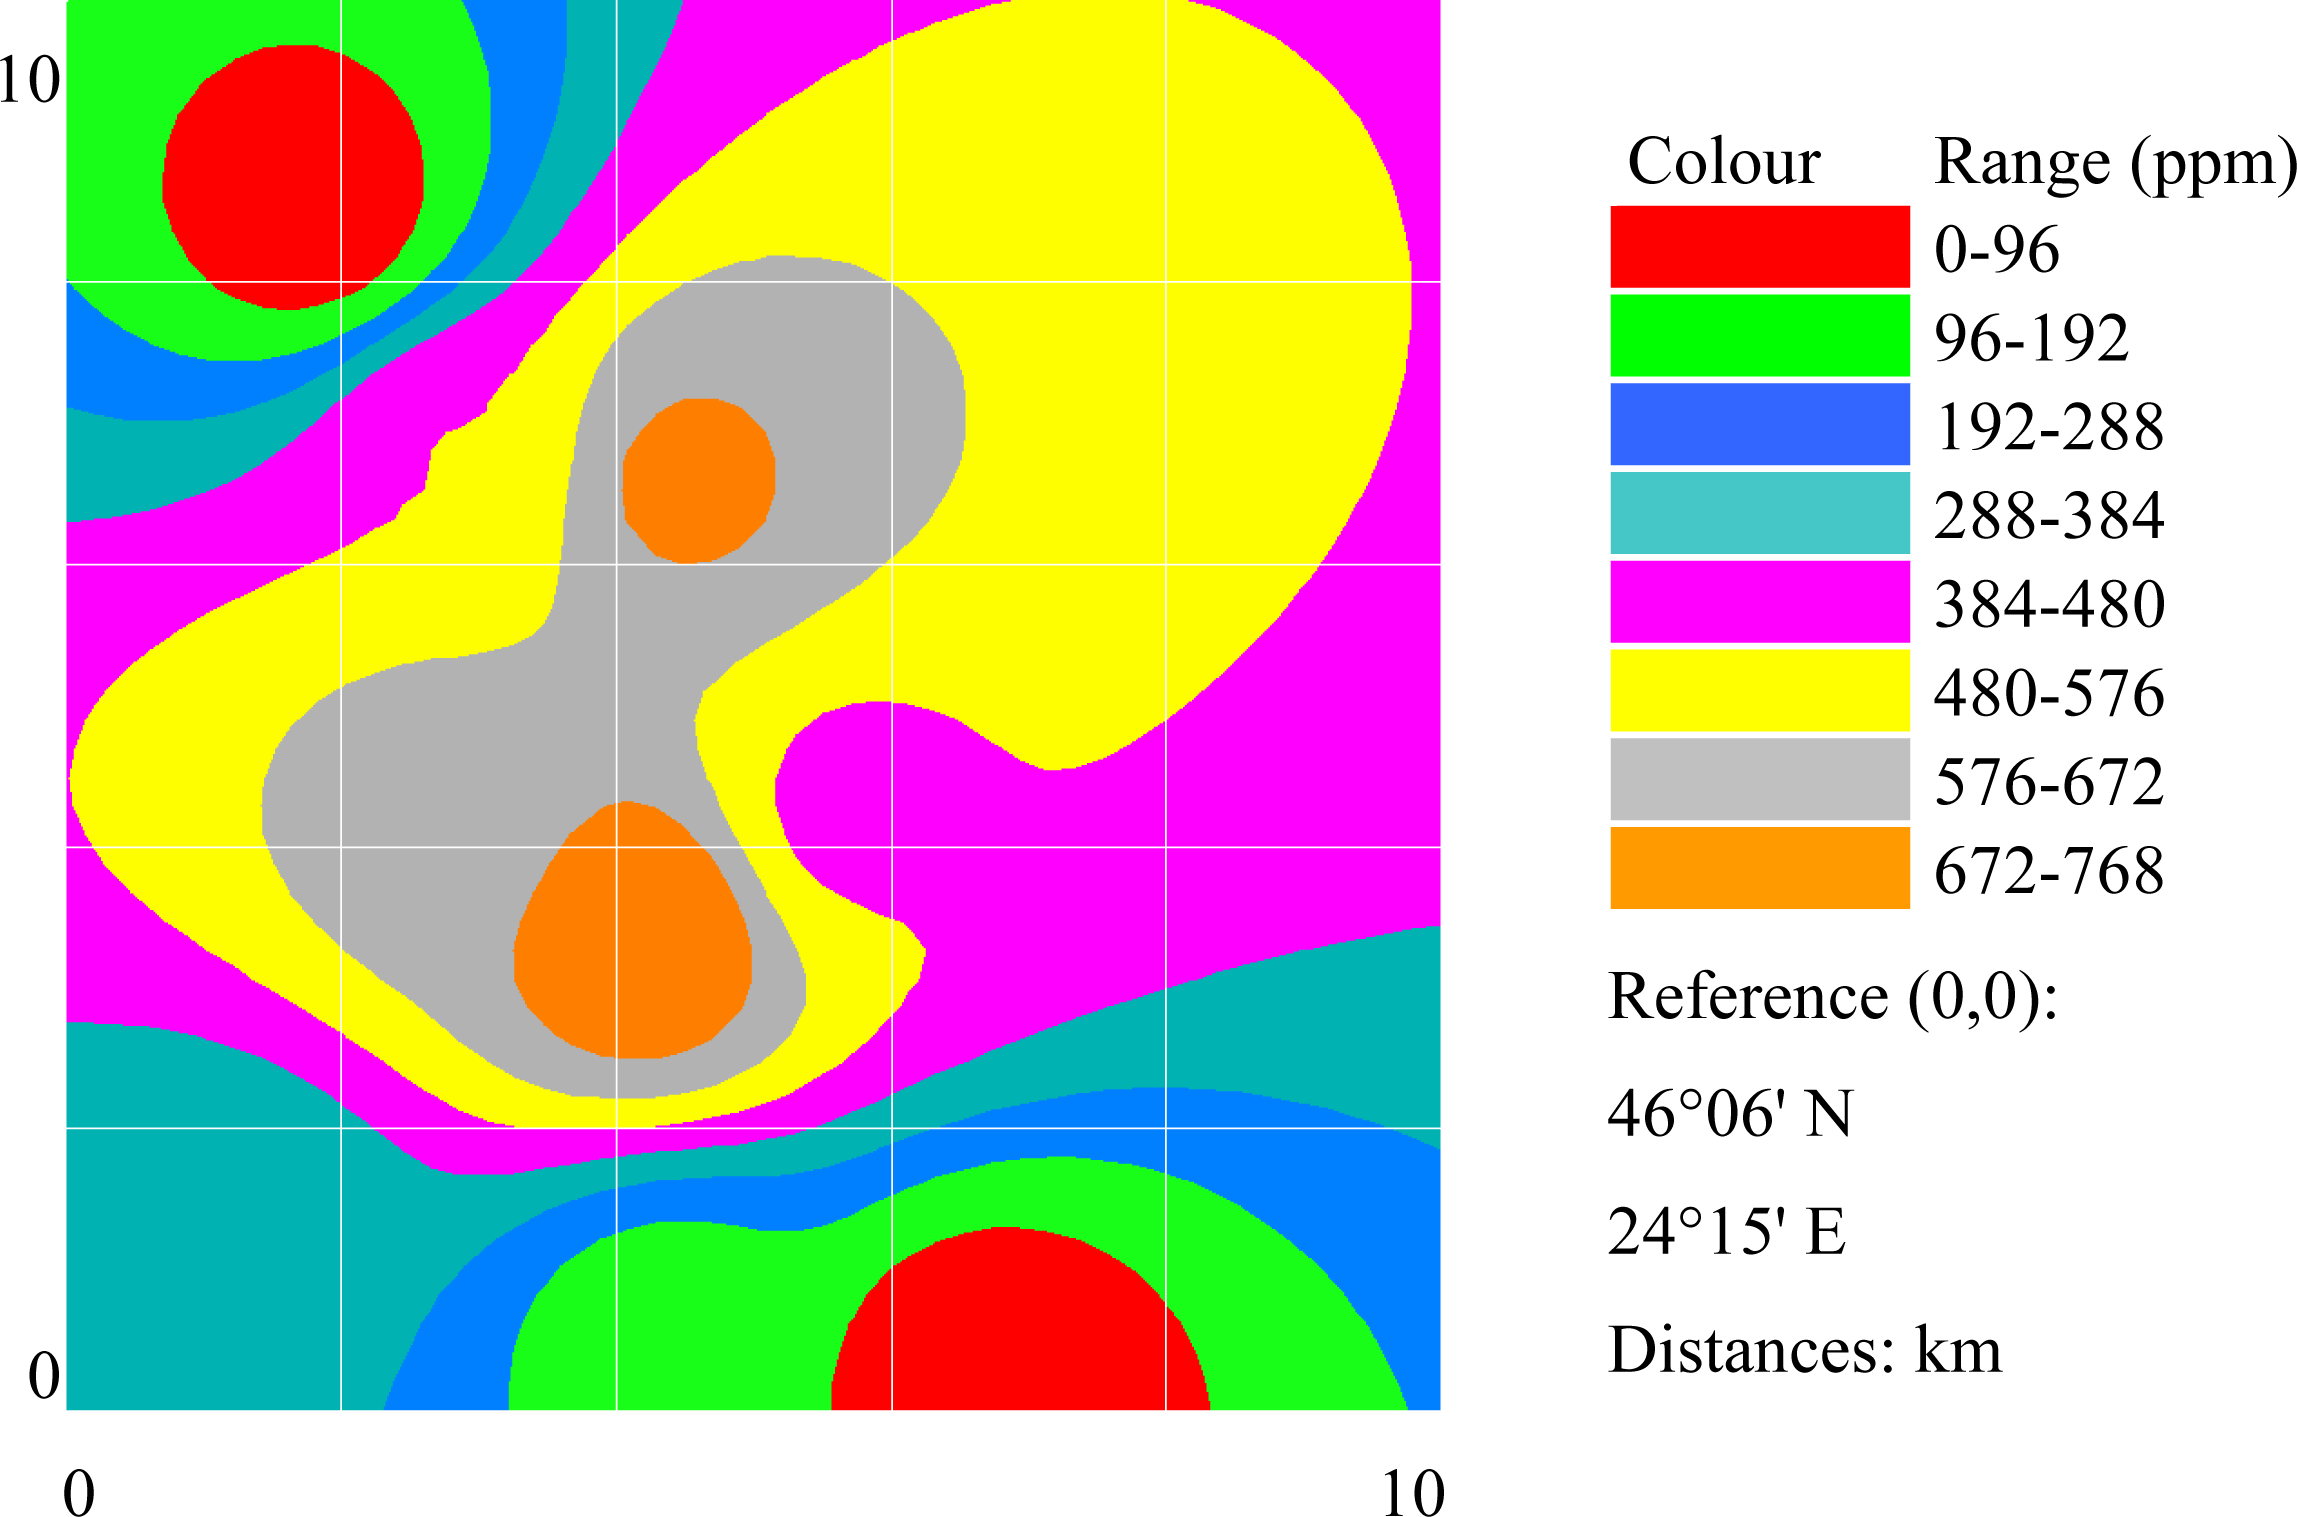
Figure 10.
Cr surface levels (depth = 5cm): Zlatna area.

Figure 11.
Cu surface levels (depth = 5 cm): Zlatna area.

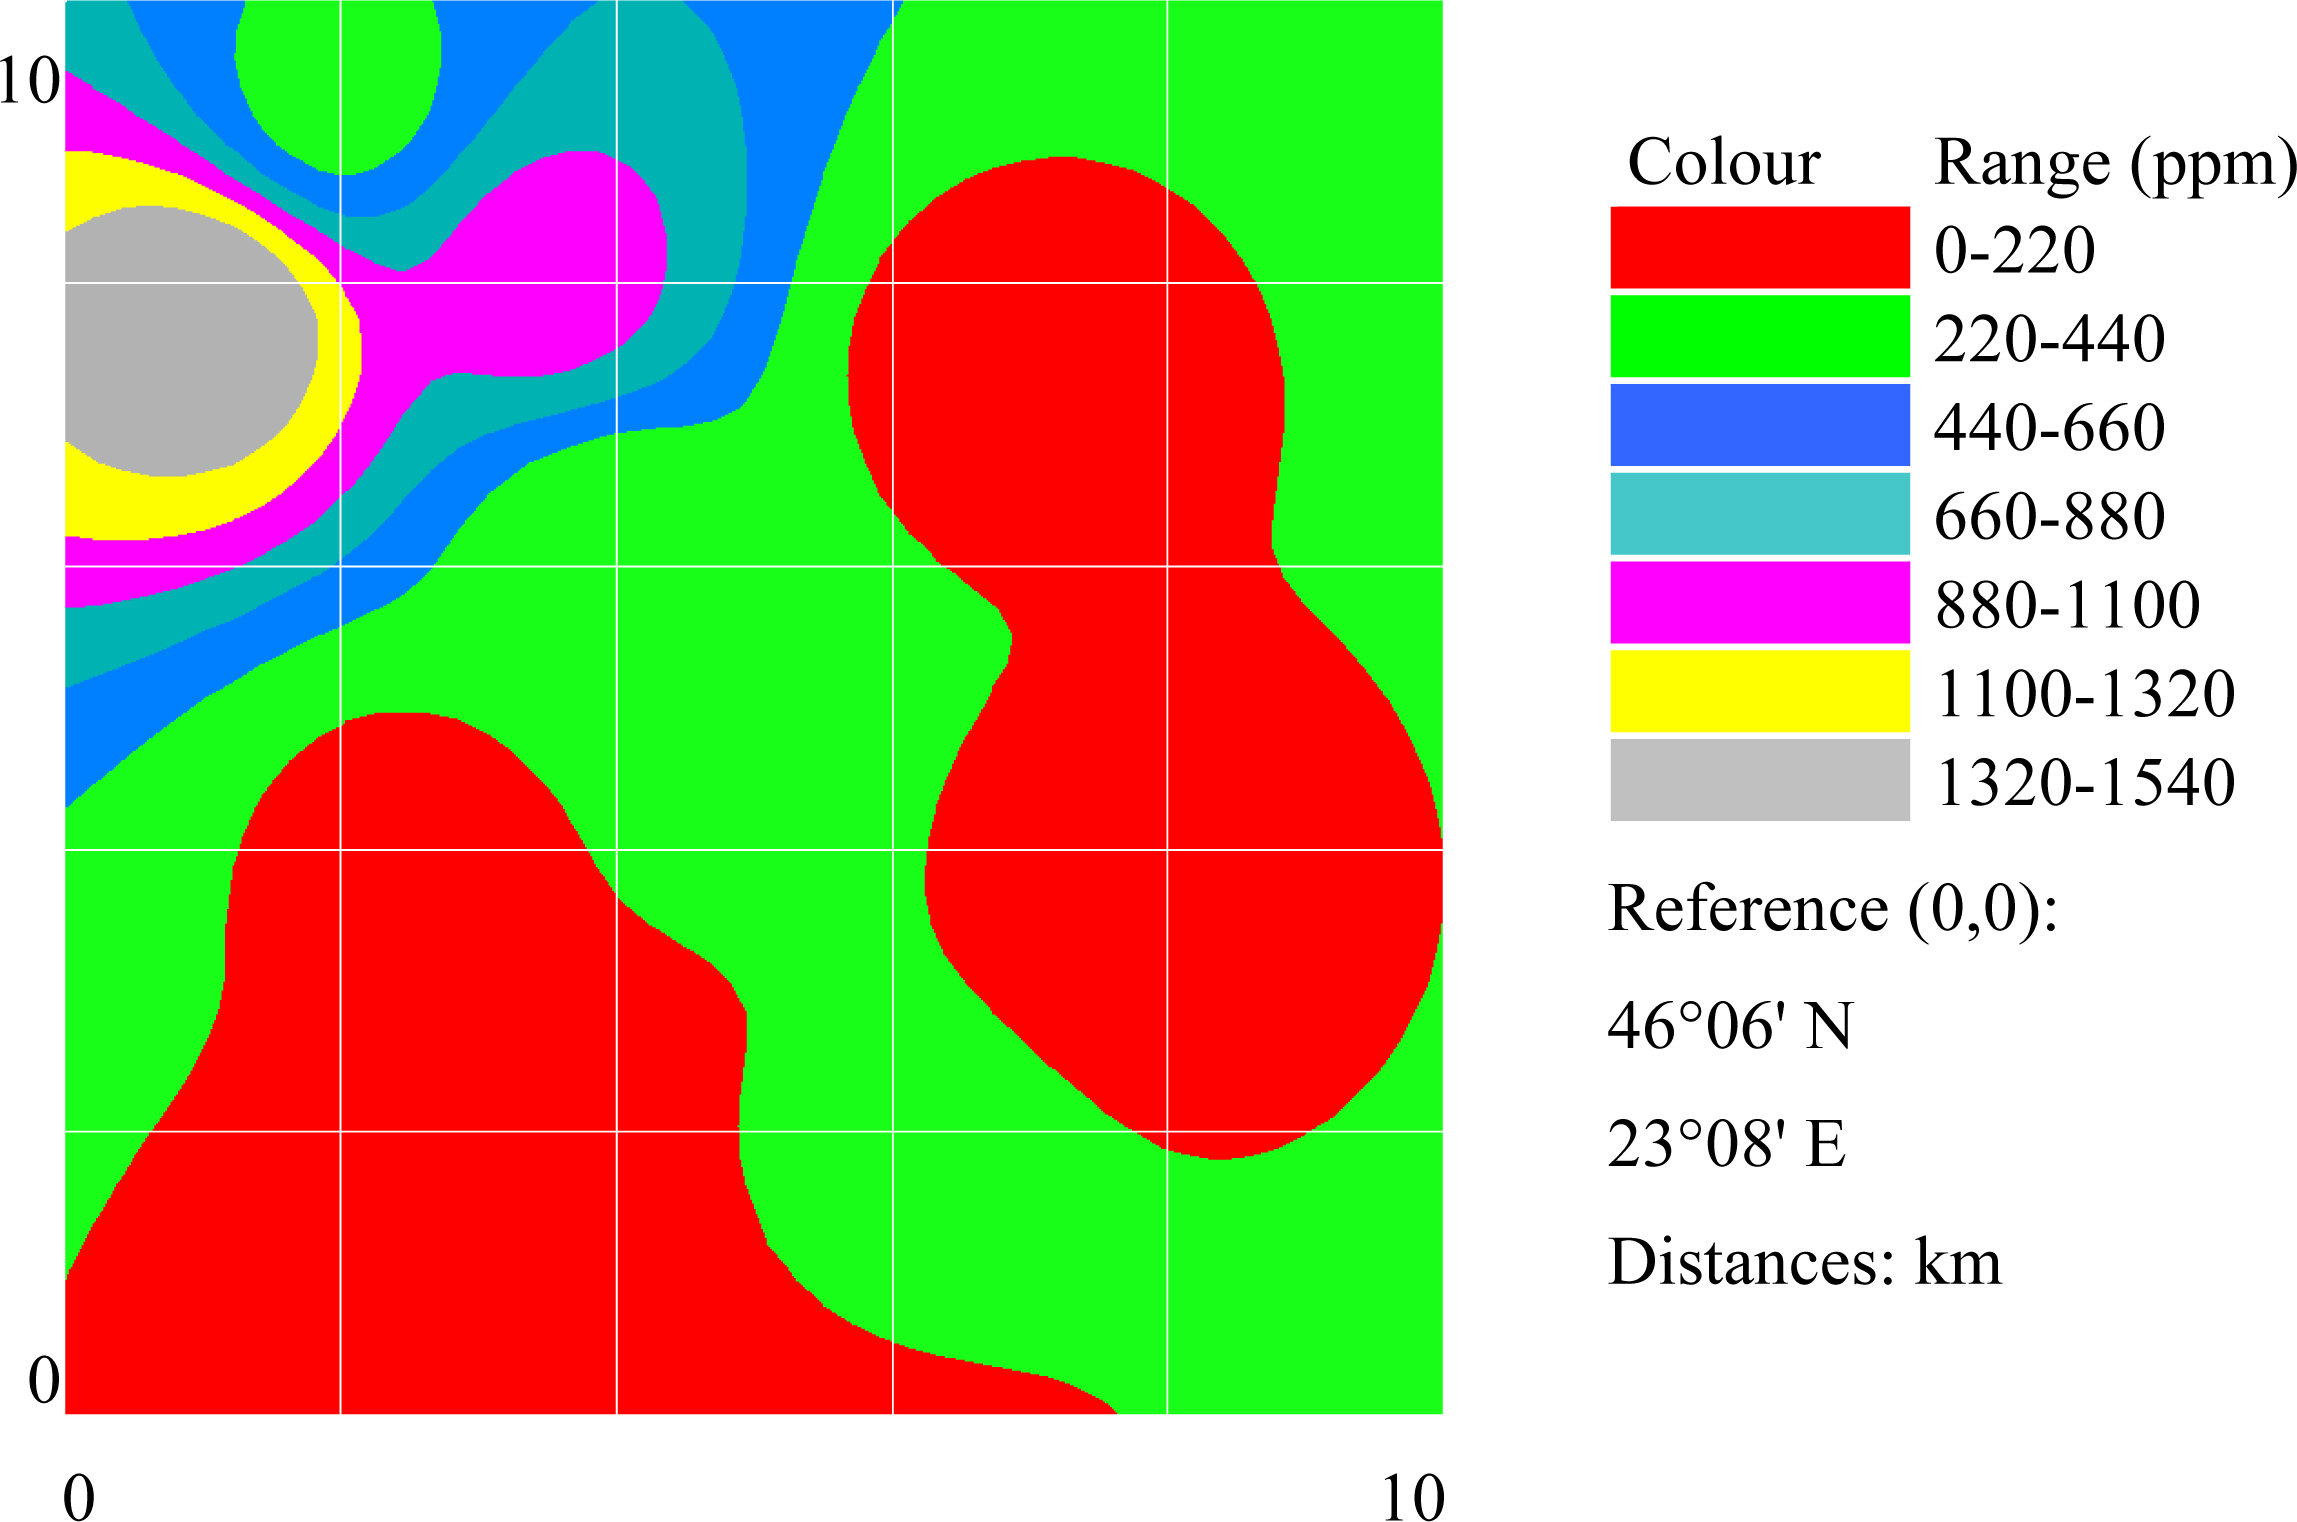
Figure 12.
Pb maximum surface levels (depth = 5..25 cm): Zlatna area.

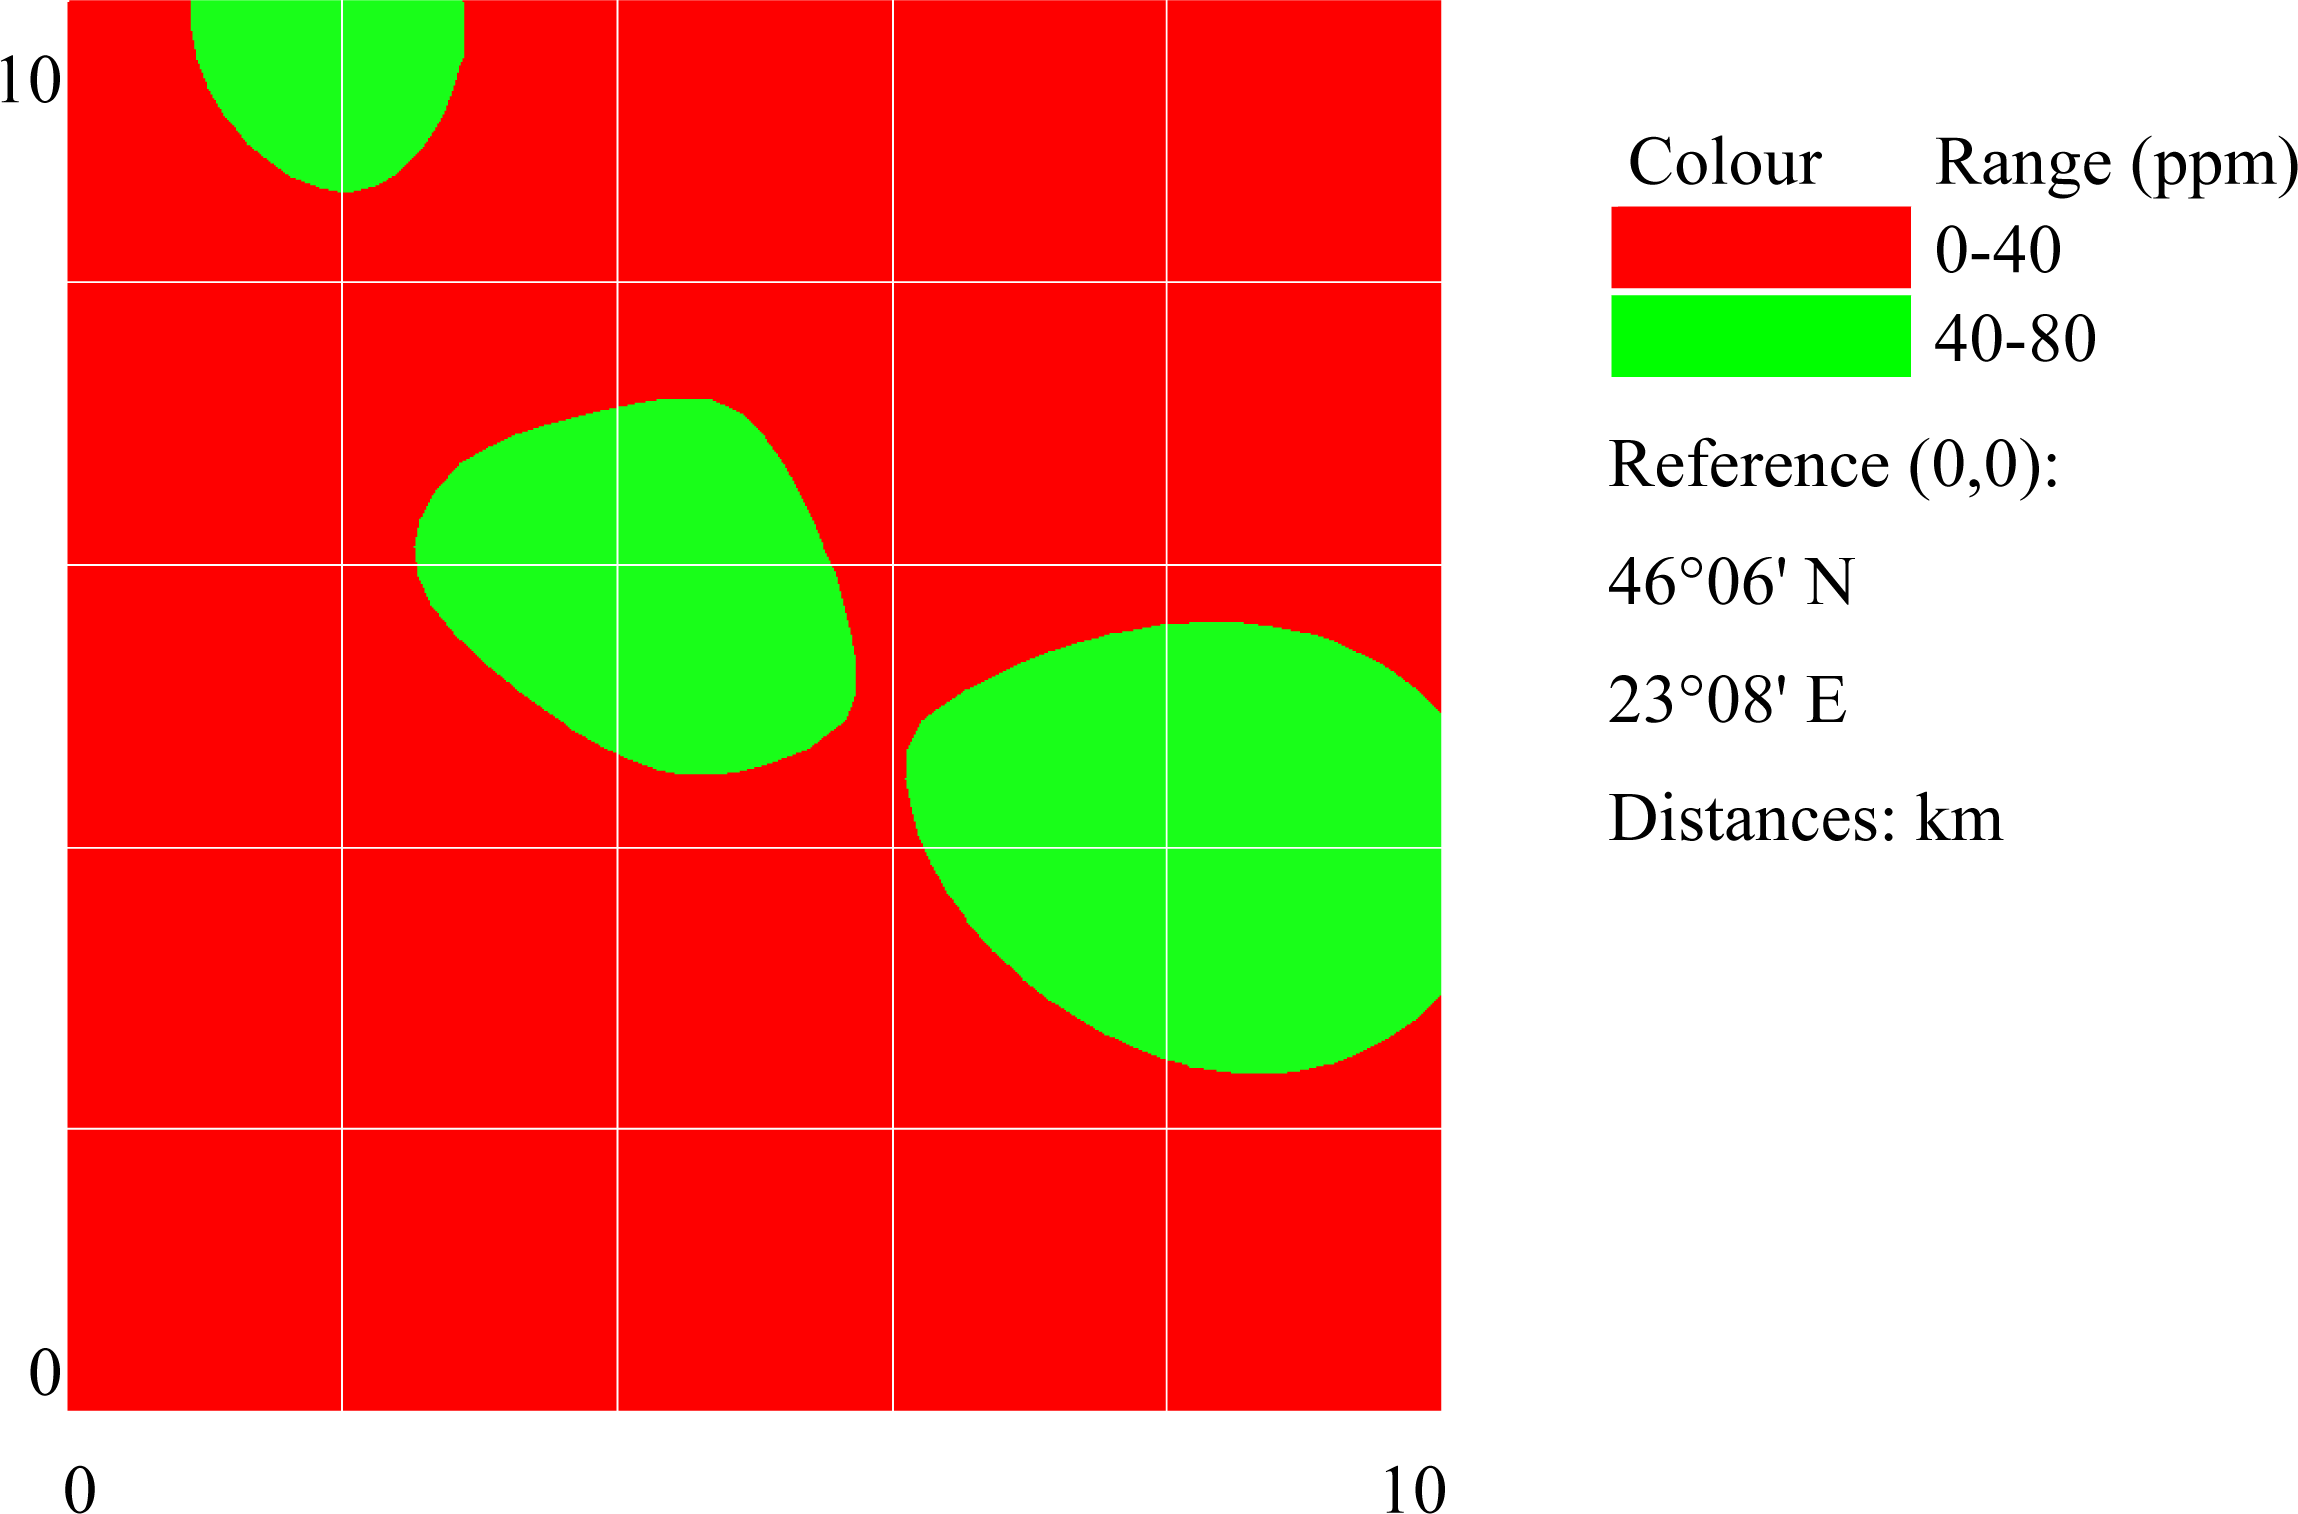
Figure 13.
Co maximum surface levels (depth = 5..25 cm): Zlatna area.

Figure 14.
Pb maximum surface levels (depth = 5..25 cm): Câmpia Turzii area.

Figure 15.
Cu surface levels (depth = 5 cm): Câmpia Turzii area.

Figure 16.
Cr surface levels (depth = 5 cm): Câmpia Turzii area.


| Zone | Location | Latitude (North) | Longitude (East) | Elevation1 | N (km) | E (km) |
|---|---|---|---|---|---|---|
| Târnăveni | 1 | 46°20′13.94″ | 24°16′13.01″ | 403 | 5.988 | 1.563 |
| Ref: | 2 | 46°19′13.09″ | 24°21′29.84″ | 332 | 4.109 | 8.345 |
| 46°17′ N | 3 | 46°19′41.91″ | 24°17′31.27″ | 281 | 4.999 | 3.238 |
| 24°15′ E | 4 | 46°20′02.78″ | 24°19′49.96″ | 287 | 5.644 | 6.207 |
| 5 | 46°17′48.50″ | 24°20′02.00″ | 326 | 1.498 | 6.465 | |
| 6 | 46°19′18.16″ | 24°18′17.72″ | 294 | 4.266 | 4.233 | |
| 7 | 46°17′34.68″ | 24°18′13.16″ | 325 | 1.071 | 4.135 | |
| 8 | 46°17′10.77″ | 24°15′29.50″ | 330 | 0.333 | 0.632 | |
| 9
| 46°18′02.94″
| 24°15′00.72″
| 322
| 1.943
| 0.015
| |
| Copşa Mică | 1 | 46°08′16.05″ | 24°17′37.87″ | 286 | 4.201 | 3.391 |
| Ref: | 2 | 46°07′32.26″ | 24°20′16.10″ | 349 | 2.849 | 6.789 |
| 46°06′ N | 3 | 46°06′38.43″ | 24°14′04.82″ | 317 | 1.187 | 1.185 |
| 24°15′ E | 4 | 46°08′22.61″ | 24°15′21.76″ | 377 | 4.403 | 0.467 |
| 5 | 46°09′34.44″ | 24°15′08.67″ | 474 | 6.621 | 0.186 | |
| 6 | 46°09′03.63″ | 24°18′18.41″ | 363 | 5.670 | 4.262 | |
| 7 | 46°08′25.32″ | 24°20′06.61″ | 327 | 4.487 | 6.586 | |
| 8 | 46°06′59.27″ | 24°21′34.77″ | 383 | 1.830 | 8.479 | |
| 9
| 46°07′30.31″
| 24°18′16.87″
| 322
| 2.788
| 4.229
| |
| Zlatna | 1 | 46°06′32.83″ | 23°14′01.57″ | 421 | 1.014 | 7.766 |
| Ref: | 2 | 46°08′08.66″ | 23°12′45.21″ | 515 | 3.973 | 6.126 |
| 46°06′ N | 3 | 46°09′03.60″ | 23°09′19.42″ | 674 | 5.669 | 1.706 |
| 23°08′ E | 4 | 46°07′53.77″ | 23°08′42.37″ | 782 | 3.513 | 0.910 |
| 5 | 46°07′03.28″ | 23°15′14.32″ | 553 | 1.954 | 9.329 | |
| 6 | 46°10′09.39″ | 23°11′09.13″ | 656 | 7.700 | 4.062 | |
| 7 | 46°09′35.07″ | 23°13′46.11″ | 882 | 6.641 | 7.434 | |
| 8 | 46°07′53.57″ | 23°14′13.97″ | 607 | 3.507 | 8.032 | |
| 9
| 46°07′19.33″
| 23°11′09.90″
| 599
| 2.449
| 4.079
| |
| Câmpia Turzii | 1 | 46°32′06.28″ | 23°54′59.37″ | 403 | 2.047 | 6.381 |
| Ref: | 2 | 46°33′00.87″ | 23°53′18.69″ | 332 | 3.732 | 4.235 |
| 46°31′ N | 3 | 46°33′16.77″ | 23°52′53.84″ | 281 | 4.223 | 3.706 |
| 23°50′ E | 4 | 46°33′15.08″ | 23°50′27.53″ | 287 | 4.171 | 0.587 |
| 5 | 46°34′13.25″ | 23°50′55.82″ | 326 | 5.967 | 1.190 | |
| 6 | 46°33′29.86″ | 23°52′18.40″ | 294 | 4.627 | 2.950 | |
| 7 | 46°33′35.13″ | 23°55′33.63″ | 325 | 4.790 | 7.112 | |
| 8 | 46°31′59.73″ | 23°50′51.47″ | 330 | 1.844 | 1.097 | |
| 9
| 46°32′21.87″
| 23°52′38.98″
| 322
| 2.528
| 3.389
|
Table 2.
Romanian guideline on the admitted concentrations of the heavy metals in soil [19].
| Element | RVS (ppm) | ALS (ppm) | RVLS (ppm) | ALLS (ppm) | AIT (ppm) |
|---|---|---|---|---|---|
| Co
| 15
| 30
| 50
| 100
| 250
|
| Cr
| 30
| 100
| 300
| 300
| 600
|
| Cu
| 20
| 100
| 200
| 250
| 500
|
| Hg
| 0.1
| 1
| 2
| 4
| 10
|
| Pb
| 20
| 50
| 100
| 250
| 1000
|
RSV = Reference value in the sensitive area
ALS = Alert level in the sensitive area
RVLS = Reference value in the less sensitive area
ALLS = Alert level in the less sensitive area
AIT = Area intervention threshold
| Location | Depth (cm) | Element Co (ppm) | Cr (ppm) | Cu (ppm) | Hg (ppm) |
|---|---|---|---|---|---|
| 1 | 5 | 31.30 | 363.00 | 16.40 | n.p. |
| 15 | 41.00 | 245.00 | 6.42 | n.p. | |
| 25
| 29.00
| 168.00
| 45.70
| 1.20
| |
| 2 | 5 | n.p. | 281.00 | 24.30 | n.p. |
| 15 | 11.40 | 122.00 | 17.00 | n.p. | |
| 25
| n.p.
| 71.00
| 51.60
| n.p.
| |
| 3 | 5 | 42.00 | 1046.00 | 24.96 | n.p. |
| 15 | 48.20 | 1080.00 | 72.80 | 5.52 | |
| 25
| 10.30
| 1012.00
| 49.90
| 0.96
| |
| 4 | 5 | n.p. | 90.00 | 10.30 | n.p. |
| 15 | 1.60 | 102.00 | 16.00 | n.p. | |
| 25
| n.p.
| 87.00
| 25.30
| n.p.
| |
| 5 | 5 | n.p. | 512.00 | 1.28 | n.p. |
| 15 | n.p. | 384.00 | 14.96 | n.p. | |
| 25
| 18.20
| 85.80
| 22.00
| n.p.
| |
| 6 | 5 | 10.30 | 632.00 | 19.20 | n.p. |
| 15 | 10.40 | 580.00 | 41.40 | n.p. | |
| 25
| 16.60
| 614.00
| 36.00
| 0.30
| |
| 7 | 5 | 11.80 | 348.00 | 19.60 | n.p. |
| 15 | 9.60 | 274.00 | 39.10 | n.p. | |
| 25
| 15.00
| 259.00
| 52.00
| n.p.
| |
| 8 | 5 | 14.80 | 98.90 | 16.70 | n.p. |
| 15 | 25.50 | 140.00 | 30.40 | n.p. | |
| 25
| n.p.
| 81.00
| 26.05
| n.p.
| |
| 9 | 5 | 11.00 | 270.00 | 14.72 | n.p. |
| 15 | 8.2. | 311.00 | 18.00 | n.p. | |
| 25
| n.p.
| 251.00
| 20.90
| n.p.
|
n.p. = not present
| Location | Depth (cm) | Element Cu (ppm) | Cr (ppm) | Pb (ppm) |
|---|---|---|---|---|
| 1 | 5 | 52.30 | 103.98 | 761.20 |
| 15 | 140.48 | 77.86 | 631.40 | |
| 25
| 149.76
| 79.40
| 598.10
| |
| 2 | 5 | 63.10 | 81.00 | 480.30 |
| 15 | 132.00 | 83.40 | 524.00 | |
| 25
| 140.60
| 74.00
| 353.11
| |
| 3 | 5 | 72.16 | 96.40 | 304.60 |
| 15 | 48.40 | 83.10 | 250.00 | |
| 25
| 56.80
| 60.00
| 89.40
| |
| 4 | 5 | 93.70 | 100.72 | 132.72 |
| 15 | 126.31 | 66.90 | 253.20 | |
| 25
| 48.70
| 79.94
| 213.60
| |
| 5 | 5 | 31.20 | 55.20 | 36.20 |
| 15 | 40.03 | 50.10 | 31.40 | |
| 25
| 29.60
| 39.40
| 28.60
| |
| 6 | 5 | 73.40 | 104.00 | 460.02 |
| 15 | 71.00 | 100.00 | 268.30 | |
| 25
| 71.70
| 87.30
| 143.61
| |
| 7 | 5 | 56.44 | 66.56 | 687.40 |
| 15 | 54.94 | 67.54 | 288.40 | |
| 25
| 32.24
| 60.76
| 104.40
| |
| 8 | 5 | 52.03 | 42.00 | 46.36 |
| 15 | 44.00 | 41.40 | 107.22 | |
| 25
| 38.10
| 45.00
| 83.72
| |
| 9 | 5 | 86.00 | 123.00 | 623.14 |
| 15 | 57.00 | 98.70 | 248.32 | |
| 25
| 78.10
| 101.20
| 123.04
|
| Location | Depth (cm) | Element Co (ppm) | Cr (ppm) | Cu (ppm) | Pb (ppm) |
|---|---|---|---|---|---|
| 1 | 5 | n.p. | 4.74 | 3954.00 | 1537.00 |
| 15 | n.p. | 35.86 | 1197.60 | 854.00 | |
| 25
| n.p.
| 35.64
| 974.80
| 1521.80
| |
| 2 | 5 | n.p. | 41.42 | 193.04 | n.p. |
| 15 | 79.30 | 49.06 | 131.38 | 8.14 | |
| 25
| n.p.
| 30.94
| 41.84
| 263.00
| |
| 3 | 5 | n.p. | 36.21 | 74.30 | n.p. |
| 15 | n.p. | 39.80 | 56.20 | n.p. | |
| 25
| n.p.
| 21.16
| 60.14
| 241.00
| |
| 4 | 5 | n.p. | 30.06 | 19.40 | n.p. |
| 15 | n.p. | 40.14 | 36.40 | n.p. | |
| 25
| n.p.
| 30.14
| 20.70
| n.p.
| |
| 5 | 5 | n.p. | 58.88 | 843.40 | n.p. |
| 15 | 49.30 | 60.22 | 914.10 | 348.00 | |
| 25
| n.p.
| 67.30
| 722.00
| 293.00
| |
| 6 | 5 | n.p. | 49.30 | 93.02 | n.p. |
| 15 | n.p. | 51.40 | 41.30 | n.p. | |
| 25
| n.p.
| 58.12
| 44.60
| 193.00
| |
| 7 | 5 | n.p. | 36.70 | 18.70 | n.p. |
| 15 | n.p. | 48.20 | 46.32 | n.p. | |
| 25
| n.p.
| 50.04
| 30.70
| 143.00
| |
| 8 | 5 | n.p. | 61.30 | 439.20 | n.p. |
| 15 | 54.30 | 67.20 | 512.10 | 983.20 | |
| 25
| 17.10
| 37.15
| 376.40
| 3.06
| |
| 9 | 5 | n.p. | 57.60 | 86.01 | n.p. |
| 15 | n.p. | 36.90 | 78.36 | n.p. | |
| 25
| n.p.
| 18.60
| 71.44
| 167.80
|
n.p. = not present
| Location | Depth (cm) | Element
| ||
|---|---|---|---|---|
| Cu (ppm) | Cr (ppm) | Pb (ppm) | ||
| 1 | 5 | 38.54 | 40.62 | n.p. |
| 15 | 52.84 | 39.18 | n.p. | |
| 25
| 48.28
| 43.72
| n.p.
| |
| 2 | 5 | 39.14 | 49.60 | n.p. |
| 15 | 41.60 | 51.20 | n.p. | |
| 25
| 53.90
| 30.00
| 868.60
| |
| 3 | 5 | 49.72 | 61.70 | n.p. |
| 15 | 49.70 | 53.28 | 735.00 | |
| 25
| 46.72
| 51.26
| 837.20
| |
| 4 | 5 | 31.60 | 29.70 | n.p. |
| 15 | 28.20 | 36.20 | n.p. | |
| 25
| 15.70
| 42.11
| 27.00
| |
| 5 | 5 | 46.19 | 36.18 | n.p. |
| 15 | 48.70 | 29.70 | n.p. | |
| 25
| 41.30
| 20.30
| n.p.
| |
| 6 | 5 | 63.20 | 48.12 | 247.00 |
| 15 | 59.14 | 40.77 | 374.60 | |
| 25
| 38.60
| 36.50
| n.p.
| |
| 7 | 5 | 42.90 | 41.20 | n.p. |
| 15 | 49.00 | 35.60 | n.p. | |
| 25
| 33.70
| 29.80
| n.p.
| |
| 8 | 5 | 36.10 | 59.30 | n.p. |
| 15 | 40.12 | 62.40 | n.p. | |
| 25
| 29.70
| 37.67
| n.p.
| |
| 9 | 5 | 56.24 | 43.28 | n.p. |
| 15 | 59.80 | 47.88 | n.p. | |
| 25
| 51.28
| 41.44
| 69.00
| |
n.p. = not present
Share and Cite
MDPI and ACS Style
Suciu, I.; Cosma, C.; Todică, M.; Bolboacă, S.D.; Jäntschi, L. Analysis of Soil Heavy Metal Pollution and Pattern in Central Transylvania. Int. J. Mol. Sci. 2008, 9, 434-453. https://doi.org/10.3390/ijms9040434
AMA Style
Suciu I, Cosma C, Todică M, Bolboacă SD, Jäntschi L. Analysis of Soil Heavy Metal Pollution and Pattern in Central Transylvania. International Journal of Molecular Sciences. 2008; 9(4):434-453. https://doi.org/10.3390/ijms9040434
Chicago/Turabian StyleSuciu, Ioan, Constantin Cosma, Mihai Todică, Sorana D. Bolboacă, and Lorentz Jäntschi. 2008. "Analysis of Soil Heavy Metal Pollution and Pattern in Central Transylvania" International Journal of Molecular Sciences 9, no. 4: 434-453. https://doi.org/10.3390/ijms9040434